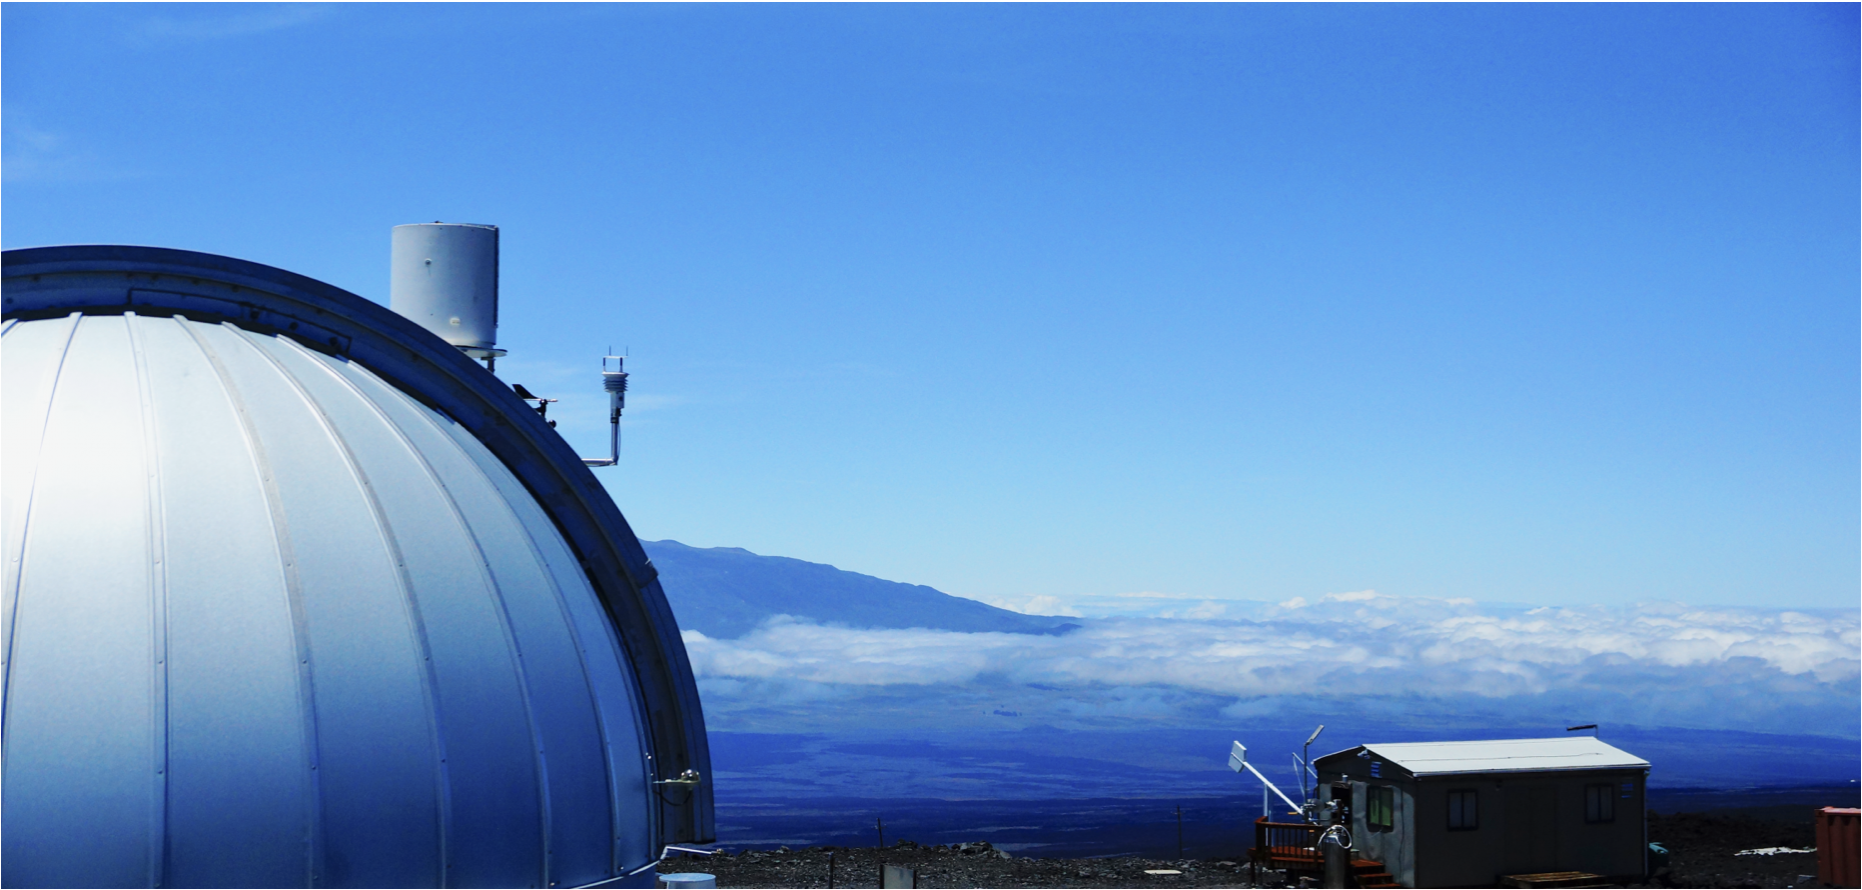
Atmospheric carbon dioxide continued its rapid rise in 2019, with the average for May peaking at 414.7 parts per million (ppm) at NOAA’s Mauna Loa Atmospheric Baseline Observatory.
NOAA’s Mauna Loa Atmospheric Baseline Observatory.
The measurement is the highest seasonal peak recorded in 61 years of observations on top of Hawaii’s largest volcano and the seventh consecutive year of steep global increases in concentrations of carbon dioxide (CO2), according to data published today by NOAA and Scripps Institution of Oceanographyoffsite link. The 2019 peak value was 3.5 ppm higher than the 411.2 ppm peak in May 2018 and marks the second-highest annual jump on record.
Monthly CO2 values at Mauna Loa first breached the 400 ppm threshold in 2014.
“It’s critically important to have these accurate, long-term measurements of CO2 in order to understand how quickly fossil fuel pollution is changing our climate,” said Pieter Tans, senior scientist with NOAA’s Global Monitoring Division. “These are measurements of the real atmosphere. They do not depend on any models, but they help us verify climate model projections, which if anything, have underestimated the rapid pace of climate change being observed.”
The concentration of CO2 in the atmosphere increases every year, and the rate of increase is accelerating. The early years at Mauna Loa saw annual increases averaging about 0.7 ppm per year, increasing to about 1.6 ppm per year in the 1980s and 1.5 ppm per year in the 1990s. The growth rate rose to 2.2 ppm per year during the last decade. There is abundant and conclusive evidence that the acceleration is caused by increased emissions, Tans said.
The Mauna Loa data, together with measurements from sampling stations around the world, are collected by NOAA’s Global Greenhouse Gas Reference Network and produce a foundational research dataset for international climate science.
CO2 and the Keeling Curve
The highest monthly mean CO2 value of the year occurs in May, just before plants start to remove large amounts of the greenhouse gas from the atmosphere during the northern hemisphere growing season. In the northern fall, winter and early spring, plants and soils give off CO2, which cause levels to rise through May.
Charles Keeling was the first to observe this seasonal rise and subsequent fall in CO2 levels embedded within annual increases, a cycle now known as the Keeling Curve.
Click on a thumbnail graphic to view a gallery of drought data from the US Drought Monitor.
US Drought Monitor June 4, 2019.
West Drought Monitor June 4, 2019.
Colorado Drought Monitor June 4, 2019.
Click here to go to the US Drought Monitor website. Here’s an excerpt:
This Week’s Drought Summary
This U.S. Drought Monitor week saw further deterioration in drought-related conditions across portions of the Southeast and lower Mid-Atlantic where persistent hot and dry weather stressed dryland crops, depleted soil moisture, and reduced streamflow activity. Some relief may be on the way during the next week, however, as heavy rains are expected to impact the region. In the South, beneficial rains helped alleviate small areas of drought in the Trans Pecos region of Texas while areas of Abnormally Dry (D0) were introduced on the map across Tennessee in response to short-term dryness and hot temperatures. In the Midwest, severe weather outbreaks and areas experiencing flooding continued to impact parts of the region. According to NOAA’s National Center for Environmental Information (NCEI), several states in the Midwest including Iowa and Minnesota experienced their wettest 12-month period (May 2018–April 2019) on record. In the High Plains, dry conditions during the past month led to introduction of areas of moderate drought in north-central North Dakota. Out West, drought conditions intensified in western Washington where streamflow conditions are well below normal levels after a shallow snowpack this past winter…
High Plains
On this week’s map, an area of Moderate Drought (D1) was introduced in north-central North Dakota in response to short-term precipitation deficits (30-90 days), dry topsoils, reports of stress to pastures, and low stock pond levels. According to the USDA, South Dakota topsoil was 52% in surplus with many areas experiencing flooded fields. For the week, northern portions of the region, including the Dakotas, experienced above normal temperatures with the largest positive anomalies ranging from 2-to-8 degrees above normal while southern portions of the region were a few degrees below normal. Overall, most of the region was dry during the past week with the exception of some isolated showers in Nebraska and eastern Wyoming…
West
On this week’s map, continued warm and dry conditions in the Pacific Northwest led to the introduction of Severe Drought (D2) in areas of western Washington including the Olympic Mountains where Water-Year-to-Date (since October 1st) precipitation at several NRCS SNOTEL stations has been well below normal ranging from the 14th to the 30th percentile. According to the USGS, the 7-day streamflow levels in rivers and creeks across western Washington and northwestern Oregon are flowing well below normal levels. In the Willamette Valley and coastal mountains of Oregon, areas of Abnormally Dry (D0) were added in response to the low streamflow levels and below normal precipitation during the past 30 days. In southwestern Montana, short-term dryness (past 30 days) led to the introduction of an area of Abnormally Dry (D0). In southeastern California and southwestern Arizona, areas of Abnormally Dry (D0) were removed as conditions have improved during the past year with precipitation in western Imperial County, California falling in the top 10% of percentile rankings. During the past week, average temperatures were well above normal across the Pacific Northwest, northern California, and the northern Rockies while the southern half of the region experienced below normal temperatures. Some isolated showers and thunderstorms were observed across the central Sierra, Great Basin, and eastern portions of Colorado and New Mexico…
South
Minor improvements were made on the map in small areas of Moderate Drought (D1) and Abnormally Dry (D0) in the Trans Pecos region of Texas where 1-to-4 inches of rain fell this week. In south Texas, short-term precipitation deficits during the past 30-day period led to the expansion of areas of Abnormally Dry (D0). In northeastern Mississippi and Tennessee, short-term precipitation deficits during the past 30 days and below-normal streamflow levels led to the expansion of areas of Abnormally Dry (D0). Conversely, Oklahoma has experienced a very wet period during the past 30 days with northern portions of the state recording rainfall accumulations of 6-to-12 inches above normal levels. According to the June 3rd USDA Oklahoma Crop Weather report, pasture and range conditions were rated 88% good to fair and livestock condition was rated 92% good to fair. For the week, average temperatures were above normal across most of the region with the largest positive temperature anomalies observed in northern Mississippi and Tennessee where temperatures were 4-to-8 degrees above normal with maximum temperatures reaching the low to mid 90s. Conversely, average temperature were 2-to-6 degrees below normal across the western half of Texas. Some light-to-moderate rainfall accumulations (2-to-4 inches) were observed this week in northern Texas, southwestern Louisiana, and northern Arkansas…
Looking Ahead
The NWS WPC 7-Day Quantitative Precipitation Forecast (QPF) calls for moderate-to-heavy accumulations ranging from 2-to-7 inches across much of the South and Southeast. Further north, lesser accumulations (<2 inches) are forecasted for eastern Colorado and New Mexico, the southern Plains, Midwest, Northeast, and Mid-Atlantic. Out West, dry conditions are expected to prevail across the Great Basin and Desert Southwest while some lesser accumulations (<1 inch) are forecasted for the northern Rockies of Idaho and Montana as well as western Washington. The CPC 6–10-day outlook calls for a high probability of above-normal temperatures across the West with the exception of Colorado, New Mexico, and Wyoming where temperatures are expected to be below normal. Likewise, the eastern two-thirds of the continental U.S. is forecasted to be below normal with the exception of the Gulf Coast region and Florida. In terms of precipitation, there is a high probability of above-normal amounts in areas east of the Mississippi River as well as in Texas and eastern portions of the Desert Southwest while dry conditions are expected in the Pacific Northwest and northern Plains. In Alaska, above-normal temperatures are expected with above-normal precipitation in the southeast, southwest, and coastal areas of south-central.
Click on a thumbnail graphic below to view a gallery of early June drought monitor maps.
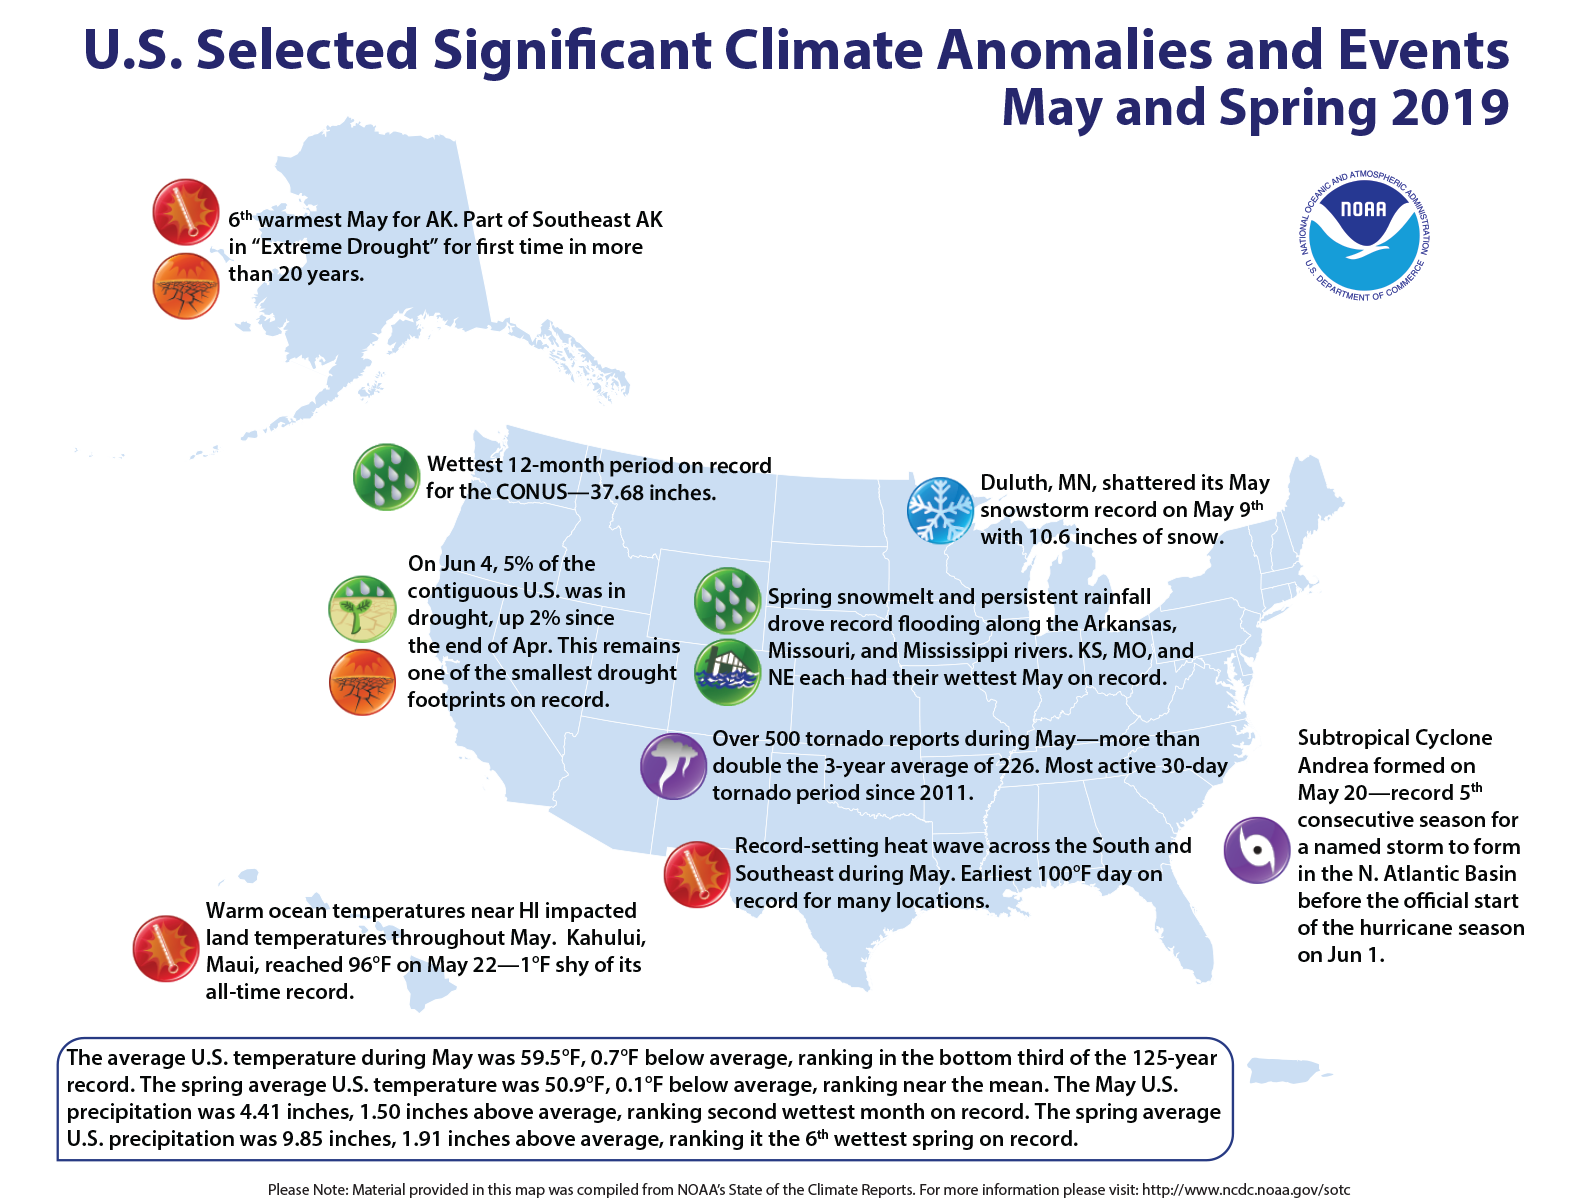
Drenching rains and historic flooding last month ended with May 2019 as the second-wettest month in the U.S. that contributed to a record-wet, 12-month period.
Exceptionally stormy conditions brought more than 500 tornado reports in May — more than double the three-year average of 226.
Here are more highlights from NOAA’s latest climate report:
Climate by the numbers
May 2019
The average May temperature across the contiguous U.S. was 59.5 degrees F (0.70 degrees below the 20th-century average), which ranked in the bottom third of the 125-year record.
The average precipitation for May was 4.41 inches, 1.50 inches above average and ranked second wettest in the 125-year record. The wettest month on record remains May 2015, with 4.44 inches, according to scientists at NOAA’s National Centers for Environmental Information.
Soggy conditions from June 2018 through May 2019 led to the wettest 12-month period on record in the U.S., with 37.68 inches, 7.73 inch above average.
Year to date and Meteorological Spring
The average U.S. temperature for the year to date (January through May) was 43.4 degrees F (0.10 of a degree above the 20th-century average), which falls in the middle third of the year-to-date record.
The average temperature for the contiguous U.S. during Meteorological Spring (March through May) was 50.9 degrees F (0.10 of a degree below average), which also ranked in the middle third of the record.
An annotated map of the United States showing notable climate events that occurred across the country during May 2019. For more, see the bulleted list below and the report summary online at http://bit.ly/USClimate201905.
Other notable stats
Tornado troubles: May 2019 was the most active 30-day tornado period in the U.S. since 2011; more than 500 were reported.
Early action in the tropics: Subtropical Cyclone Andrea formed on May 20, making 2019 the fifth-consecutive year where a named storm developed in the North Atlantic Basin before the official start of the hurricane season on June 1.
Snow still fell: Duluth, Minnesota, had 10.6 inches of snow on May 9, breaking the city’s snowstorm record for May. Denver, Colorado, had its snowiest May in 44 years and tallied 3.9 inches.
Arizona Department of Water Resources Director Tom Buschatzke will participate Thursday in a panel discussion on “Charting a Better Course for the Colorado River” at the annual Getches-Wilkinson Center Summer Conference in Boulder, Colo. Buschatzke’s panel discussion will delve into expectations for the new management guidelines on the Colorado River system, including the new Drought […]
FromThe Grand Junction Daily Sentinel (Dennis Webb):
Aldis Strautins, hydrologist for the National Weather Service in Grand Junction, said so far snow has been melting off in a manageable fashion, with some minor flooding in lowland locations but nothing serious so far.
“We’re not totally out of the woods yet. It bears monitoring and keeping aware of the situation,” he said.
He said the Colorado River is coming up and may peak locally around Sunday. Andy Martsolf, emergency services director for the Mesa County Sheriff’s Office, said flows on the Colorado River at the state line are expected to peak at about 36,000 cubic feet per second this weekend. That’s up considerably from the 24,900 cfs being reported there by the U.S. Geological Survey Wednesday.
Officials expect a possible second peak later this month.
The Gunnison River already is cranking, but that’s by design, under the operational protocol for the Aspinall Unit dams on the river. Erik Knight, a hydrologist with the Bureau of Reclamation, said releases began on Saturday in an attempt to hit a target goal of flows of 14,350 cfs for 10 days on the lower Gunnison at Whitewater, to help critical habitat for endangered fish in that stretch.
He said it appears flows will fall 1,000 cfs short of that goal.
The National Weather Service has issued a flood advisory in the lower Gunnison River due to the extra water releases affecting river levels there. Strautins said it wasn’t a flood warning, but an effort to make people aware of dangers such as banks giving way due to the high water.
Knight said it doesn’t appear that flows through Delta will exceed 13,000 cfs during the 10-day release. That’s below the level at which the Bureau of Reclamation would cut back releases during the 10-day period to protect the community from flooding.
Wilma Erven, Delta’s parks, recreation and golf director, said some water is showing up in a park at the confluence of the Gunnison and Uncompahgre rivers, something that can occur in years like this one…
Strautins pointed to a mix of warmer and cooler weather in the forecast in coming days as opposed to a prolonged hot stretch that could drive water levels particularly high, with cloud cover also expected to moderate melting of snow.
Knight, who several months ago could hardly have imagined Blue Mesa Reservoir filling this year after last year’s low snowpack and drought, said it now appears almost certain to fill…
…the snowpack levels remaining in areas such as southwest Colorado are impressive, as evidenced by the mere fact that many sites that normally are dry by now still have snow.
According to one of the data sets [Brian] Domonkos uses, current snowpack levels in those combined basins and in the Gunnison basin are the second-highest on record, he said. But peak levels this year in basins in western Colorado don’t compare nearly as well to other high snowpack years, with the southwest Colorado basins ranking perhaps fourth or fifth, and other basins not coming in that high, Domonkos said.
He said one of his statistical tools indicates there are about 12.3 inches of snow water equivalent left in the Gunnison basin, which peaked at 24 inches.
“So we’re halfway through the melt of that peak snowpack,” he said.
The Colorado basin has about 11 inches of snow water equivalent left, after peaking at about 20 inches, Domonkos said.
He said snowpack normally melts at a rate of an inch a day or a little less of snow water equivalent.
“So snowpack on average probably won’t be hanging around too much longer,” he said.
While more than half of the Colorado basin’s snowpack already is melted, that snowpack was above-average, and Martsolf said the remaining snowpack is still about 71 percent of an average peak snowpack for the basin.
“We’re definitely melted off from where we would be for a seasonal peak but we still have a ways to go,” he said…
Nowhere in western Colorado is the combined threat of rising rivers and avalanche debris causing more concern than in Hinsdale County. Federal, state and county funding is paying the nearly $1 million cost for the ongoing, emergency removal of the historic, defunct Hidden Treasure Dam. While it no longer holds water, there’s concern that avalanche debris washing down Henson Creek combined with high water flows could destroy it, releasing water and debris and causing downstream flooding…
Both Henson and the Lake Fork of the Gunnison creeks pose threats to Lake City. Lyon said there’s currently no flooding occurring, but creek levels have come up considerably in recent days. Warming temperatures and possible rainstorms both could influence what ultimately occurs in coming days and weeks.
Last month was the snowiest May in Aspen since 1999, with 20 more inches added to the already substantial snowpack. Meanwhile, forecasters are predicting a wet June.
Total snowfall for May was four times the average, according to city of Aspen water department figures. It follows the second snowiest March ever recorded — and the records go back to the winter of 1934-35. Only 6 inches fell in April, but with May’s snowfall, the water department has recorded 210 inches thus far, well above the winter average of 155 inches.
The water department also tallied 3.8 inches of rain for the month, which is double the average. One factor behind the heavy winter and wet spring can be found in the Pacific Ocean, said Erin Walter, a meteorologist with the National Weather Service in Grand Junction.
Winter and spring storms were fueled by weak El Niño conditions that shifted atmospheric rivers laden with moisture farther south than in an average year. (El Niño occurs when, among other conditions, sea-surface temperatures are warmer than average.)
Unceasing storm systems that usually blanket the Northwest, Alaska and Canada instead inundated California’s Sierra Nevada mountain range…
he weak El Niño “definitely influenced the track of storms and the general circulation of our low and high pressure systems,” Walter said. “It’s been a very abnormal winter and spring for us.”
And that may not change anytime soon. Walter said the federal Climate Prediction Center’s one-month outlook for western Colorado, as of May 31, “falls within a 40 percent probability of being above average for precipitation.” The center also is predicting average temperatures for the region.
While the wet, cool spring has meant little snowmelt and allowed for continued skiing, the Colorado Water Conservation Board and local emergency managers are keeping a close watch on river levels…
CWCB also cited a forecast for June that indicates a “wet month for the entire state,” and adds that areas downstream of recent burn scars, like those on Basalt Mountain and surrounding environs from the Lake Christine Fire, are at heightened susceptibility to flash floods, and mud and debris flows. The board reminded “individuals and business owners [to] consider, be aware of, prepare for, and insure against flood threats.”
“It is also important to note that Colorado’s worst flood events have historically occurred from general spring rainfall and summer thunderstorms, which are completely unrelated to snowmelt flooding resulting from mountain snowpack,” the summary says. “For this reason, even residents in areas with lower snowpack should exercise caution in evaluating flood risk.”
Floods directly related to the melting snowpack are possible but unlikely, and for boaters, “an extended season of high water is a near certainty this year,” the board reported.