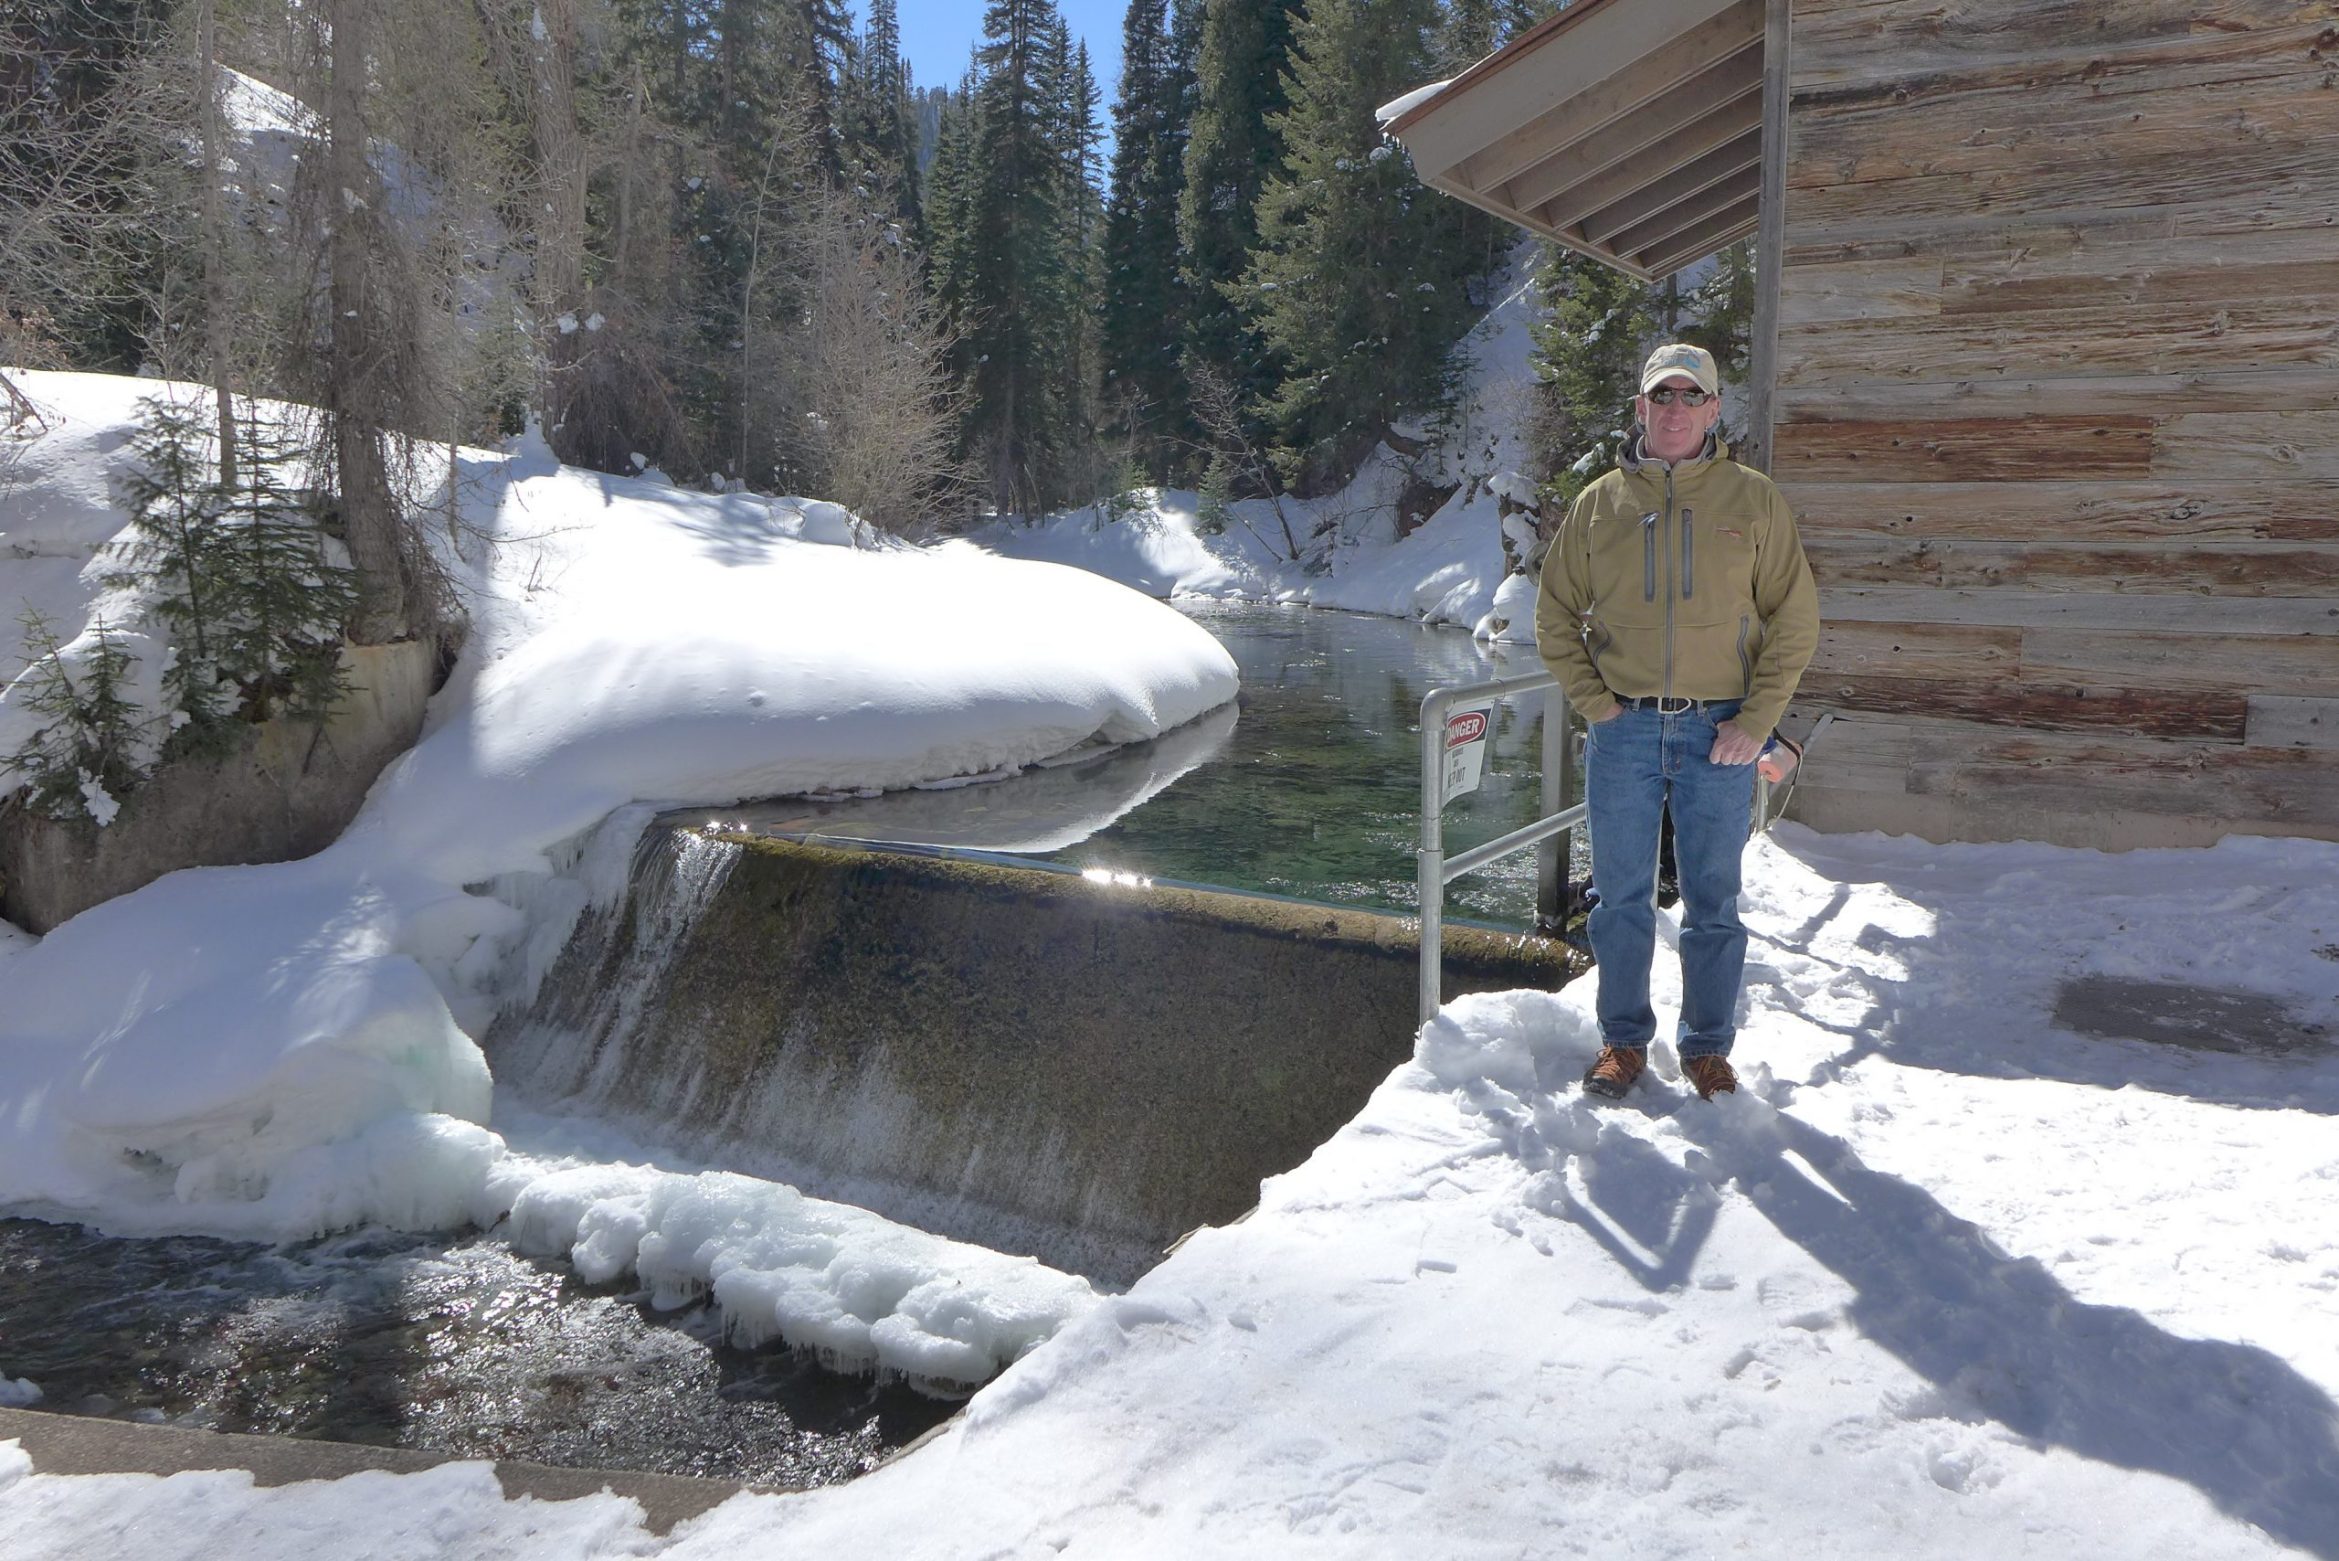
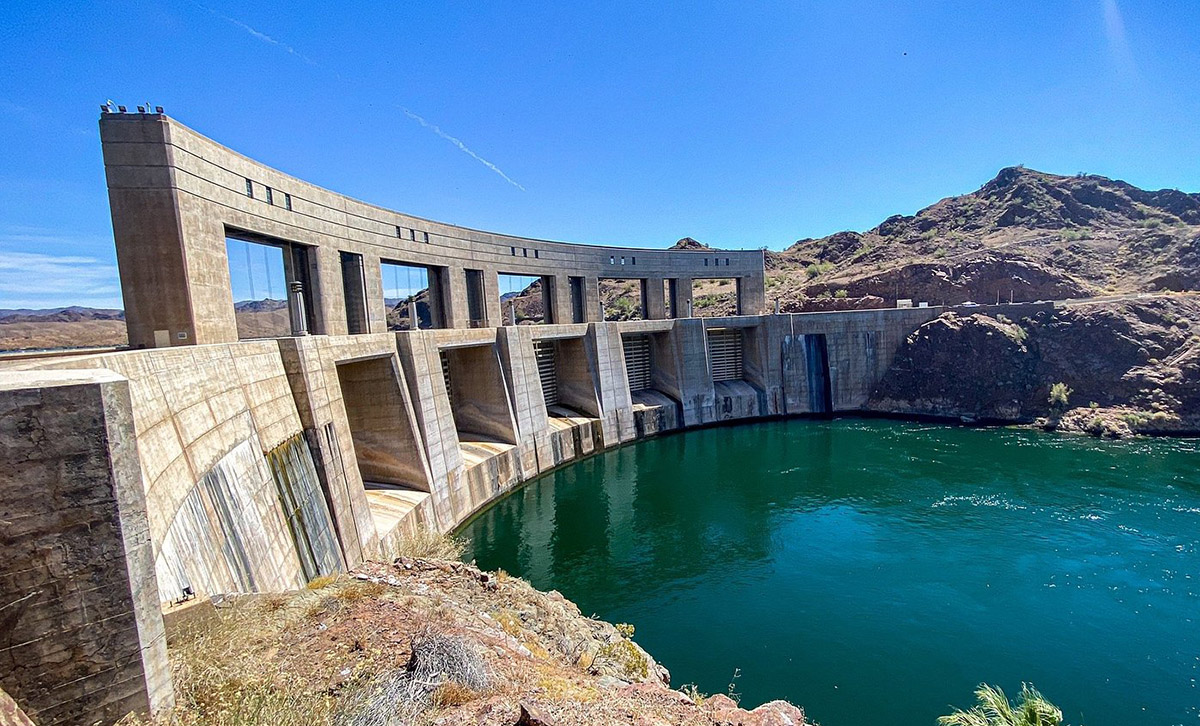
Aspen Utilities Resource Manager Steve Hunter stands at the city’s Castle Creek water diversion in this February 2021. CREDIT: HEATHER SACKETT/ASPEN JOURNALISM
The city of Aspen Drought Response Committee is recommending to continue the current Stage Three Water Shortage Declaration amid persisting drought conditions and an approximately 75% compliance with Stage Three Water Shortage Restrictions. The Drought Response Committee meets monthly in order to discuss current conditions and assess what level of restrictions are necessary to meet demand for essential uses. According to an information update provided to Aspen City Council prior to their Monday meeting, the latest drought data for Aspen and the Roaring Fork watershed necessitate the continuation of the current Stage Three Water Shortage Declaration and Restrictions. Aspen’s municipal water supply comes from Castle and Maroon Creeks, and the Aspen water system relies primarily on direct streamflow through the consistent release of water from snowmelt throughout the year. The information update confirms that, during drier than normal years, the city’s water policy enables council to enact its Water Shortage Ordinance by selecting an appropriate water shortage stage. A Stage Two Water Shortage went into effect Sept. 1, 2025, and was elevated to a Stage Three Water Shortage declaration on May 12, effective May 15…
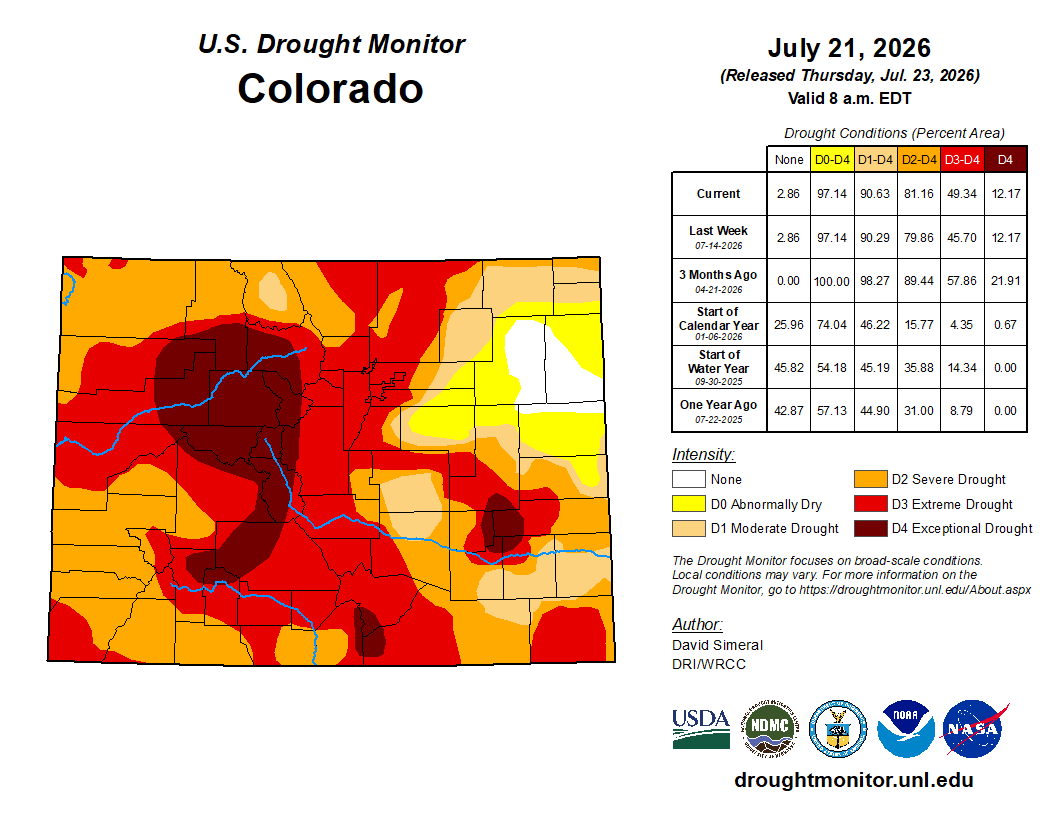
Colorado Drought Monitor map July 21, 2026.
“Since the Stage Three declaration was made in May, drought conditions have remained throughout the Roaring Fork Watershed,” the update reads.
It confirms that the July 16 U.S. Drought Monitor continues to show Aspen and Pitkin County fully in the Exceptional Drought — D4 — Category, the highest level of drought. Stream flow in June in the Roaring Fork watershed was at 27% of normal, and the Maroon Creek stream gauge measured peak runoff on June 7 at 143 cubic feet per second; the historical average peak runoff occurs between June 15-30 at over 300 cfs.
After four weeks of testimony and now closing arguments set for Thursday morning, the decision before the Colorado Division 3 Water Court and Judge Michael Gonzales boils down to this: Was the Colorado state engineer’s review of the Subdistrict 1 Fourth Amended Plan of Water Management proper and legally done?
Attorneys for farmers protesting the plan, namely groundwater irrigators organized as the Northeast Water Users Association and Sustainable Water Augmentation Group, accused retired Colorado Division of Water Resources state engineer Kevin Rein of “bias” during Rein’s testimony Wednesday. Rein, who retired as state engineer in December 2023, took the witness stand as a “lay” witness looking to add clarity for the court on his steps in reviewing and approving the new plan and to rebut the testimony of Ken Knox, SWAG’s expert witness who cast doubt on Rein’s review.
“Bias is always relevant to credibility, Your Honor. This line of questioning goes directly to the witness’s bias at the time he approved the fourth plan,” argued attorney Ryan Donovan.
Donovan and fellow SWAG attorney Brad Grasmick have been working to bolster their case by arguing the Fourth Amended Plan unfairly targets groundwater irrigators like their clients, and their clients are being asked to bear a disproportionate share of the burden in the subdistrict’s efforts to recover the unconfined aquifer of the Upper Rio Grande Basin.
San Luis Valley Groundwater
It is the recovery of the unconfined aquifer to sustainable levels that is at the heart of the Subdistrict 1 water management plan and has been since the first plan was adopted in 2009 and certified by the water court in 2010.
The SWAG attorneys contend Rein didn’t conduct a full legal review of the sustainability and proportionality rules contained in state statutes governing recovery of the unconfined aquifer and didn’t require all the necessary documentation to approve the plan.
Donovan then tried to show bias to the court by taking Rein back to July 2023 and the sudden end to another, but related water trial dealing with his clients’ efforts to get the Division 3 Water Court to approve an alternative augmentation plan for the SWAG farmers to operate in Subdistrict 1. Gonzales presided over that trial, as well.
The key to the July 2023 trial was the timing: SWAG was trying to get its alternative augmentation plan approved by the court ahead of the current court trial dealing with the Fourth Amended Plan of Water Management. Instead, the SWAG augmentation trial ended when it lost a source of the water from the town of Del Norte that it was counting on its plan and withdrew the case.
On Wednesday, Donovan accused Ryan and the state engineer’s office of deliberately fast-tracking approval of the Fourth Amended Plan and then getting the town of Del Norte to terminate its agreement with the SWAG farmers for water to undermine the alternative augmentation plan.
“Mr. Rein, Did you feel the need to get the approval of the fourth plan fully completed? Meaning your approval and the subsequent approval by the district board prior to the start of SWAG’s trial on July 17th, 2023?” Donovan asked.
“I can say no, absolutely not. I did not feel that, any urgency other than the urgency that this is something we have been working on for a long time. We needed to move it along. And I can state unequivocally and absolutely that there was no consideration, there was no bias that this plan needed to be approved prior to the beginning of the SWAG case,” Rein answered.
In addition to closing arguments Thursday, Gonzales will also lay out a timeline for how the case proceeds with final submissions to the point where he issues a decision.
Donovan earlier in the week, as he argued against Rein testifying, accused the judge of creating an appearance of impropriety when Gonzales made known his interest to hear testimony from Rein.
Gonzales responded that from his perch, it has seemed throughout the trial that the attorneys involved have had the intent to file an appeal with the Colorado Supreme Court whichever way he rules.
Rio Grande and Pecos River basins. Map credit: By Kmusser – Own work, Elevation data from SRTM, drainage basin from GTOPO [1], U.S. stream from the National Atlas [2], all other features from Vector Map., CC BY-SA 3.0, https://commons.wikimedia.org/w/index.php?curid=11218868
The North American monsoon season is ramping up across the West, with the potential to bring much-needed rain as Colorado faces a historic drought and major wildfires, according to forecasters. National Weather Service forecaster Kris Sanders said that widespread, scattered showers and thunderstorms on the Western Slope this week could be an early sign of the monsoon, or a late-summer shift in the wind patterns that brings more moisture to the region….A rainy monsoon season could be good news for the drought-stricken mountains. Large parts of Summit, Grand, Eagle, Pitkin, Moffat, Rio Blanco, Garfield and Lake counties have been experiencing exceptional drought — the highest level — for nearly three months straight, according to the U.S. Drought Monitor. Almost the entire Western Slope is experiencing severe drought, Level 2 of 4, or higher. But Smith also noted that the monsoon can be a double-edged sword that can bring lightning and wind, which can increase wildfire risk. It also creates new hazards for those recreating outdoors.
Photograph of fresh tomatos in Mexico, provided by Storyblocks
By Robert Marcos
The excessive pumping of aquifers in the San Quintín Valley in Baja California is threatening the long-term reliability of tomato and berry exports to the United States. Because the freshwater aquifers sit near the ocean, the overpumping has resulted with an intrusion of saltwater.
Groundwater in the San Quintín Valley, Baja California, is critically overexploited and heavily contaminated by saltwater intrusion. Pumping rates exceed natural recharge by millions of cubic meters annually, causing declining water tables and rendering underground sources too brackish for normal agricultural use or human consumption. 1
The San Quintin Valley faces one of Mexico’s most acute water crises. Located in an arid area in the northwestern region of the country, the valley lacks freshwater bodies and is structurally disconnected from other regional supply sources. To meet the water demand in the region, water is drawn from local underground aquifers, which have been subjected to increasing pressure due to overpumping and prolonged drought conditions. Current underground sources are insufficient and do not have the required water quality. The Colorado River is the region’s only other potential source of water, but it is 167 miles away and its viability is in question. 2
In 2024, the Mexican National Water Commission (CONAGUA) published three technical studies confirming the overexploitation of the four aquifers in the SQV—San Simon, San Quintin, Camalu and Vicente Guerrero—by a volume of 68.5 million cubic meters per year, jeopardizing the long-term viability of these sources. The groundwater has high levels of total dissolved solids, ranging between 1,540 and 11,000 parts per million (ppm), which is between 1.5 and 11 times higher than the maximum limit of 1,000 ppm established by Official Mexican Standard NOM-127-SSA1-2021 for water intended for human consumption. It is important to note that, due to insufficient water distribution infrastructure, low population density and overexploitation of the aquifers in the SQV, the local water utility, Comisión Estatal de Servicios Públicos de Ensenada (CESPE), is only able to supply potable water intermittently to 56% of the population through the distribution system, while the rest of the community relies on hauled water for their supply. This sporadic service increases the risk of cross-contamination within the pipelines due to backflows and leaks, as well as through the water storage methods used by residents, further compromising the safety of the water available for human consumption.3
Desalination considerations
A public desalination plant would provide a reliable source of clean, affordable drinking water to over 110,000 residents in San Quintín, drastically improving public health and daily life by reducing reliance on expensive, privately trucked water tankers (pipas). Because local groundwater wells are heavily contaminated with saltwater and unsafe for domestic use, this plant would bypass the degraded aquifers to deliver potable tap water directly to homes through a new macro-distribution pipeline network. 4
However, implementing desalination in San Quintín faces several steep hurdles:
Power Grid Limitations: The regional Federal Electricity Commission (CFE) power grid lacks the high-voltage capacity required to run a large-scale desalination facility, necessitating massive energy infrastructure upgrades before the plant can operate.
Brine Disposal: Safely discharging the highly concentrated leftover saltwater (brine) back into the ocean requires careful management to prevent destroying the fragile marine ecosystems and local fisheries.
High Operational Costs: Desalination is an energy-intensive process, making the final tap water expensive to produce and requiring long-term government subsidies to keep it affordable for low-income residents.
Financing and Bureaucracy: The project has historically suffered from prolonged political shifts, contractual re-negotiations, and delays in securing international development bank funding.
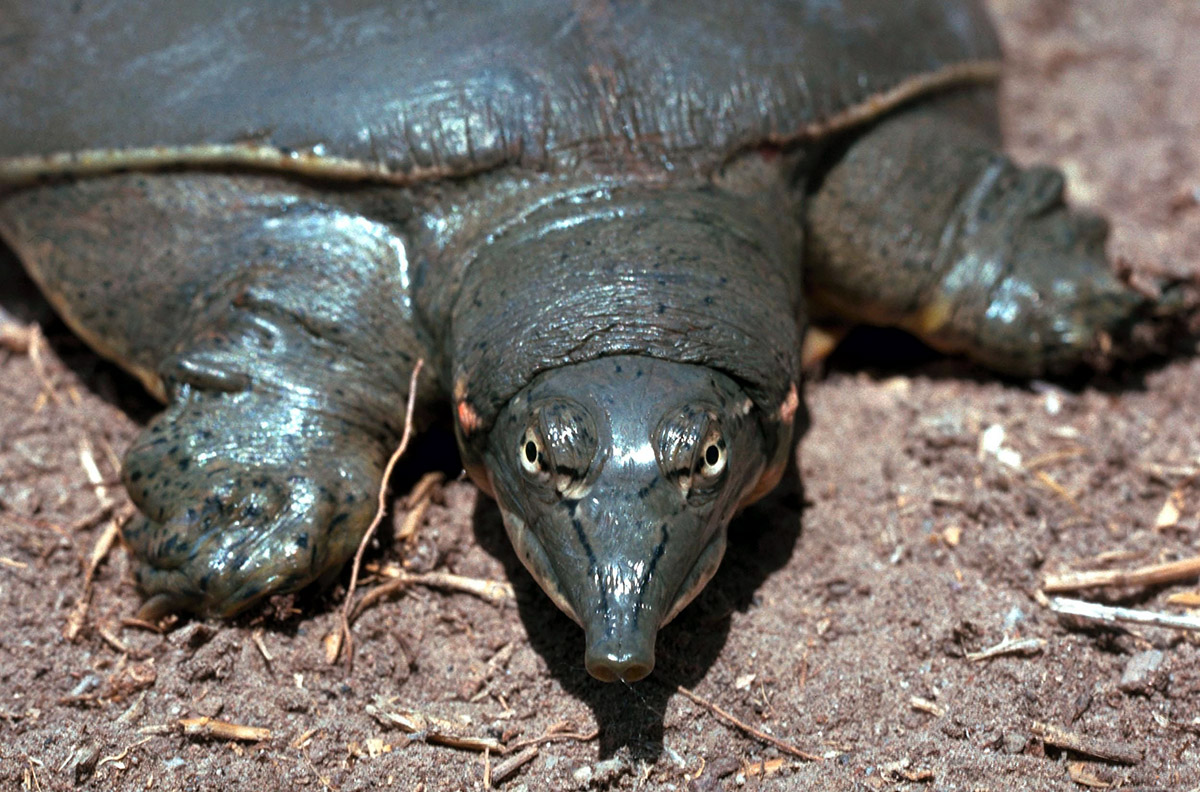
Texas spiny softshell turtle. Photographed by Gary M. Stolz, U.S. Fish and Wildlife Service
By Robert Marcos, photojournalist
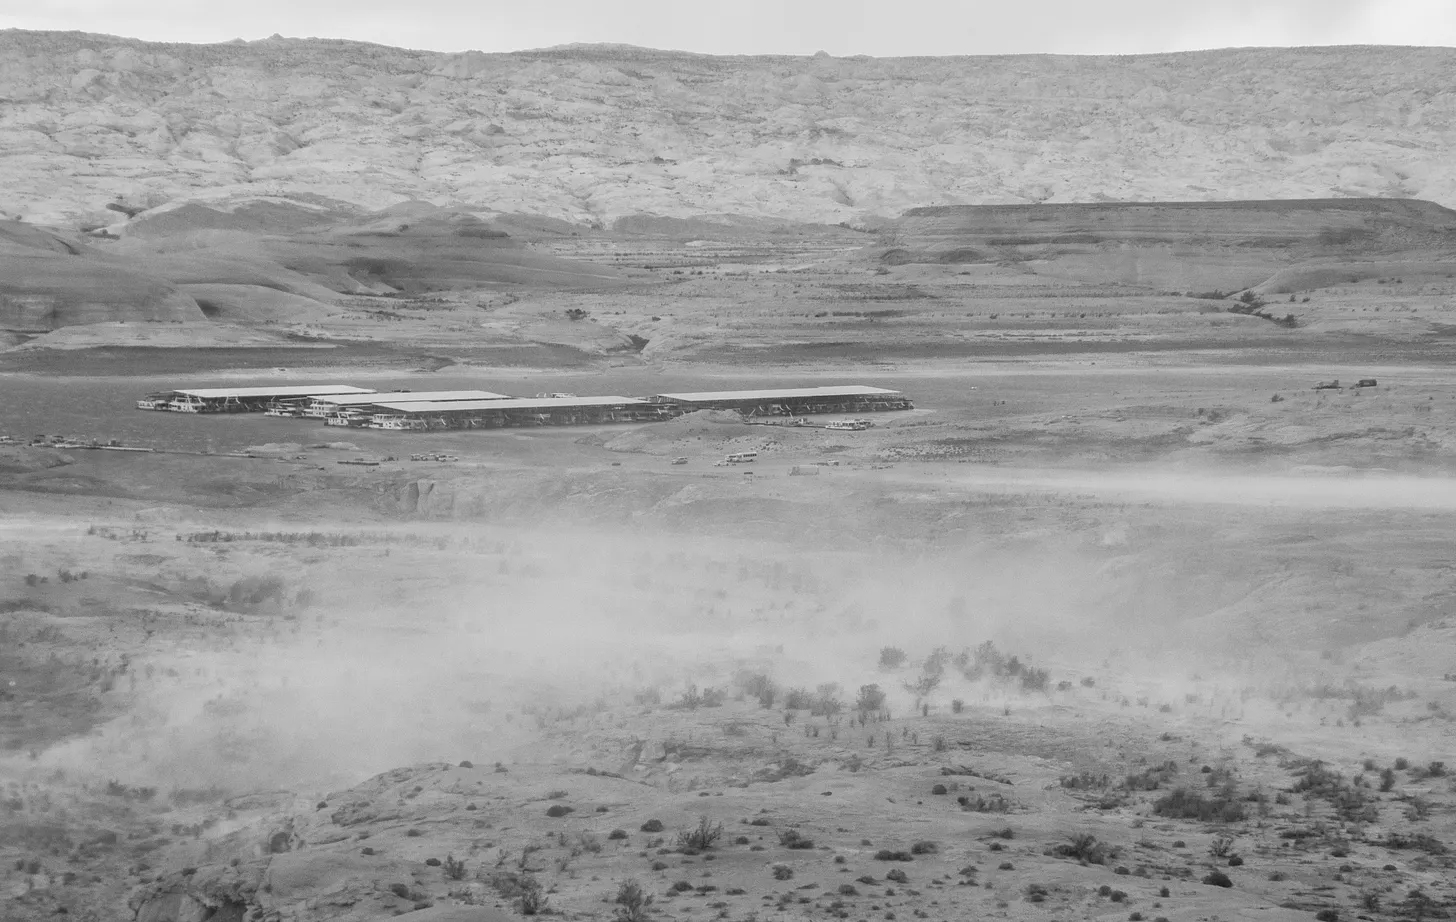
Like many other older men who set off aloneon poorly-planned trips and then vanish, I had left my car at Lake Mead’s South Cove and set off on foot for the area where the Colorado River enters the reservoir. As always, nobody knew where I was or where I was going. I began my hike toward the distant inlet along the shoreline but was quickly stymied. Instead of white fluffy sand the beach was completely covered by sharp and irregular piles of tufa and coral. Although I made it to my destination, I didn’t know that my route could’ve introduced me to any of Lake Mead’s 12 species of amphibians, or 41 species of reptiles – one of which is the Mojave Green Rattlesnake, until some hours later when I stumbled upon the remains of a massive softshell turtle that had died on a sand dune, more than a hundred feet above the lake. Shortly afterward I came across another surprise – broken pieces of Native American pottery that might’ve been made hundreds of years earlier by members of the Hualapai Tribe. The broken pottery made me realize that the sandy plateau that I was standing on existed long before the creation of Lake Mead, and it would still be there long after Lake Mead was gone.
The Texas spiny softshell turtle (Apalone spinifera emoryi) is one of Lake Mead’s most fascinating, non-native aquatic residents, possesses habits that are shaped by its unique anatomy. Lacking the heavy, armored shell of traditional turtles, this species relies on a flat, leathery carapace that grants it remarkable agility both in the water and on land. To survive and hunt in the desert reservoir, the softshell turtle operates primarily as an ambush predator. It spends much of its day completely submerged, buried beneath the sand or mud of the lake floor. From this concealed vantage point, it utilizes its exceptionally long, flexible neck to strike with blinding speed at passing prey, maintaining a strictly carnivorous diet composed of crayfish, small fish, and aquatic insects.1
Texas spiny softshell turtle photographed by David Piden and uploaded to Wikipedia by iNaturalist
Remaining underwater for extended periods requires highly specialized respiratory adaptations. When buried in shallow water, the turtle can easily extend its snorkel-like, tube-shaped nose above the surface to breathe without exposing its body to predators. In deeper zones, it switches to a remarkable process of pharyngeal respiration, effectively absorbing dissolved oxygen directly from the water through its skin and the specialized lining of its throat. This capability allows the turtle to remain hidden on the lake bottom for hours at a time, coming into contact with the open air only when necessary.
Sandy plateau several hundred feet above the far-eastern side of Lake Mead. Photo by Robert Marcos.
Despite their highly aquatic nature, these turtles must still emerge to regulate their body temperature. They can regularly be seen basking during the day on sunny banks, mudflats, and warm rocks, particularly around areas like Rogers Spring. However, because their soft shells offer very little protection against terrestrial predators, they are intensely skittish. At the slightest sign of danger, they abandon their sunbathing and use their webbed feet to sprint back into the water with surprising velocity, diving instantly out of sight.
Regarding the remains of the turtle I’d found that day, it turned out that a 21-inch long carapace pointed to an exceptionally large, mature female spiny softshell turtle, possibly from the Texas subspecies. While male spiny softshell turtles rarely exceed 8 to 9 inches, adult females can reach massive proportions with top shell lengths up to 21 inches. These unique reptiles are shaped like flat, leathery pancakes and possess paddle-like webbed feet alongside an elongated, snorkel-like nose that lets them breathe while remaining completely submerged in riverbed substrate. An individual of this size would have been several decades old, spending its long life as an agile ambush predator that burst from the mud to capture fish, crayfish, and insects.
Click here for video showing the Texas softshell turtle.
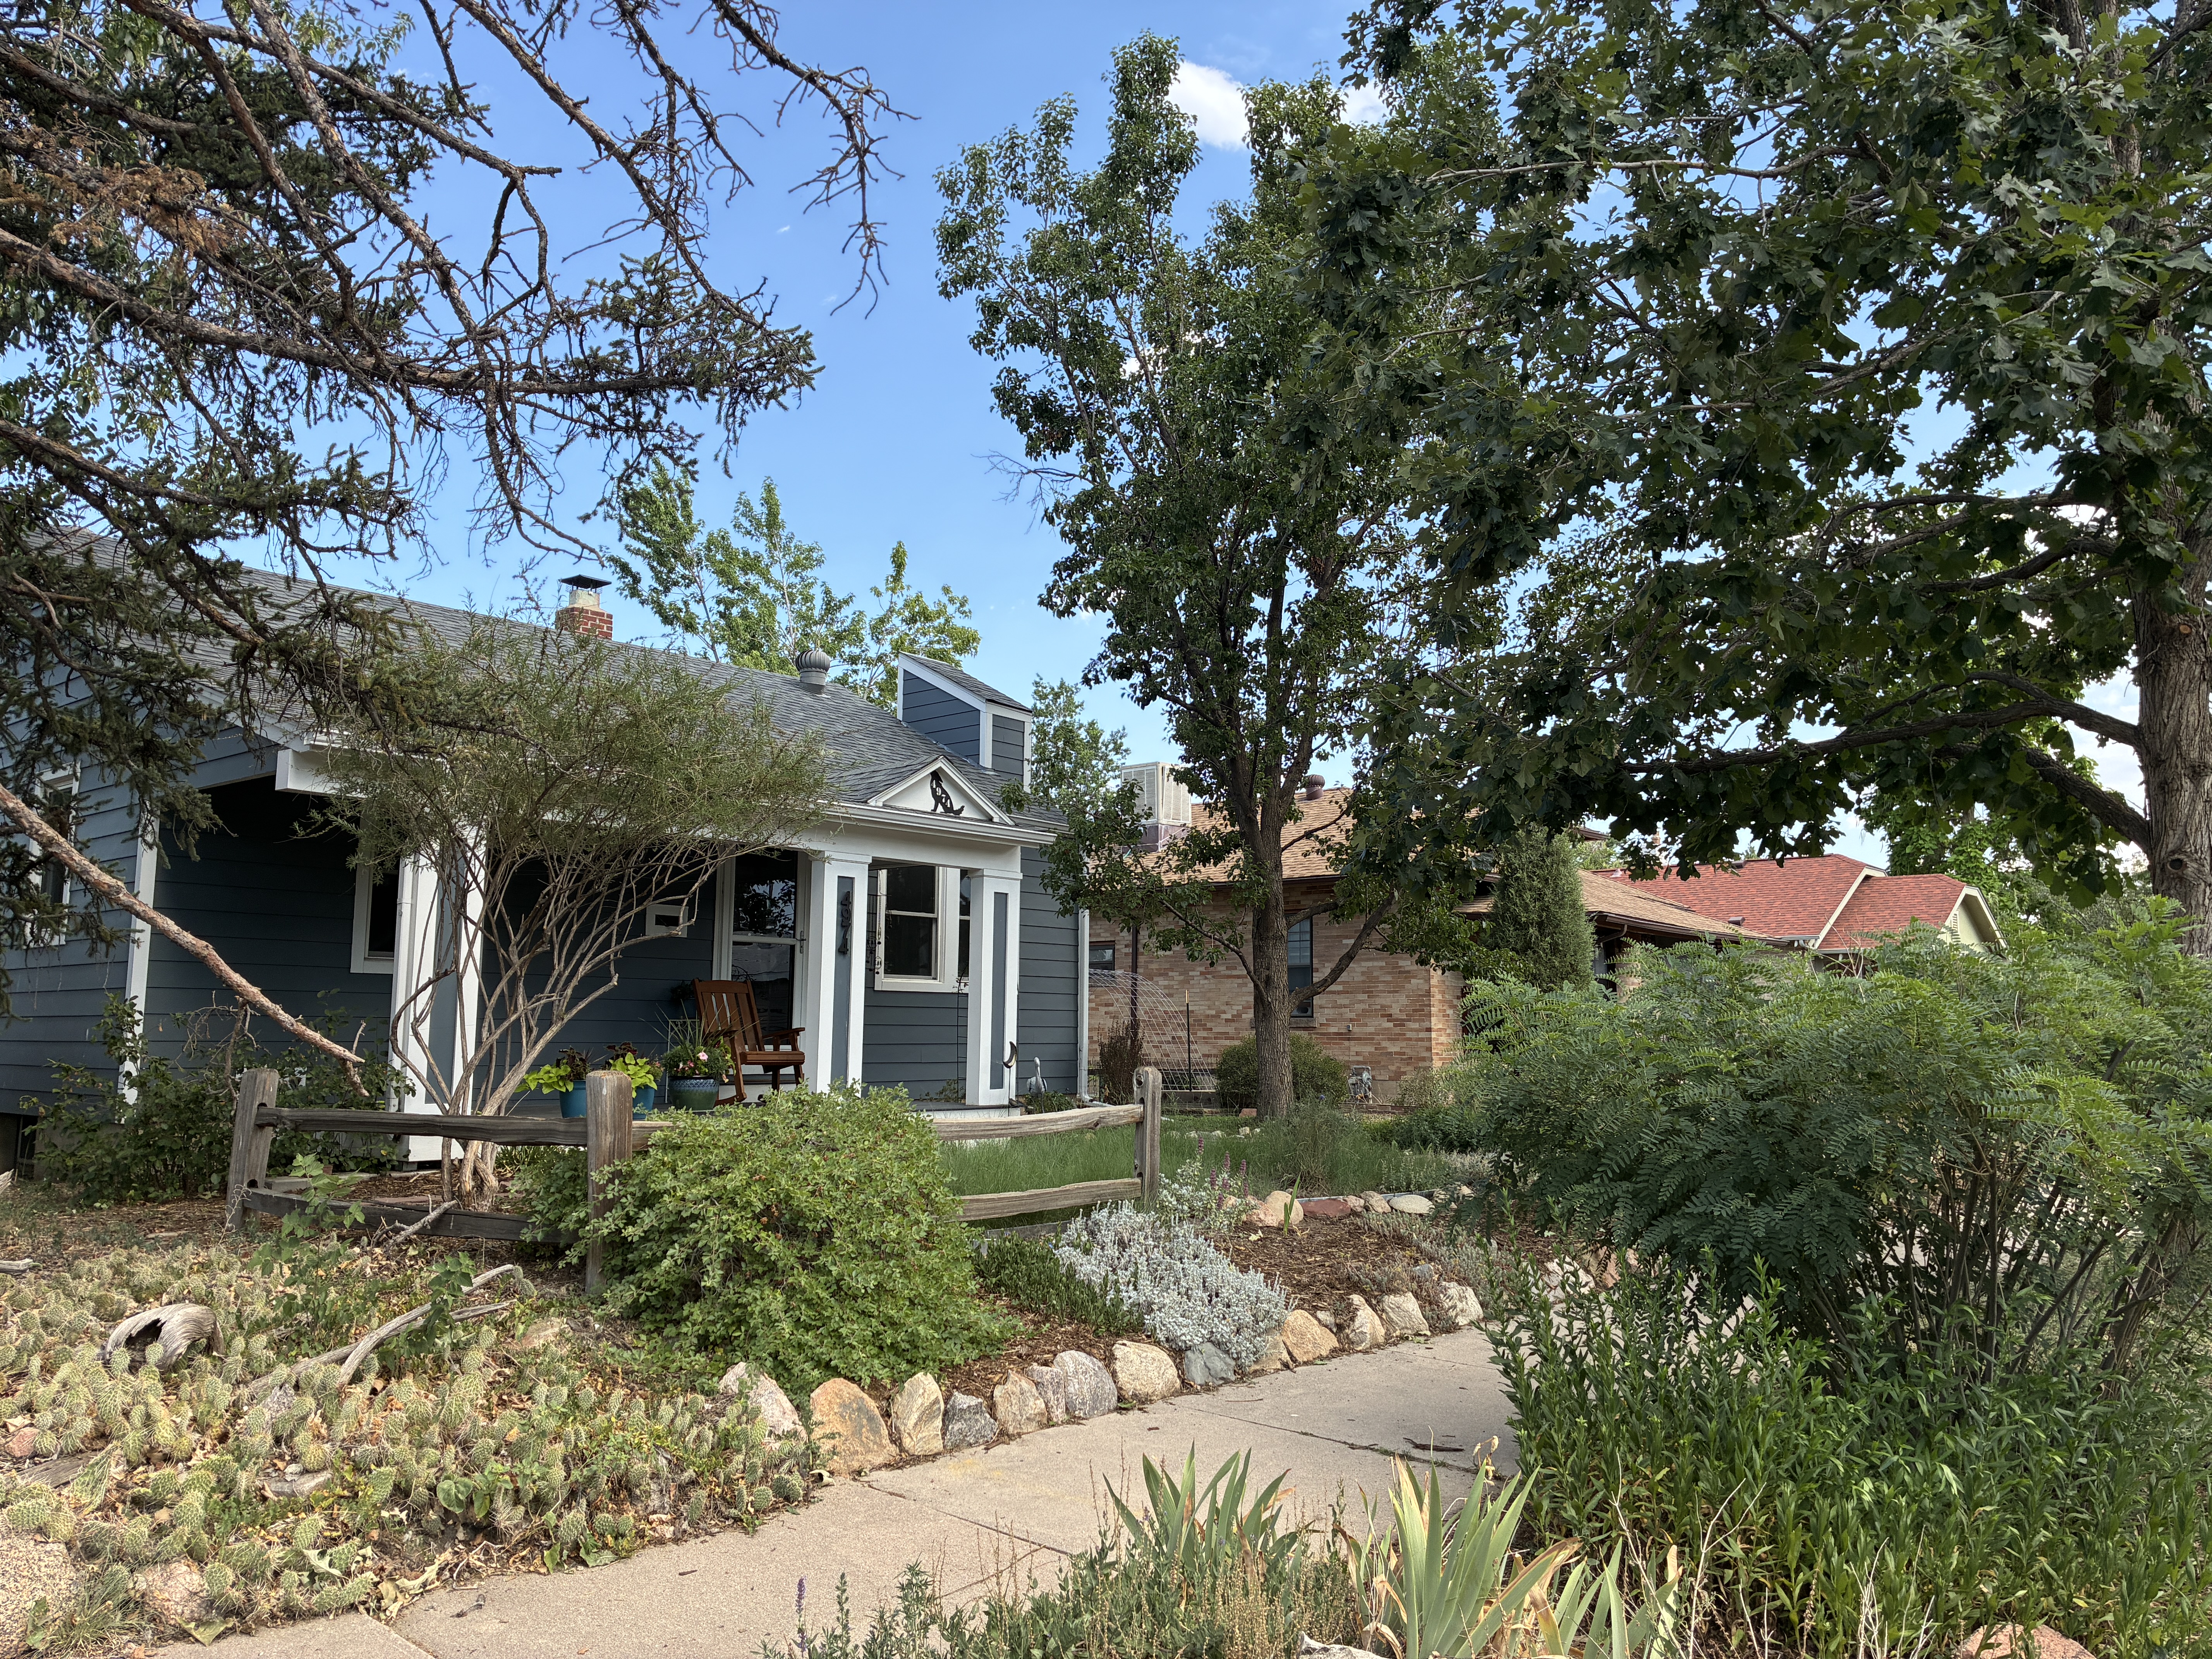
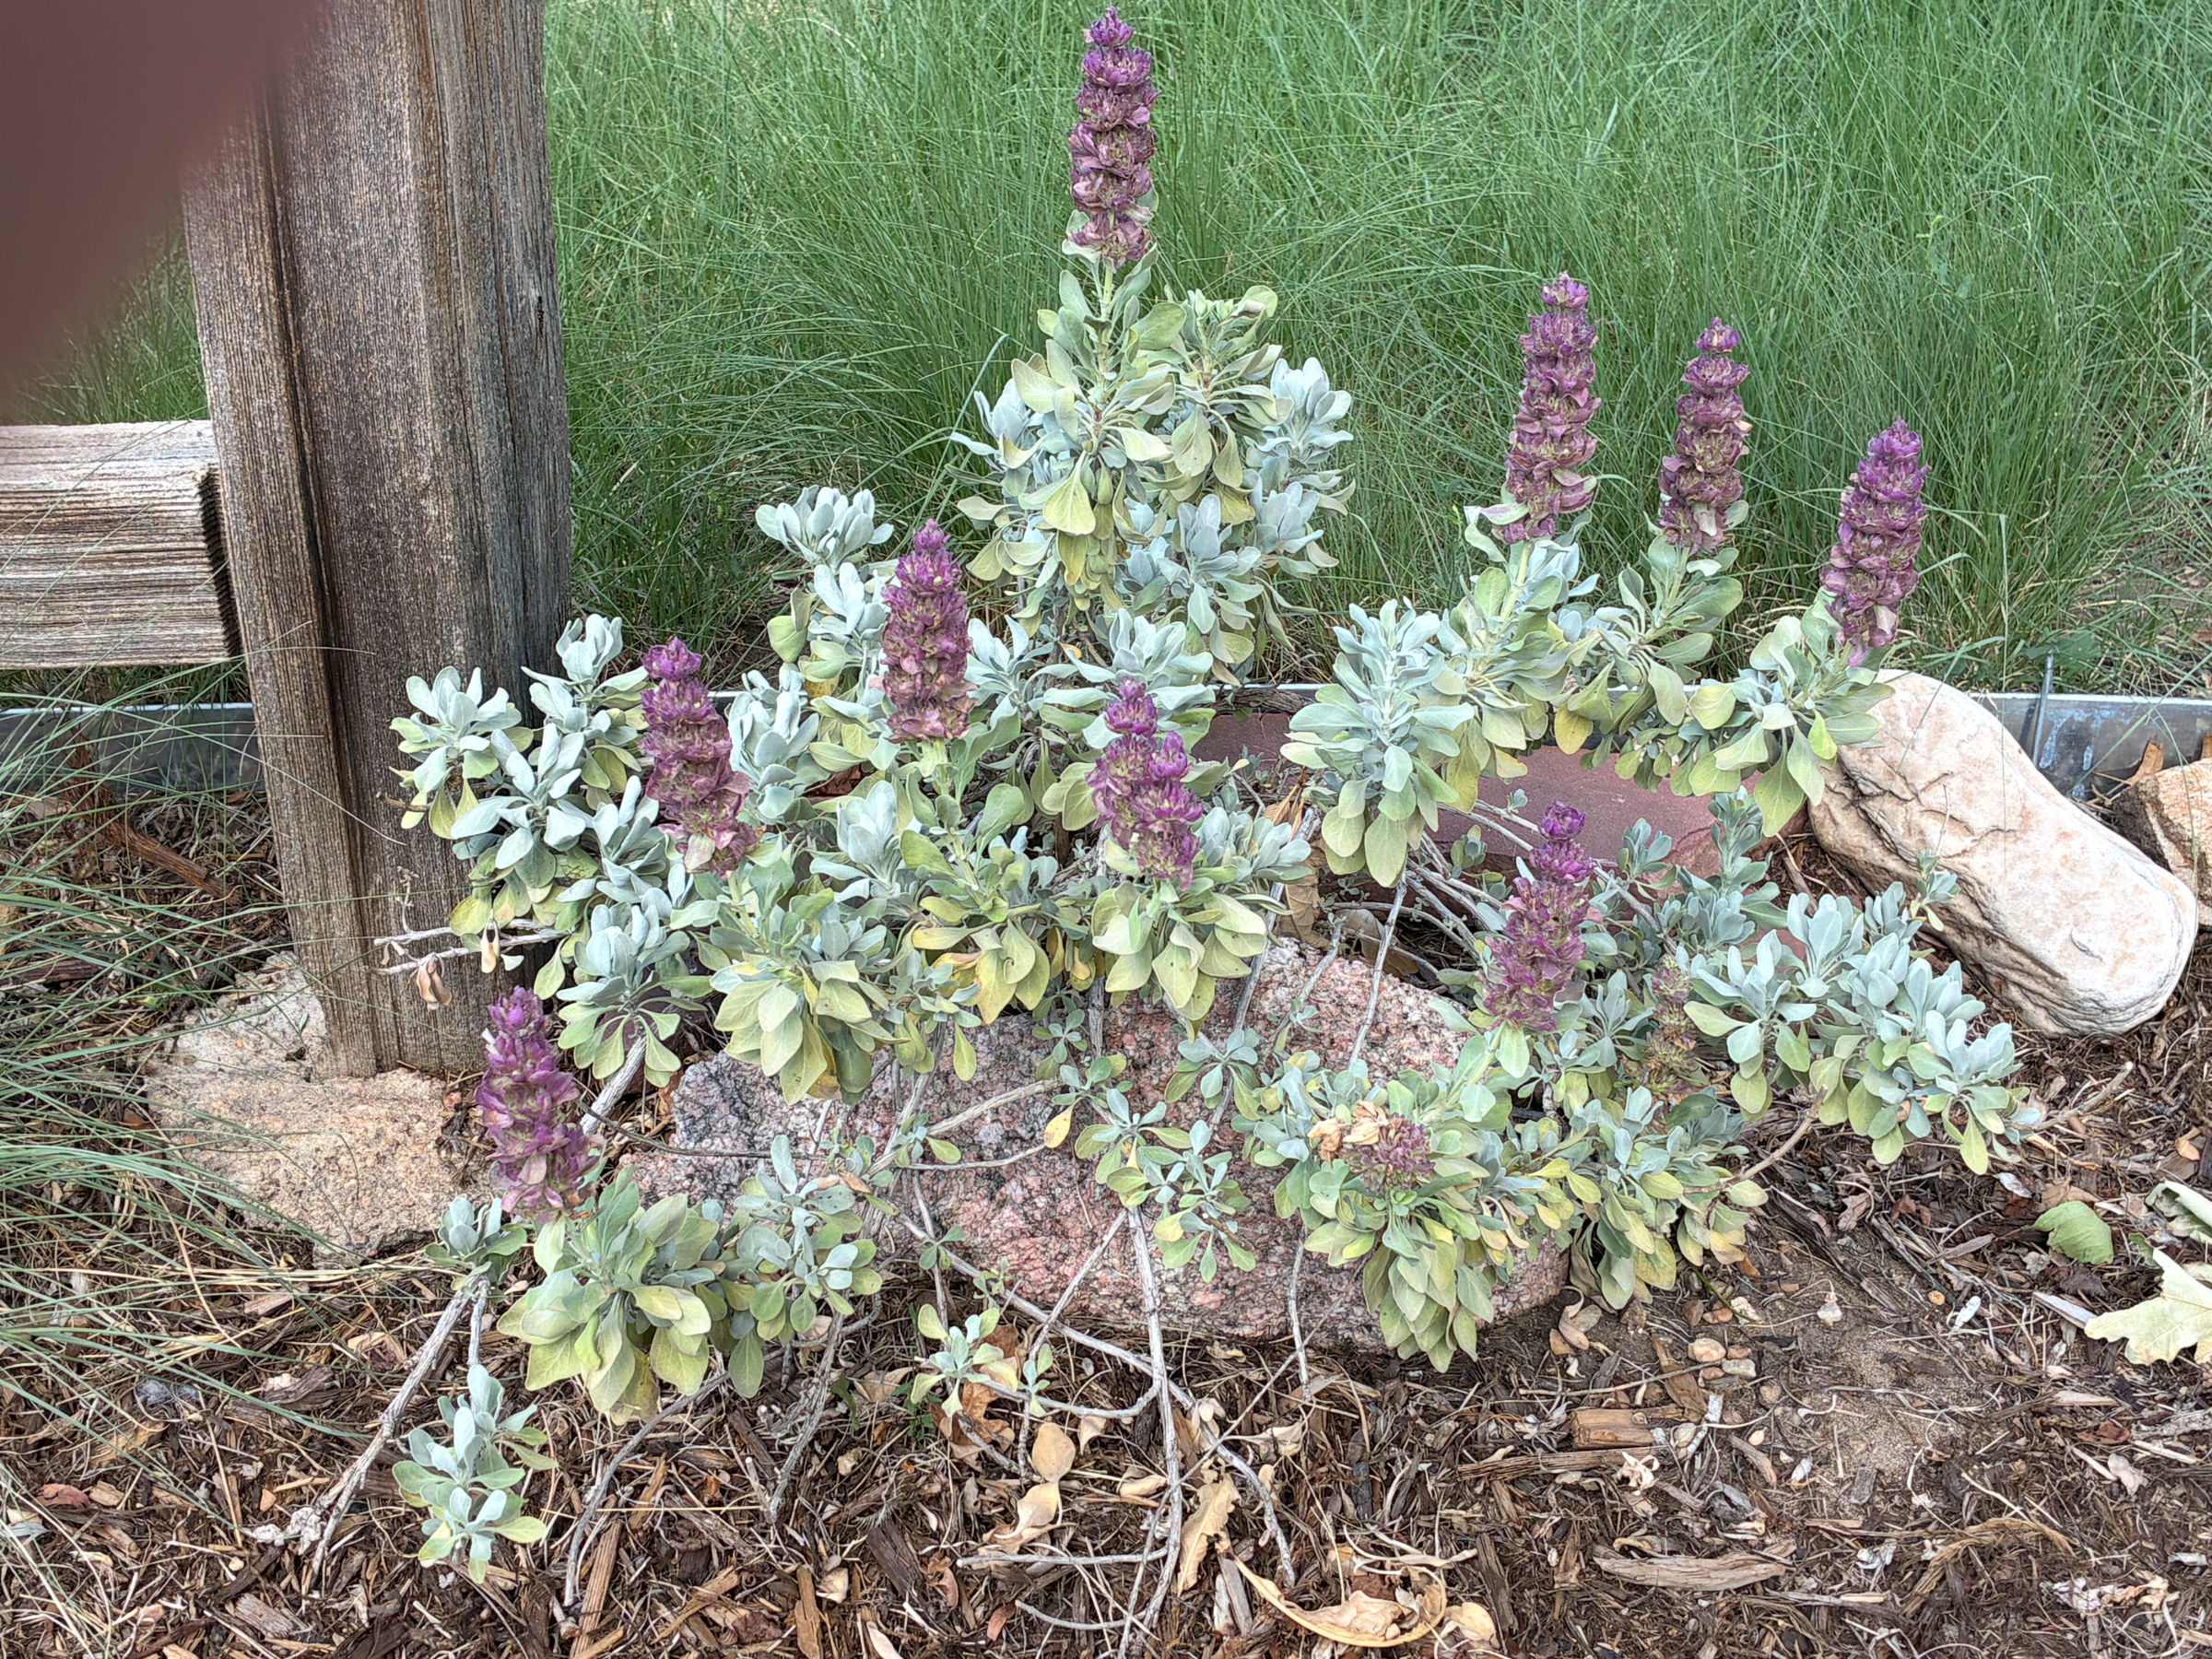
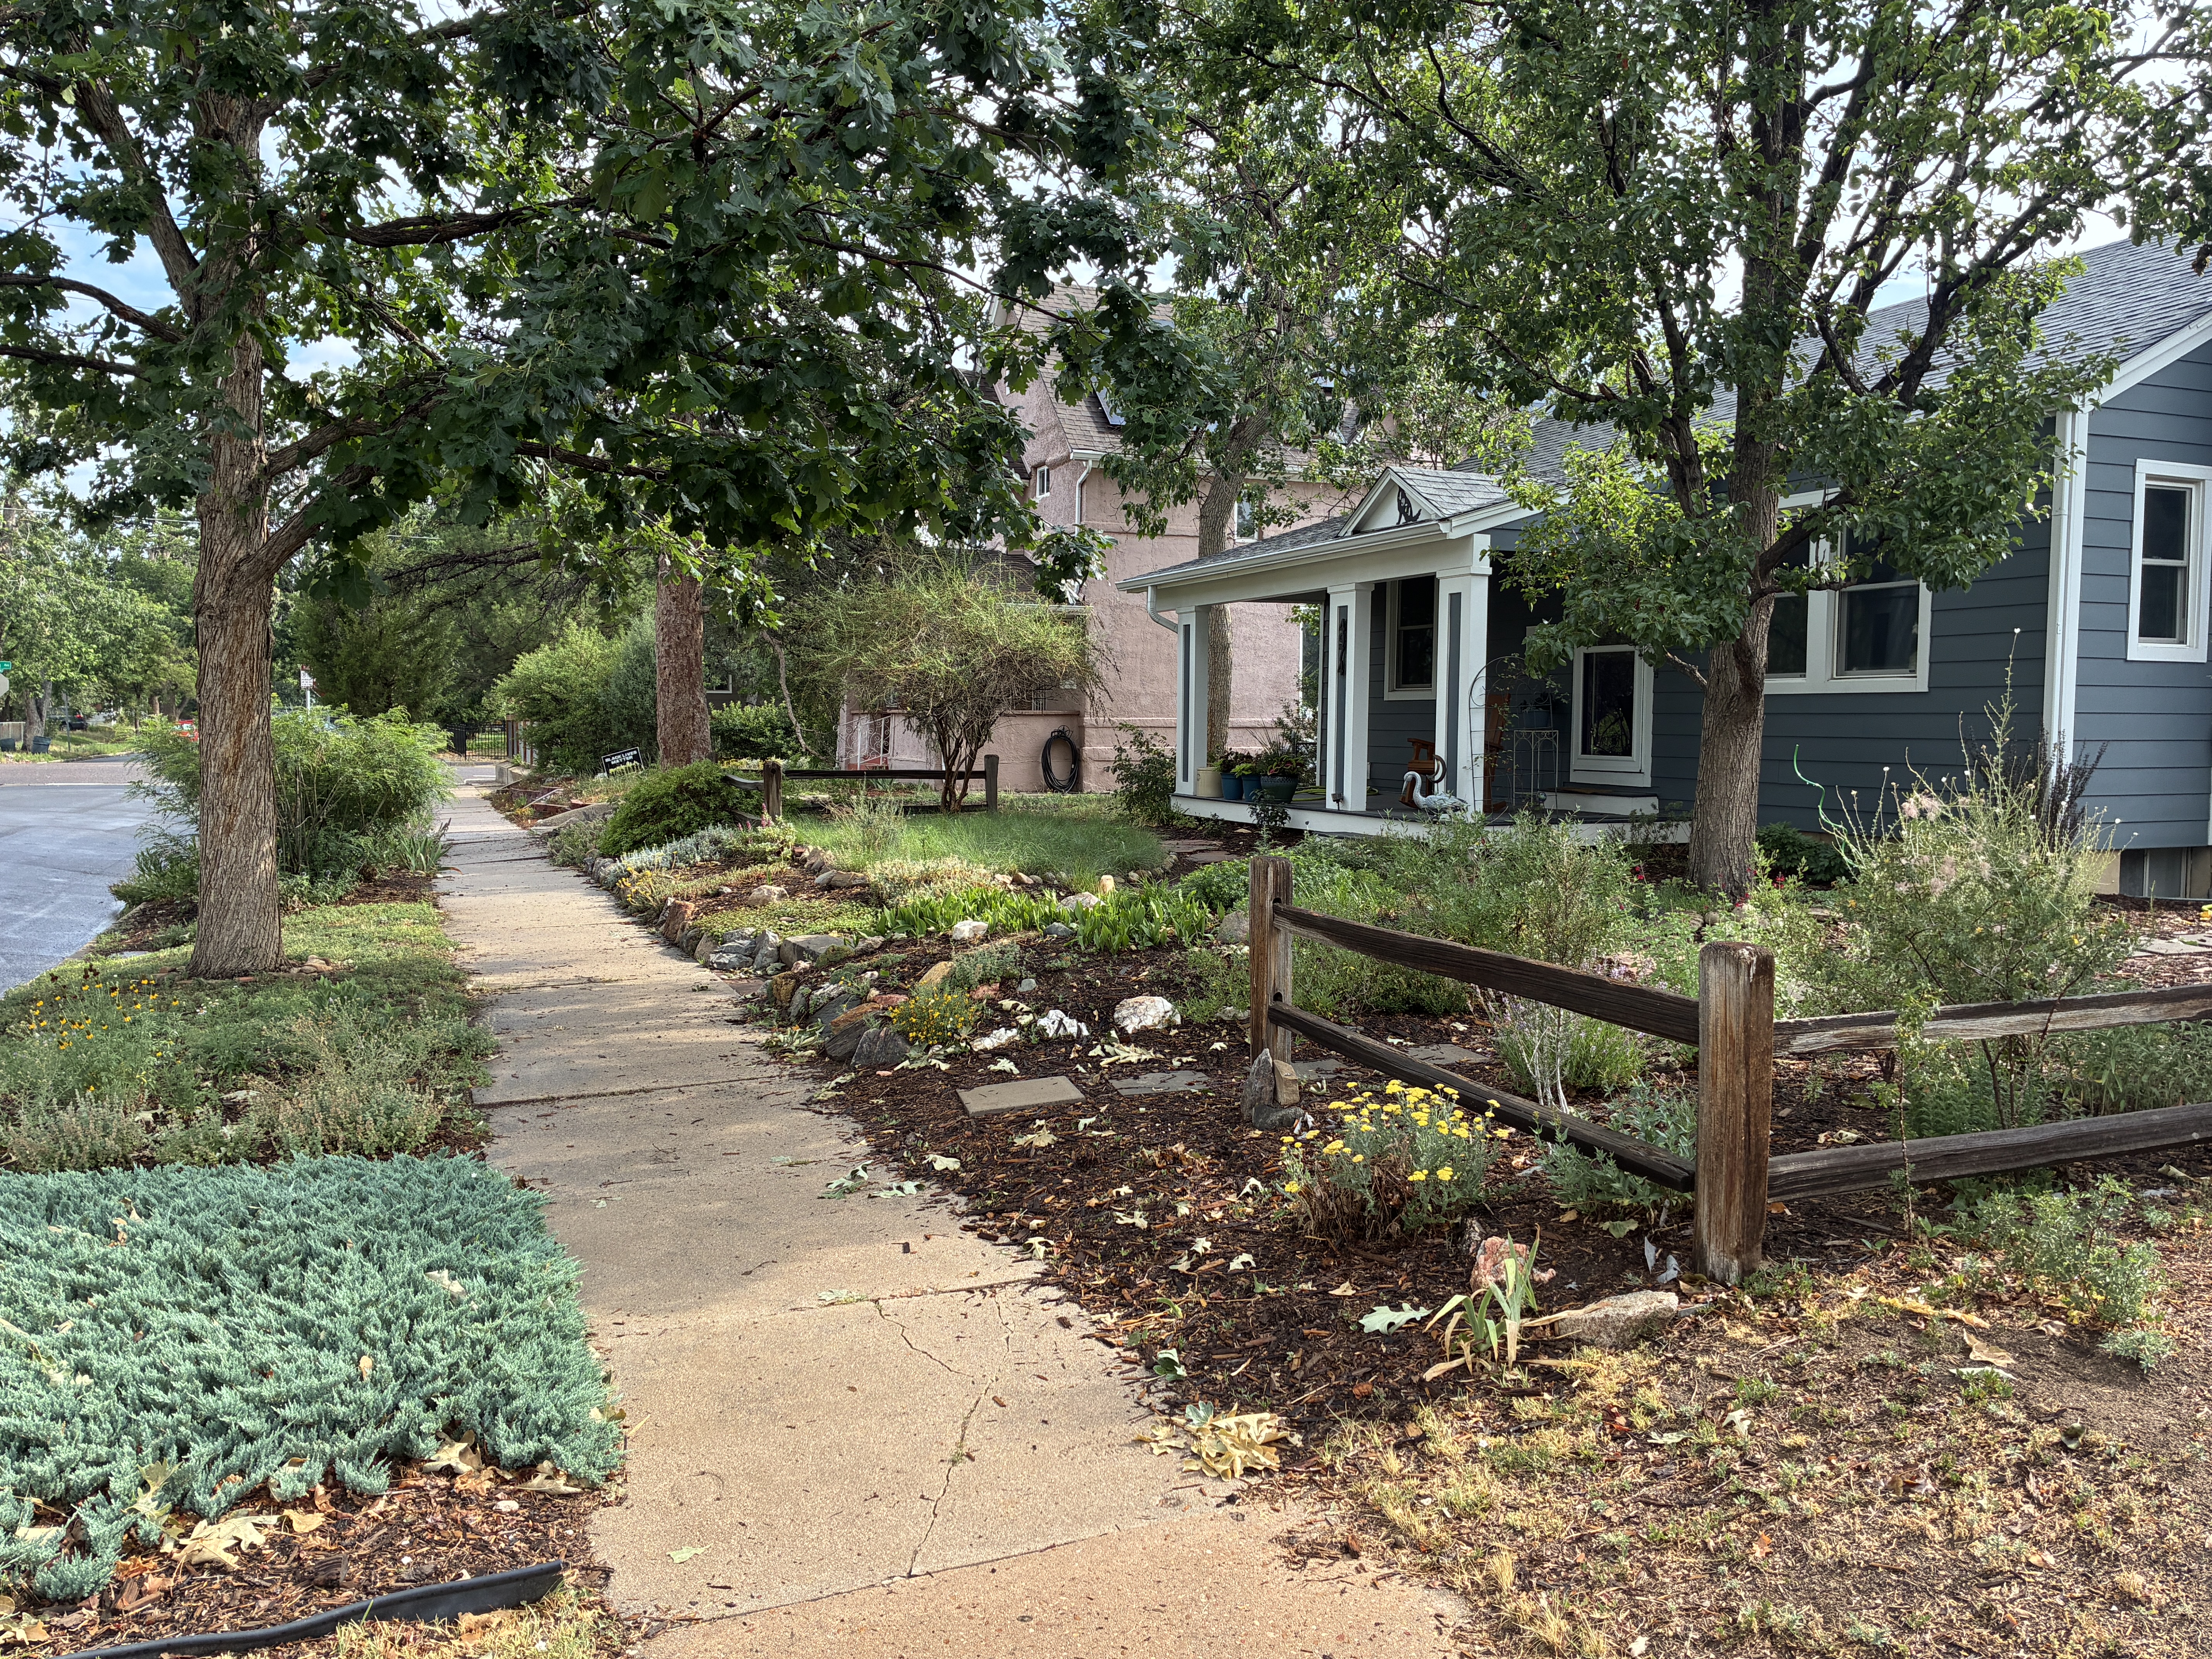
Mojave sage (Salvia pachyphylla), excellent (I’m told) for bees, butterflies, and hummingbirds, in Mrs. Gulch’s landscape July 13, 2026. That would be just like her.
Synopsis: El Niño continues and will strengthen through the end of the year, with a 97%chance it will persist through early spring 2027.
El Niño strengthened over the past month, with a large area of sea surface temperature anomalies in excess of +1.0C across the central and eastern equatorial Pacific. The latest weekly Niño-3.4 index value was +1.2°C, with the westernmost (Niño-4) and easternmost (Niño-1+2) indices at +0.5°C and +2.7°C, respectively. The equatorial subsurface temperature index (average from 180°-100W) increased, as a recent downwelling Kelvin wave deepened the thermocline and raised temperatures in the eastern Pacific. Low-level westerly wind anomalies and upper-level easterly wind anomalies were observed over the western and central equatorial Pacific. Convection was enhanced over the central and east-central equatorial Pacific and was suppressed over Indonesia. The traditional and equatorial Southern Oscillation indices were significantly negative. Collectively, the coupled ocean-atmosphere system reflected a strengthening El Niño.
The North American Multi-Model Ensemble (NMME) average, including the NCEP CFSv2, forecasts El Niño to intensify through 2026. Alongside model forecasts, a strong coupling of the atmospheric and oceanic circulation across the Pacific contributes to very high confidence that El Niño will continue through early 2027. There is an 81% chance of a very strong El Niño during October-December that would rank among the largest El Niño events in the historical record going back to 1950. Even the strongest El Niño events do not lead to the typical impact everywhere, but stronger events can more significantly tilt the odds in favor of expected outcomes (see CPC outlooks for probabilities of seasonal anomalies). In summary, El Niño continues and will strengthen through the end of the year, with a 97% chance it will last through early spring 2027.
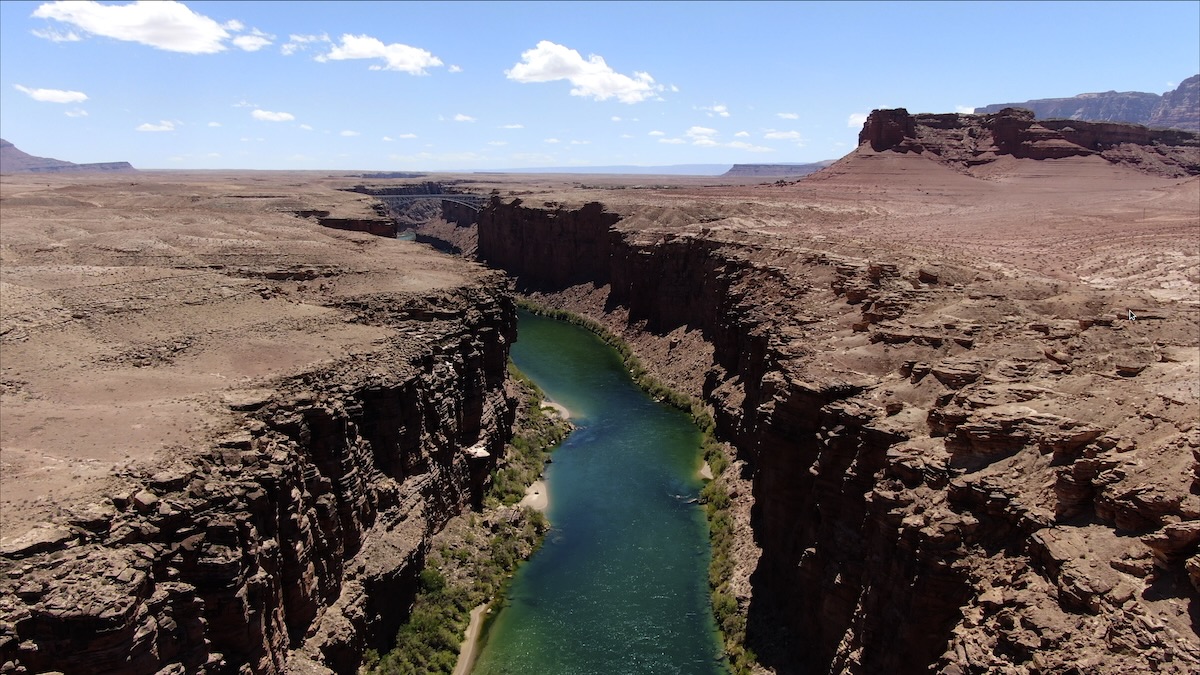
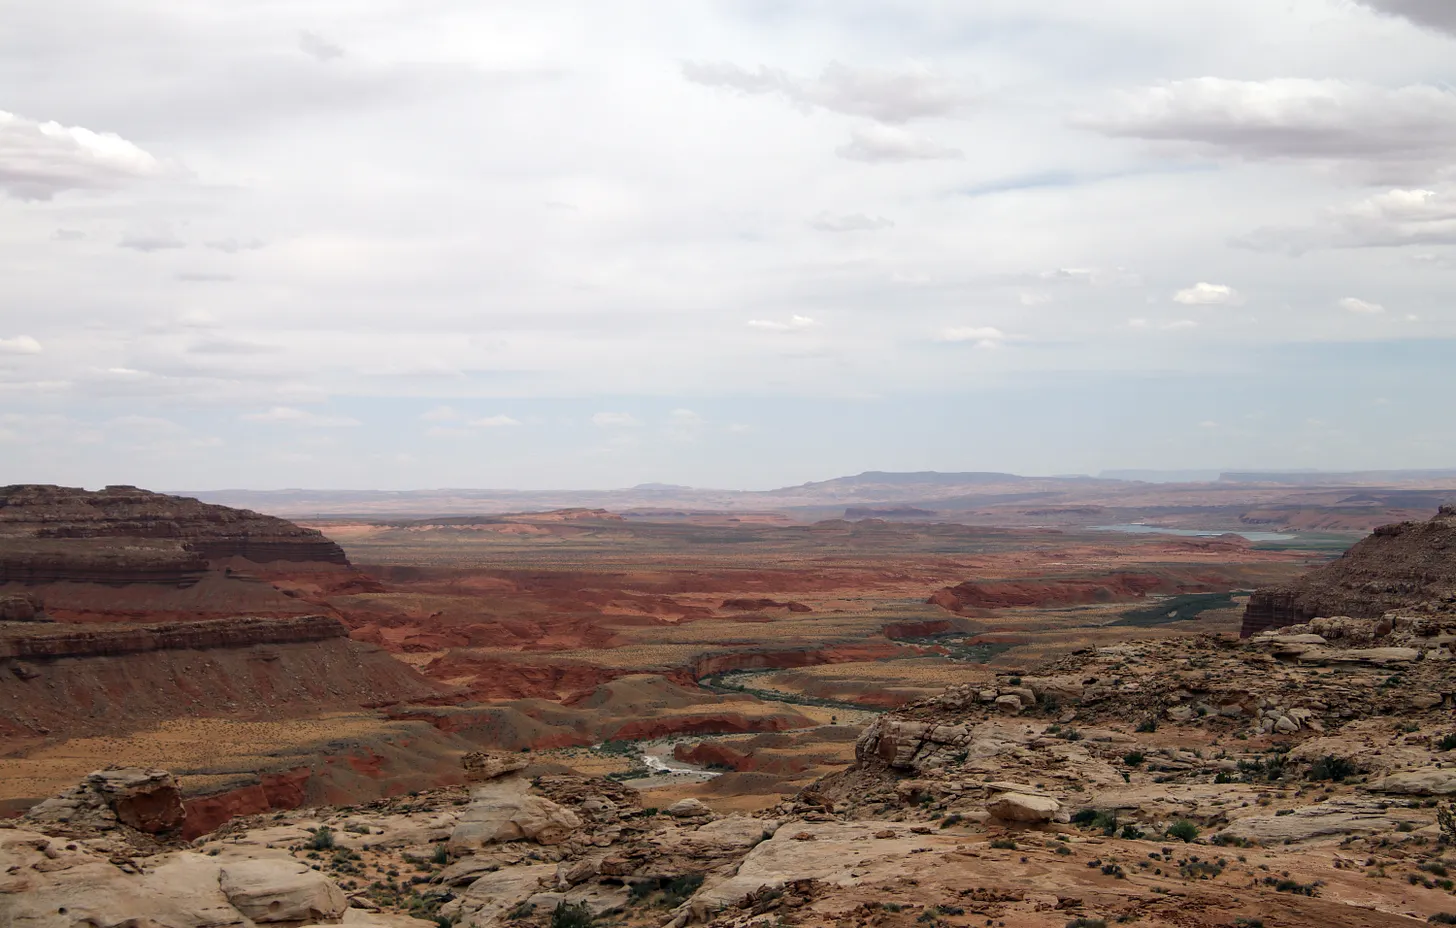
Colorado River south of Lees Ferry. Photo by Robert Marcos
by Robert Marcos, photojournalist
The National Park ServiceOffice of Public Health is actively investigating a cluster of undiagnosed, severe illnesses affecting Colorado River rafters in Grand Canyon National Park. The probe began in early July 2026 after numerous river runners used the “Grand Canyon Private Boaters” Facebook community group to report that members of their respective crews had returned home with highly concerning, unexplained medical symptoms.1
Current Situation and Symptoms
• Affected Trait: The reported cases belong to separate rafting groups traveling the Lee’s Ferry to Diamond Creek corridor between May and late June 2026. 2
• Core Symptoms: Rafters describe enduring severe localized muscle pain, persistent high fevers, intense fatigue, chills, weakness, and fluid in the lungs. 3
• Severity: Some patients have experienced symptoms akin to a severe, month-long summer flu, while others required hospitalization for localized infections or sudden loss of consciousness. 4
Potential Causes Under Investigation
Medical specialists and public health officials are currently tracking data via platforms like the infectious disease platform Beacon to rule out specific diagnoses. Because many rafters slept outside and swam in side canyons, doctors are currently testing for a wide range of potential ailments, including: 5
• Leptospirosis: A bacterial disease often contracted via freshwater exposure.
• Tick and Mosquito-borne Illnesses: Such as West Nile virus, Rocky Mountain spotted fever, dengue fever, or Lyme disease.
• Fungal and Viral Infections: Including Hantavirus or Valley Fever.
• Note on Gastrointestinal Illness: While the Grand Canyon has historically dealt with norovirus outbreaks—including a smaller spike in Norwalk-like viruses linked to portable toilets in June 2026—the current investigation focuses on a distinct respiratory and muscular illness. [1, 2, 3, 4, 5, 6]. The National Park Service has stated that the investigation is ongoing, and they will release official diagnostic findings as soon as lab results become available.
New Mexicois facing a profound environmental transformation. The state is transitioning out of temporary, cyclical droughts and entering a permanent state of aridification—a structural shift toward a fundamentally drier climate. Driven by rising temperatures, record-low winter snowpacks, and unpredictable weather volatility, state climate models project that New Mexico will lose 25% to 30% of its available water by 2050. This looming shortfall presents an existential threat to the state’s population, economy, and natural ecosystems.
Who Is Affected?
Aridification will impact every single New Mexican, though the immediate crisis is hitting specific communities first.
Rural Towns and Communities: Small municipalities with shallow wells are on the front lines. The town of Estancia has already declared a local water emergency, forcing the municipality to actively truck in water to keep its pipes flowing.
Eastern Border Cities: Urban areas in Eastern New Mexico, most notably Clovis and Portales, are facing severe long-term threats to their survival as their primary water reserves dry up.
The Agricultural Sector: Farming and ranching consume the vast majority of New Mexico’s water. Growing political friction is mounting against water-heavy industries like mega-dairies and commercial alfalfa farming. Along the Rio Grande, over 35% of historical farmland has already been abandoned due to shrinking irrigation allocations.
Which Water Sources Are Drying Up?
The crisis is simultaneously draining both above-ground and below-ground water supplies, creating a compounding deficit.
Surface Water Supply: The Rio Grande, the state’s main surface water artery, increasingly dries up completely during peak summer months. Vital reservoirs are failing; the massive Elephant Butte Reservoir has repeatedly plummeted to near-empty levels (3% capacity or less) because water evaporates or is consumed up to 15 times faster than it flows in from the north.
Groundwater Supply: Groundwater provides 80% of New Mexico’s drinking water, but it is being depleted at an unsustainable rate as cities and farms pump aggressively to replace lost surface water. The fastest-dropping water tables are concentrated in the Ogallala Aquifer (beneath Clovis and Portales), the Mimbres Basin (Deming), the Estancia Basin, and the Albuquerque Basin. Scientists predict a total deficit of 750,000 acre-feet of water within the next 50 years.
What’s Being Done About It?
While the projections are stark, New Mexico is not standing still. The state has launched a comprehensive 50-Year Water Action Plan to reshape how it manages, conserves, and sources water.1
The Strategic Water Supply: The state has committed $75 million to build advanced desalination projects. These facilities will treat brackish (salty) groundwater, with the goal of delivering 100,000 acre-feet of brand-new drinking water to communities by 2028.
Infrastructure Overhauls: Rural communities lose anywhere from 40% to 70% of their treated drinking water to leaks in aging pipelines before it ever reaches a tap. State-backed infrastructure campaigns are underway to aggressively repair these systems.
Water-Right Buyouts: To satisfy legally mandated interstate water compacts with downstream neighbors like Texas—and to prevent legal warfare—the state is actively buying back water rights from domestic farmers, taking certain agricultural lands out of production to preserve remaining aquifer levels.
Field in Palo Verde, California. Photographed by Robert Marcos.
By Robert Marcos, photojournalist
If the U.S. Department of the Interior (through the Bureau of Reclamation), decided that the most immediate way to stabilize water levels in Lake Mead and Lake Powell was for them to release less water, one way to achieve that would be to start buying up the water rights of farms in the Lower Basin. While this would save an amazing amount of water it would come at the expense of rural agricultural economies and domestic food production. But if the Bureau of Reclamation acted “surgically” and bought up water rights from major forage producers first, it would primarily disrupt only the livestock and dairy industries.
Key Benefits
Maximum “Bang for the Buck” Water Savings
Eliminates the largest single drain. Alfalfa is an incredibly water-thirsty crop which often requires up to 4 to 5 acre-feet of water per acre annually. A targeted buyout of just a portion of forage land could entirely wipe out the river’s structural deficit, leaving millions of acre-feet in Lake Mead.1
Saves vegetablesfor people. The Lower Basin (especially the Imperial and Yuma valleys) produces roughly 90% of the United States’ winter leafy greens. Leaving these high-value food crops untouched avoids an immediate national grocery crisis.2
More productive use of water. Fruit orchards and fresh vegetables generate much higher economic revenue per gallon of water than forage crops, preserving the highest-yield sectors of the agricultural economy.3
Easier target for public policy. Public and political support is much easier to secure when buyouts target cattle feed – a large portion of which is exported overseas to countries like Japan, China, and Saudi Arabia, rather than the reduction of fresh food for American families.4
Key Detriments
Negatively impacts Southwest Dairy and Beef Industries
Triggers a regional feed shortage. California and Arizona are major dairy producers. Local dairies rely heavily on a constant, nearby supply of fresh alfalfa to sustain milk production.5
Drives up dairy and meat prices. Moving forage production out of the Southwest forces dairies to truck feed from other states. The increased transportation costs will drive up consumer prices for milk, cheese, and beef.6
Eliminates operational flexibility. Farmers often use alfalfa as a financial safety net. It is cheap to plant, highly resilient, and requires very little human labor compared to vegetables.7
Increases farming risk. Without forage as a low-risk fallback option, farmers become entirely exposed to the highly volatile, expensive, and labor-intensive market of fresh produce.8
Harms rural agricultural hubs. While large cities often have many sources of employment, rural areas that are more focused on ranching, feedlots, dairies, forage sales, and the transport of livestock – would suffer from a wholesale loss of water.9
Massive Water Savings: Forage crops are incredibly water-intensive. Completely retiring the water rights of a significant portion of Lower Basin alfalfa fields would easily save 1 to 2 million acre-feet of water annually
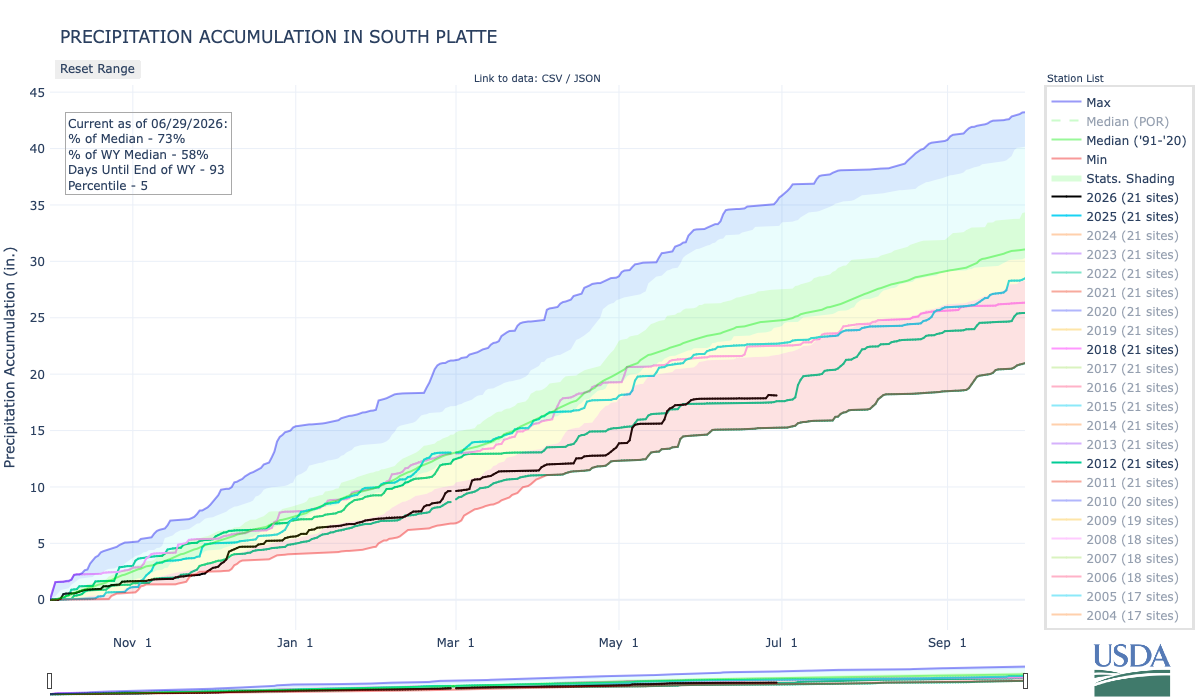
Below is the Precipitation Accumulation in South Platte graph from the NRCS for June 29, 2026. Precipitation is at 73% of the median (no change one week) and 58% of the water year median (up 1% one week), this morning. There are 93 days left in the water year.
There is a slight chance for showers and thunderstorms Sunday in the central mountains, otherwise breezy and warm. There is a slight chance for showers and thunderstorms Sunday in the northern mountains, otherwise breezy and warm. There is a slight chance for showers and thunderstorms Sunday down here, about 101 miles from Leadville, near the Willow Fire. From the Summit Daily: “A wildfire that grew to more than 1,000 acres in a matter of hours near Leadville in the evening Sunday, June 28, sent smoke rolling into Summit County and led emergency officials to ask residents not to call 911 unless they detect a distinct column of smoke or flames. Summit County’s emergency alert system notified residents shortly before 6 p.m. that smoke from what has been dubbed the Willow Fire had entered the county and may remain visible through the evening and coming days…The Willow Fire ignited Sunday afternoon around 3:30 p.m. on U.S. Forest Service land near Twin Mounds below Mount Massive — about two miles northwest of the Leadville National Fish Hatchery, according to the fire detection app Watch Duty and the Lake County Office of Emergency Management. Initial estimates placed the fire at three to five acres, but by around 4:38, incident commanders estimated it had nearly quadrupled in size, according to Watch Duty. Around 5 p.m., firefighters shifted focus toward evacuating residents near Turquoise Lake and the hatchery ahead of the advancing fire. By Sunday evening around 6:50 p.m., Watch Duty and Egp.Wildfire.gov estimates the Willow Fire has grown to 1,066 acres.”
Willow Fire making itself known down here in Salida:
Here’s a look at the 7-Day Colorado precipitation map through June 28, 2026 from the High Plains Regional Climate Center. Precipitation in the South Platte Basin along the Continental Divide of the Americas ranged from 0.00” to 2.00”.
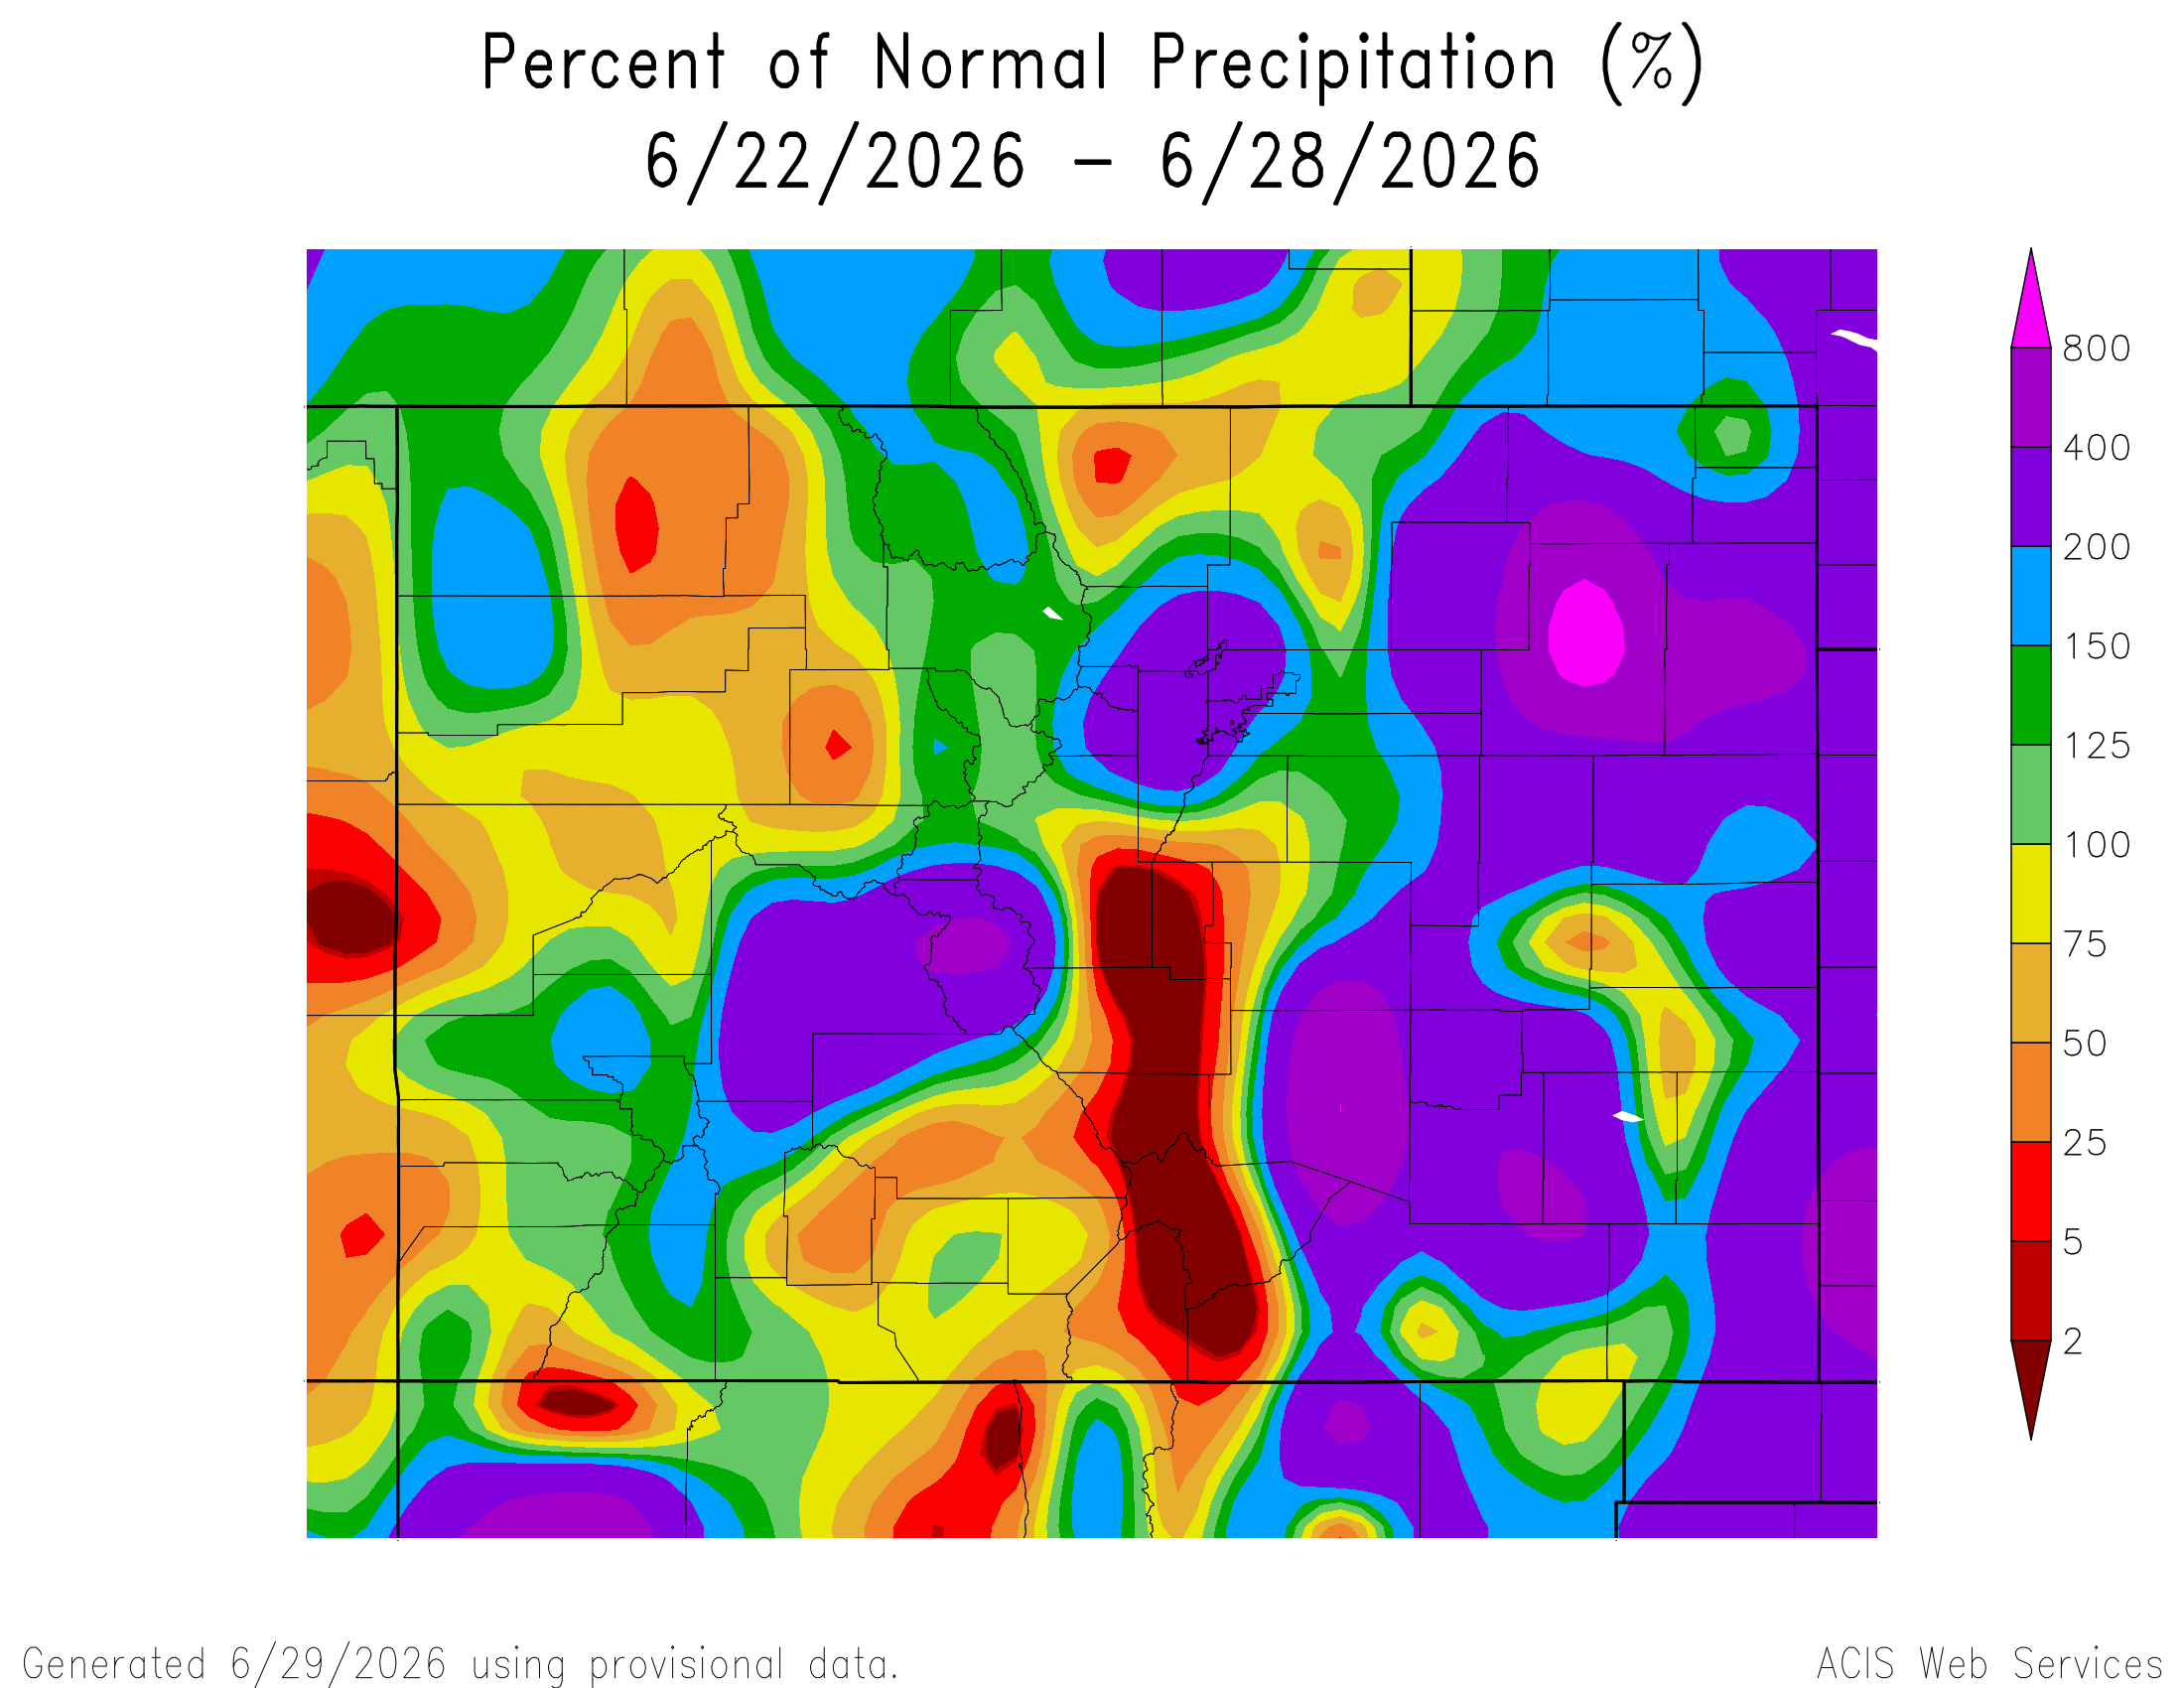
Here’s the 7-Day percent of normal precipitation map through June 28, 2026 from the High Plains Regional Climate Center. Precipitation in the South Platte River Basin along the Continental Divide of the Americas ranged from 5% to 400% of normal.
Here’s the 7-Day Quantitative Precipitation Forecast issued June 29, 2026 by NOAA. Precipitation is anticipated for the mountains of the South Platte River Basin and may total 0.01”.
Below are the 8-14 day outlooks from the Climate Prediction Center, issued June 28, 2026, for temperature and precipitation, for the week starting July 6, 2026. The CPC expects above normal temperatures and near normal precipitation for the mountains of the South Platte River Basin.
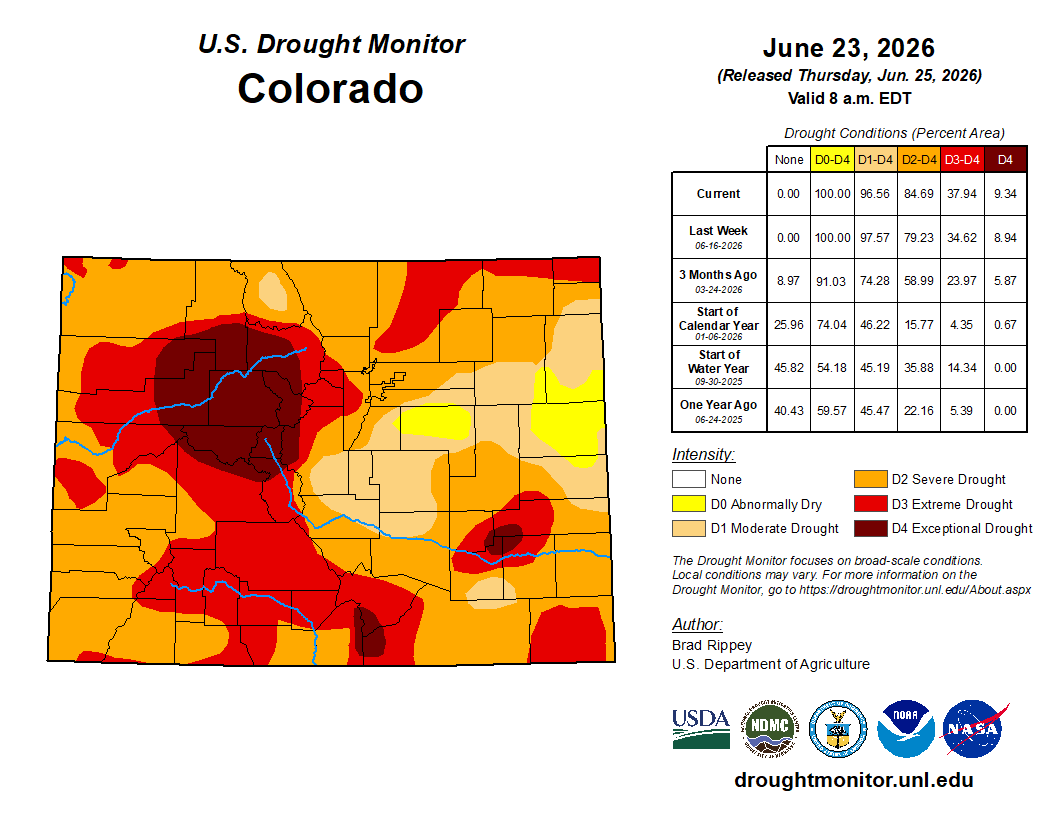
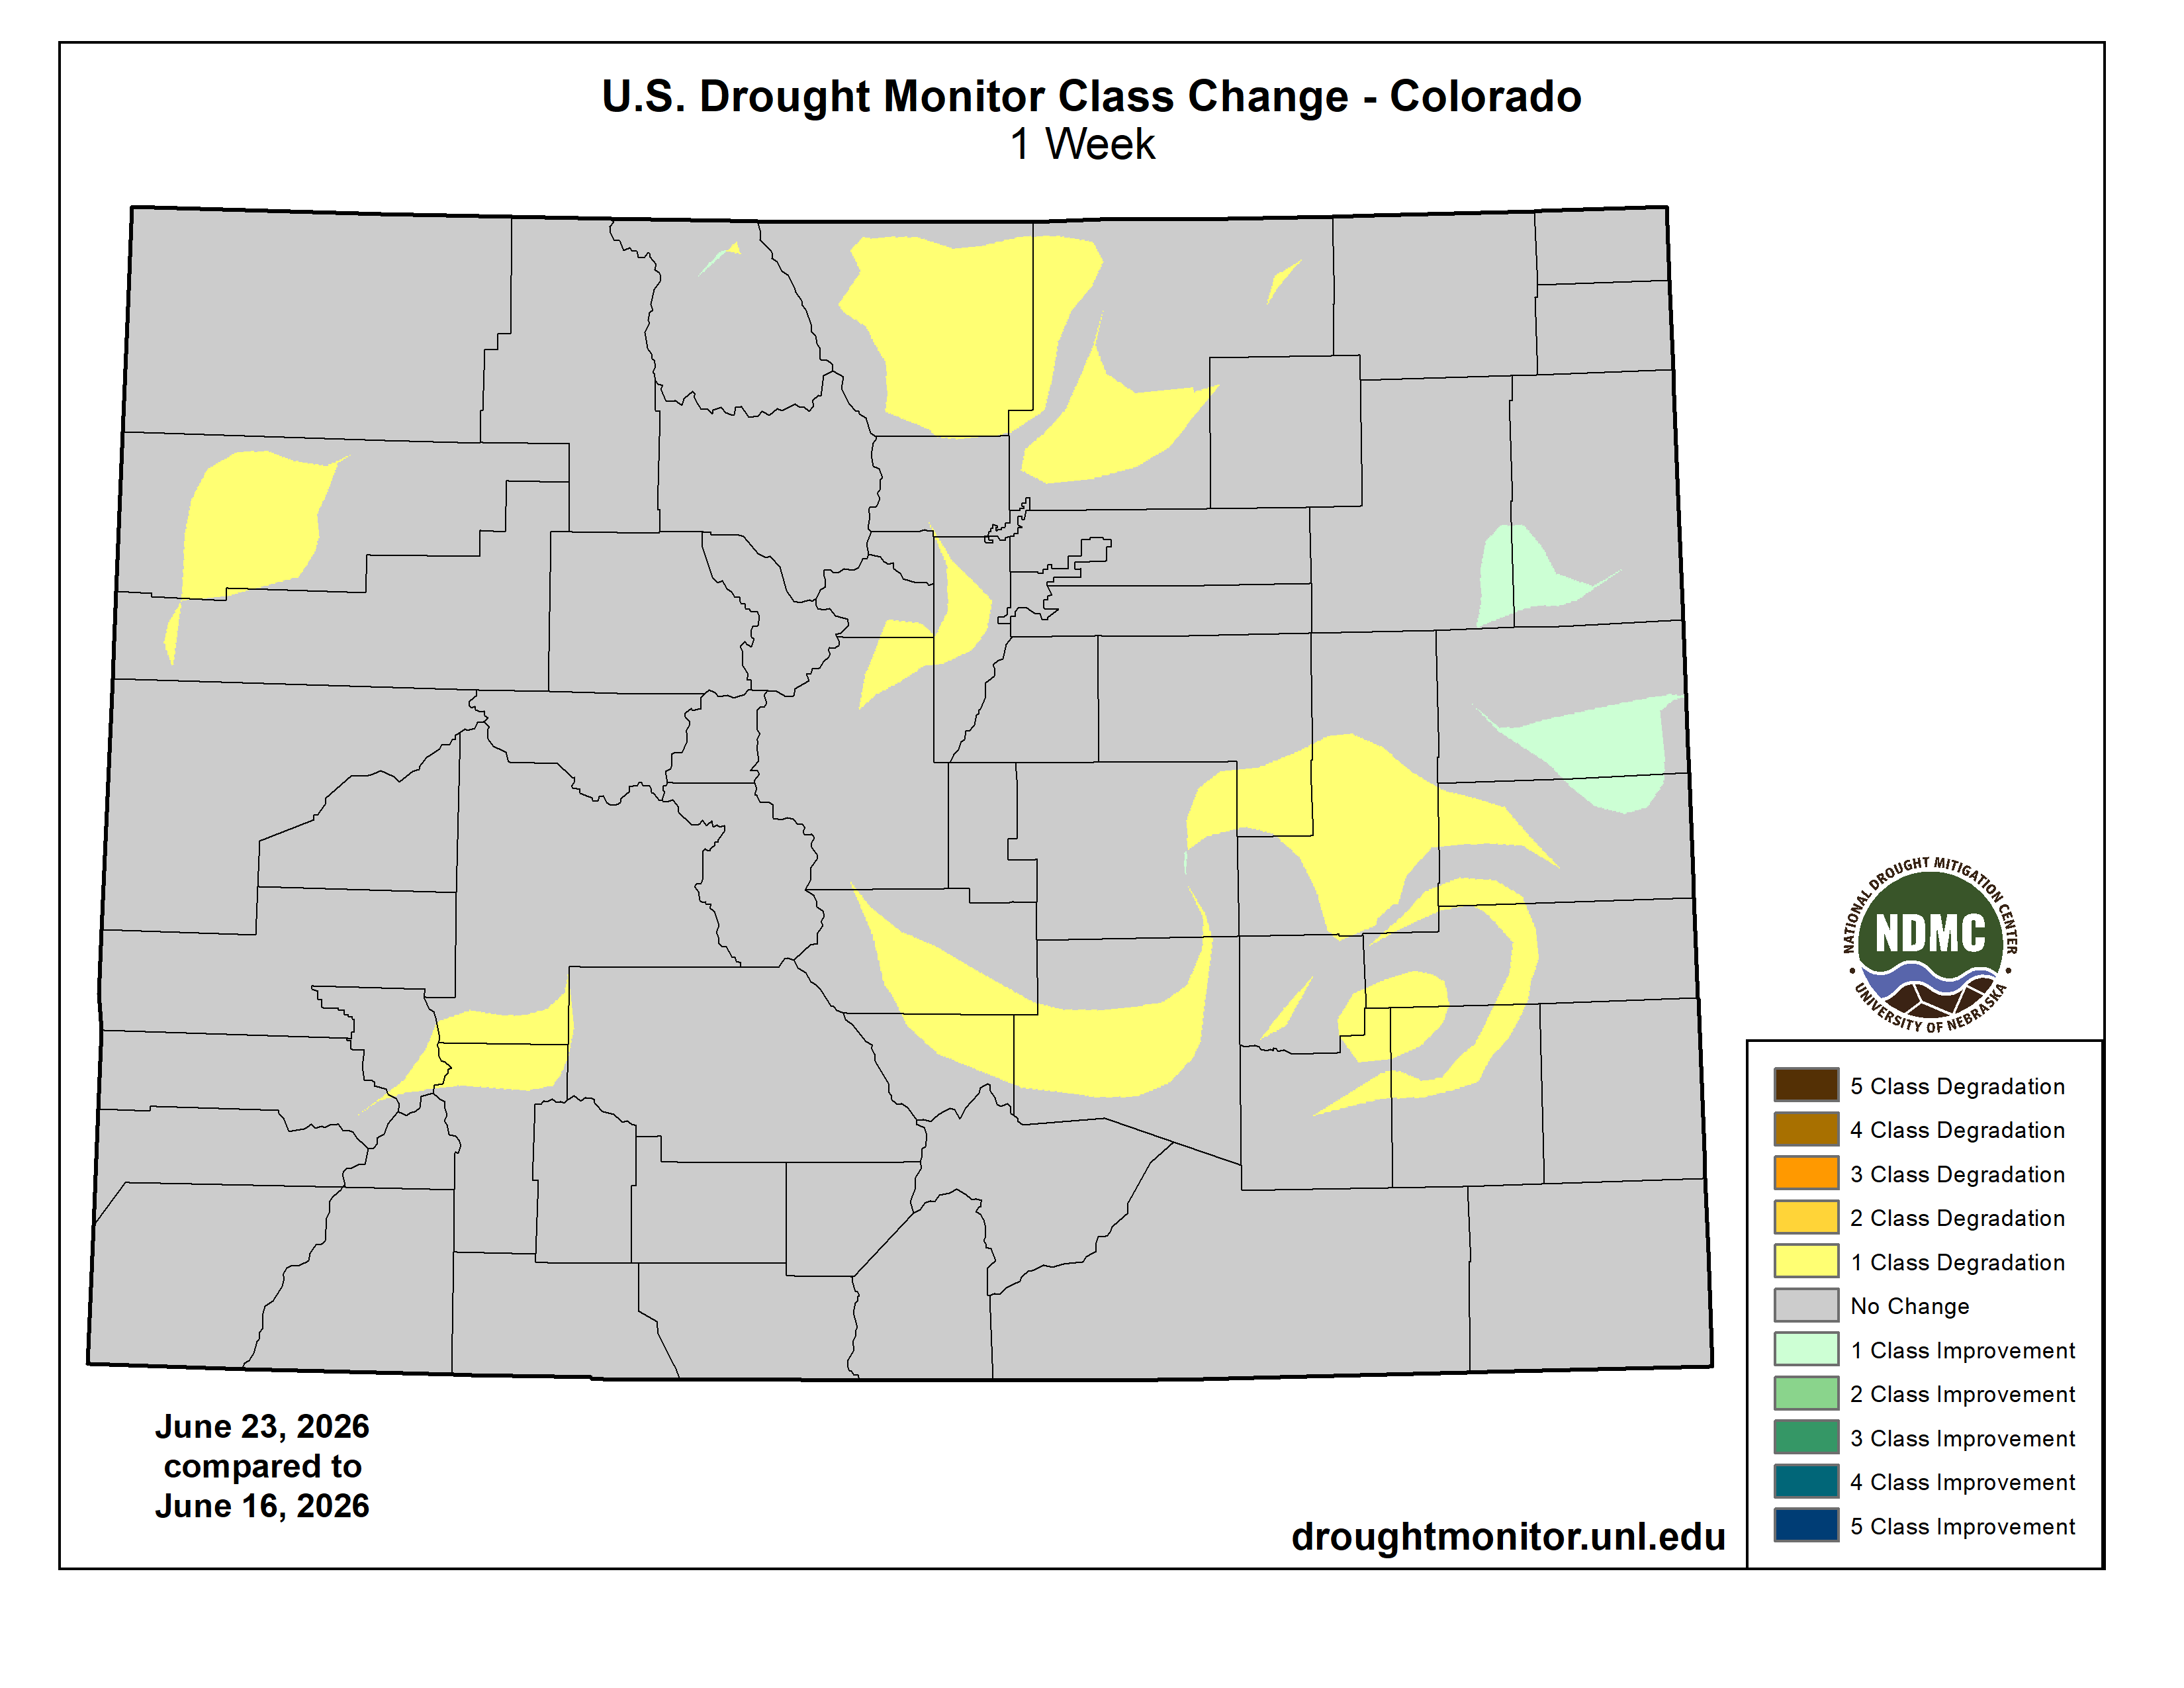
Below is the Colorado Drought Monitor map from June 23, 2026. There were one class degradations in Larimer, Weld, Jefferson, Clear Creek, and Park counties. Drought and abnormal dryness covers 100% of Colorado. The South Platte Basin is experiencing Abnormally Dry, Moderate, Severe, Extreme, and Exceptional drought conditions.
Colorado Drought Monitor map June 23, 2026.
Below is the Colorado Drought Monitor one week change map ending June 23, 2026.
Colorado Drought Monitor one week change map ending June 23, 2026.
Here’s the US Drought Monitor Map from last week along with the one week U.S. change map.
US Drought Monitor map June 23, 2026.
US Drought Monitor one week change map ending June 23, 2026.
For roughly 80 years after the Compact was signed, the prospect of a Compact call was purely theoretical. Then the Millennium Drought set in. By 2005, the two flagship reservoirs on the Colorado River — Lakes Mead and Powell — were half empty.
The drought was pushing the river’s flows closer to a Compact violation trigger, making the risk of a call by the Lower Basin a growing probability. The Lower Basin, particularly Arizona, was insisting on guaranteed releases of water from Lake Powell. And because Colorado has the biggest share of the river within the Upper Basin and uses a greater portion of its apportionment than the other upstream states, it is most at risk. It began searching for a way to slip out of the legal noose of a Compact call.
In September 2005, the seven states’ top negotiators met in Albuquerque, New Mexico. During a lunch break, Colorado’s team made its pitch. The state’s negotiators proposed that the Lower Basin waive its right to force a downstream delivery through a Compact call. In exchange, the Upper Basin states would limit their water use to less than what’s strictly apportioned in the Compact, thereby reducing potential demand in the headwaters of Colorado and Wyoming that supply nearly the entirety of the river’s flow.
But in the midst of a climate change-fueled megadrought that has already robbed the river of at least 20% of its flows, experts say temporary measures no longer cut it. Water managers are reckoning with the reality that the river will probably never again deliver what was promised a century ago by the Colorado River Compact. The demand for water now far outstrips the dwindling supply.
“Are we going to continue to spend hundreds of millions of dollars a year and not have a permanent solution?” said author and Colorado River expert Eric Kuhn. “I think, at some point, it just makes economic sense to go ahead and say, ‘Let’s buy out the existing demand.’”
Map of the Colorado River drainage basin, created using USGS data. By Shannon1 Creative Commons Attribution-Share Alike 4.0
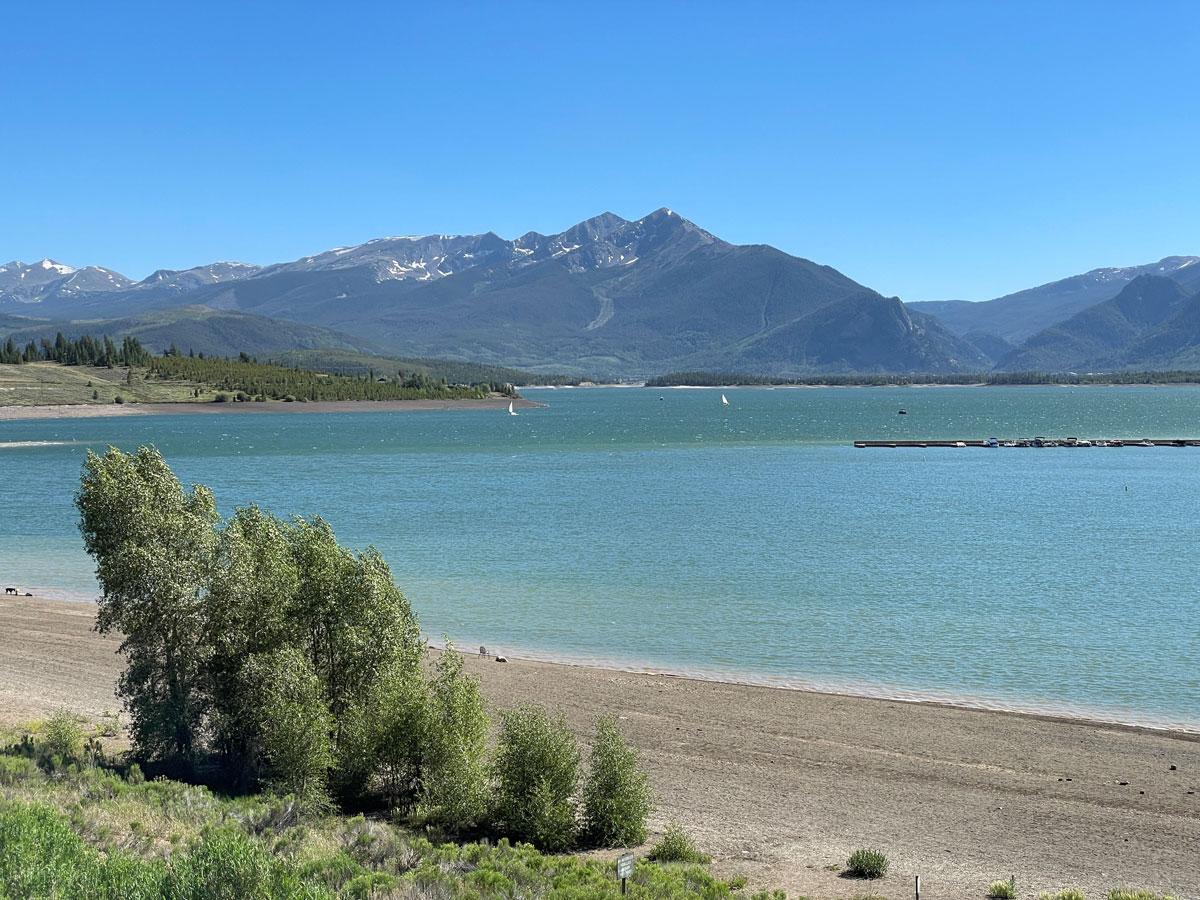
Dillon Reservoir reached 80% capacity on June 17, the highest elevation it is expected to see in 2026. Dillon is the largest reservoir in Denver Water’s collection system, storing roughly 38% of the utility’s water supply. Photo credit: Denver Water.
Water levels in the Dillon Reservoir have now peaked for the summer, having reached a maximum 80% capacity on June 17 before decreasing over the coming months. It’s a 19.5% drop — as well as an earlier peak — compared to last year, when water levels reached 99.5% capacity on June 27, 2025.
“Last year, we were about 1,000 acre feet from full,” said Nathan Elder, Denver Water’s water supply manager. “This year will be about 50,000 acre feet from full. So that’s a pretty significant amount down.”
Elder said that this is a “bottom-four or five year for Dillon Reservoir storage,” due to this winter’s record-low snowpack, but is still currently far from the lowest water levels that the reservoir has ever seen.
“The lowest level it got was about 35% full, and that was in the spring of 1978 that followed the really bad, really dry year of 1977,” Elder said, noting that 1977’s snowpack was actually higher than this year’s, despite resulting in lower water levels. “We’ve seen it lower again, following a low snowpack in 1981 and then also in 2002 going into 2003.”
Elder said that part of the reason levels have been able to hold steadier than in other drought-afflicted years is because of lower demand for the reservoir’s water, particularly from consumers on the Front Range.
“People are aware of the drought restrictions in place so far this year, compared to normal weather,” he said. “We’ve seen our demands down about 18% and we’ve seen a really large decrease in demand from the past drought in 2002.”
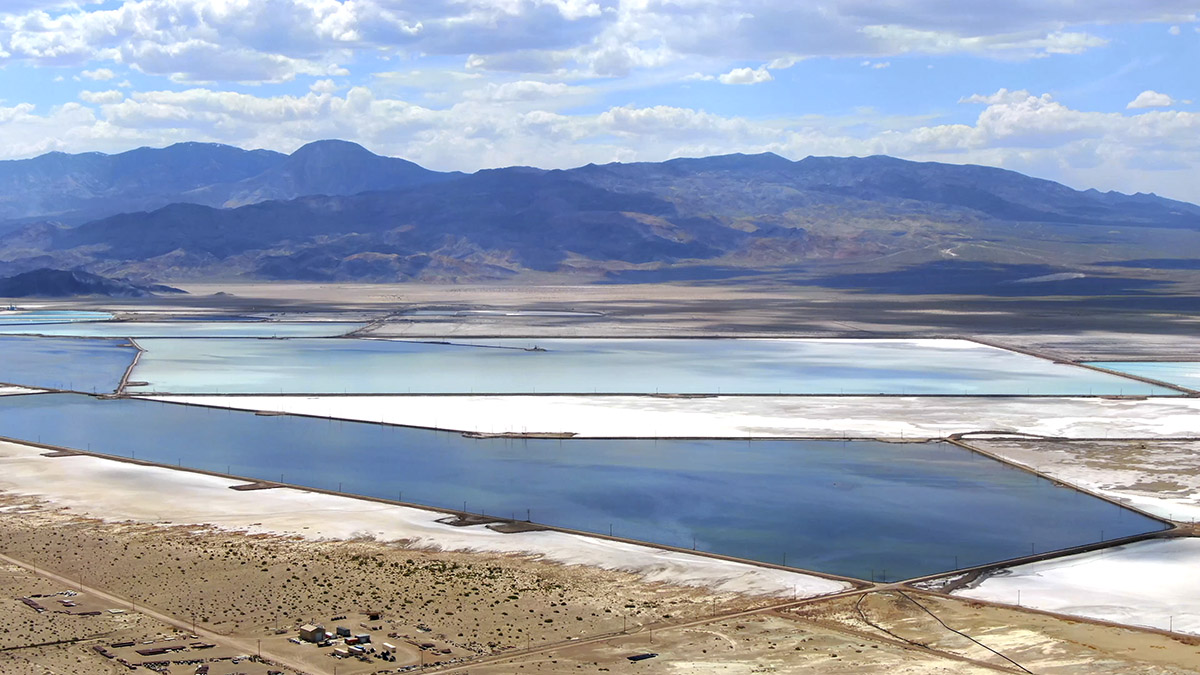
A lack of available groundwater is threatening the future of domestic lithium extraction. Lithium is a mineral that’s currently an essential component for the storage of clean energy. 1
Aerial photograph of evaporative lithium ponds at Silver Peak Nevada. Photo by Robert Marcos.
By Robert Marcos, photojournalist
A study conducted by Jennifer Dunn – a professor of chemical and biological engineering at the Center for Engineering Sustainability and Resilience at Northwestern University in Illinois, said that the future of water availability may constrain whether new lithium mines will have sufficient water to operate.2
Three lithium operations in the American West that could be negatively affected by water restrictions –
Silver Peak, Nevada
Silver Peak – which is operated by Albemarle Corporation, is the only active producing lithium mine in the United States. Silver Peak uses evaporative technology that pumps lithium-rich geothermal brine from underground aquifers into a massive network of shallow, open-air surface ponds, where natural solar energy slowly evaporates the water which concentrates the dissolved lithium, which is later processed. The site has been in operation since the 1960s. Albemarle, which acquired the mine in 2015, has begun an expansion which will drastically increase their domestic production capabilities.3 Because Silver Peak’s extraction process relies on pumping billions of gallons of underground brine into solar evaporation ponds, a reduced amount of groundwater directly affects production capacity. The ongoing depletion has dried up local monitoring wells, sparking intense pushback from environmental groups, county officials, and competing mining projects.4
Salton Sea, California
Controlled Thermal Resources is developing the Hell’s Kitchen project at California’s Salton Sea, an innovative facility designed to utilize direct lithium extraction to recover battery-grade lithium from superheated geothermal brines while simultaneously generating clean, baseload electricity.5 Unfortunately this high-technology process still requires a lot of fresh water. It requires billions of gallons of freshwater primarily for evaporative cooling to manage the extreme temperatures of the geothermal fluids, and for purification and chemical washing to scrub impurities like iron and manganese from the extracted lithium. Additionally, massive amounts of freshwater are consumed during steam generation and the final chemical transformation needed to synthesize the lithium into a highly pure, battery-grade lithium hydroxide product.6
Thacker Pass, Nevada
The Thacker Pass mining operation is located in Humboldt County, Nevada. It’s owned by a joint venture between Lithium Americas (62%) and General Motors (38%).7 The facility will extract lithium via open-pit “hard rock” mining and will then process the claystone ore using a sulfuric acid leaching method, in order to produce battery-grade lithium carbonate.8 Fresh water is required at multiple opertional stages, though the Lithium Americas project has plans to recycle over 85% of the water that’s required, which includes:9
Ore Processing & Leaching: Water acts as a carrier for claystone ore and is consumed during sulfuric acid production, leaching, and downstream neutralization to isolate lithium carbonate. 10
Evaporative Cooling: Significant quantities of water evaporate during the cooling phases of chemical processing and on-site power generation. 11
Dust Mitigation: Water is continuously sprayed on open-pit mining roads, ore stockpiles, and waste piles to suppress hazardous dust. 12
Tailings Management: While filter presses squeeze out water for reuse, a portion of water remains permanently trapped as moisture within the dry-stack tailings pile. 13
The Thacker Pass operation’s difficulty in securing fresh water stems from a series of high-stakes legal and logistical disputes regarding regional groundwater depletion. The mine’s plans to extract up to 5,200 acre-feet of water annually draw from the heavily over-allocated Quinn River Valley aquifer, prompting multi-year legal challenges from environmentalists, Indigenous groups, and local senior water rights holders like rancher Edward Bartell, (who documented declining natural spring levels) and successfully triggered a state-issued cease-and-desist order that temporarily halted unauthorized pumping in mid-2025. While Lithium Americas ultimately bypassed immediate pumping blocks by purchasing Bartell’s water rights in an August 2025 court-approved settlement and securing a favorable Nevada Supreme Court ruling in 2026, state regulatory restrictions still forbid them from drawing water close to the mine site. Consequently, the company has faced soaring infrastructural challenges, forcing them to construct a costly, 8-mile-long uphill pipeline to transport their newly relocated water supply from the valley basin up to the active construction site. 14
America’s Civil War in 1861 overshadowed an earlier conflict in the American West – The Utah War. In 1857 Congress funded a reconnaissance mission that sent a steamship up the Colorado River in support of the U.S. Army’s plan to invade the Utah Territory and to depose Brigham Young, its governor.
by Robert Marcos, photojournalist
The Mormons, first led first by Joseph Smith and later by Brigham Young, were systematically driven from a series of American settlements by hostile neighbors and governmental action between 1831 and 1847. Their forced migration began in Kirtland, Ohio, and Jackson County, Missouri, where religious friction, economic disputes, and political rivalries sparked violent expulsions which included Missouri’s infamous Extermination Order in 18381. The Mormon refugees found temporary asylum in Nauvoo, Illinois, but the murder of Joseph Smith in 1844 reignited anti-Mormon violence that resulted in February 1846 with a Mass exodus out of the United States. An initial group of 1,650 Mormon pioneers traveled westward across the Great Plains in grueling conditions until they reached the Great Salt Lake in July 1847, which they hoped would become a permanent sanctuary for them. Over the next twenty years as many as 70,000 additional Mormons moved into the region which Mormons alternatively called the “State of Deseret” or “Zion”.
Portrait of Brigham Young, the second President of the Church of Latter Day Saints, provided by The Church of Jesus Christ of Latter-day Saints.
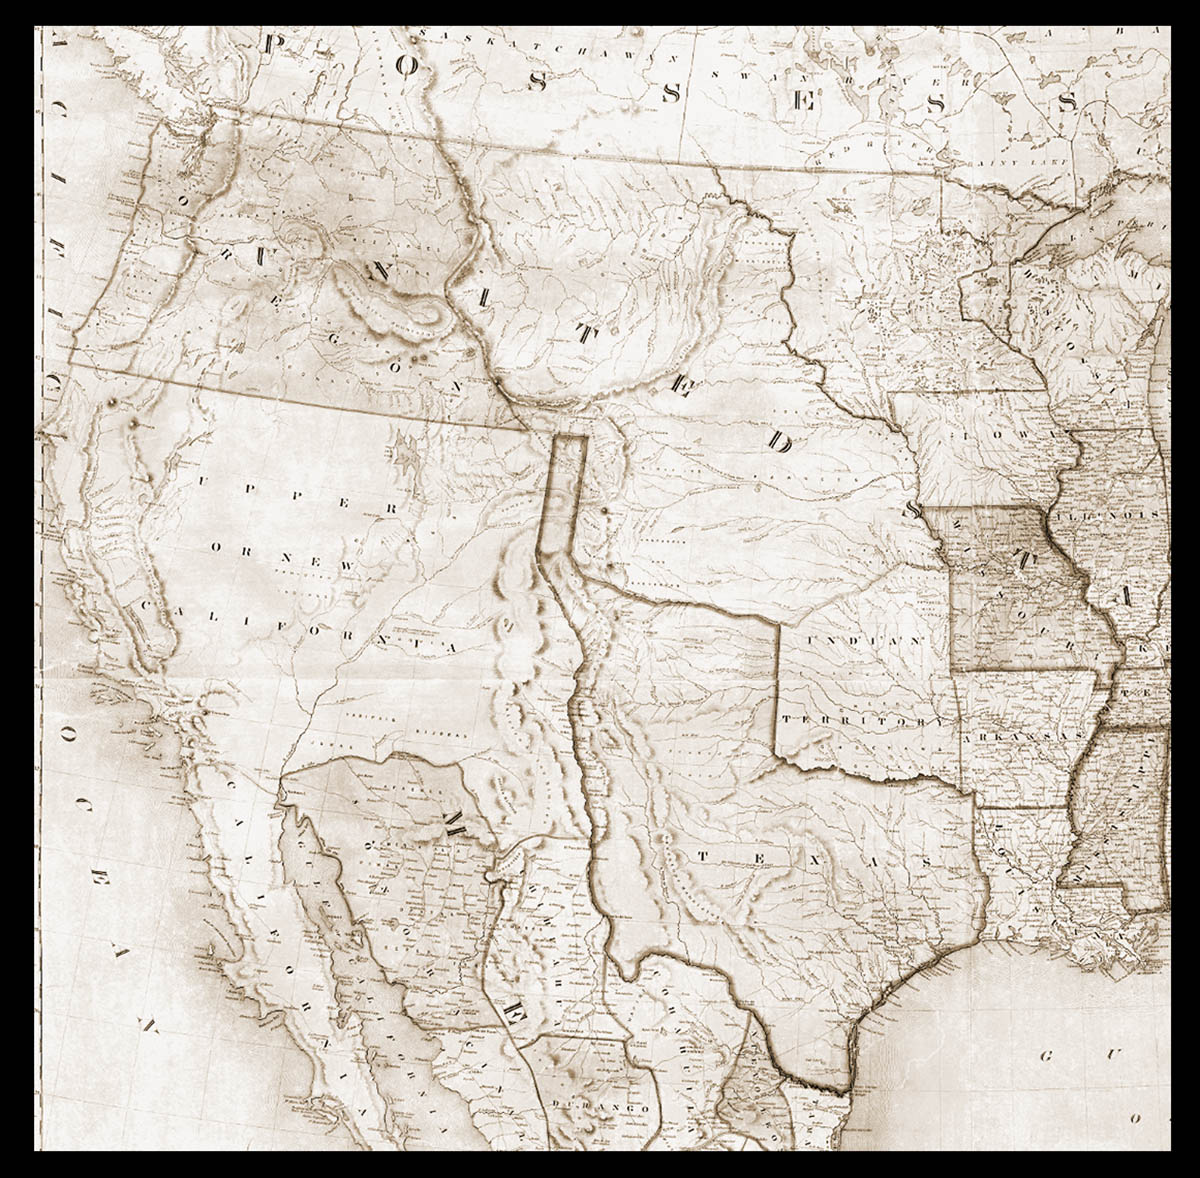
Historic Maps show the dramatic changes taking place in the American West
Maps that show the American West in 1847 reveal a dynamic landscape that was on the brink of a profound transformation. Texas had been given statehood in 1845, Oregon was incorporated as a territory in 1848, and California became a state in 1850. The end of the Mexican-American War and the signing of the Treaty of Hidalgo had finally opened the door for the U.S. to expand into the vast Indian lands that had previously been claimed by Mexico.
1847 map of the United States shows an enormous (Mexican owned) California and a very strange looking Texas
Congress annexes the Utah Territory
In 1849 Brigham Young proposed that the United States incorporate his massive provisional state, which encompassed almost all of modern Utah, Nevada, and Arizona. Congress rejected his idea and instead created a much smaller Utah Territory. To salve the insult to Brigham Young President Millard Fillmore appointed him as the Territorial Governor. But these federal actions outraged voters in the Eastern half of the United States who claimed that by incorporating Utah as a Territory the federal government had in effect sanctioned polygamy and other practices that voters found repugnant, and they demanded that punitive action be taken to put a stop to it.
President orders the Department of War to invade the Utah Territory
On May 28th 1857, President James Buchanan ordered one-third of the U.S. Armyto invadethe Utah Territory and to depose Brigham Young as its governor. In Utah this action sparked mass hysteria among its citizens, who braced themselves for a full-scale military invasion. In response, the Mormon militiaburned US Army supply trains and practiced “scorched earth” tactics which were highly effective in delaying the arrival of the incoming troops.
In support of the invasion Congress passed an Army Appropriations bill that provided $75,000 for a Colorado River Exploring Expedition that would survey the southern end of the Colorado River along with Utah’s southern borders. The Army wanted to find out about the river’s ability to convey troops and supplies from the south, and they also wanted to eliminate a potential escape route that Brigham Young and his militia might make use of.
The $75,000 which Congress had provided was to spent to build and transport a custom steamship that would be rugged enough to survive collisions with rocks and other obstacles known to exist in the Colorado River. The U.S. Secretary of War John B. Floyd appointed Lieutenant Joseph Christmas Ives to command the expedition and to oversee the construction and the transport of the ship they would use to steam up the Colorado River.
The steamboat Cochan on the Colorado River near Yuma, Arizona in 1900. Photograph provided by Wikipedia.
The Construction and unbelievable transit of the iron-hulled steamship
Lieutenant Ives chose to have his custom-made 54-foot long steamboat built in Philadelphia. After a successful trial run on the Delaware River, the heavy metal vessel was disassembled, loaded in crates, and transported to a steamship which that brought it south to Colon, Panama. From Colon it was hauled overland on the Panama Railroad to a port on the Pacific where it was loaded onto another steamship bound for San Francisco. Once there the heavy crates were moved to the schooner Monterey, which was sent racing back down the Pacific coast, around the tip of Baja California, then northward to the top of the Sea of Cortez. The schooner would’ve slowed to a crawl as it approached Robinson’s Landing, its destination, where the little iron-clad steamship would be reassembled then finally put to work.1
The Explorer begins its journey with 27 heavily-armed men on board
Thirty days later the Explorer departed from Robinson’s Landing with Lieutenant Joseph Christmas Ives in command and a heavily-armed 27-man crew. David C. Robinson – an experienced sailor who’d served on the riverboat General Jesup piloted the small vessel. Robinson’s ongoing challenge was making headway against fierce oncoming currents that were hellbent on driving all of them back to the Sea of Cortez. There were also shifting sandbars sometimes just inches below the water level, and dramatic tidal bores that rose up from behind them twice a day as the high tides poured in. But thanks to Robinson’s diligent piloting the ship and its crew arrived at Fort Yuma intact – but embarrassed – because Robinson drove them into a sandbar in full view of the hundreds of onlookers who’d gathered at the dock to watch their arrival. Adding insult to injury, upon docking Lieutenant Ives learned that another riverboat Captain George Alonzo Johnson, had beat them by becoming the first steamship captain to have made it all the way north to the infamous Black Canyon, (where Hoover Dam sits now).2
The Explorer Expedition spent two weeks at Fort Yuma before launching northward into (what would’ve been) uncharted territory. Members of the crew who were experienced with cartography took notes of the geography and the river conditions as the Explorer made its way slowly upstream. The crew pulled over multiple times to see what they could learn from Native American tribes who were camped along the river’s shoreline. Nobody knows if Lieutenant Ives was aware that when they passed the confluence of the Gila River they were in the same spot where Hernando de Alarcon had anchored318 years earlier when he deposited supplies for members of the Coronado Expedition.3
As the crew of the Explorer continued up the Colorado River they observed the landscape transform into a dramatic, forbidding chasm dominated by towering walls of dark, volcanic rock. Lieutenant Joseph Christmas Ives and his men noted that the river grew increasingly narrow, swift, and treacherous, forcing the small steamboat to battle fierce rapids and other hazards lying just beneath the surface. The crew included the geologist John Strong Newberry and the illustrator Balduin Möllhausen, who documented the striking, raw geological formations and the unique desert vegetation that they saw clinging to the sheer cliffs. The crew felt an overwhelming sense of isolation and awe as the sun disappeared every day behind monumental cliffs that seemed to press down on them. Lieutenant Ives famously remarked the “profitless, chaotic locality seemed intended by nature to remain forever unvisited and unmarred by civilization“.4
The voyage ended abruptly on March 8, 1858, when the Explorer struck a sunken rock in the infamous Black Canyon, at the exact spot where Captain George Alonzo Johnson had chosen to turn around, four months earlier. The violent collision dislodged ship’s iron bow, and after reaching the shore the crew realized that their steamboat could travel no further. Lieutenant Ives and several men proceeded to row a small skiff another thirty miles upstream. They mapped the mouth of the Virgin River. The crew finished the expedition by hiking overland to Fort Defiance in Northwestern Arizona.
Meanwhile – theUtah War had come to a complete standstill after harsh winter conditions forced the U.S. Army and the Mormon Brigades to hunker down for the winter. The delay provided time for Thomas Kane – a prominent civilian mediator, to negotiate between both parties which ultimately ended with a peaceful resolution being reached. The Mormons agreed to submit to federal authority, and in exchange they received a full pardon from President James Buchanan.
AlthoughBrigham Young continued as the president of the The Church of Jesus Christ of Latter-day Saints, he stepped down as the Territorial Governor after the Utah War ended, and he passed away on August 29, 1877. The federal government admitted Utah as a stateon January 4, 1896, after decades of denial due to the Mormon practice of plural marriage. The polygamy issue was finally resolved in 1890, when Church President Wilford Woodruff issued a manifesto that declared that the church had ceased teaching and practicing plural marriage. This religious shift, combined with Utah later writing a strict anti-polygamy clause into its 1895 state constitution, finally satisfied federal demands for cultural assimilation and cleared the path for statehood.5
Portrait of Hernando de Alarcon on the left, and an example of a Spanish “tender” or “begantina”with a lateen sail and rowers on the right.
by Robert Marcos, photojournalist
California got its name from a popular Spanish romance novel that was published in 1510. The book, “Las Sergas de Esplandián” described California as a mythical island that was inhabited by Amazons and was filled with gold and pearls. So when Hernán Cortés arrived at the southern end of the Baja peninsula in 1535, its elongated appearance led him to believe they had found the legendary island. This misconception became so deeply embedded that European cartographers continued to publish maps that showed California as an island wellinto the 18th century.
Five years after Cortez’s expedition the Portuguese navigator Hernando de Alarcón set sail from Acapulco with two Spanish caravels, a tender, and 45 crewmen and headed back to the Sea of Cortez. Alarcón’s mission was to transport supplies to the 2,000 man Coronado Expedition that had left from the State of Nayarit, in Mexico, three months earlier. Alarcon and his men were ordered to rendezvous with a detachment from the Coronado Expedition at the confluence of the Colorado and Gila Rivers, just north of present-day Yuma.
Map that shows California as an island, which was created in 1657 by Nicolas Sanson, a French cartographer.
Alarcón and his vessels enjoyed favorable winds and arrived at the northern edge of the Sea of Cortez in early August. Alarcón quickly determined that California was in factnot an island because there was no open-water passage that led back to the Pacific Ocean. The men made their way up through the Colorado river delta and by doing so made history by becoming the first Europeans to explore the lower Colorado River. But before long the conditions became perilous, as the ships encountered a terrifying natural phenomenon known as a tidal bore. The massive wall of water that was caused by incoming ocean tides colliding with the river’s outward current, nearly destroyed the fleet. The raging waters ran the caravels aground, tilting them dangerously and threatening to smash the hulls. But through strict discipline and skilled seamanship the crew somehow managed to stabilize the vessels and survive the furious tides.
When the river finally became too shallow to continue Alarcon ordered for the larger ships to be anchored, then he launched “tenders” (called Bergantinas). Historic illustrations show these small ships as having a single “lateen” sail and oar placements for rowing. Alarcon and a contingent of sailors then began the exhausting effort of rowing northward, against the river’s powerful current. Alarcon stopped at native villages along the way to converse with Indigenous groups and gather intelligence. Again – his primary objective was to rendezvous with a detachment of soldiers from the Coronado Expedition at the confluence of the Colorado and Gila Rivers. The soldiers would then use horses and wagons to transport the much-needed cargo back to the main column of Coronado’s expedition, which had continued to push northward to explore what is now the United States.
Weeks later Alarcón and his men finally reached the Gila River, near modern-day Yuma. But vastness of the terrain and the lack of communication tools prevented the two forces from meeting. When Alarcón finally because tired of waiting he buried a hoard of supplies and letters, at the base of a marked tree, then sailed back to his ships that were anchored in the delta. Several weeks later Captain Melchior Diaz found Alarcon’s letters and the supplies, and would’ve carried out his mission had he not been killed in an accident two days later. But that’s a story for another time…
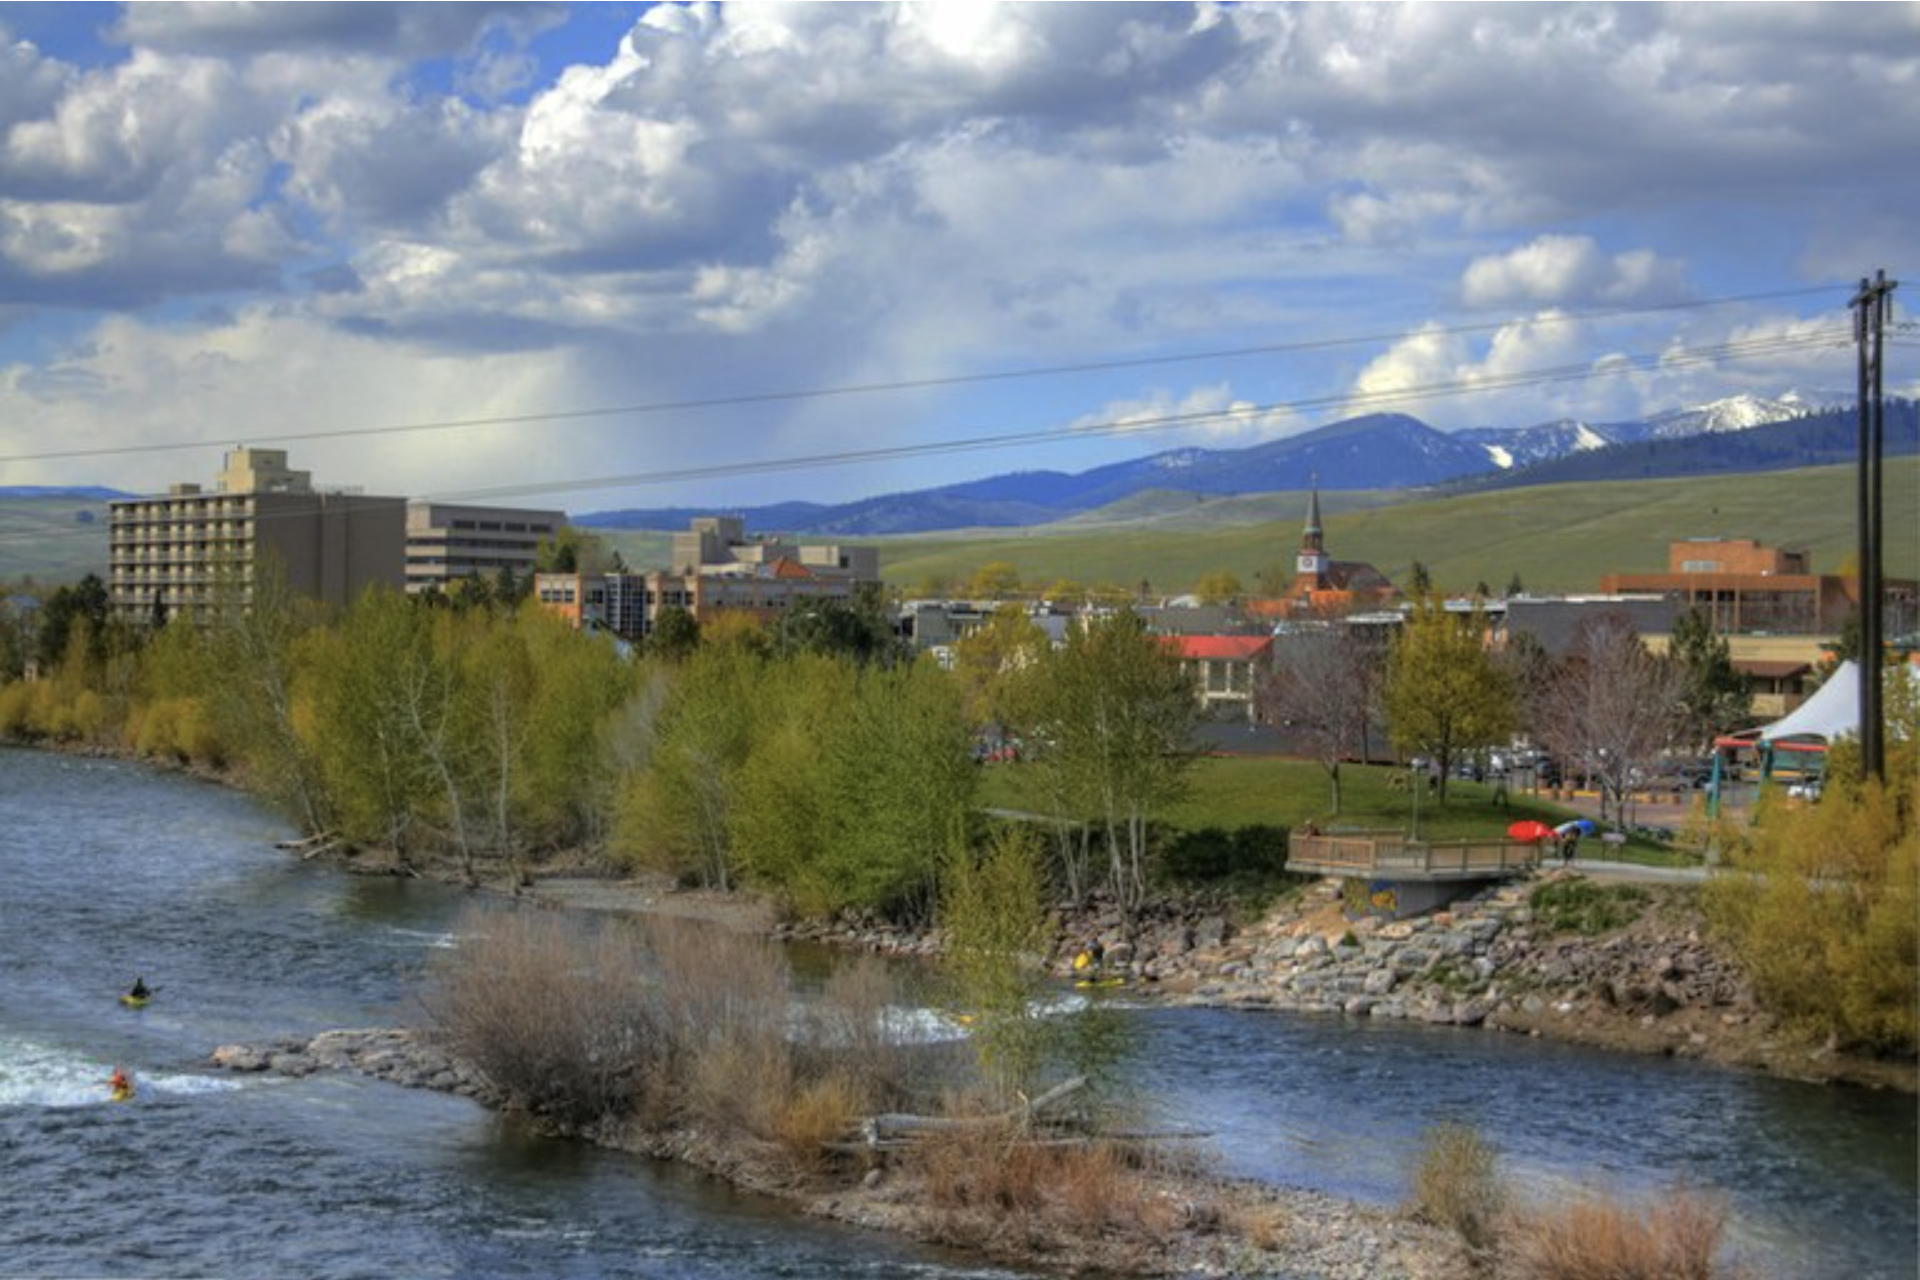
Kayakers enjoy the Clark Fork River next to downtown Missoula, Montana. Photo credit: Micah Sheldon/Flickr
NOTE: Our wedding anniversary was on June 16th.
Mrs. Gulch lived long enough to celebrate our 50th wedding anniversary. I don’t think you stay together that long unless you become close friends.
We were a work romance. She was introduced to me early on a Sunday morning where I worked at the Safeway at 44th & Lowell in Denver. She was the first girl hired there to bag groceries and other duties. As the Assistant Manager and Mrs. Gulch walked away I noticed that she was holding her very long brown hair back with a hair clip made out of rawhide in the shape of a peace sign. Since this was during the Viet Nam war the peace sign was very symbolic.
We became good friends, then romantically involved, which despite some pressure to split up from her parents, we stuck it out and got married in 1973.
I think we cemented our friendship when we moved to Missoula. We really needed to depend on each other since our support folks were back in Denver. We set out in our VW bus driving to college towns, looking for a graduate school. We wandered through college towns, Laramie, Grand Junction, Pocatello, Idaho Falls, Bozeman, Butte, and then drove down the Clark Fork River, through the Hellgate, into Missoula and decided try out the University of Montana. Those western sunsets in the Rocky Mountains will get you every time.
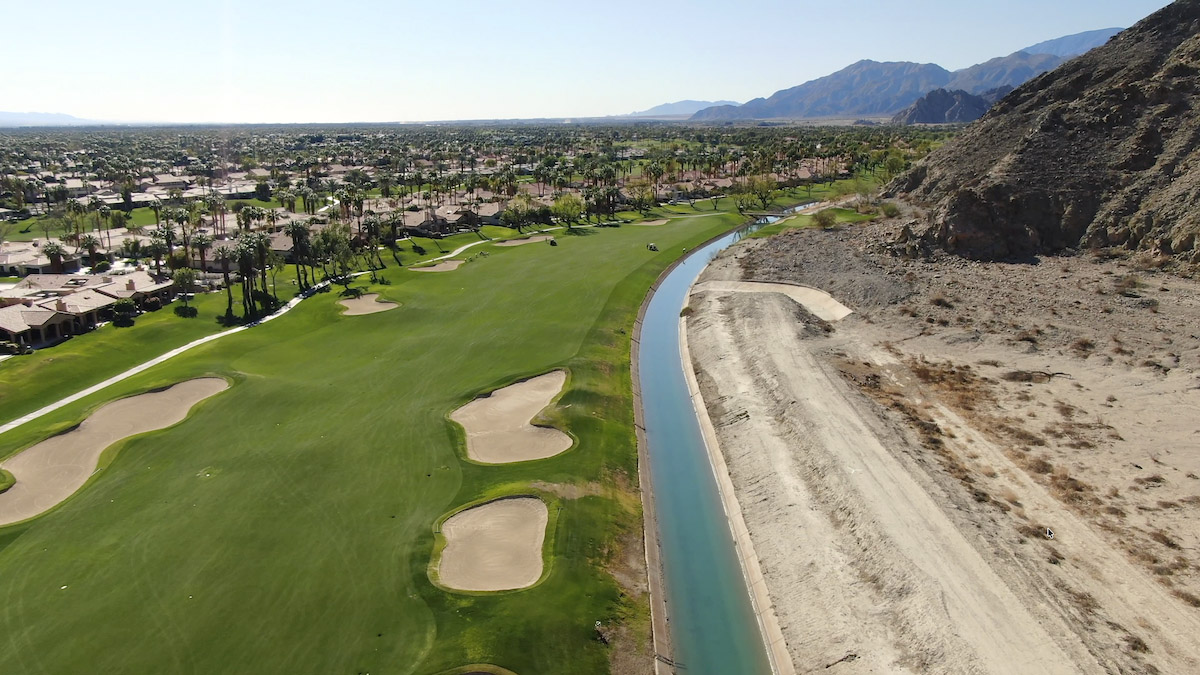
The San Andreas Fault runs down the middle of the Mecca Hills, (shown). The Coachella Canal passes nearby. Photo by Robert Marcos.
by Robert Marcos, photojournalist
Last week the University of Hawaiʻi at Mānoa released a study that reported that tectonic stress along the San Andreas and San Jacinto faults had reached its highest levels in 1,000 years.1
Key Findings of the Report
Critical State: The research, published in the Journal of Geophysical Research: Solid Earth, reveals that stress levels have accumulated to unprecedented heights because more than 160 years have passed since the region’s last major fault rupture. 2
The “Earthquake Gate”: Scientists identified the Cajon Pass—where the two fault lines intersect—as a critical junction. This area could either halt a rupture or facilitate a massive joint rupture across both systems simultaneously, creating a significantly more destructive earthquake than a single-fault event. 3
Impact Areas: A dual-fault rupture would severely threaten densely populated Southern California regions, including Los Angeles, San Bernardino, Riverside, and the Coachella Valley. 4
Expected Physical Damage
The San Andreas Fault bisects the city of Coachella. The section of the fault that extends through Coachella has a high probability of rupturing in the next 30 years. The resulting earthquake will be accompanied by extreme seismic shaking and lateral rupture of the ground that locally may exceed 20 feet. Other earthquake-induced hazards expected in the area include ground deformation due to liquefaction and slope failure. Earthquake scenarios indicate the infrastructure in the region will be damaged extensively by an earthquake on the San Andreas Fault. The water-distribution system especially will be hard-hit but other services, including the transportation network, will also be affected. The Coachella Canal is expected to be damaged by surface fault rupture and ground deformation, with the potential for significant flooding in the Coachella area.5
Hazards for Water Conveyance Systems
The All-American Canal and its 123-mile branch, the Coachella Canal, form a critical water delivery system for southern California’s desert agriculture. However, this infrastructure faces several severe structural, environmental, and public safety threats. 6
San Andreas Fault Proximity: The Coachella Canal directly crosses seismically active zones. Regional hazard models indicate that a major earthquake on the San Andreas Fault is expected to cause severe surface fault ruptures and ground deformation. 7
Catastrophic Flooding: Damage to the canal walls from an earthquake could instantly breach the concrete system, causing rapid, severe flash flooding in surrounding residential and agricultural areas of the Coachella Valley. 8
Immediate Drowning and Public Safety Hazards
The Deadly Trap: The canals pose a massive public safety threat, with well over 140 recorded drownings in the Coachella Canal alone. While the water surface often looks calm, the internal currents are incredibly swift (moving at several feet per second) with powerful undertows. 9
Impassable Features: The canals feature steep, slick concrete walls that make it nearly impossible for a person or animal to climb out once they fall in. They also contain hidden underwater tunnels called “siphons” and automated water-delivery equipment that can trap and drown victims instantly. 10
Smuggler Exploitation: Because the All-American Canal runs parallel to the US – Mexico border, criminal cartels and human smugglers frequently force migrants into the dangerous currents to evade law enforcement, routinely resulting in fatalities. 11
Dairy cow bathing with a shower cap on. Created by Google’s Nana Banana 2.
by Robert Marcos, photojournalist
In terms of actual volume consumed, cattle depend significantly more on Colorado River water than people do. All total, the Colorado River water that’s consumed by the 40 million people who have access to it represents about 18% of the river’s total allocate use. Meanwhile cattle and their forage – specifically alfalfa and hay, use 46% of the river’s allocated use, making livestock the single largest consumer of the Colorado River.1
The Data Breakdown
According to a landmark Nature Communications Earth & Environment study tracking the river’s allocation, the water consumption heavily favors cattle and the production of forage over use by cities. 2
Cattle Feed vs. Cities: Crops like alfalfa and grass hay consume roughly twice as much water as the combined municipal and industrial use of every single city that relies on the river – including massive hubs like Los Angeles, Phoenix, Denver, and Las Vegas. 3
The Agricultural Monopoly: Irrigated agriculture accounts for 52% of the river’s overall water consumption (which includes natural evaporation). Of that massive agricultural share, 62% goes strictly to feeding livestock. 4
Upper Basin Extreme: In the Upper Colorado River Basin (Colorado, New Mexico, Utah, and Wyoming), cattle-feed crops consume 90% of all agricultural irrigation water. This is three times more water than all municipal, commercial, and industrial uses combined in that region. 5
Critical Nuance
Water policy experts note that most of the 40 million people who are said to “depend” upon Colorado River water actually utilize water from a variety of sources: including surface water, recycled water, groundwater, captured rain water, water from state water projects, and in some cases desalinated water. Only five American cities rely solely on Colorado River water: Yuma, Lake Havasu, Bullhead City, Needles, and Green River Wyoming. 6
Las Vegas draws approximately 90% of its water from Lake Mead, making it perhaps the most vulnerable major city to reservoir decline. Phoenix and the broader Phoenix metropolitan area relies on the river for about 40% of its water through the Central Arizona Project canal. Tucson receives most of its water from the Colorado River via the same 336-mile Central Arizona Project. Denver and Colorado’s Front Range cities draw water from the river’s headwaters through transmountain diversions like the Colorado-Big Thompson Project. The Imperial Valley and Coachella Valley in California—among the nation’s most productive agricultural regions—use more Colorado River water than any other area. 7
Yesterday on the way to the airport, I told my friend Brad that a solution another friend provided – to help save the Great Salt Lake, had already been considered and was shot down because of its expense.
You see there’s solutions out there but many of them are unpalatable. Take dairy cows for instance – they’re cute, right? I like to imagine that my beloved Kerrygold butter comes from white cows with big brass bells around their necks, sniffing daisies and running free over miles of rich green fields in Switzerland. If you’re like me and you don’t want to know the facts, just walk away now and turn on the TV because Bob Ross is about to start painting.
The unfortunate fact is that dairy cows emit literally tons of pollution into the air, the groundwater, and soil. Worse – the forage they consume is using up the vast majority of our fresh water supply.
Precision Fermentation to the rescue
Just as vertical agriculture will be used in order to continue to produce some of our crops once the Colorado River’s gone, Precision Fermentation is gearing up to replace dairy cows. It uses genetically engineered microbes (like yeast or fungi) in bioreactors to produce exact, molecular duplicates of dairy proteins (e.g., whey and casein). This process provides revolutionary environmental advantages over traditional dairy farming – dramatically cutting emissions, water consumption, and land use while eliminating agricultural pollution.1
Key Environmental Advantages
Land & Habitat Conservation: Cows require vast tracts of arable land for grazing and growing feed crops, which is a primary driver of deforestation. Fermentation takes place in vertical stainless-steel bioreactors, bypassing the need for pastures. This uses far less land and provides the opportunity to return millions of acres to natural ecosystems that could absorb massive amounts of carbon.
Drastic reductions in greenhouse gasses: Traditional dairy farming is a massive emitter of methane and nitrous oxide. Precision fermentation eliminates enteric fermentation (cow burps) and manure emissions, generating far fewer greenhouse gases than conventional dairy systems.2
The elimination of nitrate leaching: The urine from dairy cows pollutes groundwater with nitrates because it contains highly concentrated loads of urea, a nitrogen-rich compound. When cows urinate on pastures soil microbes rapidly convert this urea into ammonium and then into nitrate through a biological process called nitrification. Because pastures feature localized “urine patches,” the amount of nitrogen deposited drastically exceeds what the surrounding plants can absorb. The excess, highly soluble nitrate does not bind well to soil particles, causing it to leach downward through the soil layers during rainfall or irrigation and accumulate in the underlying water table.
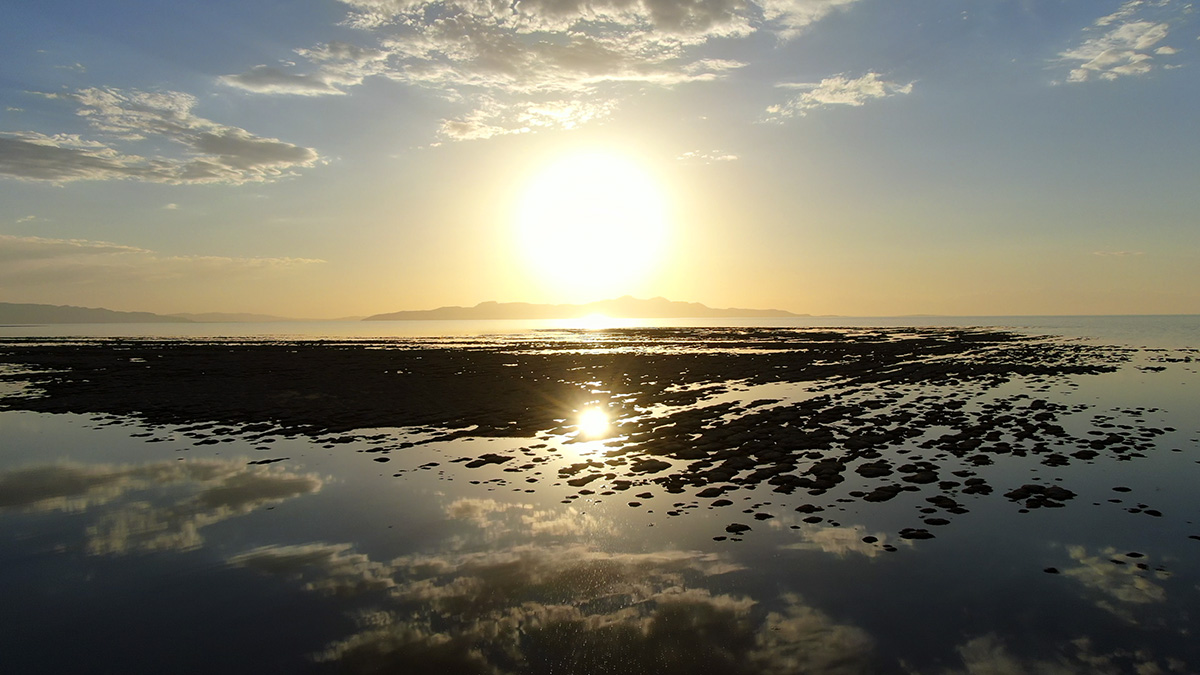
An archipelago of ancient bioherms living on the Great Salt Lake’s southeastern side. Photo by Robert Marcos.
“This day we arrived in the valley of the great Salt Lake. My feelings were such as I cannot describe. Everything looked bloomy and I felt heart sick.”Lorenzo Young, Brigham Young’s younger brother
by Robert Marcos
Utah’s Great Salt Lake sits at dangerously low levels
The Great Salt Lake is currently locked in a critical structural decline, hovering in a “serious adverse effects” range at nearly seven feet below its minimum healthy level. Decades of excessive human water diversions for agriculture and rapid urban growth, coupled with a warming climate, have stripped the lake of over half its historic water volume. This trajectory directly parallels the Aral Sea disaster in Central Asia, where Soviet-era river diversions for cotton farming completely decimated a massive inland sea, turning it into a barren desert of toxic salt flats. If Utah fails to drastically alter its current water policies and consumption, the Great Salt Lake faces the exact same fate of complete ecological collapse.1
The Source of Half of the Wasatch Front’s Precipitation
The potential disappearance of the lake would critically disrupt the regional water cycle because half of the convective precipitation along Utah’s heavily populated Wasatch Front relies on the lake’s evaporation. As a terminal lake, its vast surface area fuels a vital localized hydrological sub-cycle, generating the famous “lake-effect” storms that dump immense snowpacks into nearby mountains. Recent research from Utah State University confirms that if the lake dries up completely, regional precipitation will face an approximate 50% reduction. This would trigger a devastating, self-perpetuating drought loop: less lake surface area means fewer storms, which shrinks mountain snowpacks and further dries the rivers needed to refill the basin.2
Potential for a Widespread Respiratory and Cardiovascular Crisis
The long-term consequences of a completely dried lakebed would be catastrophic for Utah’s public health, economy, and environment. With nearly 1,000 square miles of exposed lakebed, heavy winds would unleash massive, toxic dust storms laced with naturally occurring arsenic, mercury, and other hazardous minerals directly into the Salt Lake City metropolitan area. This airborne pollution would trigger widespread respiratory and cardiovascular crises, rendering the region largely uninhabitable. Furthermore, the collapse would wipe out the lake’s multi-billion-dollar mineral extraction and brine shrimp industries, decimate the habitat of 10 million migratory birds, and permanently cripple Utah’s iconic multi-million-dollar ski industry due to the permanent loss of winter snowpack.3
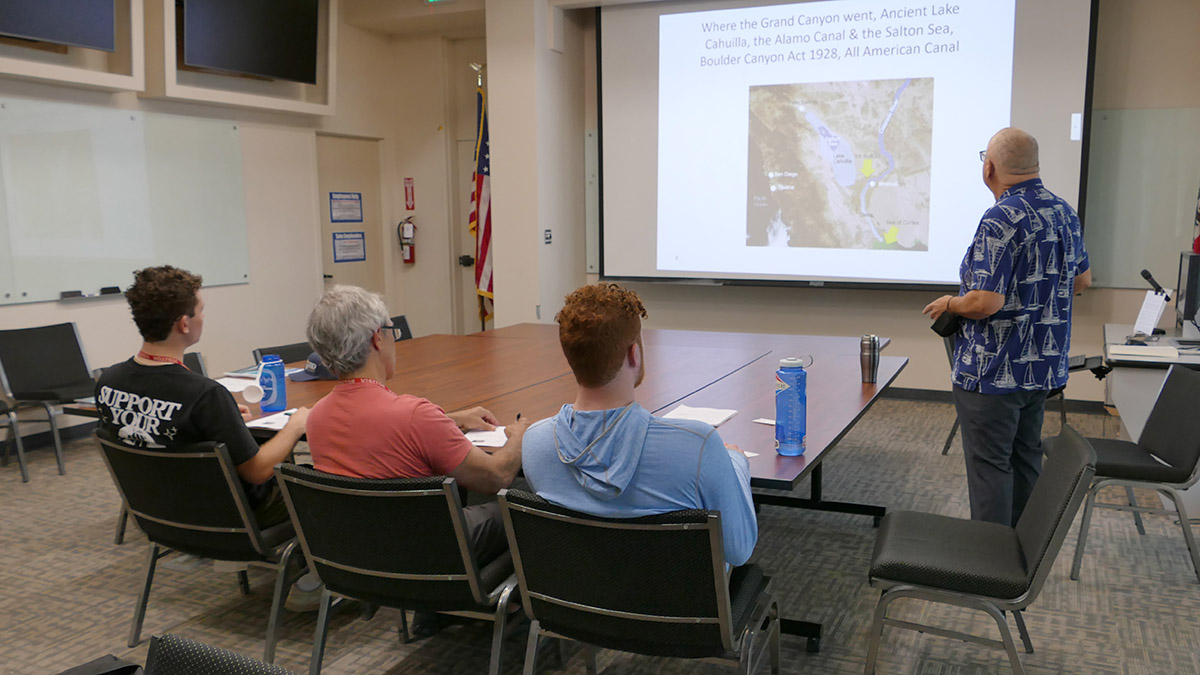
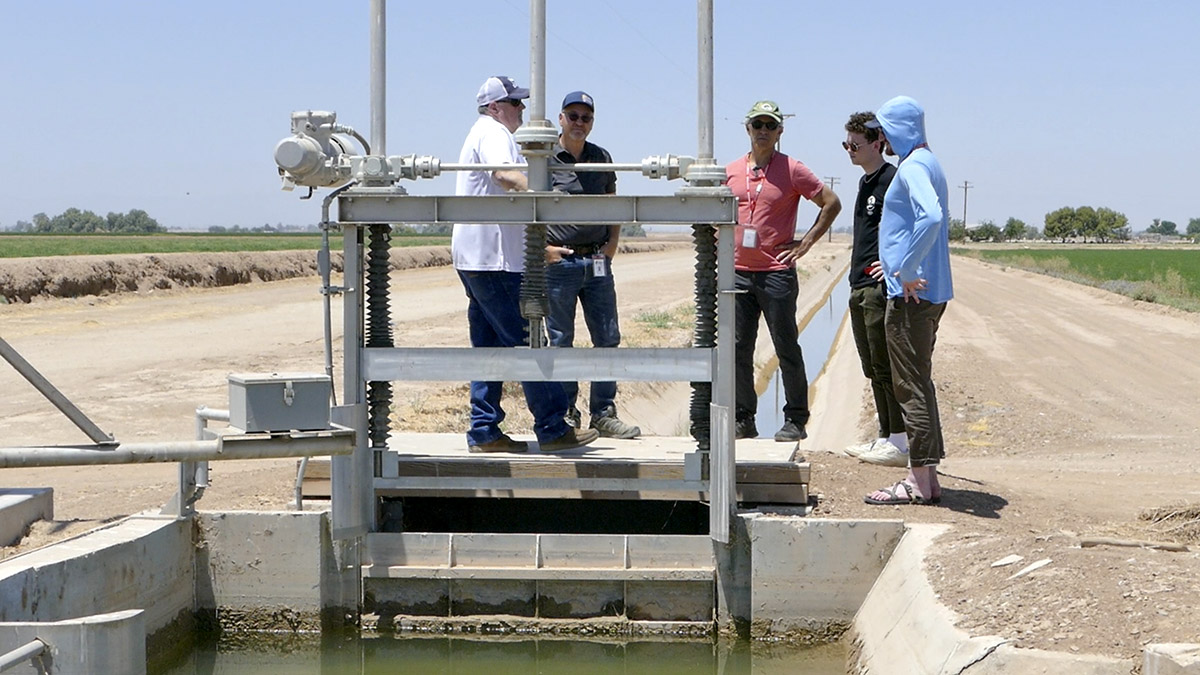
The IID’s former Watermaster, Merlon Kidwell, makes a presentation to a group studying the Colorado River crisis. Photo by Robert Marcos.
by Robert Marcos & Brad Barham, PhD
In 2022 – while conducting a study of the Colorado River crisis, Dr. Brad Barham – a Professor of Agricultural Economics at the University of Wisconsin, Madison, two of his undergrads and I watched a Powerpoint presentation given by the Imperial Irrigation District’s Watermaster, Merlon Kidwell. Kidwell retired last year after fifty years with the IID. Besides the IID’s hospitality that day, there were two fundamentally-important things we’ve never forgotten –
1. The IID maintains 3,000 miles of delivery canals and agricultural drains that convey 3.1 million acre feet of Colorado River water every year. This amount represents about a quarter of the Colorado River’s average annual 12.5MAF output since 2000.1 Under its historic contracts with the federal government, the IIDis exempt from paying for the water it receives, it does however pay for the operation, maintenance, and repair of the 80-mile long All-American Canal, its own internal water delivery systems, and a portion of the cost of maintaining the Imperial Dam.2
2. Similarly, the IID does not charge farmersfor the water itself. It charges farmers (who are connected to the IID’s water delivery system) an annual fee for that connection, plus a flat $20 per acre foot for the costs associated with the delivery of their water. 3
IID employees demonstrate an automated canal gate to a group studying the Colorado River crisis. Photo by Robert Marcos.
Meanwhile, the San Diego County Water Authority pays a wholesale price that’s between $700 and $1,200 per acre-foot for that same (untreated) Colorado River water.4 With such a disparity in water prices it seems reasonable to ask if the IID could both conserve water and lower the price paid by municipal users by raising the price paid by farmers.5
It doesn’t take an economist to understand the “law of demand” which says: “As the price of goods or services go up, people will generally use less of it”. Today with Lake Powell hovering just above the dead pool level it’ has become crucial’s more urgent than ever to understand why the price of water that’s provided to Imperial Valley farmers hasn’t gone up considering the increased scarcity of Colorado River water.
For decades now the Imperial Irrigation District has demonstrated that they prefer the carrot to the stick – in other words the IID has provided farmers with financial incentives and the technology that’s required in order to conserve water. The IID also cannot raise water prices because of laws established by California Proposition 218.
California’s Proposition 218 was passed by voters in 1996 in order to protect taxpayers by requiring voter approval for local tax increases and restricting property-related fees to the actual, proportional cost of service delivery 6. Since the IID receives Colorado River water for free, they can only charge farmers $20 per acre-foot to recover the costs associated with the water’s conveyance – but not for the water itself. Consequently, to legally increase agricultural water rates, the IID must prove higher service expenses through a formal cost-of-service study, issue a 45-day advance notice to landowners, and then begin the “majority protest” process. Because water, sewer, and refuse collection fees are legally classified as “property-related fees,” the Imperial Irrigation District board could pass the rate increase automatically unless a majority of affected stakeholders vote “no” by submitting written protests.7 In this context the “affected stakeholders” are the legal landowners of the agricultural parcels that are subject to the water fee, and the ratepayers, tenants, or farmers who are directly responsible for paying the water bill under their lease terms. 8
However the cost of these (very successful) conservation measures – especially the cost of paying farmers to fallow some of their fields, are very high: about $250 million per year (or $300-450 per acre foot depending on conservation practices used). Given how Western water laws work, and the addition of Proposition 218, that is currently the most feasible and the most immediate path to water conservation in the Colorado River system.
A lower cost, more sustainable solution would require changing the rules that guarantee specific volumes of water at only the cost of conveyance to farmers across the basin. That will be a challenging transition, and will probably require federal legislation to be achieved.
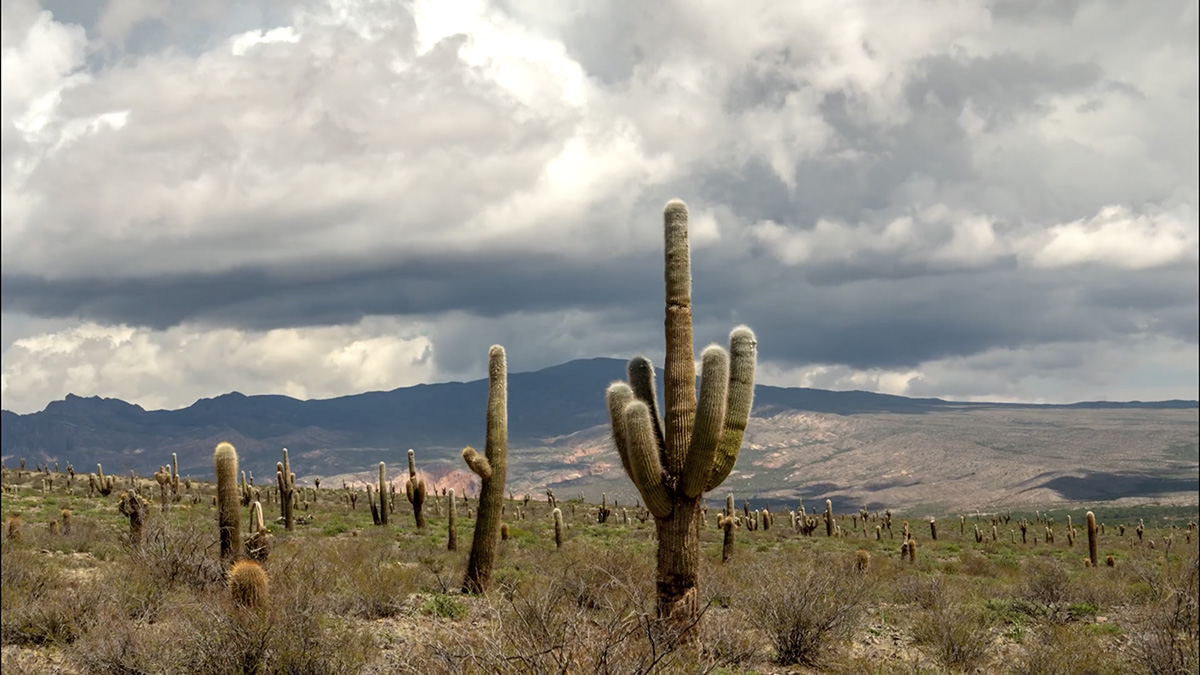
Saguaro cactus in Southern Arizona. Image provided by Storyblocks.
The forecasted “Super El Niño” is expected to delay the start of Southern Arizona’s monsoonal season but by August it could trigger heavier, more intense rainfall, severe flash flooding, and unusually high humidity during its peak. While El Niño historically weakens global monsoons, its impact on the Desert Southwest creates unique atmospheric shifts for the June 15 to September 30 season.1 Climate experts from the National Weather Service and the University of Arizona predict the season will unfold across three distinct phases: 2
A DELAYED AND DRIER ONSET
Early in the summer, El Niño’s atmospheric patterns alter the subtropical jet stream, creating persistent westerly winds across the Southwest.
Moisture Suppression: These westerlies act as a wall, driving out early moisture from the south and delaying the typical shift to monsoonal wind patterns.
Increased Fire Risk: A slower, drier start to the monsoon prolongs the summer dry spell, elevating the risk of wildfire ignition from dry lightning storms.
HIGH-INTENSITY PEAK (August into September)
Tropical Cyclone Activity: The incredibly warm ocean temperatures of a Super El Niño fuel severe hurricane activity off the Pacific coast of Mexico.
Tropical Moisture Pumps: While the hurricanes themselves rarely hit Southern Arizona directly, they act as massive atmospheric pumps, steering heavy tropical moisture straight into the Desert Southwest.
Rain Bombs and Flooding: As this extra moisture collides with the desert heat, it increases the likelihood of high-intensity storms, widespread flash flooding, severe dust storms, and heavy rainfall that could reach up to 150% of normal averages in some areas.
A SHIFT TO MOIST HEAT (after September)
High Humidity: Southern Arizona is famous for its dry heat, but the influx of Pacific moisture will cause humidity levels to skyrocket.
Stubbornly High Temperatures: Even with localized cloud cover and rain mitigating the most extreme temperature spikes, daily highs will remain brutally hot—frequently ranging between 100°F and 115°F. The added moisture will result in a heavy, oppressive “moist heat” rather than a dry one.
April 2023 photograph showing the Colorado River as it enters Lake Mead. Photograph by Robert Marcos.
By Robert Marcos, photojournalist
Arizona, California, and Nevada are actively preparing for a future that may provide little or no Colorado River water through a combination of aggressive local conservation, infrastructure changes, and unprecedented collective agreements. On May 1st – driven by the imminent expiration of current river guidelines, the states finalized a joint Water Stabilization Plan to collectively slash usage by up to 3.2 million acre feet. J.B. Hamby, the Chairman of the Colorado River Board of California, said, “We’re putting forward additional measurable water contributions for the system. Without that, the system will continue to decline.” 1
ARIZONA: Agricultural sacrifices and groundwater banking
Arizona holds the lowest-priority water rights among the major Lower Basin states, which means that it takes the earliest and deepest cuts during shortages.2 Under multi-state and federal plans, Arizona has offered up to 760,000 acre-feet in voluntary reductions, nearly half of what typically flows through the Central Arizona Project canal.3 Central Arizona agriculture has borne the brunt of these reductions. In counties like Pinal, farmers have already been forced to operate at half their normal capacity, switching to high-tech drip irrigation or leaving fields fallow. 4
The state is shifting heavily toward managing its underground aquifers, heavily regulating new real estate developments that cannot prove a 100-year assured water supply independent of dwindling surface flows.
An article in the Manataba Messenger said, “In Phoenix, city leaders are getting ready for the possibility of Colorado River cuts by checking out alternative water sources and long-term reserves. Phoenix relies on several water sources, including the Colorado River through the Central Arizona Project. As future reductions become more likely, the city’s planning mirrors a broader trend across the Southwest: big cities are no longer seeing Colorado River shortages as just a distant threat. They’re preparing for a future where less river water might be available, and backup supplies might be needed to keep up with demand.” 5
CALIFORNIA: Agricultural efficiency and urban recycling
As the largest consumer of the river’s water, California has historically avoided the earliest shortage cuts, but now it has begun to force its massive agricultural districts to adapt to having less water.6 The Imperial Irrigation District which rceives 3.1 million acre feet of Colorado River water every year, is expanding its efficiency programs. On January 20th the IID Board of Directors approved the continuation of the District’s Deficit Irrigation Program for 2026. This program motives local growers to voluntarily pause irrigation on select perennial forage crops (such as alfalfa, Bermuda grass, and Klein grass) during peak summer water use windows. Growers are then financially compensated for their reduced crop yields.7
On May 15th the IID Board of Directors announced an amendment that would leave an additional 100,000 acre feet of Colorado River water in Lake Mead. The amendment increased the IID’s existing three-year conservation agreement capacity from 700,000 acre-feet to 800,000 acre-feet, in addition to the 106,111 AF conserved for Lake Mead in 2023. Cumulatively these programs are slated to add about 12 feet of elevation to Lake Mead by the end of the year.8
TheMetropolitan Water District of Southern California, is investing billions of dollars into advanced local wastewater purification systems to reduce coastal cities’ reliance on imported river water –
Pure Water Southern California: MWD has partnered with the Los Angeles County Sanitation Districts to develop Pure Water Southern California, aiming to produce up to 150 million gallons of recycled water daily for 15 million people. MWD has allocated $150 million within its capital investment plan for the planning and final design of the project’s first stage, and has financed and operates a 500,000-gallon-per-day demonstration facility (the Grace F. Napolitano Innovation Center) to test advanced purification techniques before full scale construction.9
The Local Resources Program: MWD has provided financial subsidies to its 26 member public and private water agencies based on the volume of recycled water they successfully produced, and it has invested over $1.5 billion since 1990 to support more than 100 localized recycling and groundwater recovery projects across Southern California. Additionally, the MWD funds localized conversions, such as transforming unused sewer lift stations into active recycling plants for urban irrigation.10
Commercial and Research Grants: MWD has awarded grants to public and private entities to evaluate next-generation water-saving devices and urban reuse technologies. It has funded studies on innovative Membrane Bioreactors that are paired with reverse osmosis to reduce the energy and financial costs of recycling wastewater.11
NEVADA: Focused on a new lower-lake pipeline and a war on turf
Nevada has the smallest allocation of the river but is widely considered to have established a blueprint for urban climate adaptation, having spent decades in preparation for the kind of low-water scenario the Southwestern US is now facing. 12
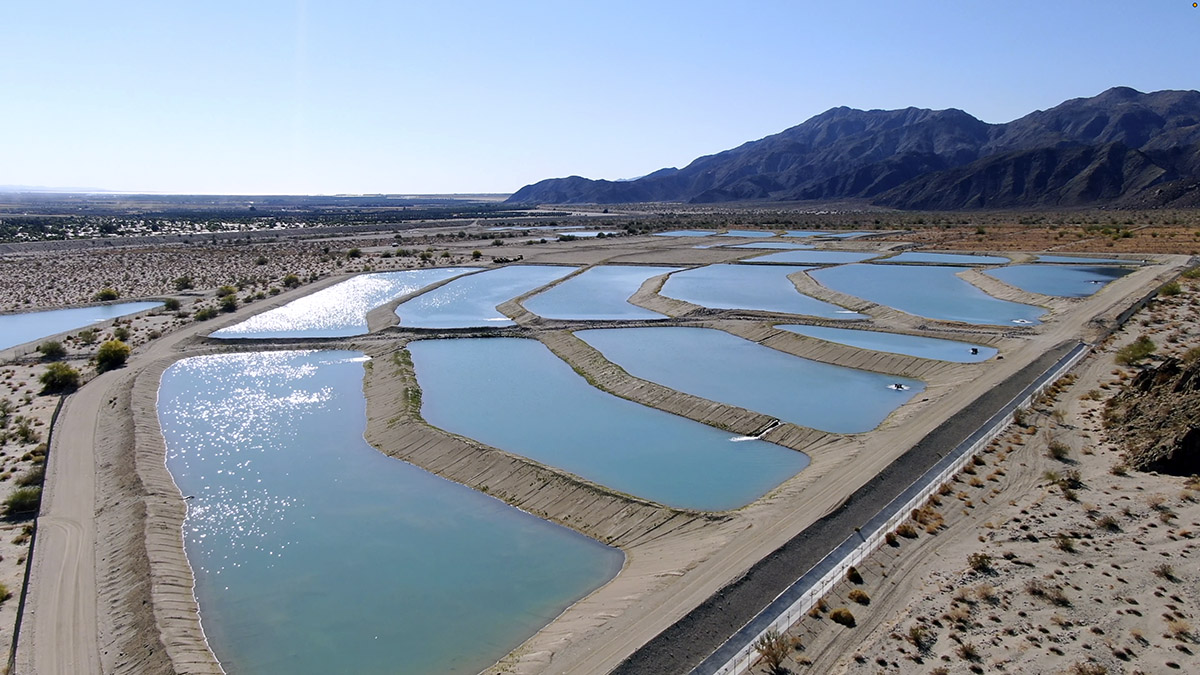
Low Lake Level Infrastructure: Nevada’s water manager, the Southern Nevada Water Authority has completed a “third” intake and a specialized low-level pumping station at Lake Mead. This will allow Las Vegas to continue drawing water even if Lake Mead drops below the deadpool level where water can no longer flow downstream to California and Arizona.13
A War on Turf: Nevada has passed strict laws mandating the removal of “non-functional turf” (decorative grass) at commercial, multi-family, and government properties. It also bans outdoor water features and prohibits new grass in future developments. 14
Indoor Water Recycling: Las Vegas treats and returns nearly 100% of its indoor wastewater back to Lake Mead. This cycle earns the state “return-flow credits,” stretching its small allocation significantly further than other states. 15
The 123-mile long Coachella Canal carries Colorado River from the All-American Canal to the Coachella Valley. Photo by Robert Marcos.
Southern California’s Coachella Valley includes the cities of Palm Springs, Palm Desert. Rancho Mirage, Indian Wells and Indio. It is a hot, dry, low-desert region that nonetheless supports 100 to 120 commercial farms, 120 golf courses, dozens of world-class resorts and one of the nation’s highest rates of per capita water use.1 The Coachella Valley sustains this (artificially) verdant environment with imported water from two sources: 430,000 acre feet of Colorado River water that’s diverted at the Imperial Dam and then conveyed by the Coachella Canal, and 194,000 acre feet of water from California’s State Water Project – but only if there’s sufficient snowpack in the Sierra Nevada mountains.
Both sources of imported water arrive via the Coachella Canal and the majority of it’s used by farms and by aquifer replenishment programs. The remainder is used by golf courses and for the irrigation of commercial landscaping. Municipal water (for residents and businesses) is pumped from the Coachella Valley Groundwater Basin – an aquifer that at one time contained an estimated 39.2 million acre-feet of water, just in its upper 1,000 feet. Municipal water users, who consumed 5.6% more water in 2025 than they did in the previous year,3 natural recharge from rainfall and runoff currently provides about 21,000 acre-feet per year2. So without the imported replenishment water the basin would plunge into an immediate and severe deficit. Water tables would drop rapidly in historically vulnerable zones like the East Valley and Palm Springs.3
This scenario is alarming for a variety of reasons –
The Colorado River is rapidly become unreliable as a source of water.4 Since both sources of imported water depend upon the Coachella Canal for delivery, 100% of the imported water will stop flowing just days after Lake Mead reaches deadpool. Again – not one drop of the imported water that the Coachella Valley depends upon will arrive in the Coachella Valley if that water can’t make it past Hoover Dam. A second, albeit less-likely danger is the known fact that the Coachella Canal crosses over the San Andreas Fault.4
Cheap water encourages farmers to grow water-intensive crops. Coachella Valley farmers who obtain raw irrigation water directly from the Coachella Canal can pay as little as $40.14 per acre foot. This cheap water encourages farmers to grow profitable but water-intensive crops – like alfalfa.5
Municipal water use in the Coachella Valley is increasing. Instead of the Valley’s water consumption falling – as we’ve seen in almost every other Southwestern municipality, the Coachella Valley’s municipal water use continues to increase due to a rising population and an increase in the irrigation of crops and landscaping due to climate change. On April 15, 2026 The Indio Post reported that urban water use – which includes municipal customers, golf courses, and other recreational users, climbed by 12,989 acre-feet, or 5.8% compared to the previous year.
The Thomas E. Levy Groundwater Replenishment Facility is one of four replenishment facilities operated by CVWD. Photo by Robert Marcos
Challenge #1 – Maintaining groundwater levels
The Coachella Valley Water District and four other water agencies have been doing their best to maintain groundwater levels through the use of groundwater replenishment facilities. These programs are designed to reverse decades of aquifer overdraft and ensure long-term water sustainability. By percolating 165,000 acre feet a year of imported water directly into the ground, the districts have successfully stabilized and even raised groundwater levels in historically depleted areas. But what has been left unsaid is that both sources of imported water – the Colorado River and the State Water Project, both use the same conveyance and both are under severe long-term threat from climate change. Therefore Coachella Valley’s water districts have to plan for the day when they have no sources of imported water, and will have to depend entirely on groundwater.5
Challenge #2 – Convincing residents to use less water
Individuals living in the Coachella Valley city of Bermuda Dunes consume between 217 and 380 gallons of water a day.6 While residents of Rancho Mirage, Palm Desert, Thousand Palms, Indian Wells, La Quinta, and Thermal consumed an average of 188 gallons of water per day. And residents of the Desert Water Agency, which serves Palm Springs and Cathedral City, used an average of 178 gallons of water per day.7 The residents of other comparably-sized desert cities use far less water. On average residents of Tucson use as little as 72 gallons a day, residents of Phoenix 92 gallons, and residents of Albuquerque use just 56 gallons per day.
While the Coachella Valley relies entirely on imported Colorado River water to recharge its aquifers, and loops recycled water back to its farms and golf courses, other Southwestern desert cities have shifted to advanced purification technology that recycles100% of their wastewater directly back into municipal drinking supplies. In the Arizona cities of Phoenix, Glendale, Mesa, Scottsdale, and Tempe, they treat the recycled water to high standards so it can be used to irrigate sports fields, golf courses, commercial landscapes, and create or restore riparian habitats. It is also used to recharge aquifers and stored underground for use during times of shortage. Recycled water can extend water supplies, improve water quality, reduce discharge and disposal costs of wastewater, and save energy.8
Challenge #3 – Preparing for “Day Zero” when the Coachella Valley receives no more Colorado River water
If the current drought continues and Lake Powell reaches dead pool, it’s estimated that Lake Mead will also reach dead pool within two-to-four years. This means that absolutely no Colorado River water pass beyond Hoover Dam and into the lower Colorado River basin. The Colorado River Aqueduct, the All-American Canal, and the Coachella Canal would be shut down. In this worst-case scenario, the Coachella Valley would survive by pumping from its underground aquifer, though this would immediately trigger a severe, unsustainable deficit. Because the region averages only 3 inches of rainfall annually, its primary long-term buffer would be exhausted without Colorado River and SWA water being available to replenish it.9 To prevent the aquifer from going dry, the State of California would likely enforce extreme water rationing, ban all outdoor ornamental landscaping, and trigger a massive, forceddownsizing of the local agricultural sector. 10
Why not do some of these things now instead of waiting until the Colorado River has dried up?
Anthropogenic objects suspended in strata, as described by the author and then brought into reality by Google’s Nano Banana 2
by Robert Marcos, photojournalist
If Lake Powell ever dries up completely scientists excavating the exposed reservoir floor will uncover a massive, human-made geological record known as anthropogenic stratigraphy. This towering wall of trapped sediment, which already reaches up to 150 feet thick in some areas, acts like an open book detailing the history of Lake Powell. Researchers will find a distinct, repeating pattern of cyclic sand-mud interbeds that chronicle the reservoir’s seasonal fluctuations and regional hydroclimate. The thick layers of coarse sand will mark rapid, powerful depositional events fueled by annual spring snowmelt and dramatic upstream floods. Conversely, the alternating bands of thinly laminated, fine-grained lacustrine mud will reveal prolonged periods of high water levels when the reservoir was full and the currents slowed, allowing the finest suspended particles to settle to the canyon floor.1
Beneath this structural rhythm, a geochemical analysis will expose a darker record of the West’s industrial and agricultural history. Because the dam permanently trapped Colorado River sediments that once flowed naturally to the sea, the dry lakebed will serve as a containment sink for concentrated toxins and heavy metals. Geologists and environmental scientists will encounter dense pockets of arsenic, lead, selenium, boron, and mercury swept down from upstream agricultural runoff and legacy mining districts. Most notably, the layers will hold chemical fingerprints from historical events like the 2015 Gold King mine spill and the submerged yellowcake uranium mill tailings pile near Hite. As water levels vanish, these hazardous materials will remain bound to the platy clay aggregates and iron oxide coatings of the sediment, posing a significant risk of toxic dust storms if re-mobilized by the wind.2
Finally, the deepest trenching will reveal a stark ecological and physical boundary line: the pre-dam canyon floor. At the very base of the mud, scientists will strike an erosional surface composed of native boulders, coarse river gravels, and heavily weathered sandstone that directly predates 1963. Preserved just above this bedrock, researchers will find an anaerobic time capsule of organic debris. This includes preserved strands of invasive tamarisk and Russian thistle, ancient cottonwood fragments, and dense layers of decaying organic matter that once starved the deep reservoir of oxygen. By using advanced tools like X-ray diffraction, environmental DNA (eDNA), and scanning electron microscopy, scientists will be able to reconstruct the precise timeline of how human engineering completely transformed, and ultimately choked, a vibrant desert river ecosystem.3
Photograph of Iron Mountain Pumping Plant by Jet Lowe. Provided by the U.S. Library of Congress
The 85-year old Colorado River Aqueduct – which was constructed over a 8-year period beginning in 1933, is a major water conveyance system that brings 1.2 billion gallons of Colorado River water to Southern California every day. The aqueduct was paid for by voters in 13 Southern California cities who overwhelmingly approved a $220 million municipal bond in order to finance the monumental construction project. Managed by the Metropolitan Water District of Southern California, the aqueduct stretches 242 miles across the Colorado and Mojave deserts, tunnels under two mountain ranges, and rises a total of 1,617 feet in elevation from its starting point downstream of Parker Dam near Lake Havasu.1
Photograph of canal and adjacent sand filters at Iron Mountain. Photograph by Jet Lowe. Picture provided by the U.S. Library of Congress
Numerous engineering features mark the aqueduct, including dams, reservoirs, pumping plants, tunnels, canals, conduits, inverted siphons, and transmission lines. Each of these parts works together to provide what was determined to be the most efficient, cost-etfectlve, and safe combination of transporting water from the Colorado River to the southern California coastal basin. The aqueduct has always been much more than just a canal. Its engineering coincided with American during the Depression-era, when the appearance and promotion of technological “progress” provided the American public with a sense of accomplishment and pride. During its construction the aqueduct provided jobs for 35,000 people for over eight years.
Headgate house at the Iron Mountain Pumping Plant, photographed by Jet Lowe. Provided by the Library of Congress.
The combination of the total height that water is lifted (1,617′) and the aqueduct’s 242-mile length was unprecedented, as was the aqueduct’s carrying capacity of 1,605 c.f.s. The vertical synchronous motors driving the pumps were the largest of these types of motors then constructed. The difficulties encountered during the construction of the Mt. San Jacinto tunnel received national attention, and engineers argued that it was one of the most difficult tunnel construction jobs undertaken in the history of world engineering. Some of the equipment introduced and engineering techniques employed during the aqueduct’s construction overall were celebrated for their ingenuity and ability to set standards for future projects of similar magnitude. The Parker diversion dam had to be erected upon bedrock 233′ deep, which at the time made it the world’s deepest. The Colorado River Aqueduct overall was the world’s most technologically-advanced water conveyance system, and it has proven its reliability by serving the needs of 19 million Southern California residents for the last 85 years.
In a letter published by Environmental Research Letters, Andrew Berardy and Mikhail V. Chester of Arizona State University examined the agricultural and beef industry’s dependency upon water and power. Athough their research was focused the effects of climate change in Arizona, their findings could be applied almost anywhere in the American Southwest.
“Arizona’s predominately irrigated agriculture relies on water imported through an energy intensive process from water-stressed regions. Most irrigation in Arizona is electrically powered, so failures in either energy or water systems can cascade to the food system, creating a food-energy-water nexus of vulnerability.” Using data provided by the USDA, the U.S. Geological Survey, Arizona crop budgets and region-specific literature, the two scientists predicted that a temperature increase above the baseline could decrease yields by up to 12.2% per 1° centigrade for major Arizona crops and would require increased irrigation of about 2.6% per 1° centigrade.1
Modern agricultural production is made possible by systems working together to deliver energy and water resources necessary to provide a reliable food supply. This interdependency creates the food-energy-water nexus. Arizona is a major agricultural producer, supplying considerable animal feed, livestock, milled grain products, meat, and other food products to cities throughout the U.S.
Figure 1. Importance of agricultural exports from Arizona. This map displays the food related goods shipped from Arizona as a percentage of total food related goods shipped to each state in the freight category where that percentage is highest based on 2012 Freight Analysis Framework data (Center for Transportation Analysis 2016). Cities with 5% or more of a category imported from Arizona are labeled with an icon representing the freight category and labeled with the percent of that category they receive from Arizona out of their total imports of that category. For example, Los Angeles receives 22% of their Live Animals and Fish imports from Arizona.
The Phoenix region’s large volume of food related exports means that reduced yields would have a signifcant impact on overall export capacity for Arizona. The most significant food related exports are to cities near Arizona – including Los Angeles, San Diego, El Paso, and Las Vegas. Tucson receives 100% of its live animals and fish, 85% of its other agricultural products, 83% of its other foodstuffs, and 69% of its meat and seafood from within Arizona. Phoenix receives 87% of its other agricultural products, 73% of its animal feed, 57% of its cereal grains, 51% of its other foodstuffs, and 51% of its live animals and fish from within Arizona. Therefore, disruptions to the agricultural system in the greater Phoenix area would have both a local impact, and would be felt across the Southwest in California, Nevada, and Texas.2
Shocks and strains on energy and water production and delivery systems may result in failures which cascade to food systems. In addition, feedback loops across the nexus could create compounding vulnerabilities, as failures in one system may propagate to another. Potential disruptions such as population growth, climate change, and interruptions to energy and water supply cause problems in food, energy, and water systems that combine and cascade to have downstream impacts on food supply and farm viability, which feed back into population growth in an iterative cycle.
Farms with diminished yields by cause. In 2013, Arizona farms reporting reduced yields attributed them primarily to water shortage and irrigation equipment failure, while the cost of water or energy shortage and price increases accounted for most of the remaining diminished yields (Vilsack and Reilly 2014). Arizona farms relied on irrigation for 100% of their total sales and 419 farms discontinued irrigation in 2013 (Vilsack and Reilly 2014).
Climate change already has significant negative impacts on agriculture in the United States, causing substantial economic costs and raising serious questions about the vulnerability of food supply chain3. The Southwest is especially challenged due its rapidly increasing population, changing land use and land cover, limited water supplies, and long-term drought4. Arizona is largely a semi-arid desert receiving only 20.4 cm of rain across only 36 days per year on average and with an average yearly temperature of 24° centigrade. Despite a resulting reliance on imported water andsprawling housing developmentsreducing available arable land, Arizona has a strong agricultural history and significant specialty crop production.5 The strain of irrigation required for agriculture is manifested in crop losses for Arizona farmers, as reflected in figure 3, showing key drivers of yield loss as water shortage, water costs, energy costs, and equipment failure. In 2013 these problems affected about 15% of irrigated farmland in Arizona.
Failures in the Arizona food-energy-water nexus could cause disruptions throughout the Southwest as food supply chains for urban centers like El Paso, Los Angeles, and San Diego shift. There is also the potential for cascading impacts because these cities have their own exports which might be disrupted. As cities throughout the Southwest look to meet their own needs, there may be a significant change in food supply across the region. Regardless of potential systematic failures and reductions in crop yields, it is very likely that consumptive water use will increase as average temperature increases. Sustainable food supplies in Phoenix and Tucson, as well as other agriculturally productive regions of the Southwest, will require a greater amount of water drawn from sources that are already strained.
A mini-sandstorm partially obscures the Bullfrog Marina on Lake Powell. Dropping reservoir levels are forcing officials to move the marina to a deeper part of the lake. Jonathan P. Thompson photo.
Maybe sitting next to the wall of plate glass windows was not the smartest move, I thought, as a sienna-colored cloud of sand lifted up from the lakeside and made its way in my direction. I had just tucked into my $16 grilled chicken sandwich at the Anasazi Restaurant at Bullfrog Marina on Lake Powell when the wind kicked up, sandblasting the windows and causing a sizable milk crate to slide back and forth along the railings of the patio outside. It was an eerie scene. Had this been an apocalyptic cli-fi film set in a calamitously aridified West, this would have been the moment when a pterodactyl-like creature smashed through the window and plopped down all bloody and sandy in my plate of fries, an omen of the horrors to come.
It was not, however, a film. The dystopian scene was real as was the aridification, though it did not include any prehistoric creatures — only a handful of staff and other diners who, much to my dismay, seemed utterly unperturbed by the sandstorm and the havoc it was wreaking on a set of outdoor furniture. And, outside, a few ravens who seemed delighted to frolic in the gusts’ updrafts.
When we think of climate change’s effects, we might imagine communities inundated by rising seas, unhoused folks exposed to ever more severe heat waves, or entire towns wiped out by megafires. I was here at Bullfrog to see how a warmer and drier climate is affecting the communities, infrastructure, and economies that rose up around and depend upon Lake Powell-based recreation.
Bullfrog is the largest and most extensive marina on Lake Powell’s northern end. It has a 48-room hotel, the aforementioned restaurant, a gas station and convenience store, an RV park, and other lodging, along with its own school, which this year had four students in grades K-6. The population of some 50 to 100 consists mostly of employees of the National Park Service and Aramark, the private concessionaire that runs the reservoir’s marinas and other facilities. Nearby Ticaboo, which lies outside Glen Canyon National Recreation Area but also relies on Lake Powell recreation, has another 50 to 100 residents. The nearest incorporated town is Hanksville, some 67 miles to the north.
Bullfrog Creek along the southern end of the Burr Trail and Bullfrog Bay on Lake Powell in the distance. Jonathan P. Thompson photo.
Bullfrog lies at the end of the road on a bay at the mouth of Bullfrog Creek, where the water is shallower than on the main channel of the Colorado River, making the marina and its facilities more vulnerable to dropping water levels. While the main boat ramp is still being used, it will likely become unusable later this summer as the reservoir’s surface levels falls toward 3,500 feet. In coming weeks, the entire floating marina will be towed across the reservoir to deeper water adjacent to Halls Crossing Marina; Bullfrog’s fuel and boat rental docks have already been moved. The ferry between Bullfrog and Halls Crossing isn’t functional at low water levels, so is expected to be out of commission for the rest of this year, making for a 145-mile car trip between the facilities at Bullfrog and the boat ramps and marina at Halls Crossing.
I visited Bullfrog on a Sunday in mid-May. Because I needed to do some internet-related work early on Monday morning, I stayed in the hotel. I initially regretted not staying in the campground, since it was mostly empty and had a strong cell phone signal, but when the tent-shredding winds and skin blasting sands kicked up I was happy to be ensconced in more secure lodging, especially given the relatively reasonable price.
It was the high tourist season elsewhere in Canyon Country. The trailhead parking lots at Capitol Reef National Park were all full or overflowing that morning as I drove through, and Torrey had been busy during my stay there for a writing conference. As I slowly made my way down the Notom Road and Burr Trail, stopping frequently to gaze at the curves and crevices in the Waterpocket Fold and for a quick bike ride, I saw maybe a half-dozen other vehicles.
Waterpocket Fold. Jonathan P. Thompson photo.
Waterpocket Fold detail. Jonathan P. Thompson photo.
Bullfrog, meanwhile, was decidedly quiet. The hotel was nearly empty. Only a few sites in the RV park were occupied, and I later saw that most of the sites were out of order and closed. A couple of dozen cars, at the very most, were parked on the only operable boat ramp. The shelves on the little convenience store were sparsely stocked, and a box of Triscuits was going for $7.50 — though there was no cheese to accompany them — and gas was selling for $5.17. In May of 2000, the Bullfrog District received 33,000 visits, according to National Park Service statistics; in May 2025 only 10,886 visitors passed through the entrance gate. Current numbers aren’t yet available, but I imagine this year’s visitation will be far lower. And once the boat ramp ceases to function, I imagine the numbers will plummet further.
Boats, redrock, and snowy Henry Mountains at Bullfrog Marina. Jonathan P. Thompson photo.
The National Park Service is planning to build a new, deeper-water boat launch at Stanton Creek, a couple of miles from central Bullfrog, where the marina can be moved permanently. The project is expected to cost some $73 million, and won’t be completed this year. It’s a type of climate adaptation, I suppose, though one can’t help wonder how long the fix will last if the reservoir’s levels keep dropping.
Meanwhile, Bullfrog’s future is in doubt. A series of especially snowy winters in the high country might be enough to bring Bullfrog back from the edge of obsolescence. Maybe they won’t even need the Stanton Creek site. On the other hand, just one more below-average snowpack year could doom Lake Powell altogether. If Colorado River flows don’t increase substantially in the next year or two, the Bureau of Reclamation will have little choice but to build tunnels to bypass Glen Canyon Dam and effectively drain the reservoir in order to keep water running into the Grand Canyon and on to Lake Mead.
The question then would be whether Bullfrog could (or would even want to) adapt to a different sort of tourism.
The place might try to cater to hikers and small-watercraft users looking to check out newly revealed parts of Glen Canyon that have been inundated for the last several decades. And it could lure travelers exploring the greater region’s backcountry, though it’s not clear that type of visitor is going to be interested in the type of accommodations and services Bullfrog currently offers. Maybe it will just become a destination for disaster-tourist voyeurs looking to see the effects of climate change in real-time. Or, perhaps Bullfrog will become another Hite Marina, which the shrinking reservoir has left high and dry, its boat ramp separated from the lake by some six miles, the store and campground permanently shuttered and gated off.
Sightseers at Hite Overlook gazing down at the “Dominy Formation” of silt left behind by the receding waters of Lake Powell. Jonathan P. Thompson photo.
Hite Marina and boat ramp on what once was the northern end of Lake Powell. Jonathan P. Thompson photo.
The last time I visited Bullfrog was in the late 1980s. My dad, my brother, and I camped at Halls Crossing, then woke up and rode the ferry across the lake. From there we made an epic loop around and over the Henry Mountains along the then-unimproved Burr Trail and another gnarly road in our 1967 Pontiac Catalina. It took at least eight hours and involved some extensive road-building to keep the boat-like vehicle from bottoming out. Anyway, I remember Bullfrog as being a bustling resort with a sort of spring break party vibe, relative to the more bare-bones Halls Crossing. Of course, those were the glory days for Lake Powell, when the reservoir was full, and at the end of a bone-jarring drive across the desert one could stop at the Hite Marina for refreshments.
That night I listened to the sand batter the sliding glass door of my hotel room. The next morning, the reservoir’s placid waters reflected dawn’s first light, and the distant sandstone dunes seemed to glow from within. And to the north, a fresh coating of snow covered the craggy slopes of the Henry Mountains, promising a little bit of relief from these dry and trying times.
Henry Mountains. Jonathan P. Thompson photo.
📸 Parting Shots 🎞️
Early light, the Colorado River canyon, and the Henry Mountains from the White Canyon drainage. Jonathan P. Thompson photo.
Apache Plume and canyon in Utah. Jonathan P. Thompson photo.
Insulators at an electrical substation. Image provided by Storyblocks.
by Robert Marcos
Most of us might assume that our monthly utility bills are slowly paying off the power grid, but the reality is that the electrical grid is a financial treadmill that never actually stops. This constant cycle of compounding interest, depreciation, and emergency retrofits means that the grid is never truly paid off; instead, consumers are locked into an endless loop of funding an aging asset that falls deeper into debt with every necessary upgrade.1
Energy lost during transmission: In the United States about 5% of generated electricity is lost during transmission and distribution, though some sources put the figure closer to 6–7% depending on how the losses are defined and measured.2
Physical Vulnerabilities: Critical substations are often located in extremely remote locations and are only protected by basic chain-link fences.
Threat of Electro-magnetic Pulse: Solar storms and high-altitude atomic detonations could knock out a power grid by inducing massive electrical currents in transmission lines that might overload and permanently destroy critical high-voltage transformers.
Sniper and Ballistic Attacks: Attackers can easily target and puncture fluid-filled high-voltage transformers from a distance.
The benefit of generating power where it’s needed
Generating power where it is consumed significantly reduces transmission losses that occur over long-distance power lines. In conventional centralized systems, electricity can lose a notable percentage of its energy as heat while traveling across vast grid networks. By producing electricity locally—through distributed energy resources such as rooftop solar, microturbines, or small-scale wind—these losses are minimized, resulting in greater overall system efficiency and more effective use of generated energy.3
Localized power generation also enhances grid resilience and reliability, particularly in regions vulnerable to extreme weather, wildfires, or infrastructure strain. Decentralized systems can operate independently or in microgrids, allowing critical facilities and communities to maintain power during outages that would otherwise disrupt centralized systems. This distributed approach reduces dependence on a single point of failure and supports faster recovery during emergencies.4
In addition, generating power at the point of use can provide economic and environmental advantages by aligning energy production with local needs and resources. It enables the integration of renewable energy sources tailored to regional conditions, reduces the need for costly transmission infrastructure, and can lower energy costs over time. For communities, businesses, and utilities, this approach supports cleaner energy adoption while fostering greater control over energy consumption and sustainability goals.5
AI generated image created by Google’s Nano Banana 2
by Robert Marcos, photojournalist
We’ve heard thousands of times (without sources being provided) that 40 million people are dependent upon Colorado River water. But which cities in the American Southwest are 100% dependentand would vanish without it?
YUMA ARIZONA
Yuma, Arizona, relies on the Colorado River for allof its municipal drinking water and is heavily tied to the river for its massive agricultural economy. Yuma has a population of 103,500 permanent residents which share a Colorado River water entitlement of 980,000 acre feet: 97% of which is used for agriculture and the remaining 3% is allocated for domestic, commercial, and military operations – such as those at the U.S. Army Yuma Proving Ground. Yuma conserves its water through high-tech agricultural irrigation, extensive canal automation, municipal restrictions, and wastewater recycling. Despite being a major agricultural hub, local farmers have reduced water usage by nearly 20% while doubling food production over the last three decades.
Municipal & City Efforts
The City of Yuma actively manages its municipal supply through strict conservation and drought response plans.2
Landscape Restrictions: The city encourages residents to adopt desert landscaping and transition away from water-heavy turf. Residents are advised to water only between 7 p.m. and 7 a.m. to prevent evaporation.
City Facilities: During declared water shortages, the city limits operations of water features, reduces winter grass overseeding, and limits facility water use.
Wastewater Recycling: The city recycles about 40% of its treated municipal water, which is safely discharged back into the environment to recharge the local aquifer and supply the Colorado River.
GREEN RIVER, WYOMING
As of 2026, the city of Green River, Wyoming had an estimated population of 11,307 people. The city itself does not hold an independent interstate water right; instead, its water use is governed by Wyoming’s state allocation within the broader “Law of the River” framework. Under the Upper Colorado River Basin Compact of 1948, the State of Wyoming is entitled to 14.00% of the total Upper Basin water allocation. This translates to a maximum full-supply entitlement of 1,043,000 acre-feet of water per year, the vast majority of which is sourced from the Green River basin.3
The city of Green River, Wyoming manages water conservation through modernized infrastructure, rigorous system auditing, and targeted wastewater recycling, operating in tandem with broader basin-wide conservation blueprints. Because Wyoming faces growing pressure to safeguard its Upper Colorado River Basin share, local municipal initiatives focus heavily on eliminating system losses and maximizing structural efficiency.4
LAKE HAVASU, ARIZONA
Lake Havasu, Arizona, has a permanent population of 59,871 and is entitled to 28,582 acre feet of Colorado River water, annually. The city employs a multi-faceted approach to water management:6
Advanced Wastewater Recycling: The city operates three wastewater treatment plants that produce A+ quality reclaimed water. This recycled water is used to irrigate local golf courses and parks instead of draining fresh drinking water supplies, and the surplus is safely returned to the Colorado River for downstream use.
Advanced Metering Infrastructure (AMI): Lake Havasu is replacing approximately 32,000 residential water meters with smart technology. This system provides near real-time usage data and leak detection alerts via the EyeOnWater Platform, allowing residents to quickly spot and fix running toilets or plumbing leaks.
Mandatory and Voluntary Measures: The city’s conservation plan includes guidelines that limit non-essential uses like irrigation and prevent water waste. Residents are encouraged to water early in the morning to reduce evaporation and use mulch to lock in soil moisture.
BULLHEAD CITY, ARIZONA
Bullhead City Arizona has a permanent population of 43,200 and an annual entitlement to 15,210 acre feet of Colorado River water. Bullhead City, Arizona, actively combats Colorado River water shortages through phased municipal codes. Key actions include:7
Phased Restrictions: The city’s code outlines voluntary rules for Tier 1 shortages (fixing leaks, taking shorter showers), which escalate to mandatory bans on misting systems, decorative fountains, and driveway washing during Tier 2 shortages.
Turf Reduction Programs: Bullhead City offers rebates for replacing high-water-use grass with desert landscaping. The city also partners with local HOAs, using state grants to fund large-scale grass removal and park revitalization projects.
Device Rebates: The city provides direct financial incentives for residents and businesses to install smart irrigation controllers, high-efficiency toilets, washing machines, and hot water recirculation systems.
Aquifer Injection: The city recovers effluent (reclaimed water) at the Section 10 Wastewater Treatment Plant, injecting it into the Colorado River aquifer to ensure it is returned to the Colorado River system as return flow.8
PARKER, ARIZONA
Parker, AZ, is almost completely dependent on the Colorado River for its water supply. The town relies on the river both as its direct municipal drinking source (via the Colorado River Indian Tribes water utilities) and to support its river-driven agricultural and recreational economy. 9
While many other Arizona cities rely on a mix of groundwater, reclaimed water, and imported river water delivered via the Central Arizona Project (CAP) canal system, Parker pulls its municipal water directly from the mainstem of the Colorado River. 10
Because the region is heavily tied to the river, changes in Colorado River Basin water management guidelines, drought conditions, and federally mandated supply cuts directly impact the community. However, Parker’s water is largely insulated from severe immediate shortages because the Colorado River Indian Tribes (CRIT) hold some of the most senior and legally untouchable water rights in the entire Lower Basin. 11
BLYTHE, CALIFORNIA
The city of Blythe, CA, relies entirely on the Colorado River for its municipal water supply. The city draws its water entirely from the river via local diversions managed by the Palo Verde Irrigation District (PVID). 12 The city has no alternative sources like deep groundwater basins, State Water Project aqueducts, or desalination. 13
The municipal water supply for the City of Blythe, California, relies entirely on groundwater pumped from deep wells ranging between 250 and 650 feet deep. This groundwater system is highly secure in terms of legal availability due to senior historic claims in the surrounding Palo Verde Valley, and it consistently complies with federal health-based drinking water standards managed by the Environmental Protection Agency. However, the local municipal supply faces ongoing challenges with aesthetic and physical qualities. The groundwater is naturally characterized by abnormally high levels of water hardness and elevated Total Dissolved Solids, which can cause cloudiness, scaling, and bitter tastes. These factors occasionally trigger secondary maximum contaminant level violations for color and taste, prompting local officials to promote strict household water conservation habits and water monitoring to preserve resource quality. 14
Fresh snow frosts the Henry Mountains in southern Utah on May 18, 2026, as seen from Bullfrog Marina on Lake Powell. A mid-May heat spell, when the mercury topped out at nearly 100° F in Bluff, Utah, finished off the high-mountain snowpack and caused many streams to hit peak runoff on May 15 and 16. But on May 17 and 18 a fast-moving storm moved through and dumped snow in some places and brought temperatures down considerably. While it wasn’t enough to appreciably boost streamflows, it did provide some nice relief and seemed to subdue the desert gnats, at least for a while. Jonathan P. Thompson photo.
When the scorching late March heat wave came for what little was left of the meagre snowpack, I was almost certain that it would cause rivers to hit their peak spring runoff levels in early April. That would have been the earliest spring runoff on record and a grim omen for the rest of the summer. Most of the contestants in this year’s predict-the-peak contest apparently had the same idea.
Luckily, we were proven wrong, in most cases: A series of spring storms and successive cold spells in April and even May managed to slow the melt and push the peak to a more reasonable mid-May date. A later runoff means streamflows will subside later, stretching out the irrigating and reservoir-filling season just a little bit longer.
There were exceptions, including the San Miguel River, which hit its spring high flow on April 2. And the Dolores River, which peaked at an absurdly early date of March 26. These both drain the western side of the San Juan Mountains, which apparently bore the brunt of the crappy winter. Still, even those rivers had a sort of second run-off season.
Here are the numbers for our contest rivers, followed by the streamflow and snowpack graphs:
The Animas River in Durango, Colorado: After topping out at 1,010 cubic feet per-second on March 27, the Animas came back and peaked on May 15 at 1,460 cfs.
The San Miguel River at Uravan, Colorado: The river hit 400 cfs on April 2, plummeted to just 63 cfs in late April, and then recovered for a second runoff and reaching 241 cfs on May 15.
The Yampa River near Maybell, Colorado: This river’s watershed got a bigger boost from the April storms than those further to the south, giving it a peak runoff of 3,480 cfs on May 16. This is the only river I’m hesitant to call, because the Upper Yampa watershed still has 2.8 inches of snow water equivalent, according to SNOTEL figures. If a temperature spike were to melt all of that at once, it could result in a larger peak.
San Juan River at Carracas, Colorado: The San Juan hit 1,090 cfs on April 2, which sure looked like the peak. But on May 15 it reached 1,140 cfs.
Nearly all of the contestants in the PtP contest chose April and even March dates for the peak, making the date part of the contest almost irrelevant. So I’m focusing on who was the closest on peak flows. And the winners are …
Animas (2 winners) 1. B Frank, with a guess of 1,468 cfs (wow! Only 8 cfs off) 2. Sharon Englehart, who guessed 1,500 cfs on June 1. While B Frank was closer in flow, Sharon was closer to the correct date.
San Miguel: Florence Paillard with a guess of 450 cfs
Yampa: B Frank again with 4,127 cfs
San Juan: J Harvey barely edges out B Frank with a guess of 850 cfs
So congratulations to B Frank, J Harvey, Florence Paillard, and Sharon Englehart! Please send your mailing address to landdesk@substack.com and I’ll send you your prizes.
🐟 Colorado River Chronicles 💧
Peak runoff on the Colorado River’s tributaries naturally flows down to the mainstem, as well, so long as there’s not a dam or other diversion preventing it from doing so. Unfortunately, however, the mid-May streamflow surges were barely discernible in the Colorado and San Juan rivers by the time they reached Lake Powell.
But Lake Powell did get a bit of a boost this month, only it wasn’t exactly “natural.” Lake Powell’s inflows jumped from as low as 3,500 cfs in late April to nearly 15,000 cfs on May 16. Yet more than 9,000 cfs of this can be attributed to extra releases from Flaming Gorge Reservoir on the Green River. That’s a lot of water coming down the river, and it did boost Lake Powell’s surface level by a whopping … half an inch or so.
Yikes.
Graph showing Flaming Gorge releases jumped from about 2,000 cfs to 9,000 cfs for about a week before dropping back down to the 1,200 cfs range. This was done to bolster Lake Powell’s levels and to help endangered fish.
The Flaming Gorge releases combined with tributary runoff to bring Lake Powell inflows up to 2025 levels for the same time of year. However, it is still far below the median level for May and there almost certainly will be no June surge.
🌵 Public Lands 🌲
On Monday, the GOP-dominated U.S. Senate confirmed Steven Pearce to lead the Bureau of Land Management and oversee some 245 million acres of public lands. Pearce, a right-wing ideologue, former congressman from New Mexico, and a one-time executive of an oilfield services company has long been hostile to the very idea of public lands.
Advocacy groups and Democratic lawmakers have responded to the move with outrage, shock, and dismay, and they have flooded my e-mailbox with claims that this confirmation represents an action that could “redefine public lands as we know them,” as one statement said, and will lead to the wholesale sell off of those same lands.
To be sure, Pearce is a terrible choice for the position, and by confirming him the GOP reinforced the fact that they are willing to sacrifice Americans’ lands and waters to stay on Trump’s good side. But had they rejected Pearce, the administration would simply pick someone who is equally atrocious, although maybe a little bit less open about it. Or maybe they wouldn’t nominate anyone at all, and instead illegally assign a perpetually acting director, as was the case during Trump’s first term with William Perry Pendley.
And even if the administration did nominate a career bureaucrat or someone more reasonable than Pearce, the fact remains: They would either carry out the Trump/Doug Burgum mission, which is to bring the agency back to the days of the Bureau of Livestock and Mining, or they’d be canned. Interior Secretary Doug Burgum was widely considered to be a strong and reasonable choice for that position — even garnering the endorsement of REI’s board of directors — and he has turned out to be one of the most extraction-friendly Interior secretaries in history. Indeed, the administration has already been doing a fairly thorough job of executing their plan without a confirmed BLM director, so why would Pearce make any bit of difference?
Trump’s election is what started redefining public lands. Pearce’s confirmation is just another step in the continued assault on the nation’s lands, air, water, and the communities that depend on them.
Over the past 16 months, the administration has leased out hundreds of thousands of acres of land to oil and gas companies, handed out drilling permits like lollipops at a bank, fast-tracked uranium mine permits, cut the public out of environmental reviews, opened up millions of acres to energy development, and transferred public lands — all without an official BLM director. And in the weeks leading up to Pearce’s confirmation, at least nine BLM state and associate state directors accepted the administration’s deferred resignation and buyout program. In other words, they jumped ship voluntarily, perhaps because they could see that it was sinking.
So far, the administration hasn’t shrunk any national monuments or tried any large-scale land selloffs, with the exception of conveying 1.4 million acres of land in the Dalton Utility Corridor to the state of Alaska. This was a unique situation in that it was done under the 1959 Alaska Statehood Act, which authorized the transfer of 105 million acres of public land to the state for economic development purposes (which, in Alaska, usually translates to oil and gas drilling). As we saw during his first term, Trump doesn’t need Pearce — or any BLM director at all — to diminish national monuments or transfer lands.
In other words, Pearce’s confirmation is just more of the same.
A railroad bridge crossing the dry Gila River. Photograph from Storyblocks.
The Gila River has served as one of the most historically significant waterways in the American Southwest. In 1540 the Coronado Expedition had to construct rafts in order to cross the swollen river, which stretches 649 miles across New Mexico and Arizona. The Gila River has acted as an agricultural lifeline, a changing geopolitical border, a crucial westward migration corridor, and the birthplace of America’s wilderness conservation movement.1
Four years ago I drove to Yuma and then turned north in order to reach the confluence of the Colorado and the Gila Rivers. After launching my drone my very first impression was that the Colorado River was flowing into the Gila, not the other way around. How could I tell? The Gila River was completely dry a half-mile east of the confluence.
Because of extensive upstream dams, irrigation canals, and city diversions feeding places like Phoenix and Tucson, the lower half of the 649-mile river is dried up completely. It typically becomes a dry, sandy riverbed long before reaching its natural confluence with the Colorado River near Yuma, Arizona.2
Ancient petroglyphs line the (former) Gila River shoreline at Sears Point, Arizona. Photograph by Robert Marcos.
Massive Upstream Diversions
The Gila River basin drains nearly 60,000 square miles. However, major structures like the Coolidge Dam and downstream diversion dams capture virtually all of its reliable surface water. The water is instead funneled into agricultural valleys and municipal pipes, leaving the final stretches of the riverbed barren.3
Rare Exceptions and Flooding
The Gila River only reaches the Colorado River during exceptional flood events. When massive winter snowmelt or powerful late-summer monsoons overwhelm upstream reservoirs, water must be released from the Painted Rock Dam. For example, historic wet winters have occasionally caused the Gila to violently discharge into the Colorado for brief periods, but these are anomalies rather than a steady, daily contribution.4
The “Reverse” Water Flow
Paradoxically, rather than the Gila supplying the Colorado River, the Colorado now supplies the Gila. Because Arizona over-drafted the Gila River system over the last century, the federal government built a massive 336-mile canal system. This canal actually pumps roughly 1.5 million acre-feet of water out of the Colorado River every year to supply the cities and farms sitting within the dry Gila River basin.5
Conservation Credits (Paper Water)
While the Gila River doesn’t add physical water to the Colorado, local entities actively help protect the Colorado River system through legal and conservation agreements. For instance, the Gila River Indian Community frequently signs landmark conservation deals with the U.S. government. They agree to leave large portions of their legal Colorado River water allocations untouched in Lake Mead to prop up dropping water levels in exchange for federal funding.6
Synopsis: El Niño is likely to emerge soon (82% chance in May-July 2026) and continuethrough Northern Hemisphere winter 2026-27 (96% chance in December 2026 – February2027).
In the past month, ENSO-neutral conditions continued, as indicated by near-average sea surface temperatures (SSTs) in the east-central equatorial Pacific Ocean (Fig. 1). The latest weekly Niño-3.4 index value was +0.4°C, with the westernmost (Niño-4) and easternmost (Niño-1+2) indices at +0.5°C and +1.0°C, respectively. The equatorial subsurface temperature index (average from 180°-100°W) increased for the sixth consecutive month, with widespread, significantly above-average subsurface temperatures across the equatorial Pacific. Westerly wind anomalies were observed over the western equatorial Pacific at low levels and were evident over the central and east-central Pacific at upper levels. Convection was near average on the equator near the Date Line and was suppressed around Indonesia. Collectively, the coupled ocean-atmosphere system reflected ENSO-neutral conditions.
The North American Multi-Model Ensemble (NMME) average, including the NCEP CFSv2, favors El Niño to form by next month and persist through Northern Hemisphere winter 2026-27. While confidence in the occurrence of El Niño has increased since last month, there is still substantial uncertainty in the peak strength of El Niño, with no strength categorization exceeding a 37% chance. The strongest El Niño events in the historical record are characterized by significant ocean-atmosphere coupling through the summer, and it remains to be seen whether this occurs in 2026. Stronger El Niño events do not ensure strong impacts; they can only make certain impacts more likely (see CPC outlooks for probabilities of seasonal anomalies). In summary, El Niño is likely to emerge soon (82% chance in May-July 2026) and continue through Northern Hemisphere winter 2026-27 (96% chance in December 2026 – February 2027).
Corn being harvested on the Ute Mountain Ute Farm & Ranch Enterprise. Aerial photo by Robert Marcos
In 1949 the Bureau of reclamation installed a diversion on Colorado’s West Marcos River that began channeling water to the brand new Jackson Gulch Reservoir. The reservoir had been created to provide irrigation water to Mancos area farmers of European descent. Somehow the Bureau of Reclamation overlooked the fact that the Ute Mountain Ute Tribe owned senior rights to that water, and about a year after the diversion was created the Tribe’s farm downstream dried up and turned to dust. Out of necessity, tribal members turned to cattle ranching.
Thirty-six years later in 1986, the Ute Mountain Ute and Southern Ute Tribes gathered to celebrate the passage of the Colorado Indian Water Rights Settlement. Then in 1994 for the first time in their reservation’s history, the Ute Mountain Ute Tribe received “wet water” in the amount of 25,100 acre feet a year, of both municipal and agricultural water from the McPhee Reservoir near Dolores.
There was only one problem. During the water rights negotiation the Mountain Ute had to subordinate their senior rights to Mancos River water for junior rights to water from the McPhee Reservoir. Consequently, as severe, climate-driven droughts began to hit Southwestern Colorado, the tribe, (because of its junior rights), began to see severe cuts to their water deliveries – sometimes as little as 10% of their full allocation. These water cuts have had a devastating effect on the Tribe’s award-winning 7,700 acre Farm & Ranch Enterprise – including the involuntary fallowing of fields and massive layoffs of both tribal and non-tribal employees.
Aerial photo of downtown Los Angeles California, provided by Storyblocks.
No, they do not. While it’s technically true that 40 million people across seven states and Mexico have water systems that are supplied in part by the Colorado River, it’s misleading to imply that 40 million people depend on the Colorado River entirely. But the statement – which was taken out of context, has been repeated so often by the media and others that it’s now widely-accepted as a fact. It originated from a Bureau of Reclamation report that actually says, “Although agricultural users depend on 70 percent of Colorado River water, between 35 and 40 million people rely on the same water for some, if not all, of their municipal needs”.1
The following towns are 100% dependent on water from the Colorado River: Yuma, Lake Havasu, Parker, Needles, Blythe, Bullhead City, Laughlin, and Green River, Wyoming. The total of their populations are 254,346 people.2
Top three reasons why the shortened “40 million” phrase is misleading
1. Agriculture consumes the vast majority of the Colorado River’s water, not individuals
The phrase implies that 40 million people rely on the river primarily for drinking, bathing, and basic survival. But in reality agricultural irrigation consumes roughly 75% to 80% of the river’s water. A massive portion of that goes specifically toward water-intensive cattle feed crops like alfalfa and hay. Domestic, household use accounts for only about 10% to 13% of the total supply. The narrative of “40 million thirsty citizens” masks the fact that the crisis is fundamentally an agricultural management problem rather than a residential population crisis.
2. Metropolitan areas typically have a wide variety of water sources
Many of the 40 million people counted in this statistic live in large coastal or metropolitan cities—such as Los Angeles, San Diego, Denver, and Phoenix—that do not rely solely on the Colorado River. These cities utilize a diversified portfolio of water sources, including local groundwater, northern state aqueducts, state-wide recycling systems, and other local river basins. Saying they “depend” on the Colorado River implies total reliance, when it often provides only a fraction of their municipal supply.
On average, the Colorado River only supplies roughly one-third of Southern California’s urban water.3 The rest comes from the State Water Project (or Northern California snowpack), local groundwater, and from water recycling programs, yet the Bureau of Reclamationcounts all 19 million residents of this geographic area as being “dependent on Colorado River water”.
3. Aggressive water recycling and conservation has significantly reduced our dependence
Using the word “depend” creates a fatalistic narrative that if the river’s flow drops, 40 million people will run out of water. In practice, many of the urban centers counted in the 40 million figure are highly resilient due to aggressive wastewater recycling and conservation efforts. For example, Las Vegas and the state of Nevada recycle nearly 85% of their treated wastewater back into Lake Mead. Because these cities reuse the same water multiple times, their actual net depletion of the river is much lower than their gross population would suggest.
4. 1.8 million Cows use more Colorado River water than 40 million people
The Bureau of Reclamation should change their headline to: “1.8 Million Cattle depend on the Colorado River” because dairy and beef producing operations use more Colorado River water than people do.3 Statistically metropolitan areas use 14 to 18% of the (total allocated) Colorado River water while beef and dairy production uses 32% when the growth of forage is included. 4
Parker Dam image from TripAdvisor. Photographed by WIBYRIC @he_wanders_off
Parker Dam is the exact geographic “fork in the road” for Southwest water distribution. It acts as the forebay for two of the most critical aqueducts in the United States. The Colorado River Aqueduct which is managed by the Metropolitan Water District of Southern California, which pumps water 242 miles west to Los Angeles and San Diego. And the Central Arizona Project which pumps water 336 miles east to supply Phoenix and Tucson.1
Lake Havasu is a dynamic environment that’s impacted by upstream agricultural drainage, mineral springs, and fluctuating flows from Hoover Dam, and so salinity can spike rapidly. Hourly monitoring allows Bureau of Reclamation technicians to provide real-time telemetry data to MWD and CAP so they can adjust their treatment facilities or blending ratios before millions of gallons of highly saline water enter their pipelines.2
If the Total Dissolved Solids (TDS) levels of water tested at Parker Dam are too high, it could set off a cascading economic, industrial, and agricultural crisis across California and Arizona. TDS is the combined concentration of minerals, salts, metals, and small organic substances dissolved in water. That includes common minerals like calcium, magnesium, sodium, potassium, and bicarbonates, as well as chloride, sulfate, nitrate, trace metals such as copper, zinc, and sometimes contaminants like pesticides or industrial byproducts.3
The Effects of high TDS for Residential Water Users
High TDS typically means “hard” and corrosive water. If Parker Dam passed high-salinity water into the aqueducts, it would cause the buildup of scale in home appliances, water heaters, and municipal pipes across Los Angeles, San Diego, and Phoenix. Scale can drastically reduce the lifespans of home appliances, clog plumbing infrastructure, and degrade household water filters. It forces MWD and local utilities to incur massive financial costs to blend Colorado River water with lower-salinity northern water sources just to make it palatable and safe for home use.4
The Effects of high TDS for Agricultural Water Users
Water from Parker Dam also feeds the massive agricultural hubs of the Imperial and Coachella Valleys, as well as Yuma, Arizona. Irrigation water that’s high in salt acts as a silent killer for crops like alfalfa, lettuce, and citrus fruits. High salt content alters soil chemistry, lowering overall crop yields and burning plant roots. It forces farmers to use significantly more water just to “flush” the accumulated salts out of the root zones, compounding the West’s water scarcity issues.5
Colorado River salinity requirements for Water that flows into Mexico
IBWC Minute 242 regulates Colorado River salinity by requiring that water delivered to Mexico at Morelos Dam has an annual average salinity no more than 115 parts per million (ppm), with a plus or minus 30 ppm variance, above that of the water at Imperial Dam. This comparative standard ensures water quality by preventing high-salinity agricultural drainage from being added before crossing the border. Detailed information on this treaty can be found on the International Boundary and Water Commission website.6
As our attention is focused on the Colorado River’s diminished streamflow, there are other dangers lurking in the shadows.
As river flows diminish the total dissolved solids (TDS) it contains become more concentrated. And as that languid water heats up in the summertime cyanobacteria can bloom – which further degrades water quality. Cyanobacteria (blue-green algae) thrive in the Colorado River system when specific physical, chemical, and climatic conditions overlap. Major bodies along the basin, such as Lake Powell, Lake Havasu, and the Blue Mesa Reservoir, can experience rapid algae blooms under the following conditions:1
Thermal Thresholds Cyanobacteria growth accelerates significantly when water temperatures exceed 68°F, outcompeting other harmless algae. Optimal growth rates typically occur at temperatures above 77°F. The combination of intense summer heat and reduced snowpack runoff creates peak risk conditions from June through September.2
High Nutrient Loading: Excess agricultural fertilizer runoff – infused with phosphorus and nitrogen, livestock waste, and urban stormwater feed the bacteria.
Internal Loading: In deep reservoirs like Blue Mesa, oxygen-depleted bottom waters trigger the release of historical, sediment-bound phosphorus back into the water column.
Wildfire Aftermath: Runoff from regional burn scars carries massive loads of ash and nitrates directly into feeding tributaries.3
River Regulation: Major dams and impoundments artificially slow down river velocity.
Drought Depletion: Persistent droughts drop the total water volume, lengthening the hydraulic retention time. This gives the bacteria prolonged periods to multiply without being flushed downstream.4
Thermocline Barriers: Intense sunlight creates a distinct warm, less dense upper layer of water separated from the cold deeper water.
Buoyancy Advantage: Many harmful cyanobacteria types (like Microcystis) regulate their buoyancy. They rise to the calm, sunlit surface layer to trap light while exploiting the stable water column to form thick surface scums.5
Low Turbidity: When sediment settles in slow-moving sections or reservoirs, water clarity increases. Sunlight penetrates deeper into the water column, accelerating the photosynthetic replication of the bacteria.6
The threat presented by higher concentrations of TDS
Hydrologists are highly concerned about the increase in Total Dissolved Solids in the Colorado River because elevated salinity inflicts an estimated $350 million in annual economic damages across the Southwest. Driven by climate change, prolonged droughts, and agricultural runoff, rising TDS poses specific, localized threats:7
Agricultural Damage: High-salinity water reduces crop yields and stunts the growth of salt-sensitive crops like citrus, vegetables, and alfalfa grown in the Imperial and Coachella valleys.
Infrastructure & Municipal Costs: Salty water corrodes municipal water pipes, shortens the lifespan of residential water heaters and appliances, and burdens water treatment facilities with expensive reverse osmosis remediation.
International Obligations: High TDS levels complicate compliance with the 1944 Water Treaty, which dictates the quality and quantity of Colorado River water the United States must deliver to Mexico.
Ecological Degradation: Elevated salinity levels disrupt the delicate biological balance, negatively impacting native fish and aquatic habitats in the river basin.To manage these threats, the Colorado River Basin Salinity Control Forum implements ongoing watershed management and mitigation programs to intercept salts before they reach the river system.8
To manage these threats, the Colorado River Basin Salinity Control Forum implements ongoing watershed management and mitigation programs to intercept salts before they reach the river system.9
Wikipedia photo of Castor canadensis taken by Minette Layne in 2009.
by Robert Marcos
Beavers are experiencing a resurgence across much of the contiguous United States, most visibly in the Pacific Northwest (including parts of Oregon and Washington), the Mountain West (such as Yellowstone and adjacent basins), and the arid Southwest, where they are being actively reintroduced into degraded desert streams to restore wetlands and water storage. They have also rebounded in many eastern and midwestern states, forming thriving populations along rivers, streams, and ponds from the Northeast through the Midwest, while remaining sparse or absent only in a few deep‑South regions.1
The resurgence of beavers is creating a wide range of ecological, hydrological, and sometimes economic benefits because they act as “ecosystem engineers” that reshape streams and wetlands in ways that support many other species and services.2
Water storage and drought resilience
Beaver dams slow runoff and create ponds and wetlands that store rain and snowmelt on the landscape, which helps maintain base flows during dry periods. In some basins, beaver activity has been linked with up to about 60% more open water during drought compared with pre‑beaver conditions, effectively deepening local water storage and raising groundwater levels.3
Flood and erosion control
By temporarily holding back pulse flows, beaver‑engineered wetlands reduce peak flood volumes downstream, sometimes cutting flood flows by around 50–60% in trials. They also trap sediment and slow the movement of eroded material after storms or fires, which helps protect stream channels and reservoirs from siltation.4
Biodiversity and habitat
Beaver‑created wetlands and ponds increase habitat complexity, supporting more insects, amphibians, fish, birds, and other wildlife than comparable un‑dammed reaches. The mosaic of ponds, canals, log jams, and oxidized–reduced microhabitats boosts species richness and can benefit runs of fish such as salmon and trout by creating refuge pools and cooler water refugia.5
Water quality improvements
Beaver ponds act as low‑tech filters: sediments and attached pollutants settle out, and microbes in pond sediments help break down nitrogen and other contaminants. This has been documented in both agricultural and urban settings, where beaver‑modified reaches show reduced sediment loads and lower nutrient export downstream.6
Climate and carbon resilience
Beaver‑engineered wetlands can store carbon in pond sediments and surrounding vegetation, and their slow‑release hydrology helps buffer landscapes against both floods and droughts—a key feature in climate‑change‑adapted watersheds. In the American West and other arid regions, that “nature‑based” storage is increasingly seen as a low‑cost tool for watershed resilience and water‑supply augmentation.7
Pure Water Oceanside water treatment and recycling plant. Photograph by Robert Marcos
By Robert Marcos
In a drier future, if Southern California’s municipalities lost all access to imported water, they’d need twenty to thirty new desalination plants – each producing 50 million gallons of water a day, to make up for the 2.6 million acre feet of water that the region’s 19 million residents currently use.1
Unfortunately we know that desalination plants take far too long to build, require far too much energy, and at $3000 to $3600 per acre foot – the water they produce is far too expensive.2 This is why the state’s official “water supply strategy” promotes the development of wastewater recycling and stormwater capture first, with desalination considered as a last resort.3
Wastewater Recycling
The recycling of wastewater is a favored solution because it treats water that’s already within the system. Wastewater recycling – also known as water reclamation, follows a multi-stage purification process that accelerates the Earth’s natural water cycle. It typically begins with primary treatment, where wastewater is held in settling tanks to allow heavy solids to sink and be removed. In secondary treatment, oxygen is added to aeration tanks to help naturally occurring microbes consume dissolved organic pollutants. The process then moves to tertiary treatment, involving fine-grained filtration through sand, coal, or membranes, followed by disinfection using chlorine or ultraviolet (UV) light to kill remaining pathogens. For potable (drinking) water applications, advanced systems may add reverse osmosis and advanced oxidation to remove trace chemicals and salts. This treated water is then distributed through a dedicated “purple pipe” system, separate from standard drinking water lines, for uses like landscape irrigation, industrial cooling, and groundwater replenishment.4
San Diego’s multi-year “Pure Water” wastewater recycling project is expected to cost over $5 billion, with Phase 1 alone costing approximately $1.5 billion and future phases projected to significantly raise the total expense. Phase 1 is expected to produce 30 million gallons of potable water daily, with the entire system potentially costing $5 billion or more.5
Stormwater capture
In a city like Los Angeles, stormwater capture is the process of collecting rainfall and urban runoff from open spaces, rooftops, and streets to either use directly or—more commonly—to allow it to soak into the ground to recharge local groundwater basins for future use. This is achieved through large-scale infrastructure like spreading grounds and dams, as well as community-level projects like rain gardens and permeable pavement. While the infrastructure itself is highly reliable—with the county currently capable of capturing enough water to serve millions of people during wet years—the overall supply remains inconsistent because it depends entirely on highly variable seasonal rainfall. For instance, capture totals can swing drastically from roughly 120 billion gallons in a record wet season to just 11.9 billion gallons in a dry one, making it a valuable but unpredictable supplement to the region’s imported water sources.6
The cost to create a stormwater capture system in Los Angeles varies drastically based on scale, ranging from $100 for a simple home rain barrel to over $70 million for massive regional infrastructure projects.7
As record-breaking heatwaves and droughts become more frequent, natural sources of water that insects and wildlife have historically depended upon are drying up. In response a growing number of homeowners are transforming their yards into life-saving “hydration hubs”. In addition to serving the needs of animals these simple actions help people to move from regret to action and then even pleasure as they watch deer, opossums, bees, and other wild animals obtain lifesaving water.1
Young mule deer drinking from a bird bath. Photo on Pinterest by Susan Sam 2018.
Deer act as vital ecosystem engineers by managing plant growth and promoting biodiversity through their grazing habits. As they move across various habitats, they disperse seeds via their fur and waste, aiding in forest regeneration and the spread of native flora. Furthermore, they serve as a primary food source for large predators, while their carcasses provide essential nutrients to scavengers and the soil, maintaining a balanced and nutrient-rich food web.2
Baby opossum drinking from a pyrex dish. Photo by r/Opossums on Reddit.
Opossums act as “nature’s sanitation workers” by providing essential pest control and waste removal services right in our backyards. As opportunistic scavengers, they keep neighborhoods clean by consuming overripe fruit, roadkill, and organic waste that might otherwise attract less desirable pests like rats or roaches. They also help maintain ecological balance by hunting common garden nuisances such as snails, slugs, and even venomous snakes, to which they have a natural immunity. Furthermore, their low body temperature makes them highly resistant to rabies, meaning they are far less likely to spread the disease than other urban wildlife.3
A terracotta bowl filled with water, mint leaves, and brightly-colored marbles to attract bees and pollinators. Photo by Beeappy on Reddit.
Pollinators like bees, butterflies, and bats are the silent backbone of our local ecosystems, facilitating the reproduction of nearly 80% of the world’s flowering plants and one out of every three bites of food we eat. By transferring pollen between blooms, they ensure the production of the fruits, seeds, and nuts that feed both humans and wildlife, while simultaneously maintaining the genetic diversity necessary for resilient landscapes. Beyond agriculture, their work supports the growth of oxygen-producing plants and provides the foundational habitat for countless other species, making their presence a direct indicator of a healthy, thriving environment.4
Red-tailed hawk in a birdbath. Photo by Chris Naftel in the Tehachapi News.
Red-tailed hawks are apex predators that maintain ecological balance by regulating the populations of small mammals, including rodents, rabbits, and squirrels. By controlling these populations, they provide free pest control for both urban environments and agricultural lands, which helps prevent overgrazing of vegetation and crop damage. Beyond their role as hunters, they are valuable indicator species; their presence and reproductive success reflect the overall health and biodiversity of the local ecosystem. Additionally, their large nests can provide secondary habitat for smaller bird species, such as house sparrows, while their opportunistic scavenging contributes to natural nutrient cycling.5
Photograph of a crystal clear stream obtained from Storyblocks
by Robert Marcos
I was dumbfounded to hear a scientist with the U.S. Geological Survey say, “I wish we could date this water so we’d have a better idea where it came from”. We were standing alongside a tiny creek that led into Colorado’s White River, and the scientist was essentially wondering if the water in the stream came from rainfall, or had risen from a shallow aquifer. Generally rainfall would be “younger” and water from aquifers would be older – sometimes by many thousands of years. But how could anyone possibly determine the age of water?
Answer: by analyzing its chemical composition.
The USGS dates groundwater using chemical and isotopic tracers whose concentrations change in known ways over time in the atmosphere and then get preserved in recharging water. For young groundwater—typically less than about 50–70 years old—USGS commonly uses substances like chlorofluorocarbons (CFCs), sulfur hexafluoride (SF₆), and tritium and its decay product helium‑3. These are measured in specialized facilities such as the Reston Groundwater Dating Laboratory, which analyzes dissolved gases and transient tracers in samples from wells and springs. The key idea is that atmospheric histories of these tracers (for example, industrial production curves for CFCs or tritium from nuclear weapons testing in the 1950s–60s) provide a time stamp that can be matched to what is found in the water.1
One example is tritium-based age classification – where a single measurement of tritium is used to classify groundwater as “modern” (recharged in 1953 or later), “premodern” (before 1953), or a mixture of the two. The year 1953 roughly marks the onset of elevated tritium from atmospheric nuclear testing, making it a convenient boundary between older, background conditions and post‑bomb‑pulse recharge. By comparing measured tritium to location‑ and time‑specific thresholds, USGS can quickly determine whether a sample reflects recent recharge that may carry contemporary contaminants or older water that has been isolated from the modern surface for decades or longer.
For slightly older water—hundreds to tens of thousands of years—USGS uses longer‑lived isotopic tracers such as radiocarbon (carbon‑14) dissolved in inorganic carbon. Radiocarbon decays predictably over time, so its remaining fraction in groundwater indicates how long it has been since the water equilibrated with atmospheric carbon at the surface. At even greater ages, other isotopes and noble gases may be used to extend the window into tens of thousands of years or more. No single method is perfect; each tracer has limitations, such as contamination from local sources, mixing of waters of different ages, or chemical reactions that alter concentrations. As a result, USGS often applies multiple tracers together and interprets them with groundwater flow models to better constrain age and understand the distribution of ages in a well or discharge area.
USGS dates groundwater because age is fundamental for managing water resources and assessing vulnerability to pollution. Age indicates how quickly water moves through the subsurface, how long it will take for land‑use changes to affect wells and springs, and whether contaminants like nitrates, pesticides, or per‑ and polyfluoroalkyl substances (PFAS) reflect current practices or legacy inputs. By linking age to contaminant trends, managers can judge whether improvement efforts will show benefits in years, decades, or even longer. Age information also supports sustainable yield estimates, helps distinguish short‑term variability from long‑term change, and reveals dependencies on very old water that may take thousands of years to replenish.
Crystal Springs in the Ash Meadow National Wildlife Refuge. Photo by Pahrump Photography
by Robert Marcos
The water in Amargosa Valley is a scientific oddity in that it serves as a living time capsule, and it supports life in one of our planet’s harshest environments. The Amargosa River flows underground for roughly 185 miles – surfacing only occasionally to create lush oases in the Mojave Desert.
Here are some remarkable aspects of this unique water system:
Ancient “Fossil Water”: Much of the groundwater in the Amargosa Basin is fossil water that was recharged during the last Ice Age, between 10,000 and 100,000 years ago. The water travels through a massive regional aquifer of limestone and dolomite rock from sources as far away as the Spring Mountains.1
A “Bottomless” Cavern: The system feeds Devils Hole, a water-filled limestone cavern in the Ash Meadows National Wildlife Refuge. Divers have never found its bottom, but it has been explored to depths of over 500 feet.
Geological Sensitivity: The water level in Devils Hole is so precisely tuned to the Earth’s crust that it acts like a giant seismograph. Massive earthquakes thousands of miles away in Japan or Mexico have caused “tsunamis” several feet high inside this tiny desert pool.2
Two male Devils Hole Pupfish. Photographed by Olin Feuerbacher / USFWS
Extremophile Habitats: The valley’s springs support the Devils Hole pupfish, which has the smallest habitat of any vertebrate species on Earth. These fish survive in water that is 93°F and nearly devoid of oxygen, conditions that would be lethal to most other fish. The pupfish are closely monitored by an interagency group – consisting of the U.S. Fish and Wildlife Service, the National Park Service, and the Nevada Department of Wildlife. Scientists from these agencies frequently count the number of fish, collect their eggs, and are are undertaking captive rearing and “population augmentation” (which means they release captive-bred fish into the water in order to support the existing population, which is struggling).
Global Biodiversity Hotspot: Ash Meadows National Wildlife Refuge is home to 26 endemic species of plants and animals that exist nowhere else on Earth. This high concentration of unique life, isolated in “islands of water” within the Mojave Desert, has earned the area the nickname “The Galapagos of the Desert”. The endangered fish include the Devils Hole pupfish, Warm Springs pupfish, Ash Meadows Amargosa pupfish, and the Ash Meadows speckled dace. Several unique species of endemic plants include the Amargosa niterwortthe Ash Meadows milkvetch, the Ash Meadows blazingstar and Spring-loving centaury.3
Deep-Fault Thermal Springs: The heat in local thermal springs, such as those near Tecopa, is likely caused by deep water circulation along faults rather than a shallow volcanic heat source. The geothermally-heated water in the Amargosa Valley – including the water at Devils Hole, is heavily influenced by the region’s limestone and dolomite bedrock. As rainwater from the nearby Spring Mountains moves through deep underground fractures, it is heated by the Earth’s core and dissolves various minerals along the way.4
Image created by Google Gemini, May 6th, 2026, from the prompt: “generate a funny picture of a skeleton wearing a beach hat in the desert”.
by Robert Marcos, photojournalist
Water that’s banked in Lake Mead is officially called “Intentionally Created Surplus“, or ICS. The ICS allows major water users in the lower basin to store conserved or unused Colorado River water in the reservoir for their future use.
As of May 2026, Lake Mead’s water volume was 8.3 million acre-feet – or roughly a third of its total capacity. But after publishing this article we were made aware that we should subtract Lake Mead’s 2.3 MAF deadpool from that amount, which brings it down to about 6 MAF. Currently the ICS holds about 2.3 million acre feet of that water, which represents about 38% of Lake Mead’s available water.
Here’s a list of the water agencies and the estimated amount of water that each of them have currently banked in Lake Mead –
Arizona: According to official tracking from the USBR and the CAP, the state of Arizona’s total balance of accumulated Intentionally Created Surplus water stored in Lake Mead as of May 15th is approximately 310,000 to 350,000 acre-feet.
California: As of May 2026, California has roughly 1.2 to 1.4 million acre-feet of water banked in Lake Mead through the ICS and other conservation programs. Major participants include the Metropolitan Water District of Southern California, the Imperial Irrigation District, and the Palo Verde Irrigation District.4
Nevada: As of May 2026, Nevada has approximately 479,184 acre-feet of water banked in Lake Mead through the ICS program. This total represents a major portion of Nevada’s overall “water savings account,” which includes several different banking locations and programs.5
Mexico: As of May 2026, Mexico has approximately 200,000 acre feet of water banked in Lake Mead through the ICS program and related binational agreements. Mexico was granted the right to store water in Lake Mead following a 2010 earthquake that damaged its irrigation infrastructure. By 2026, these stored volumes have stabilized at around 200,000 acre-feet as Mexico uses the lake as a buffer against shortages.7
Tomatos being sorted by a farmer in the Mexicali Valley. Photo from Storyblocks
by Robert Marcos
Last week the lower basin states of Arizona, California, and Nevada, along with tribal leaders, offered to leave somewhere between 700,000 to a million acre-feet of water in the Colorado River system through 2027–2028. The states described it as more than 3.2 million acre-feet of savings by 2028 and a way to stabilize Lake Mead and Lake Powell while longer-term negotiations continue.1
What caught my eye about this story is that Mexico – which by law had received 1.5 million acre feet of Colorado River water annually, was already conserving some of that water due to a previous agreement that promised to conserve 400,000 acre-feet between 2023–2026.2
Reportedly, farmers south of the border are unhappy with these arrangements. Farmers in Mexicali Valley said they feel frustrated with the mandatory Colorado River water conservation, and they reported that they’ve been “cheated” out of resources they desperately need to survive. While Mexico agreed to specific water reductions as part of a binational plan with the U.S., many farmers in the Valle de Mexicali have reached a breaking point due to unpaid compensation.3
The prevailing sentiment of farmers in Mexicali Valley is characterized by the following:
Financial Betrayal: Many farmers in Northern Baja’s district 14 agreed to leave thousands of acres of land fallowed in order to conserve Colorado River water – in exchange for $4.5 million dollars in direct payments. However, they claim the Mexican government failed to pay them, which has left these farmers without any income whatsoever.4
Opposition to New Water Laws: Recent sweeping changes to Mexico’s national water law have stripped long-held water rights away from farmers, consolidating control in the hands of the federal government. Farmers view this as a move to prioritize urban centers like Tijuana and Ensenada over agricultural needs.
Sovereignty Concerns: There is a strong feeling that the Mexican government is surrendering national sovereignty by complying with U.S. water demands while its own agricultural sector suffers from “death” through deprivation.
Escalating Resistance: Farmers have responded with aggressive protests, including blockading major trade routes at the U.S.-Mexico border with semi-trucks and seizing control of critical dams. Some have even threatened to “spill” their water or return to farming—even if unprofitable—just to prevent the government from redirecting it elsewhere.5
In 2013 Southern California’s San Onofre Nuclear Generating Station was retired eleven years ahead of schedule. This was because of severe, premature wear in the tubes of its replacement steam generators that led to a radioactive leak and made the cost and regulatory uncertainty of a full repair unfeasible for its operators.1 Worse, the closure occurred just after ratepayers in San Diego, Orange, and Riverside Counties had spent $1.88 billion for an overhaul of the plant.2 A year later the California Public Utilities Commission approved a $4.7 billion settlement where ratepayers were made responsible for approximately $3.3 billion of the plant’s closing costs, to be paid over a 10-year period.3
Ratepayers continued to pay for “undepreciated net investments” in the retired nuclear plant—essentially paying off the remaining debt for construction and equipment that had not yet been fully depreciated before the early shutdown. Even after the shutdown, utilities were allowed to collect funds for maintaining safety and security at the retired site.4
The San Onofre debacle illustrates how utilities use regulatory “cost recovery” and “stranded asset” mechanisms to pass billions in losses from failed or retired facilities onto ratepayers. Nationally, this system allows investor-owned utilities to maintain profits even after large projects fail, as seen with coal plant retirements and canceled transmission lines.5
How Ratepayers get Soaked for closed power generation facilities
Utilities nationwide use several key tactics to recover costs from assets that no longer produce power:
Stranded Asset Recovery: When a plant like San Diego’s San Onofre Nuclear Power Plant shuts down prematurely, utilities often seek to recover their remaining “undepreciated investment”. For San Onofre, a controversial settlement originally placed $3.3 billion of the $4.7 billion shutdown cost on ratepayers over 10 years.6
Guaranteed Returns on Failed Investments: Utilities typically enjoy built-in profit margins (often around 9-10%) on their infrastructure investments. Even after a plant is shuttered, they may continue to collect these returns. In the San Onofre case, regulators eventually reduced the shareholder return to less than 3% for the retired assets, which still left customers paying for the principal investment.
Replacement Power Costs: When a major facility goes offline, utilities must buy electricity from elsewhere. Ratepayers often bear these “purchased power” costs. San Diego and Southern California customers saw estimated costs of $350 million to $1.1 billion just for replacement electricity following the San Onofre outage.
Decommissioning Surcharges: Long-term cleanup and waste storage costs are frequently funded through special ratepayer-backed accounts. Decommissioning San Onofre is estimated to cost $4.7 billion, much of which was pre-funded by customers during the plant’s operating years.
The “Uneconomic Dispatch”
This model extends beyond nuclear power to fossil fuels and infrastructure:
Coal Plant “Uneconomic Dispatch”: Utilities nationwide continue to run expensive coal plants that cannot compete with cheaper gas or renewables because they can recover fuel and operation costs from customers. This “uneconomic dispatch” cost U.S. consumers an estimated $24 billion from 2015 to 2024.
Securitization: Some states use “securitization”—issuing low-interest bonds to pay off a utility’s remaining investment in a closed plant. While this can lower customer bills compared to standard utility returns, it still ensures the utility is paid in full for a non-working asset.
Failed Infrastructure: Similar to the faulty steam generators at San Onofre, ratepayers have been held responsible for abandoned projects like PG&E’s scrapped transmission line to Canada ($20 million) and Duke Energy’s retired Crystal River nuclear plant in Florida ($1.3 billion in bonds).
Vertical agriculture using shipping containers that recycle fish water is a method known as containerized aquaponics. This system creates a closed-loop, symbiotic ecosystem where fish and plants mutually benefit one another within a highly controlled environment.1
How the Recirculating System Works
The process mimics natural pond ecosystems through a cycle of nutrient exchange. Fish (typically tilapia, catfish, or trout) are raised in tanks at the base of the container. They produce waste rich in ammonia as they are fed. Beneficial bacteria in the system’s biofilters convert this toxic ammonia into nitrites and then into nitrates, which serve as a natural fertilizer for plants. This nutrient-rich water is pumped upward to irrigate rows of plants stacked vertically in trays or towers. As the plants absorb the nutrients, they act as a natural filter, cleaning the water. This purified water is then gravity-fed or pumped back down to the fish tanks to begin the cycle again.2
Key Components in a Shipping Container Farm
Housed in standard 20-or 40-foot containers, these units include specialized technology to maintain the ecosystem. Climate Control: HVAC systems regulate temperature, humidity, and CO2 levels regardless of external weather. LED Lighting: Tailored light spectrums simulate sunlight and optimize plant growth year-round. Automation & Sensors: Smart systems monitor pH levels, oxygen saturation, and nutrient flow, often allowing for remote management via smartphone. Renewable Energy: Some modular units, like those from FarmPod, use solar panels to power pumps and lights, making them off-grid capable.3
Benefits and Efficiency
Water Conservation: These systems use up to 90–95% less water than traditional soil-based farming because the water is constantly recycled. High Yield in a small footprint: A single container can produce the equivalent of 1 to 4 acres of traditional farmland output. Urban Adaptability: Because they are modular and mobile, they can be placed in parking lots, on rooftops, or in urban “food deserts” to provide hyper-local produce. Chemical-Free: The closed-loop nature eliminates the need for synthetic fertilizers and pesticides, producing organic-quality crops and fish simultaneously.4
In 2022, University of California Davis published the results of a three-year study on covers crops, which was carried out on ten commercial farms and research sites in California’s Central Valley. The study examined the impact of winter cover cropping on soil health and water retention in irrigated agricultural systems with a focus on almond and tomato crops, which are two of the most common crops grown in the region.1
Three cover crop systems were included in the study and then compared with adjacent control fields that were left bare, at the same site. The systems included: 1) a cover crop in processing tomato fields; 2) a cover crop planted in between rows of almond trees; and 3) allowing whatever native vegetation was available to grow in between the almond tree rows. The planted cover crops were a mix of legumes, grasses, and brassicas.
The results were impressive. Researchers found that the cover crop fields had higher levels of soil organic matter, soil nitrogen, and microbial activity, indicating improved soil health. In addition, the cover crop fields had higher levels of water infiltration and retention, meaning that they were better able to hold onto water during periods of drought or water stress. The researchers found that the cover crops did not compete with cash crops for water, and that the same amount of water used in the control fields without cover crops was able to support the same amount of crop yield in the cover crop fields. In one case in Davis, there was heavy rainfall at one point during the study. The water loss via evapotranspiration was greater in the bare control plot, showing that use of cover crops improved water retention.
The study provided important evidence of the benefits of winter cover cropping in California’s Central Valley, particularly for improving soil health and reducing water usage in agricultural systems. The findings suggest that cover crops can help farmers make more efficient use of their water resources, potentially reducing the need for additional irrigation, and providing environmental benefits such as reduced erosion and improved water quality.
Top 5 Cover Crops for use in the Western US
For the Western United States – including the arid regions of California, Arizona, and Nevada, the best nitrogen-fixing cover crops are selected for their drought tolerance and ability to thrive in either high heat or mild winters.2
Cowpea: Best For: Summer heat in low-elevation deserts. Highly drought-tolerant with a taproot that can reach up to eight feet deep to access water. It thrives when temperatures exceed 100° F and can fix roughly 100–175 lbs of nitrogen per acre. The ‘Iron Clay’ variety is widely recommended for use in the Southwest.
Alfalfa: works best for long-term soil restoration. Often called the “queen of forages,” alfalfa is a perennial legume with deep roots that break up subsoil and reach nutrients deep in the earth. It is one of the most powerful nitrogen fixers, capable of producing 250–500 lbs of nitrogen per acre.
Crimson Clover: Used as winter cover in the Southwest or for spring cover in the north. A fast-growing annual that establishes quickly in the fall to provide winter protection. It is frequently used in mixtures with radish to improve soil structure while fixing roughly 70–150 lbs of nitrogen per acre.
Hairy Vetch: is excellent as a winter-hardy coverage and weed suppression. Why It Works: It grows slowly in the fall but resumes vigorous growth in the spring, creating a thick mat that smothers weeds. It is known for high nitrogen fixation (over 100 lbs per acre) and performs well in the cooler, non-agricultural environments of the West.
Lablab: works best during the summer-to-fall transition in Arizona. Lablab is specifically noted for its performance in the hot weather of central Arizona. It produces high biomass and can contribute 50–200 lbs of nitrogen per acre. Unlike some other summer legumes, it continues vegetative growth late into the year without flowering immediately, offering more flexible termination dates for growers.
They say that bad news will travel around the world three times while good news is still putting its shoes on, which is exactly how I feel about this news about our water use: Our transition from coal-fired power generation to wind and solar has turned out to be one of the most effective ways to conserve our nation’s fresh water.
Transitioning from coal-fired power generation to renewable wind and solar has significantly reduced water consumption, and has provided critical relief to water-stressed regions. While coal plants once competed directly with agriculture and municipalities for freshwater, the shift to renewables allows billions of gallons of water to remain in local ecosystems and aquifers.1
The electric power sector uses a large amount of water, mostly for cooling. Thermoelectric power plants (including natural gas, nuclear, and coal plants) boil water to create steam, which spins a turbine to generate electricity. The steam leaving the turbine must be cooled back into water to be used to generate more electricity. Plants withdraw water from nearby rivers, lakes, or oceans and pass that water through the steam leaving the turbine. That process cools and condenses the steam back into water. In 2021, 73% of the utility-scale electricity generated in the United States came from thermoelectric power plants.2
Traditional coal-fired power plants are incredibly water-intensive – requiring approximately 19,185 gallons of water per megawatt-hour, (primarily for cooling), while wind and photovoltaic solar power generation requires no water – except for periodic washing to remove dust and bird droppings. Nationally, replacing the remaining coal fleet with wind and solar could decrease electricity-related water consumption by over 99%, potentially making 2.6 billion cubic meters of water available for other uses each year.3
Environmental benefits
Protecting Local Ecosystems: Retiring fossil fuel plants directly restores local river health. For instance, some subbasins are projected to see a 57% increase in annual streamflow by 2050 as plant withdrawals cease, benefiting local agriculture and wildlife.
Efficiency Gains: The U.S. Energy Information Administration reports that the changing energy mix—led by the rise of renewables—is responsible for roughly 80% of the downward trend in water withdrawals by the electric power sector.
Climate Resilience: This is a critical shaft for drought-prone regions. In the American West, moving to low-water energy sources leaves much-needed freshwater in its natural environment.
Regional Shifts in Water Stress
The impact of this transition has been most visible in arid regions where coal production and cooling previously dominated local water use. Coal plants in states like Arizona, Colorado, and New Mexico have historically consumed enormous volumes of surface water from the Colorado River and other critical basins. Retiring these plants is projected to significantly curtail annual water withdrawals, with some rivers seeing a net increase in streamflow of up to 57% by 2050.4
In Texas and California replacing fossil fuel generation with wind and solar PV can decrease water consumption by over 98%. This shift is particularly impactful in Texas, which has seen the largest absolute reduction in coal generation in the U.S. over recent years.5
In China a transition toward renewables in northwestern regions (like Inner Mongolia and Xinjiang) has been essential for alleviating “extremely high” water stress. Research shows that closing coal mines in these areas leads to a rapid restoration of Terrestrial Water Storage, increasing water availability by an average of 18.8 mm per year through groundwater recovery.6
Click the link to read the article on the KJZZ website (Alex Hager). Here’s an excerpt:
April 17, 2026
On the outer edges of the Phoenix metro, the small town of Cave Creek sits nestled among the saguaro-dotted hills. It’s home to about 5,000 people and known mostly for its quiet residential neighborhoods, art galleries and an annual rodeo…Cave Creek, which gets about 95% of its water from the Colorado River, will be among the first to feel the impact of those cuts…Colorado River water travels to Cave Creek through the Central Arizona Project, a 336-mile canal that carries water from the state’s western border to the Phoenix and Tucson areas.
The federal government has suggested major cuts to the amount of water the CAP carries each year, forcing Cave Creek officials to find a backup plan quickly. They will be able to keep taps flowing in the short term, but the future is uncertain, as long-term fixes are expensive and complicated…The first option for most cities, [Brad] Hill said, would be a turn to groundwater. For most, it is relatively easy and cheap to dig more wells near town and carefully use some of the water sitting in underground aquifers. Cave Creek cannot do that. Aquifers underneath the Valley are shaped like bathtubs. For one of those bathtubs, the deepest part is in the middle, and Cave Creek sits on the outer edge, so there isn’t much water underneath town…Cave Creek is, part of a program to store excess Colorado River water underground. The town pays an annual fee for the rights to put water into that pool, which essentially serves as an emergency savings account for times when there isn’t enough water above ground to serve everybody’s needs. Cave Creek has the right to take some of that water, but first it has to physically get it to town. Since the underground aquifer is far away, building a pipe directly into it would be prohibitively expensive and time-consuming. So instead, Cave Creek will be part of an exchange. Cave Creek is working on deals with three other Valley cities: Phoenix, Peoria and Surprise. Those cities can more easily tap into that underground savings account, so they will start using more groundwater and leave some of their CAP water in the canal, where Cave Creek can access it using its existing pumps.