#ColoradoRiver District Offers Drought Relief for Yampa Valley Agriculture — Lindsay DeFrates #YampaRiver

Elkhead Reservoir is taking center stage following a winter of historically low snowfall, leaving water managers with hard decisions and water users with a high degree of uncertainty. Courtesy Photo/Colorado Parks & Wildlife

Click the link to read the release on the Colorado River District website (Lindsay DeFrates):

June 8, 2026

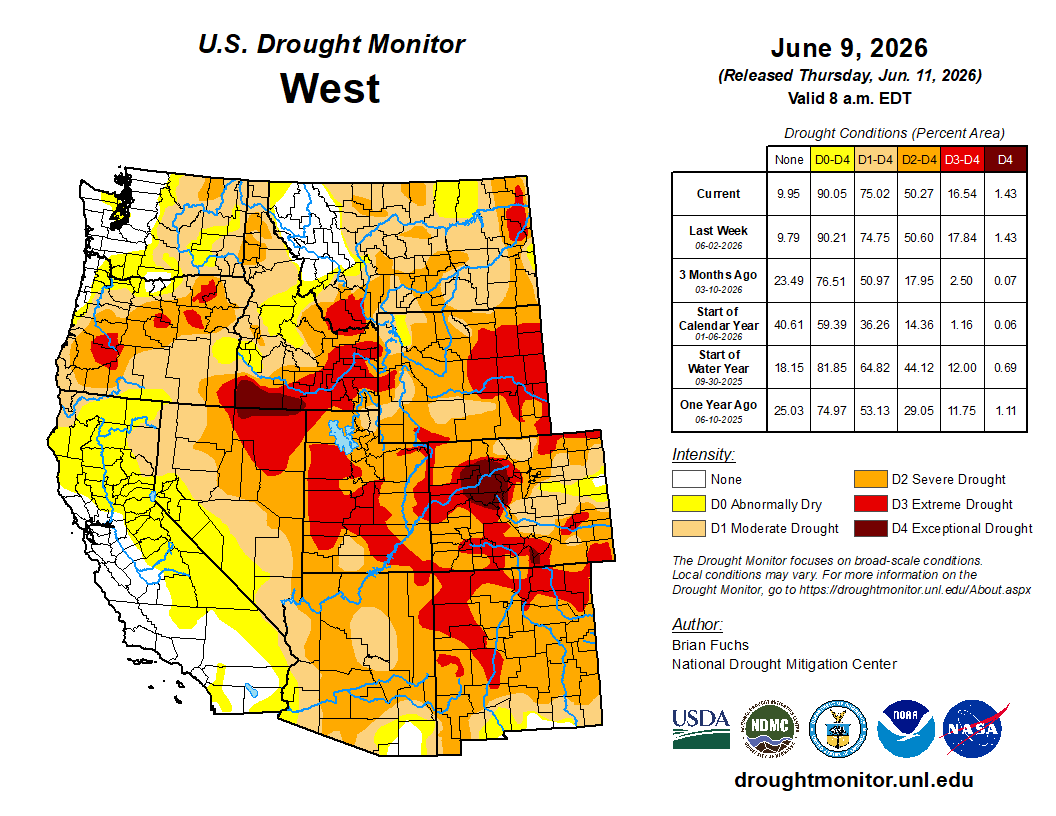
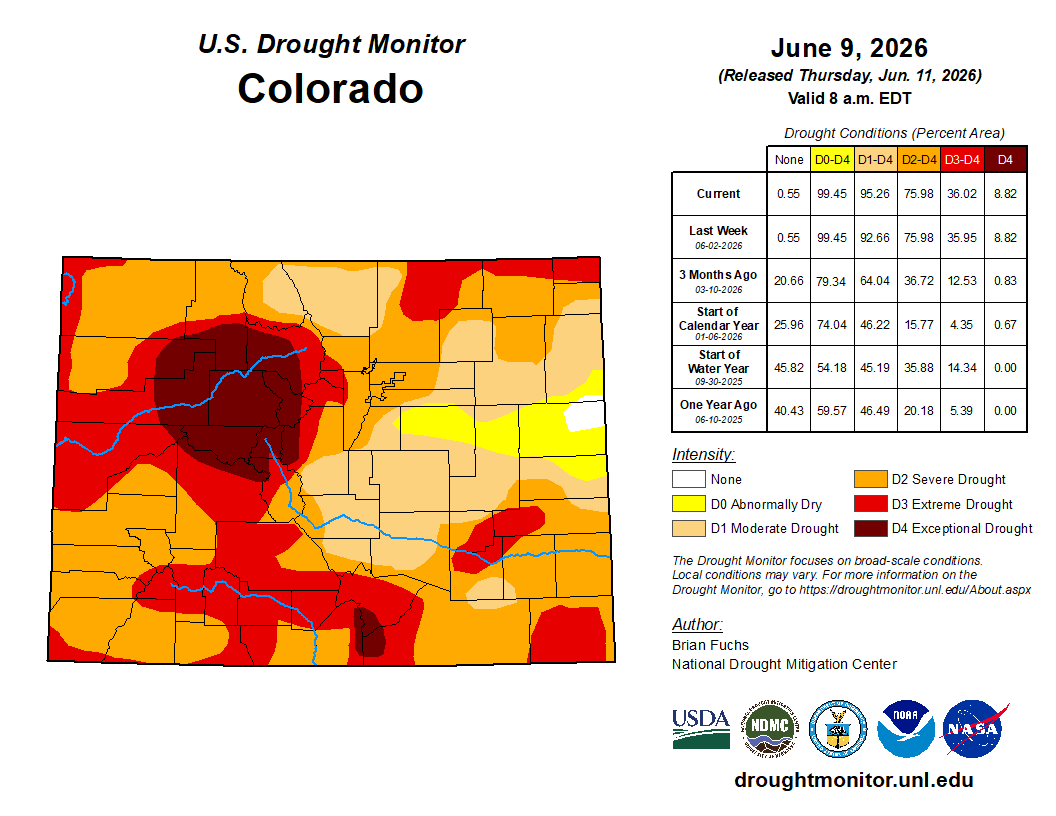
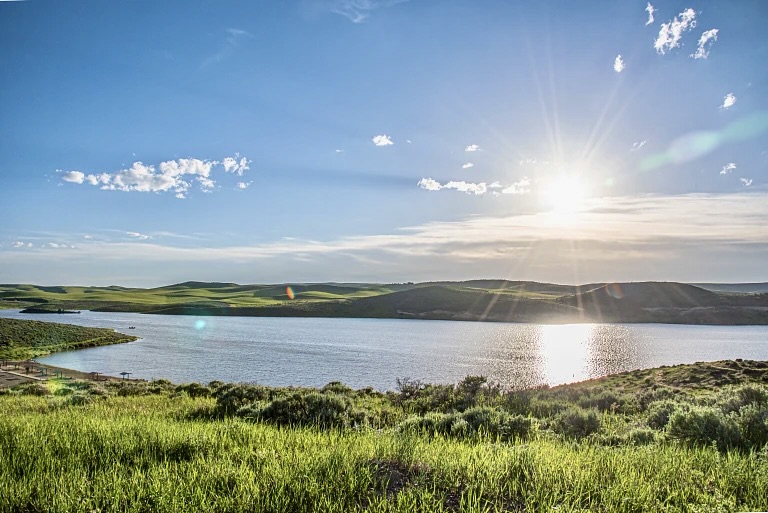
In response to extreme drought conditions throughout northwestern Colorado, the Colorado River District, in partnership with the Colorado Water Conservation Board (CWCB), is offering up to 420 acre-feet of supplemental agricultural water from Elkhead Reservoir for irrigators in the Yampa River Valley. Modeled on the successful joint CWCB-River District program implemented in 2021, this effort will provide additional supplies during critical times of agricultural production.

“The drought conditions this year have been exceptional and unpredictable,” said Colorado River District’s Director of Asset Management, Hunter Causey. “And it’s that kind of unpredictability that hits small family farms and ranches the hardest. The Yampa Valley, the western slope, and our entire region depend on local agriculture to drive economies, produce local food, and preserve landscapes. While a program like this cannot solve the drought problem at large, we can be strategic in how we use our available supplies and support our constituents wherever possible.”

“The challenges posed by this year’s drought call for creative solutions and strong partnerships,” said Lauren Ris, CWCB Director. “This project reflects what can happen when local water users and water management agencies work together to respond to emerging needs. We’re pleased to support this collaborative effort in the Yampa Valley and remain committed to working with communities across Colorado to explore creative, locally driven solutions that help address drought impacts and strengthen drought resilience.”

Program Structure:

  • Water will be allocated using a lottery with an initial round of allocations of up to 50 AF per applicant, totaling 420 AF.
  • Any water remaining after the lottery will be awarded equally to initial round applicants that expressed a need beyond 50 AF. If there is any remaining water, it will be available on a first-come, first-served basis and will need to be contracted at no cost with the District.
  • Successful participants in the lottery will need to enter into a no-cost contract with the River District for direct delivery and/or use of the District’s Elkhead water through administrative exchange.
  • In the event there is a mainstem Yampa River call and to the extent that lessees are out-of-priority, water will be released at the diversion rate plus transit losses.
  • Water will be available for delivery or exchange beginning on July 10, 2026.

At current agricultural water marketing rates, the total project will cost $18,375. On June 4, the Colorado River District Board of Directors agreed to make $4,594 available from the Board’s previously authorized CFP expenditures for the District’s 2026 Drought relief effort. The CWCB has committed to providing the remainder of the funds – approximately $13,781.

Applications are due by June 26th, and a lottery will be conducted for the initial round of contracts on July 1st. Available augmentation water is limited. Those interested in applying should contact the Colorado River District’s Director of Asset Management, Hunter Causey, at hcausey@crwcd.org or visit HERE for more information.

Yampa River Basin via Wikimedia.

If the IID wants their farmers to use less water, why don’t they just charge more for it?

A classroom setting with four individuals seated at a large table, attentively listening to a presentation about the Grand Canyon, displayed on a screen. The presenter, wearing a patterned shirt, stands at the front of the room beside a map of the Grand Canyon's historical geography.
The IID’s former Watermaster, Merlon Kidwell, makes a presentation to a group studying the Colorado River crisis. Photo by Robert Marcos.

by Robert Marcos & Brad Barham, PhD

In 2022 – while conducting a study of the Colorado River crisis, Dr. Brad Barham – a Professor of Agricultural Economics at the University of Wisconsin, Madison, two of his undergrads and I watched a Powerpoint presentation given by the Imperial Irrigation District’s Watermaster, Merlon Kidwell. Kidwell retired last year after fifty years with the IID. Besides the IID’s hospitality that day, there were two fundamentally-important things we’ve never forgotten –

1. The IID maintains 3,000 miles of delivery canals and agricultural drains that convey 3.1 million acre feet of Colorado River water every year. This amount represents about a quarter of the Colorado River’s average annual 12.5MAF output since 2000.1 Under its historic contracts with the federal government, the IID is exempt from paying for the water it receives, it does however pay for the operation, maintenance, and repair of the 80-mile long All-American Canal, its own internal water delivery systems, and a portion of the cost of maintaining the Imperial Dam.2

2. Similarly, the IID does not charge farmers for the water itself. It charges farmers (who are connected to the IID’s water delivery system) an annual fee for that connection, plus a flat $20 per acre foot for the costs associated with the delivery of their water. 3

Group of five people discussing near a water measurement structure in an agricultural area on a sunny day.
IID employees demonstrate an automated canal gate to a group studying the Colorado River crisis. Photo by Robert Marcos.

Meanwhile, the San Diego County Water Authority pays a wholesale price that’s between $700 and $1,200 per acre-foot for that same (untreated) Colorado River water.4 With such a disparity in water prices it seems reasonable to ask if the IID could both conserve water and lower the price paid by municipal users by raising the price paid by farmers.5

It doesn’t take an economist to understand the “law of demand” which says: “As the price of goods or services go up, people will generally use less of it”. Today with Lake Powell hovering just above the dead pool level it’ has become crucial’s more urgent than ever to understand why the price of water that’s provided to Imperial Valley farmers hasn’t gone up considering the increased scarcity of Colorado River water.

For decades now the Imperial Irrigation District has demonstrated that they prefer the carrot to the stick – in other words the IID has provided farmers with financial incentives and the technology that’s required in order to conserve water. The IID also cannot raise water prices because of laws established by California Proposition 218.

California’s Proposition 218 was passed by voters in 1996 in order to protect taxpayers by requiring voter approval for local tax increases and restricting property-related fees to the actual, proportional cost of service delivery 6. Since the IID receives Colorado River water for free, they can only charge farmers $20 per acre-foot to recover the costs associated with the water’s conveyance – but not for the water itself. Consequently, to legally increase agricultural water rates, the IID must prove higher service expenses through a formal cost-of-service study, issue a 45-day advance notice to landowners, and then begin the “majority protest” process. Because water, sewer, and refuse collection fees are legally classified as “property-related fees,” the Imperial Irrigation District board could pass the rate increase automatically unless a majority of affected stakeholders vote “no” by submitting written protests.7 In this context the “affected stakeholders” are the legal landowners of the agricultural parcels that are subject to the water fee, and the ratepayers, tenants, or farmers who are directly responsible for paying the water bill under their lease terms. 8

However the cost of these (very successful) conservation measures – especially the cost of paying farmers to fallow some of their fields, are very high: about $250 million per year (or $300-450 per acre foot depending on conservation practices used). Given how Western water laws work, and the addition of Proposition 218, that is currently the most feasible and the most immediate path to water conservation in the Colorado River system.

A lower cost, more sustainable solution would require changing the rules that guarantee specific volumes of water at only the cost of conveyance to farmers across the basin. That will be a challenging transition, and will probably require federal legislation to be achieved.

#Drought news June 11, 2026: Areas along the foothills of the Rocky Mountains from #Montana through #Colorado remained largely dry. Temperatures were above normal across much of the west, with departures of 6–9 degrees above normal across #Nevada, #Utah and western Colorado

Click on a thumbnail graphic to view a gallery of drought data from the US Drought Monitor website.

Click the link to go to the US Drought Monitor website. Here’s an excerpt:

This Week’s Drought Summary

Summer thunderstorms, with their hit-or-miss nature, dominated precipitation patterns across the U.S. this week. The greatest departures from normal precipitation occurred across portions of the central and southern Plains, West Texas, New Mexico, and the Midwest. Areas of southern Louisiana, northern Alabama, and western Kentucky also recorded well-above-normal precipitation. The East Coast remained dry, with the exception of Florida’s Atlantic coast. Much of the West also remained dry, with only portions of the Pacific Northwest and southern California recording near- to above-normal precipitation.

Temperatures for the week were below normal across the Southeast, with parts of Georgia, Florida, and South Carolina averaging 3–6 degrees below normal. Portions of West Texas, southeast New Mexico, and the Pacific Northwest were also below normal. The greatest temperature departures occurred in the central and northern Plains, where portions of Nebraska, South Dakota, North Dakota, and Minnesota experienced temperatures 9–12 degrees above normal.

Drought signals across much of the southern U.S. remain mixed, with wetter short-term conditions developing while long-term deficits persist despite the recent pattern change. In the Plains, impacts have primarily affected winter wheat and forage production, and areas that have remained dry continue to experience elevated fire danger. In the Southeast, water supply concerns and fire danger remain significant, particularly in Florida…

High Plains

Temperatures were generally warmer than normal across the region, with portions of the Dakotas and western Nebraska averaging 9–12 degrees above normal. Above-normal precipitation occurred in southern Nebraska, northern Kansas, northern Nebraska into southern and central South Dakota, and across much of northern North Dakota. Areas along the foothills of the Rocky Mountains from Montana through Colorado remained largely dry.

Drought intensity eased where the heaviest rains fell in Nebraska, Kansas and South Dakota, and drought was eliminated in portions of northern Kansas and southeast Nebraska. Southeast South Dakota continued to miss significant rainfall, and the combination of short- and long-term dryness allowed moderate and severe drought to expand. Degradation also occurred in eastern Colorado, where extreme drought expanded in the north and moderate drought expanded across east-central portions of the state. Extreme drought was reduced slightly in southern Colorado following recent rainfall…

Colorado Drought Monitor one week change map ending June 9, 2026.

West

Above-normal precipitation was limited to a few locations, primarily along the Pacific Northwest coast and across southern and eastern New Mexico. Temperatures were above normal across much of the region, with departures of 6–9 degrees above normal across Nevada, Utah and western Colorado. Cooler-than-normal temperatures occurred in the Pacific Northwest and eastern New Mexico, where departures averaged 3–4 degrees below normal.

Although some areas have recently received additional precipitation, a winter characterized by above-normal temperatures and below-normal snowpack continues to affect the region and will likely influence conditions through the summer. Conditions deteriorated in Oregon, where moderate, severe and extreme drought expanded across much of the eastern portion of the state, although southern Oregon experienced localized improvements to moderate drought.

Elsewhere, western Montana benefited from recent rainfall, allowing severe and extreme drought to improve. Extreme drought also improved across much of eastern Utah, while southern and eastern New Mexico saw additional improvements following precipitation totals exceeding 200% of normal…

South

Temperatures were mixed, with Oklahoma and Arkansas averaging 2–4 degrees above normal. Meanwhile, much of West, south and east Texas, along with eastern Mississippi and Tennessee, averaged 2–4 degrees below normal.

Most of the region received some precipitation, although eastern Arkansas, northern Mississippi, southern Texas, and southwest Oklahoma were the driest locations. The continuing wetter pattern resulted in additional improvements, with drought eliminated across more of central Texas and eastern Oklahoma. Drought also eased across much of the Texas and Oklahoma panhandles, although widespread severe and extreme drought persisted.

Long-term dryness in far south Texas continues to improve, and improving local conditions combined with short-term data supported the removal of remaining abnormally dry designations. Improvements also occurred in Arkansas, Mississippi, Louisiana, and Tennessee, where recent wet conditions are beginning to offset longer-term drought indicators…

Looking Ahead

During the next 5–7 days, the West is expected to remain quite dry, [ed. emphasis mine] while the southern U.S. and portions of the Midwest have the greatest potential for above-normal precipitation. The northern Plains and Southwest are forecast to receive less than 1 inch of precipitation.

Temperatures are expected to remain warmer than normal across the West, with departures exceeding 10 degrees above normal in Nevada and portions of the Pacific Northwest. Most of the remainder of the country is expected to experience near- to slightly below-normal temperatures.

The 6–10 day outlook shows the best chances for above-normal temperatures will be across the West and Southeast, especially in areas centered on Nevada and much of South Florida. Above-normal chances for below-normal temperatures will be centered on the Great Lakes and Midwest, with the highest probabilities over Michigan.

Above-normal chances for below-normal precipitation will be over much of the northern Plains and Upper Midwest, as well as northern areas of California, Nevada, and into Oregon. Above-normal chances for above-normal precipitation will be mainly in the southern and eastern U.S., with the highest probabilities in South Texas and into the lower Mississippi River Valley.

US Drought Monitor one week change map ending June 9, 2026.

Second-warmest spring in U.S. history: Record-low #snowpack and historic late-March heat were among the standout events — Bob Henson (YaleClimateConnections.org) #runoff

California superbloom. Photo credit: Travellers Autobarn

Click the link to read the article on the Yale Climate Connections website (Bob Henson):

June 8, 2026

The period of March through May 2026 ranked as the second warmest spring in records going back to 1895 for the contiguous U.S., according to NOAA’s National Centers for Environmental Information (NCEI). Across the past 131 years, only 2012 had a warmer spring, said NCEI in its monthly analysis released on June 8.

The nationwide average temperatures for both spring 2012 (56.17 degrees Fahrenheit) and 2026 (55.79°F) are both more than 1.5°F above any rivals in the 131-year database. Spring 2026 was the hottest on record for Arizona, Colorado, Texas, and New Mexico, and 38 of the 48 contiguous states had a top-five hottest spring (see Fig. 2).

Figure 1. Average temperature for the contiguous United States for each spring (March-May) from 1895 through 2026. (Image credit: NOAA/NCEI)
Figure 2. Temperature rankings by state for the contiguous United States for each spring (March-May) from 1895 through 2026. (Image credit: NOAA/NCEI)

Exceptional warmth this year in both March (warmest on record) and April (3rdwarmest on record)  – including a phenomenal heat wave that brought summerlike temperatures in late March to much of the central and western U.S. – was only partially tempered by a less extreme but still unusually mild May (28th warmest on record). Over the longer-term, the contiguous U.S. remains locked in a long-term warming pattern fully in line with human-caused climate change.

The 12-month running average temperature for the Contiguous U.S. continues to be at a record high.

Climatologist49 (@climatologist49.bsky.social) 2026-06-06T01:36:52.835Z

For the nation as a whole, spring 2026 ranked as the 37th driest on record, with a contiguous-U.S. average of 7.43 inches. After a parched March (8th driest), precipitation came in closer to average nationwide in April (46th wettest) and May (55th driest). However, that moisture was largely focused in the Midwest and Northeast. Michigan experienced its wettest spring on record, and it was a top-ten wettest spring for Wisconsin, Ohio, and Indiana. In contrast, it was a top-ten driest spring for Delaware, Maryland, North Carolina, and Virginia (see Fig. 3).

Figure 3. Precipitaton rankings by state for the contiguous United States for each spring (March-May) from 1895 through 2026. (Image credit: NOAA/NCEI)

For the contiguous U.S. as a whole, May 2026 had the second-worst May drought conditions in contiguous U.S. history, with a Palmer Drought Severity Index (PDSI) of -6.93. The only worse May occurred in the Dust Bowl year of 1934 (a PDSI of -7.03). The year 2026 has now had three of the top-10 months for worst contiguous U.S drought conditions since records began in 1895:

Aug 1934: -8.42
Jul 1934: -8.09
Mar 2026: -7.82
Apr 2026: -7.49
Sep 1934: -7.21
Jun 1934: -7.18
Oct 1934: -7.16
May 1934: -7.03
Jan 1940: -6.97
May 2026: -6.93

Figure 4. Departure of snow liquid water equivalent for the winter of 2025-2026, ending in April 2026. Units are in mm; 25.4 mm = 1.0 inch. The vast majority of the Western U.S. saw below-average snowfall, while much of western Canada had much above average snowfall. (Image credit, used by permission: Jihan Bhuiyan, Cornell)

For much of the mountain West, more “no” than snow

The March heat wave dissolved any hope of a respectable snow season for large parts of the western United States. From April into early May, large swaths of the Rockies had record-low snow levels for the season, as much of what was already a skimpy snowpack melted weeks ahead of average.

12-month running average snowfall for the Contiguous U.S. It's as if warming temperatures mean less snowfall. Who knew?

Climatologist49 (@climatologist49.bsky.social) 2026-06-06T17:17:32.849Z

Taking the edge off slightly was a notably moist period over parts of the Southwest in mid-May. That system brought some of the heaviest snowfall of the entire winter to areas that included the Front Range of Colorado (Fig. 5).

Figure 5. The heaviest snowfall of winter 2025-26 fell over leafed-out trees on May 6 in Boulder, Colorado. The May 5-6 storm total was 11.3 inches, capping the least-snowy winter in the 36-year history of Boulder’s current official observing station. (Image credit: Bob Henson)

In California, substantial rain and mountain snow in midwinter helped to keep put of the state’s reservoirs in better shape than one might assume from the early melt-off from unusual warmth.

Most of northern and central California remain within about 10% of normal, while much of the south state is well above normal, mostly on the basis of heavy rains in Nov and Dec.

Jan Null, CCM (@ggweather.bsky.social) 2026-06-01T02:54:08.045Z

The situation is considerably more dire across the Desert Southwest. Lake Powell and Lake Mead, which together serve thousands of farmers and millions of residents in six states, were both at less than 30 percent of capacity by early June.

Figure 6. Active storage in 46 Colorado River Basin reservoirs between January 1, 1999, and late May 2026. The progressive decline in storage shown above, despite occasional replenishment during wet years, is referred to as the “ratchet effect.” Data for these reservoirs is available at https://www.usbr.gov/uc/water/hydrodata/reservoir_data/site_map.html. (Image credit: University of Colorado)

https://bsky.app/profile/did:plc:e2wp425fr24kyup6dci5nim2?ref_src=embed&ref_url=https%253A%252F%252Fyaleclimateconnections.org%252F2026%252F06%252Fsecond-warmest-spring-in-u-s-history%252F

The lack of remaining Southwest snowpack means runoff will be limited this summer, only worsening the situation. There’s at least some chance that the fast-evolving El Niño event – which has a greater-than-60-percent of reaching “strong” or “very strong” levels, according to NOAA’s intensity outlook issued in May – will bring generous moisture to the Southwest later this year into early 2027.

Bob Henson

However, scientists at the University of Colorado cautioned in a June 1 press release that even a very wet year such as 2023 would likely forestall major long-term trouble by only about two years, while another dry year could lead to “run-of-the-river” conditions that would hasten depletion and lead to devastating consequences. 

“Both scenarios demonstrate the need to adopt significant additional measures topermanently decrease consumptive uses across the entire basin,” the researchers warned.

Jeff Masters contributed to this post.


BOB HENSON

Bob Henson is a meteorologist and journalist based in Boulder, Colorado. He has written on weather and climate for the National Center for Atmospheric Research, Weather Underground, and many freelance… More by Bob Henson