
Click the link to read the article on the Getches-Wilkinson Center website (Jack Schmidt,1 Anne Castle,2 Eric Kuhn, 3 Kathryn Sorensen,4 Katherine Tara5
June 18, 2026
In the next few weeks, we will share a few graphs and charts that we find informative in understanding today’s water supply crisis on the Colorado River. This short paper concerns the present status of reservoir storage.
IN BRIEF
In 2026 and for only the third time in the 21st century, there was no accumulation, and no recovery, of total Basin live storage6 during the snowmelt season. Nor was there any accumulation or recovery of total live storage in Lake Powell and Lake Mead during the 2026 snowmelt season. Total Basin live storage (hereafter, total Basin storage) is all the water available in the Colorado River Basin’s reservoir “savings account” and stored in reservoirs within the watershed.7 On June 1, total Basin storage was 22.94 million acre feet (maf), only 1.62 maf above the previous minimum of March 20238 and less than 2 years supply at the current rate at which water is consumptively used or lost in the Basin. Total Basin storage will almost certainly drop to less than the previous record minimum by March 2027.
THE PRESENT CONDITION
On June 1, 2026, total Basin storage in 46 reservoirs in the Colorado River Basin was 22.94 maf, 9 39% of the content of those same reservoirs in late August 1999, the last time those reservoirs were relatively full.10 On June 1, Lake Mead held 33% of the Basin’s active storage, 32% was in 42 reservoirs upstream from Lake Powell, 25% in Lake Powell, and 10% in Lake Mohave and Lake Havasu. The combined live storage in Lake Mead and Lake Powell was 28% of the total live storage of those two reservoirs in late summer 1999.11

Why Total Basin Storage?
Most policy analysis of reservoir storage in the Colorado River Basin focuses on Lake Powell and Lake Mead or, alternatively, on all federally managed reservoirs in the Basin. These reservoirs are the focus of ongoing negotiations among the Basin states and will be impacted by impending management decisions by the federal government. On June 1, 89% of total Basin storage was held in 12 federally managed reservoirs.12 Slightly more than 60% of live storage upstream from Lake Powell was held in 8 federally managed reservoirs.
Total Basin storage is the total amount of water stored in reservoirs in the Colorado River watershed. In addition to the 12 federally managed reservoirs, Basin storage includes federal project reservoirs managed by other entities and non-federal reservoirs managed by municipal water providers and water conservation and conservancy districts. Some of the non-federal reservoirs act as forebays that facilitate trans-basin diversions to the Colorado Front Range or Utah’s Wasatch Front. Water stored in these non-federally managed reservoirs is not subject to current or proposed federal operating guidelines. In the Upper Basin, however, water stored in the non-federally managed reservoirs is one determinant of total Upper Basin consumptive use. Therefore, the status of storage in all the Basin’s reservoirs is an indicator of the overall condition of the Colorado River reservoir system and its ability to buffer continued declining inflow. Transfer of water from one reservoir to another, such as the on-going transfer from Flaming Gorge Reservoir to Lake Powell, does not affect total Basin storage. Although such management policy is critical to protecting dam infrastructure and maintaining realistically accessible storage in Lake Powell, 13 such policy merely shifts the location of the Basin’s deck chairs. What matters is whether the ship is sinking. [ed, emphasis mine]
Accumulation Period And Depletion Period
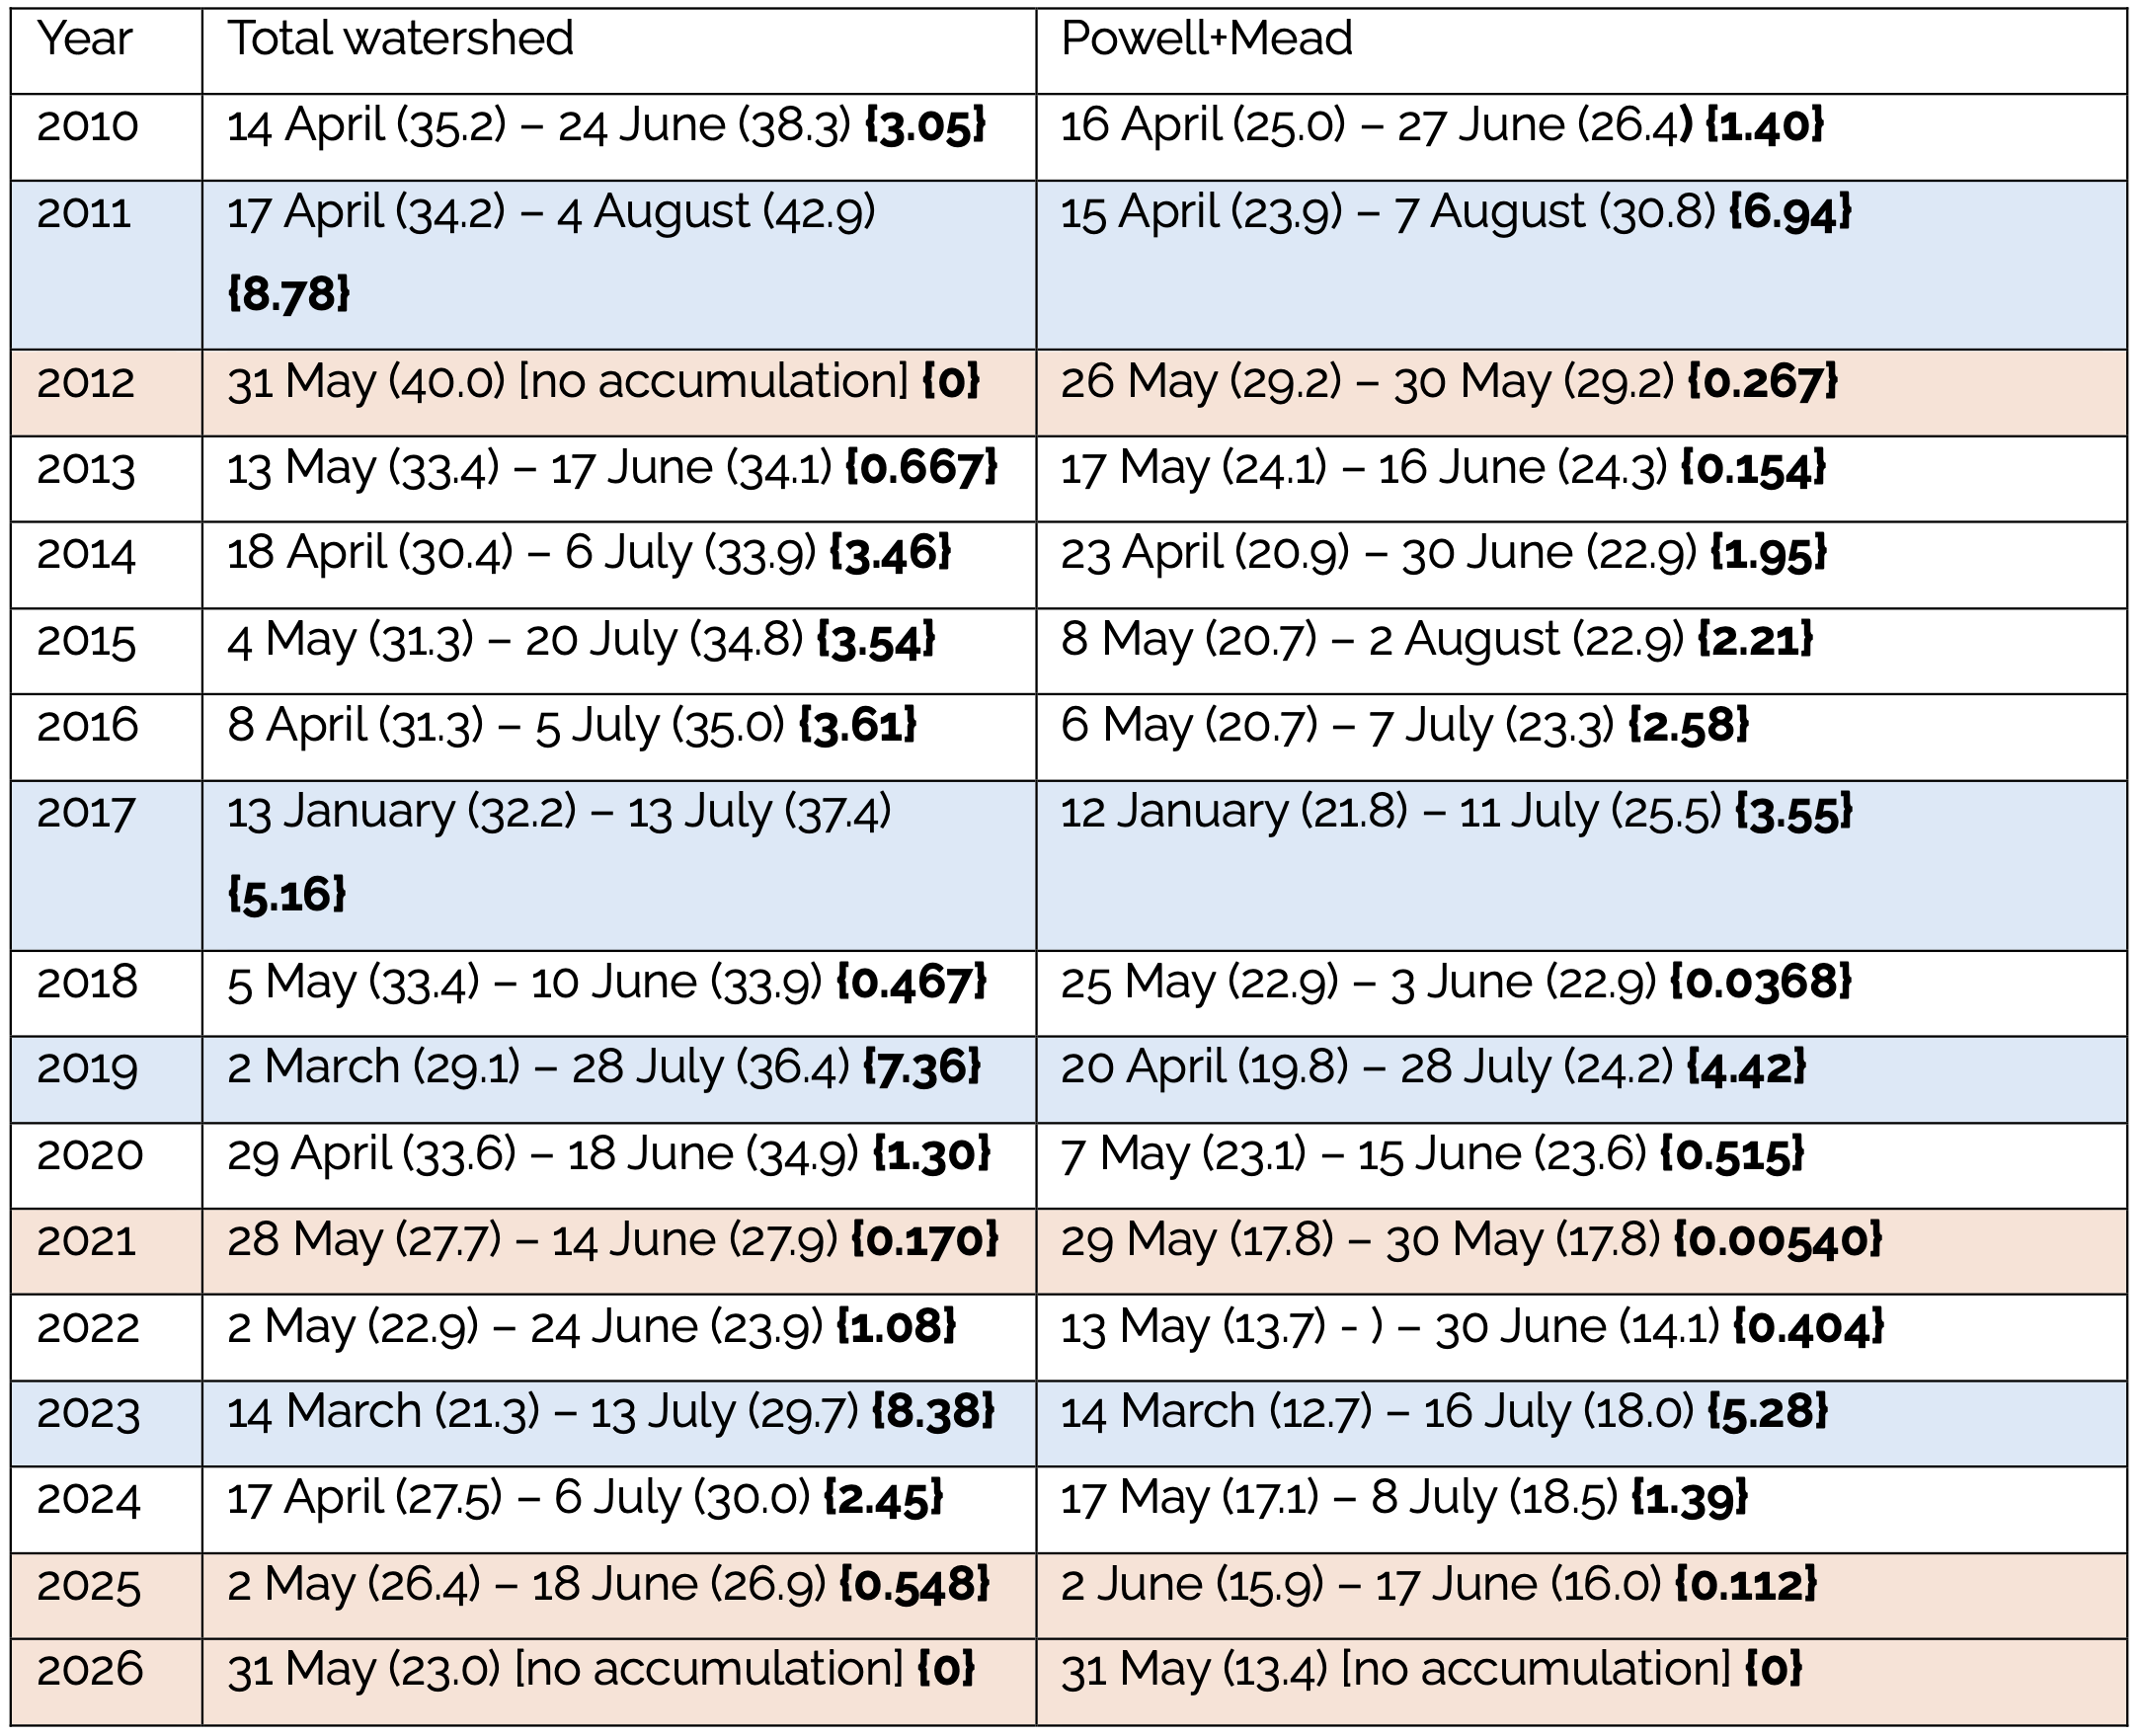
In terms of reservoir storage, we have previously distinguished two periods of the year – the period of reservoir rise (i.e., accumulation period) and the period of reservoir decline (i.e., depletion period).14 In terms of total Basin storage, the 2-3 month long accumulation period typically begins in mid-April, although it has begun as early as mid-March (Supplemental Table 1). The accumulation period typically ends in early July but has sometimes ended in early June and as late as early August. In rare cases, as discussed below, there has been no accumulation. The depletion period typically occurs from mid-summer until the following spring and lasts 9-10 months.
BASINWIDE STORAGE SHOWS CONTINUED DOWNWARD TREND DESPITE PERIODIC WET WINTERS
Basin Reservoirs in Spring 2023 Were at an Unprecedented Low.
Figure 1 shows total live storage in 46 reservoirs during the past 3.5 years. The minimum amount of water in those reservoirs was on March 14, 2023, immediately before snowmelt began from the winter 2022/2023 snowpack. At that time, the Basin’s reservoirs only held 21.32 maf. Total Basin storage had not been that low since May 1965 when the newly constructed Colorado River Storage Project reservoirs were beginning to fill.15
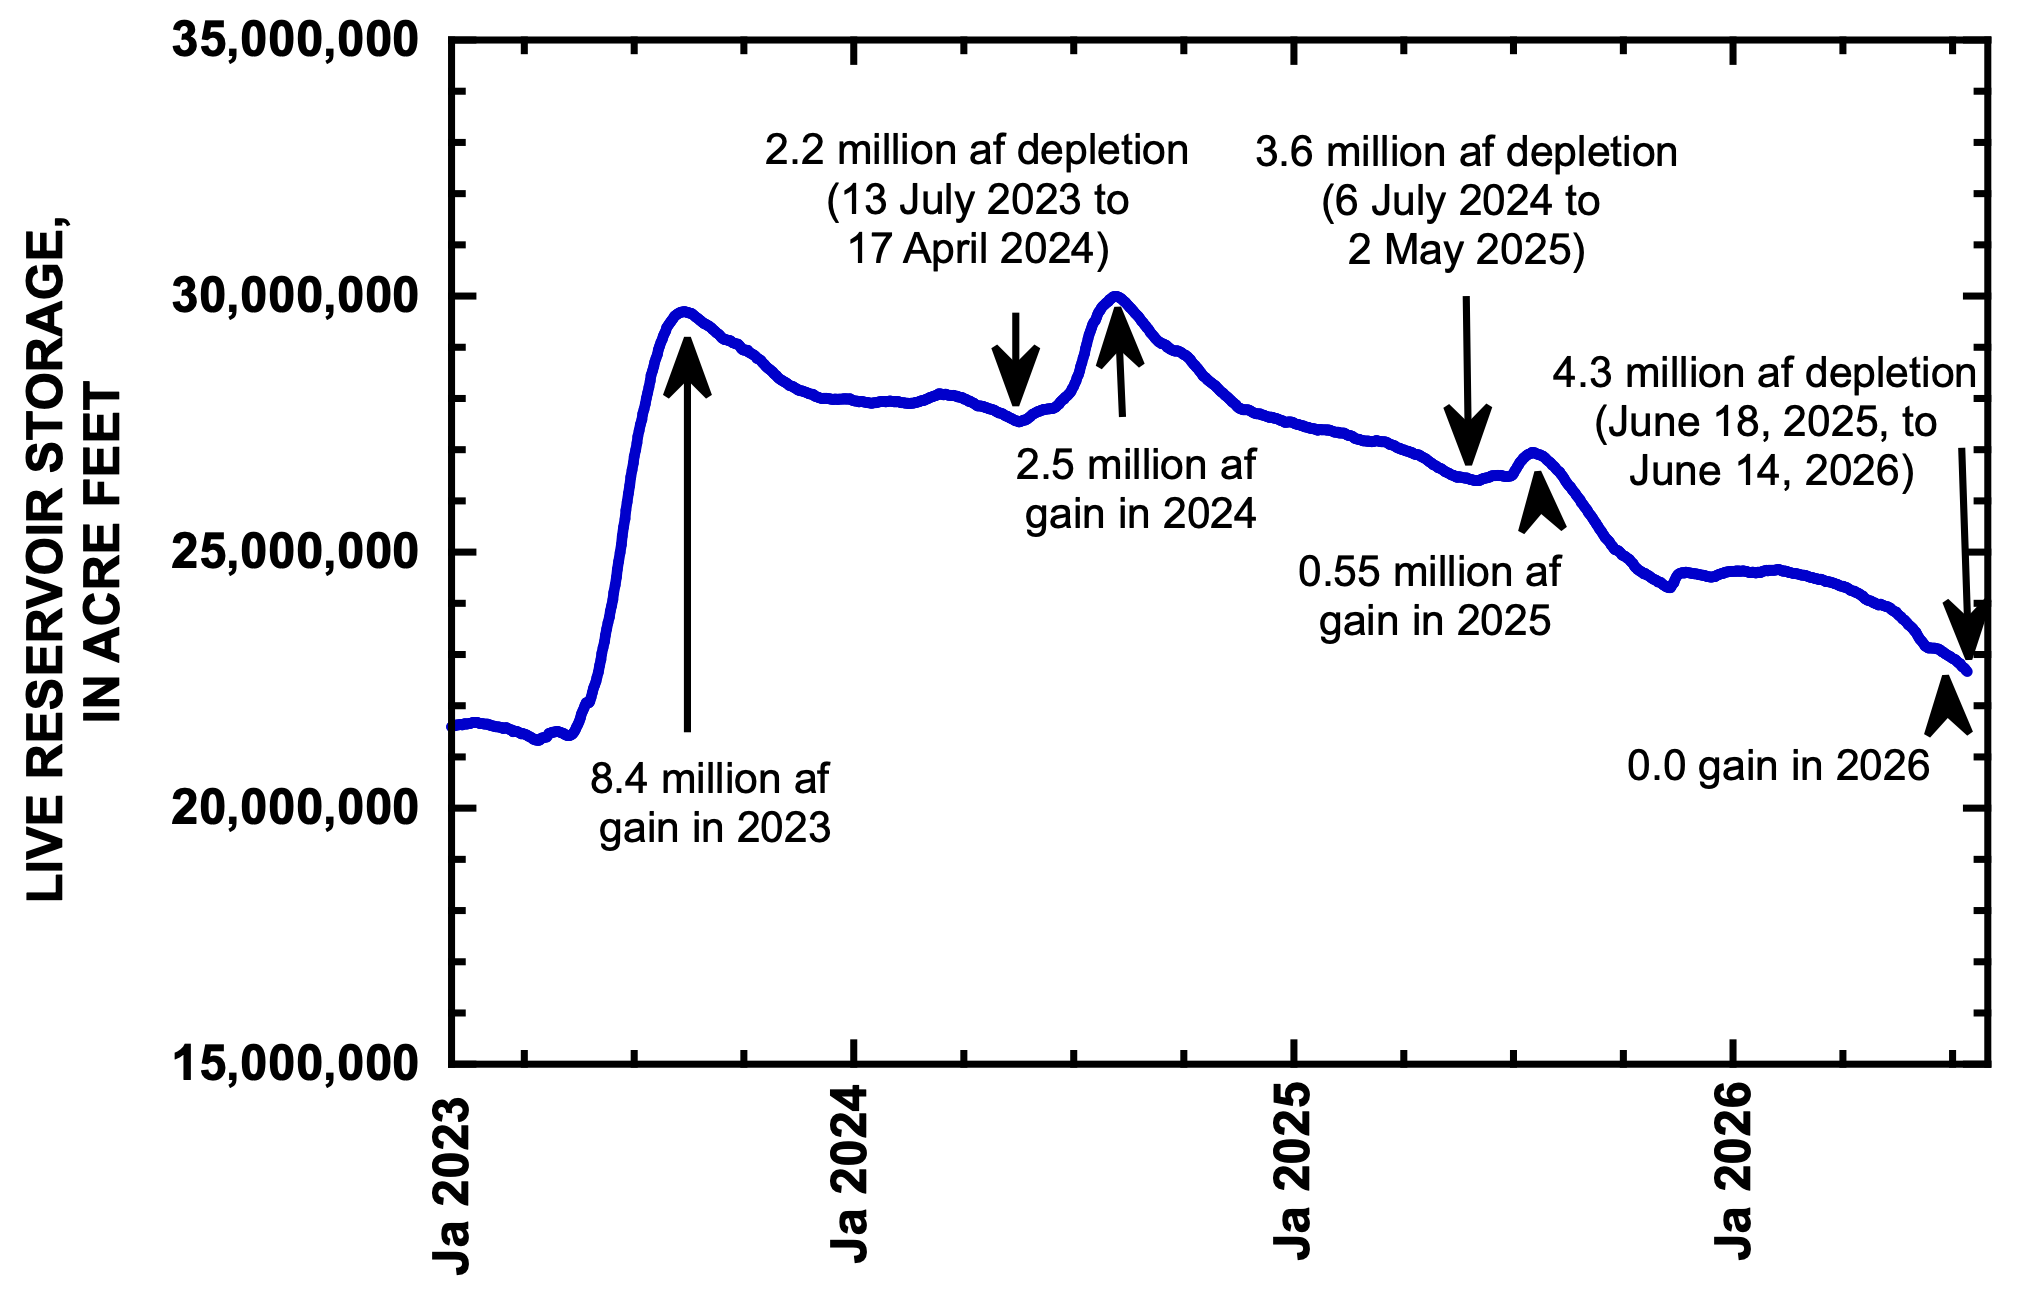
Snowmelt in 2023 was unusually large for the 21st century, and reservoir storage significantly recovered. The 8.38 maf increase in reservoir storage during the 2023 accumulation period was the second largest single-year increase of the 21st century and resulted from the second largest unregulated inflow to Lake Powell of the 21st century.16 The Basin’s reservoirs were subsequently drawn down by only 2.15 maf between July 13, 2023, and April 17, 2024, the smallest depletion period since at least 2010. Unregulated inflow to Lake Powell in Water Year (WY) 2024, primarily due to the 2024 snowmelt season, was typical of the 21st century,17 and the Basin’s reservoirs recovered 2.45 maf. Because Basin reservoir recovery exceeded the drawdown during the preceding 2023-2024 depletion period, Basin storage reached its highest recent peak at the beginning of the 2024-2025 depletion period.18
The gains of 2023 and 2024 were subsequently lost between summer 2024 and today, because depletion exceeded accumulation. In spring 2027, total Basin storage is likely to be less than it was in March 2023.
In early July 2024, the multi-year downward turn of reservoir storage began. The Basin’s reservoirs were depleted by 3.60 maf during the 2024-2025 depletion period, more than 1 maf greater than the preceding accumulation. Unregulated inflow to Lake Powell in WY2025 was the fourth driest of the 21st century19, and the Basin’s reservoirs only accumulated 0.55 maf, a small amount. Despite hard-fought, politically contentious, and economically expensive system conservation and assigned water efforts as well as a wet fall in the southern part of the Basin, the Basin’s reservoirs were depleted by 4.00 million af during the 2025-2026 depletion period.20 The most probable unregulated inflow to Lake Powell in WY2026 is forecast to be 3.40 maf, the second lowest inflow of the 21st century.21 There will be no accumulation this year.22
As of June 1, 2026, the Basin’s total storage was only 1.62 maf more than total storage at its record-breaking low in March 2023. It is likely that Basin storage in spring 2027, before the 2027 accumulation season begins, will be lower than at any time since 1965, because depletion during the 2016-2027 period will probably exceed 1.62 maf.23
The depletion of reservoir storage that began in summer 2024 occurred despite a significant effort to reduce Lower Basin water use. Water use in California and Arizona in Calendar Year (CY) 2025 was the lowest and third lowest, respectively, since CY2010, and use in those two states in CY2024 was the fourth lowest since CY2010. Water use in Arizona in CY2026 is forecast to be the lowest since CY2010. Upper Basin use in CY2024 was typical for the period CY2010-CY2024; Upper Basin use data for CY2025 are not yet available.
Despite each spring’s snowmelt inflow, each part of the Basin’s reservoir system that stores water – Lake Mead, Lake Powell, and the reservoirs upstream from Lake Powell – has declined since their recent maximums in summer 2024.
Lake Mead typically peaks between January and March and then declines until August (Fig. 2). This pattern contrasts from that of Lake Powell and of reservoirs further upstream. The winter peaks of Lake Mead in 2024, 2025, and 2026 have been progressively lower each year, and the summer minimums have also been lower each year. In 2026, Lake Mead peaked on February 28 and lost 1.23 maf between March 1 and June 1 and will probably continue to drop during the rest of summer. On June 1, 2026, Lake Mead stored only 0.34 maf more than its recent minimum of January 1, 2023.24
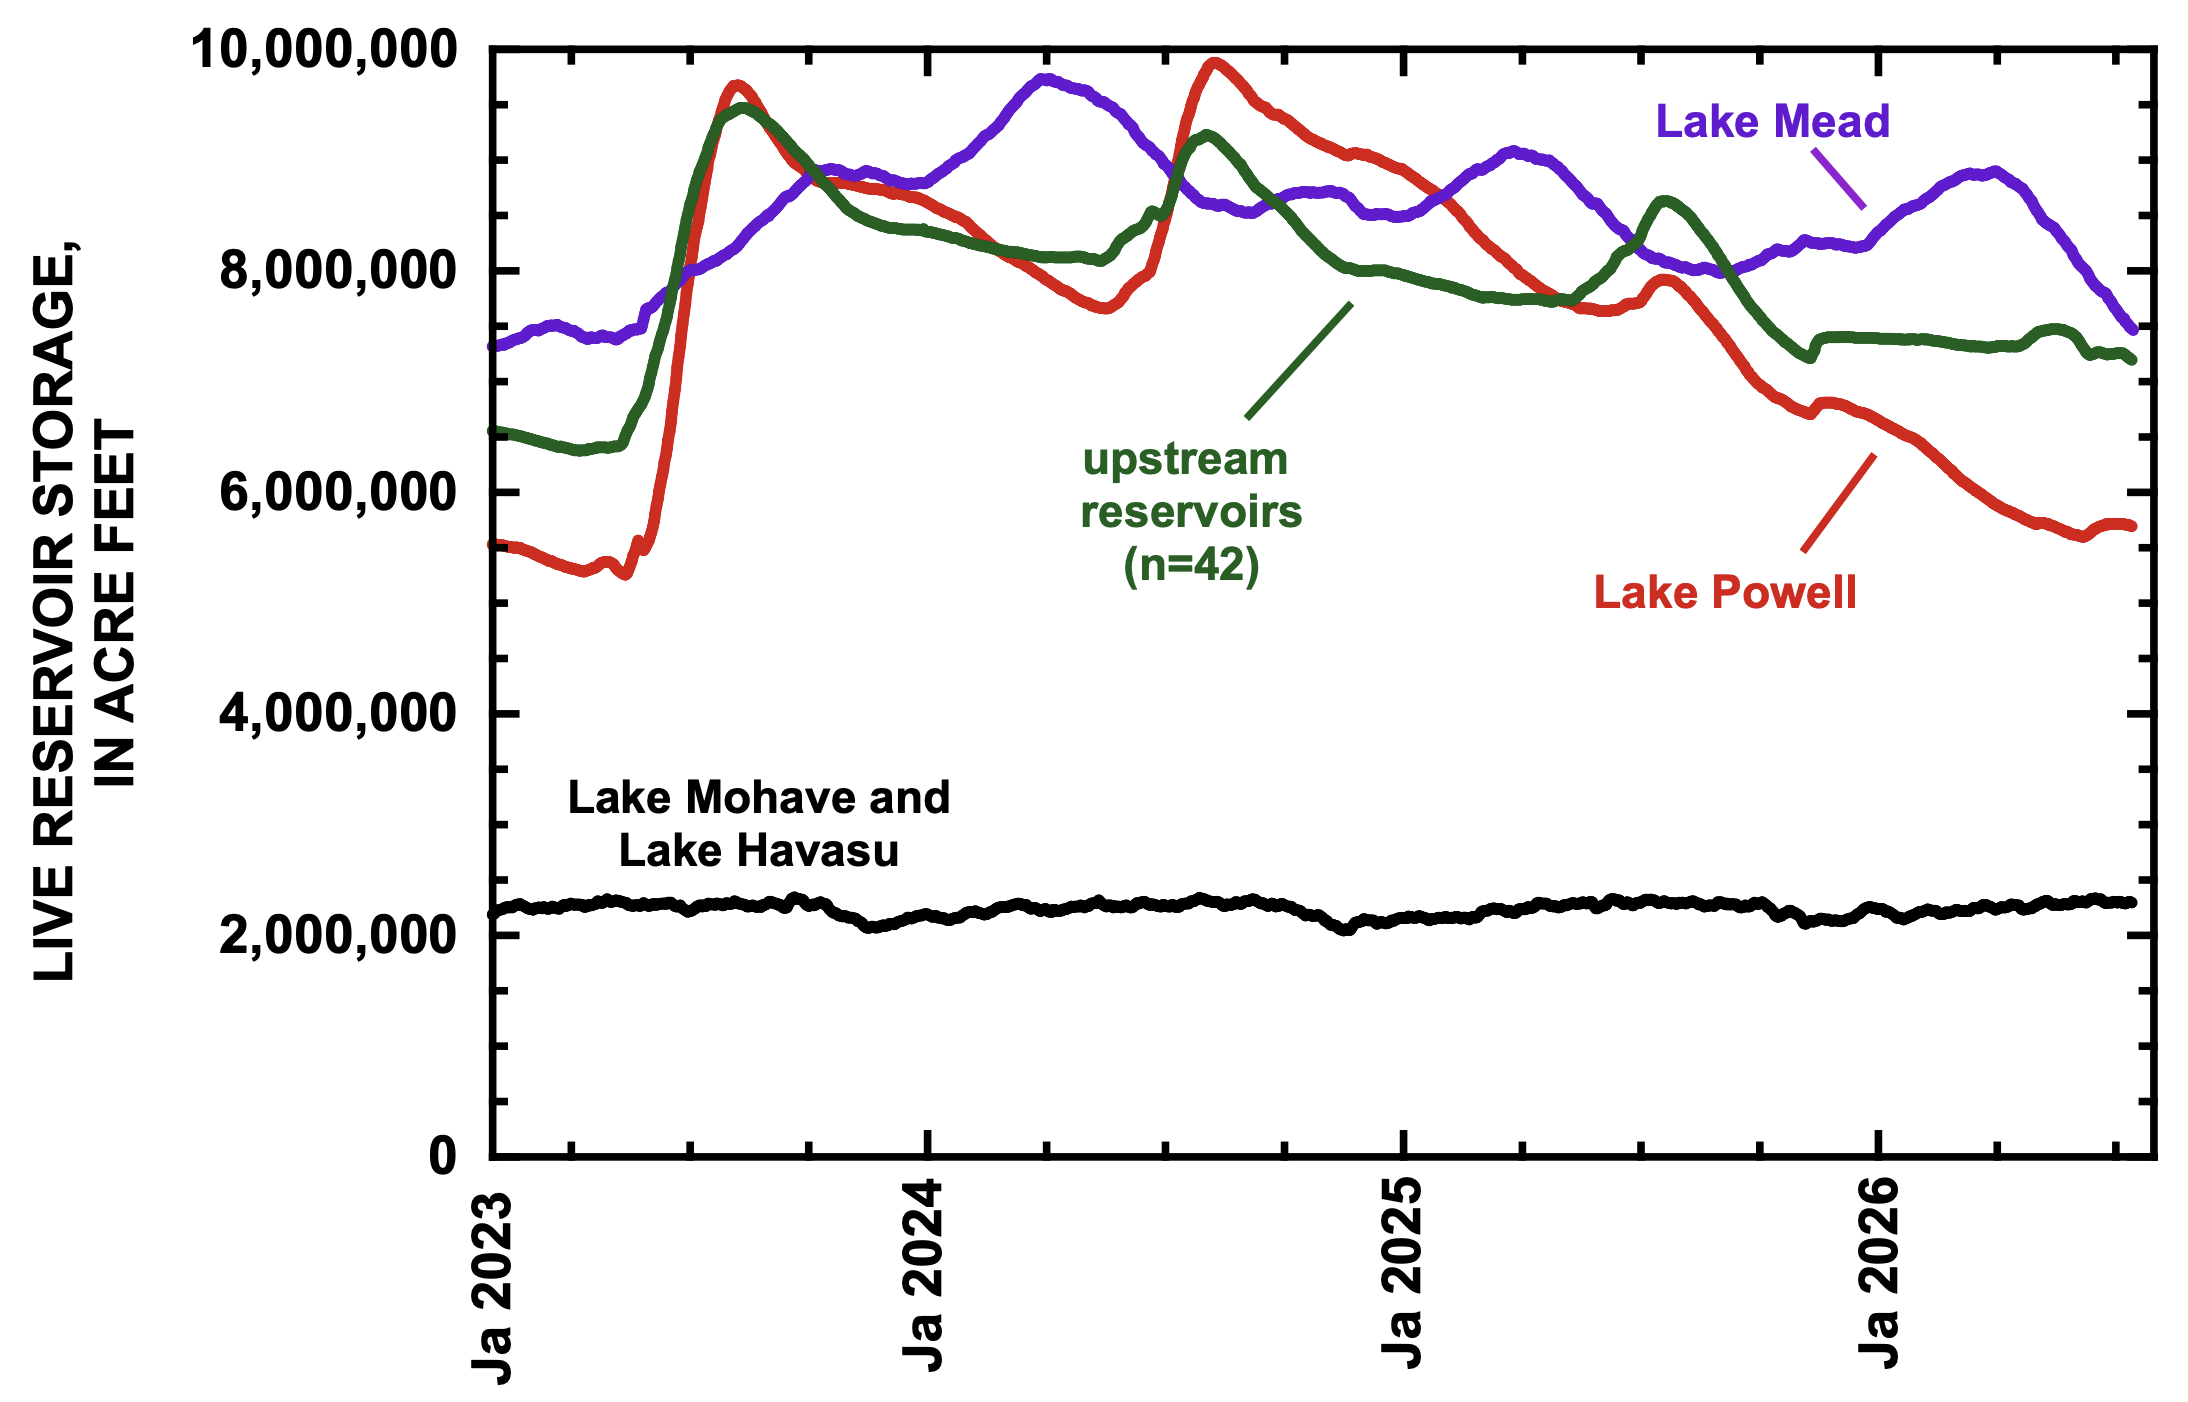
In the last two years, Lake Powell has dropped more than other reservoirs. Lake Powell lost more than 4 maf of stored water since early July 2024. In 2026, Lake Powell steadily declined from the beginning of the year until May 7 and stabilized following the onset of snowmelt runoff, increased releases from Flaming Gorge Reservoir, and reduction of releases at Glen Canyon Dam.25 On June 1, decline in Lake Powell resumed. The total live storage in Lake Mead and Lake Powell on June 1 was 13.38 maf, significantly less than the capacity of either individual reservoir.
Total storage in 42 reservoirs upstream from Lake Powell also declined during the past 3.5 years. Those reservoirs rise every spring and typically recover until sometime in June or July. Presently, many reservoirs in the headwaters of the upper Colorado River are still rising, 26 as are Fontenelle and Big Sandy in the upper Green River Basin. However, total reservoir storage in the Gunnison and Green River watersheds is already at its lowest of the year. Total reservoir storage in the San Juan River watershed has been declining since mid-April but is not yet at its lowest point for the year.
OVERALL TRENDS IN BASIN STORAGE DEMONSTRATE RATCHET EFFECT IN FULL FORCE
In the context of the entire 21st century, Basin storage significantly dropped during two multi-year dry periods, 2000-2004 and 2020-2022 (Fig. 3).27 In other years, the bounty of snowmelt was temporarily stored but completely consumed in subsequent years. The resulting pattern for the 21st century is jagged, but the overall trend in storage has been relentlessly downward, because Basin average uses and losses have consistently exceeded average inflows. We call this pattern the Ratchet Effect, because a rachet is a mechanical device that only allows movement in one direction, in this case towards ever declining Basin storage and deeper into crisis.28 Despite laudable efforts to maintain balance through system conservation and assigned water programs, the ship continues to sink.

SUPPLEMENTAL TABLE
Supplemental Table 1. Beginning and end dates of the reservoir storage accumulation period for the entire watershed and for Lake Powell plus Lake Mead. The volume in storage for each date is indicated. The value at the beginning of the accumulation period is the minimum storage at the end of the preceding 9-10 month depletion period. Numbers in bold brackets are the accumulation, in millions of acre feet. Tan shading indicates years that were among the five driest of the 21st century. Blue shading were years that were among the five wettest of the 21st century.
1 Center for Colorado River Studies, Utah State University, former Chief, Grand Canyon Monitoring and Research Center.
2 Getches-Wilkinson Center, Univ. of Colorado Law School, former US Commissioner, Upper Colorado River Commission, former Assistant Secretary for Water and Science, US Dept. of the Interior.
3 Retired General Manager, Colorado River Water Conservation District.
4 Kyl Center for Water Policy, Arizona State University, former Director, Phoenix Water Services.
5 Staff Attorney, Utton Transboundary Resources Center, University of New Mexico.
6 Live storage is all water stored in reservoirs that can be vacated by gravity, no matter how difficult or slow would be the process of withdrawing that water. Active storage is all water stored above minimum power pool, and inactive storage is water stored between dead pool and minimum power pool. These definitions differ from those used in previous papers that we have written. In past papers, we used the term active storage to refer to what we now refer to as live storage. This change is made to be consistent with terminology of Bureau of Reclamation.
7 We do not consider reservoirs that store Colorado River water but are located beyond the watershed boundary, such as Horsetooth or Twin Lakes Reservoirs in Colorado.
8 As discussed below, the March 2023 minimum was the lowest total Basin storage since May 1965 when the reservoirs of the Colorado River Storage Project were beginning to fill.
9 the contents of these reservoirs are reported by the Bureau of Reclamation https://www.usbr.gov/uc/water/hydrodata/reservoir_data/site_map.html. These reservoirs include the largest in the Basin, as well as many small ones.
10 The total amount of water in the 46 reservoirs on August 24, 1999, was 59.52 maf. The only previous periods when total Basin storage exceeded that amount were for ~4.5 months between June 9 and October 24, 1983, and during parts of summer 1984, 1985, 1986, and 1998 The largest amount of live storage in these reservoirs was 63.61 maf on July 15, 1983.
11 Total live storage in Lake Mead and Lake Powell peaked at 47.70 maf on September 19, 1999, and was 13.38 maf on June 1, 2026.
12 The contents of these 12 reservoirs are reported in Reclamation’s 24-Month Study reports and include Taylor Park, Blue Mesa, Morrow Point, Crystal, Fontenelle, Flaming Gorge, Vallecito, and Navajo that are upstream from Lake Powell, as well as Lake Powell, Lake Mead, Lake Mohave, and Lake Havasu. The contents of the latter two reservoirs, as well as Morrow Point and Crystal, do not change much during the year.
13 A. Castle et al. 2026. UPDATE: Colorado River Basin storage continues slide toward system crash. https://qanr.usu.edu/coloradoriver/files/research/Wilburys-system-crash.pdf.
14 J. Schmidt and J. Fleck. 2025. Colorado River Basin reservoir storage; where do we stand? https://www.inkstain.net/2025/06/colorado-river-basin-reservoir-storage-where-do-we-stand/.
15 The 12 federal reservoirs had 18.93 maf of active storage on March 14, 2023, and were at their lowest since early May 1965.
16 The largest single-year accumulation of Basin storage was in 2011, when storage increased 8.78 million af. Unregulated inflow in WY2011 was 15.97 maf, and natural flow in WY2011 was the largest of the 21st century (WY2011 = 20.16 million af). Unregulated inflow to Lake Powell in WY2023 was 13.42 million af, and natural flow of the Colorado River in WY2023 was 17.41 million af, the third largest of the 21st century.
17 Unregulated inflow was 7.98 million af, 2% less than the average for the 21st century (2000-2026). Natural flow at Lees Ferry in WY2024 (11.88 million af) was 1.5% less than the 21st century average.
18 Total Basin storage was 29.99 million af on July 6, 2024, the largest peak since mid-January 2021.
19 WY2025 unregulated inflow was 4.69 million af. Natural flow at Lees Ferry was 8.50 million af, the fifth driest of the 21st century.
20 J. C. Schmidt et al. 2026. Lake Powell and Lake Mead are moving in opposite direction – what gives? https://qanr.usu.edu/coloradoriver/news/blog-2026-2-9. Here, we are arbitrarily ending the 2025-2026 depletion period on June 1, 2026, when the 2026-2027 depletion period begins.
21 June 24-Month Study.
22 The only other years in the 21st century when there was no accumulation of total Basin storage were 2002 and 2012.
23 The median drawdown of the Basin’s reservoirs since 2010 during each depletion period has been approximately 3.6 maf, and the smallest previous depletion was 2.15 maf. There have only been six years when Basin-wide reservoir depletion was less than 3.0 million af: 2023-2024 (2.15 million af), 2022-2023 (2.19 million af), 2014-2015 (2.61 million af), 2016-2017 (2.75 million af), 2019-2020 (2.82 million af), and 2011-2012 (2.93 million af).
24 Active storage in Lake Mead on January 1, 2023, was 7.32 million af.
25 Lake Powell only gained 0.12 million af between May 7 and May 31.
26 These reservoirs include Granby, Dillon, Ruedi, Green Mountain, Taylor Park, and Ridgway.
27 J. C. Schmidt et al. 2023. The Colorado River water crisis: its origin and the future. WIREs Water 10.1002/wat2.1672.
28 A. Castle et al. 2026. UPDATE: Colorado River Basin storage continues slide toward system crash. https://qanr.usu.edu/coloradoriver/files/research/Wilburys-system-crash.pdf.


