
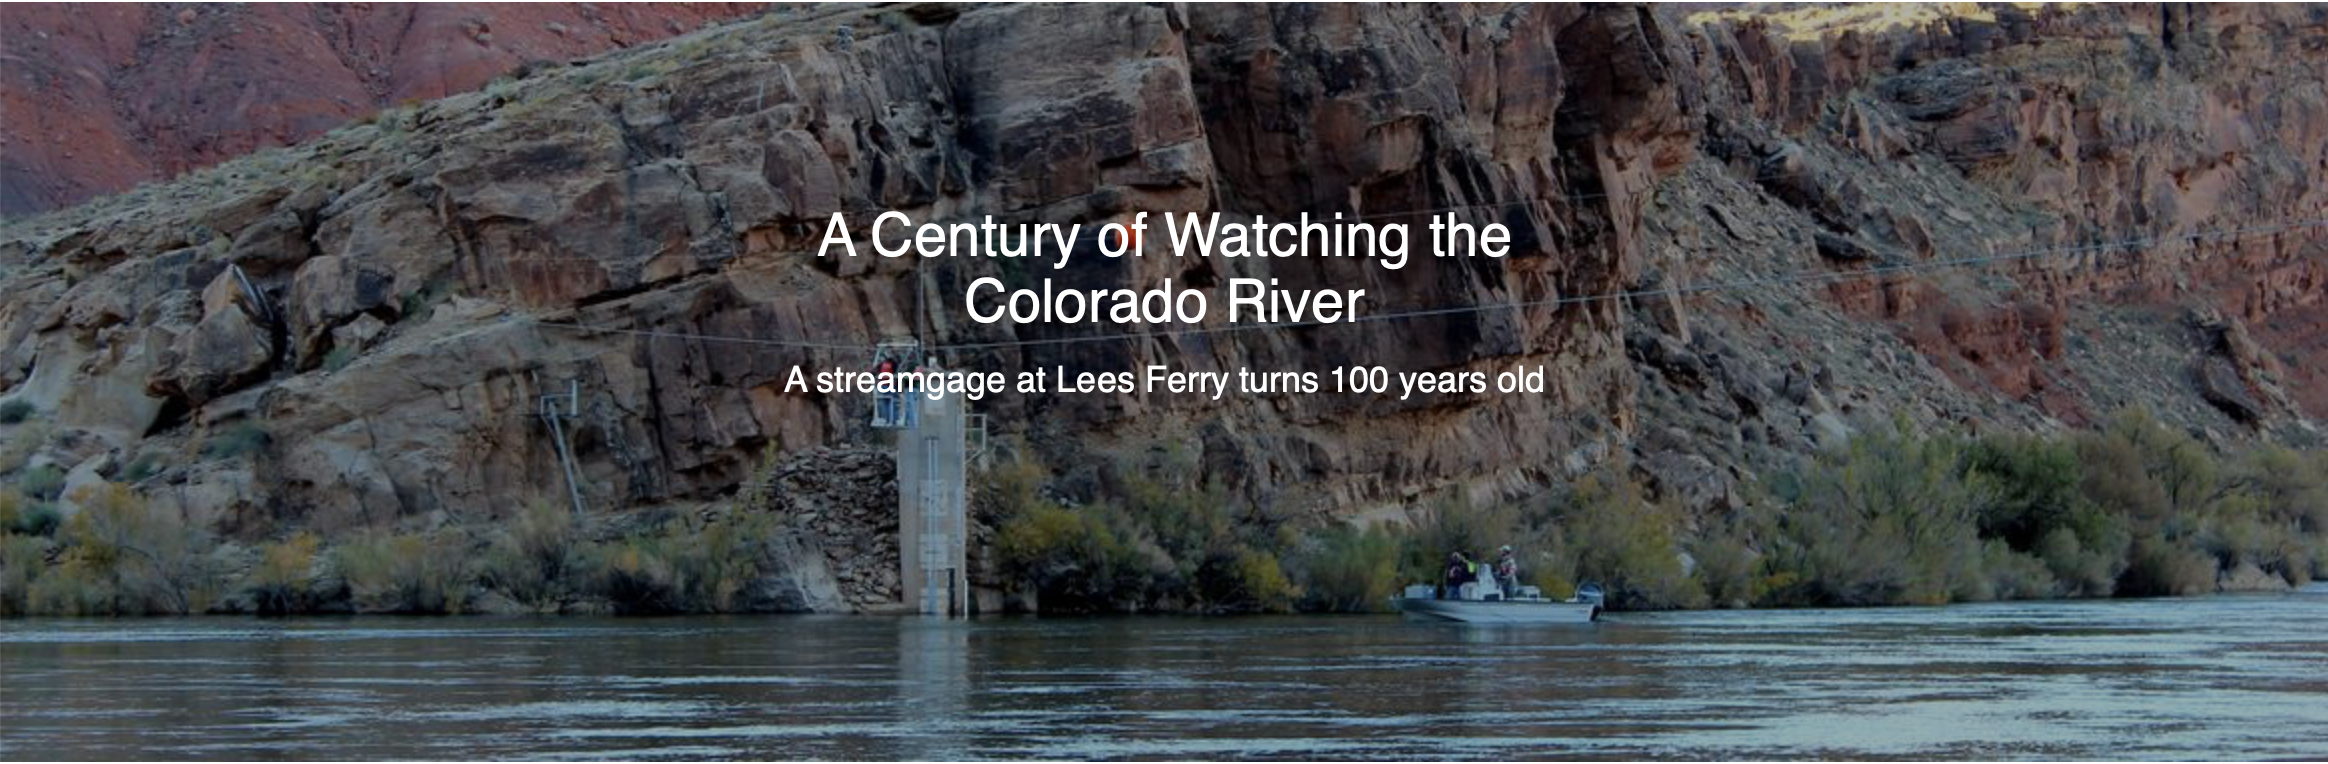
Click the link to read the article on the Lake Powell Chronicle website (Bob Hembree):
April 1, 2026
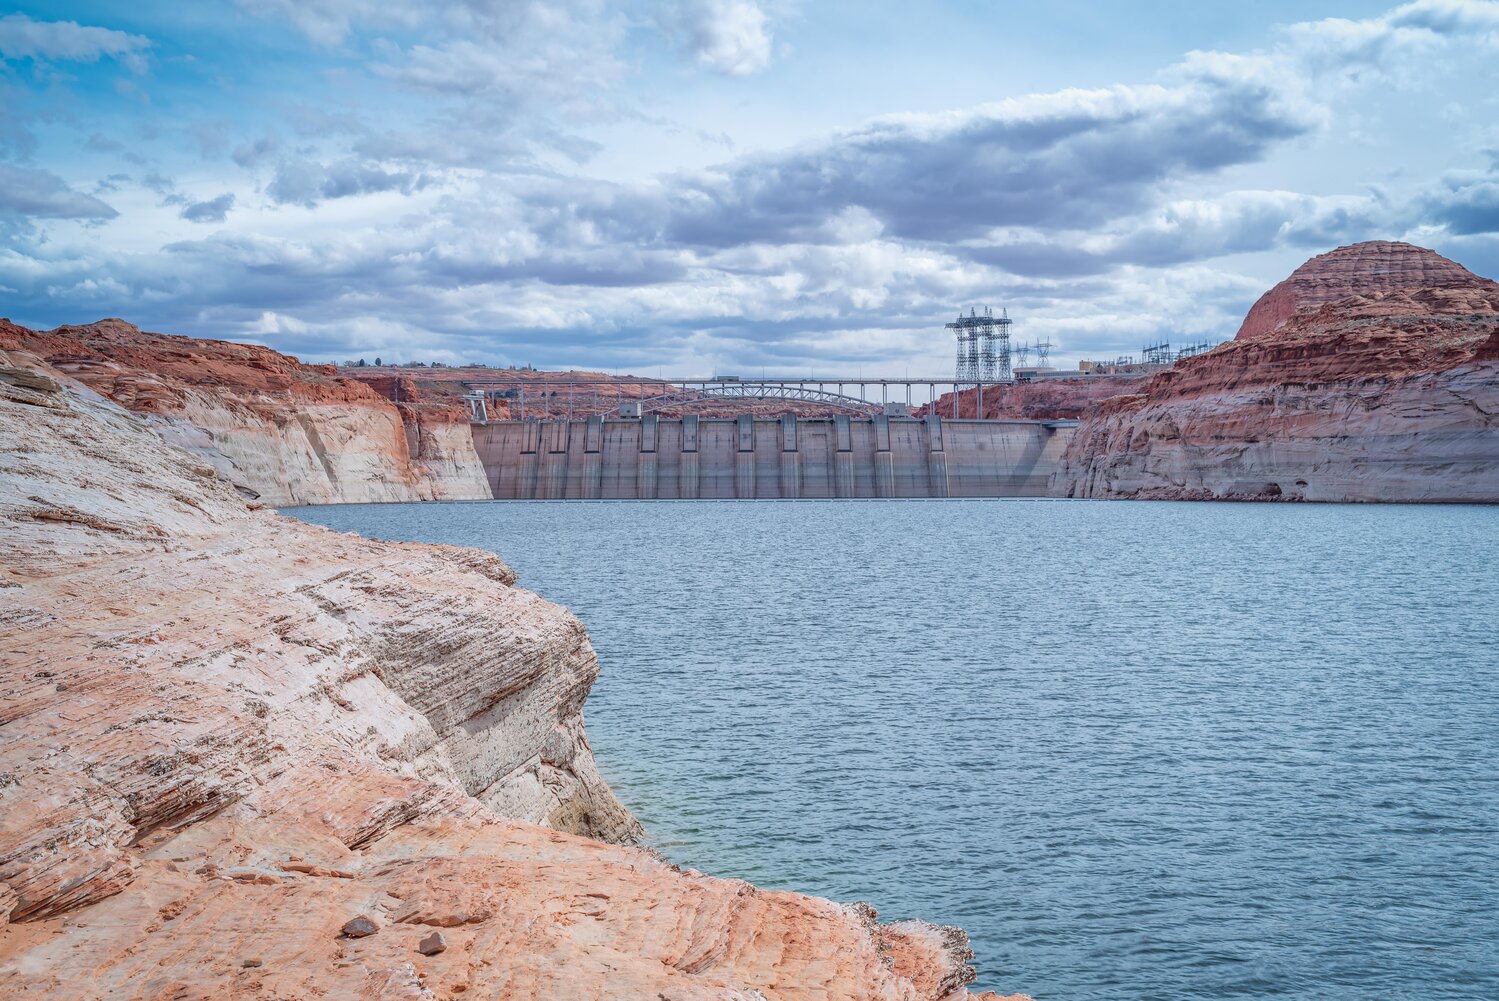
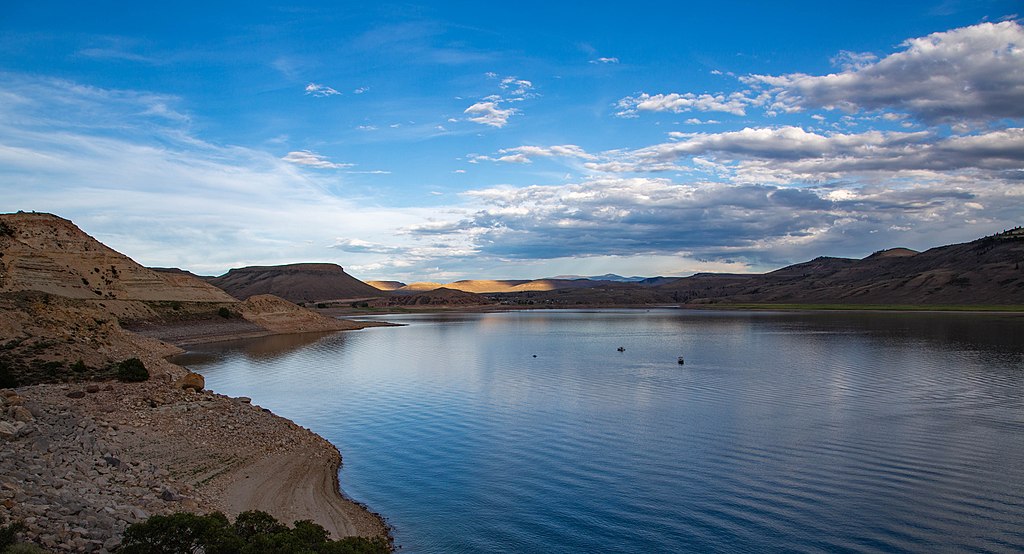
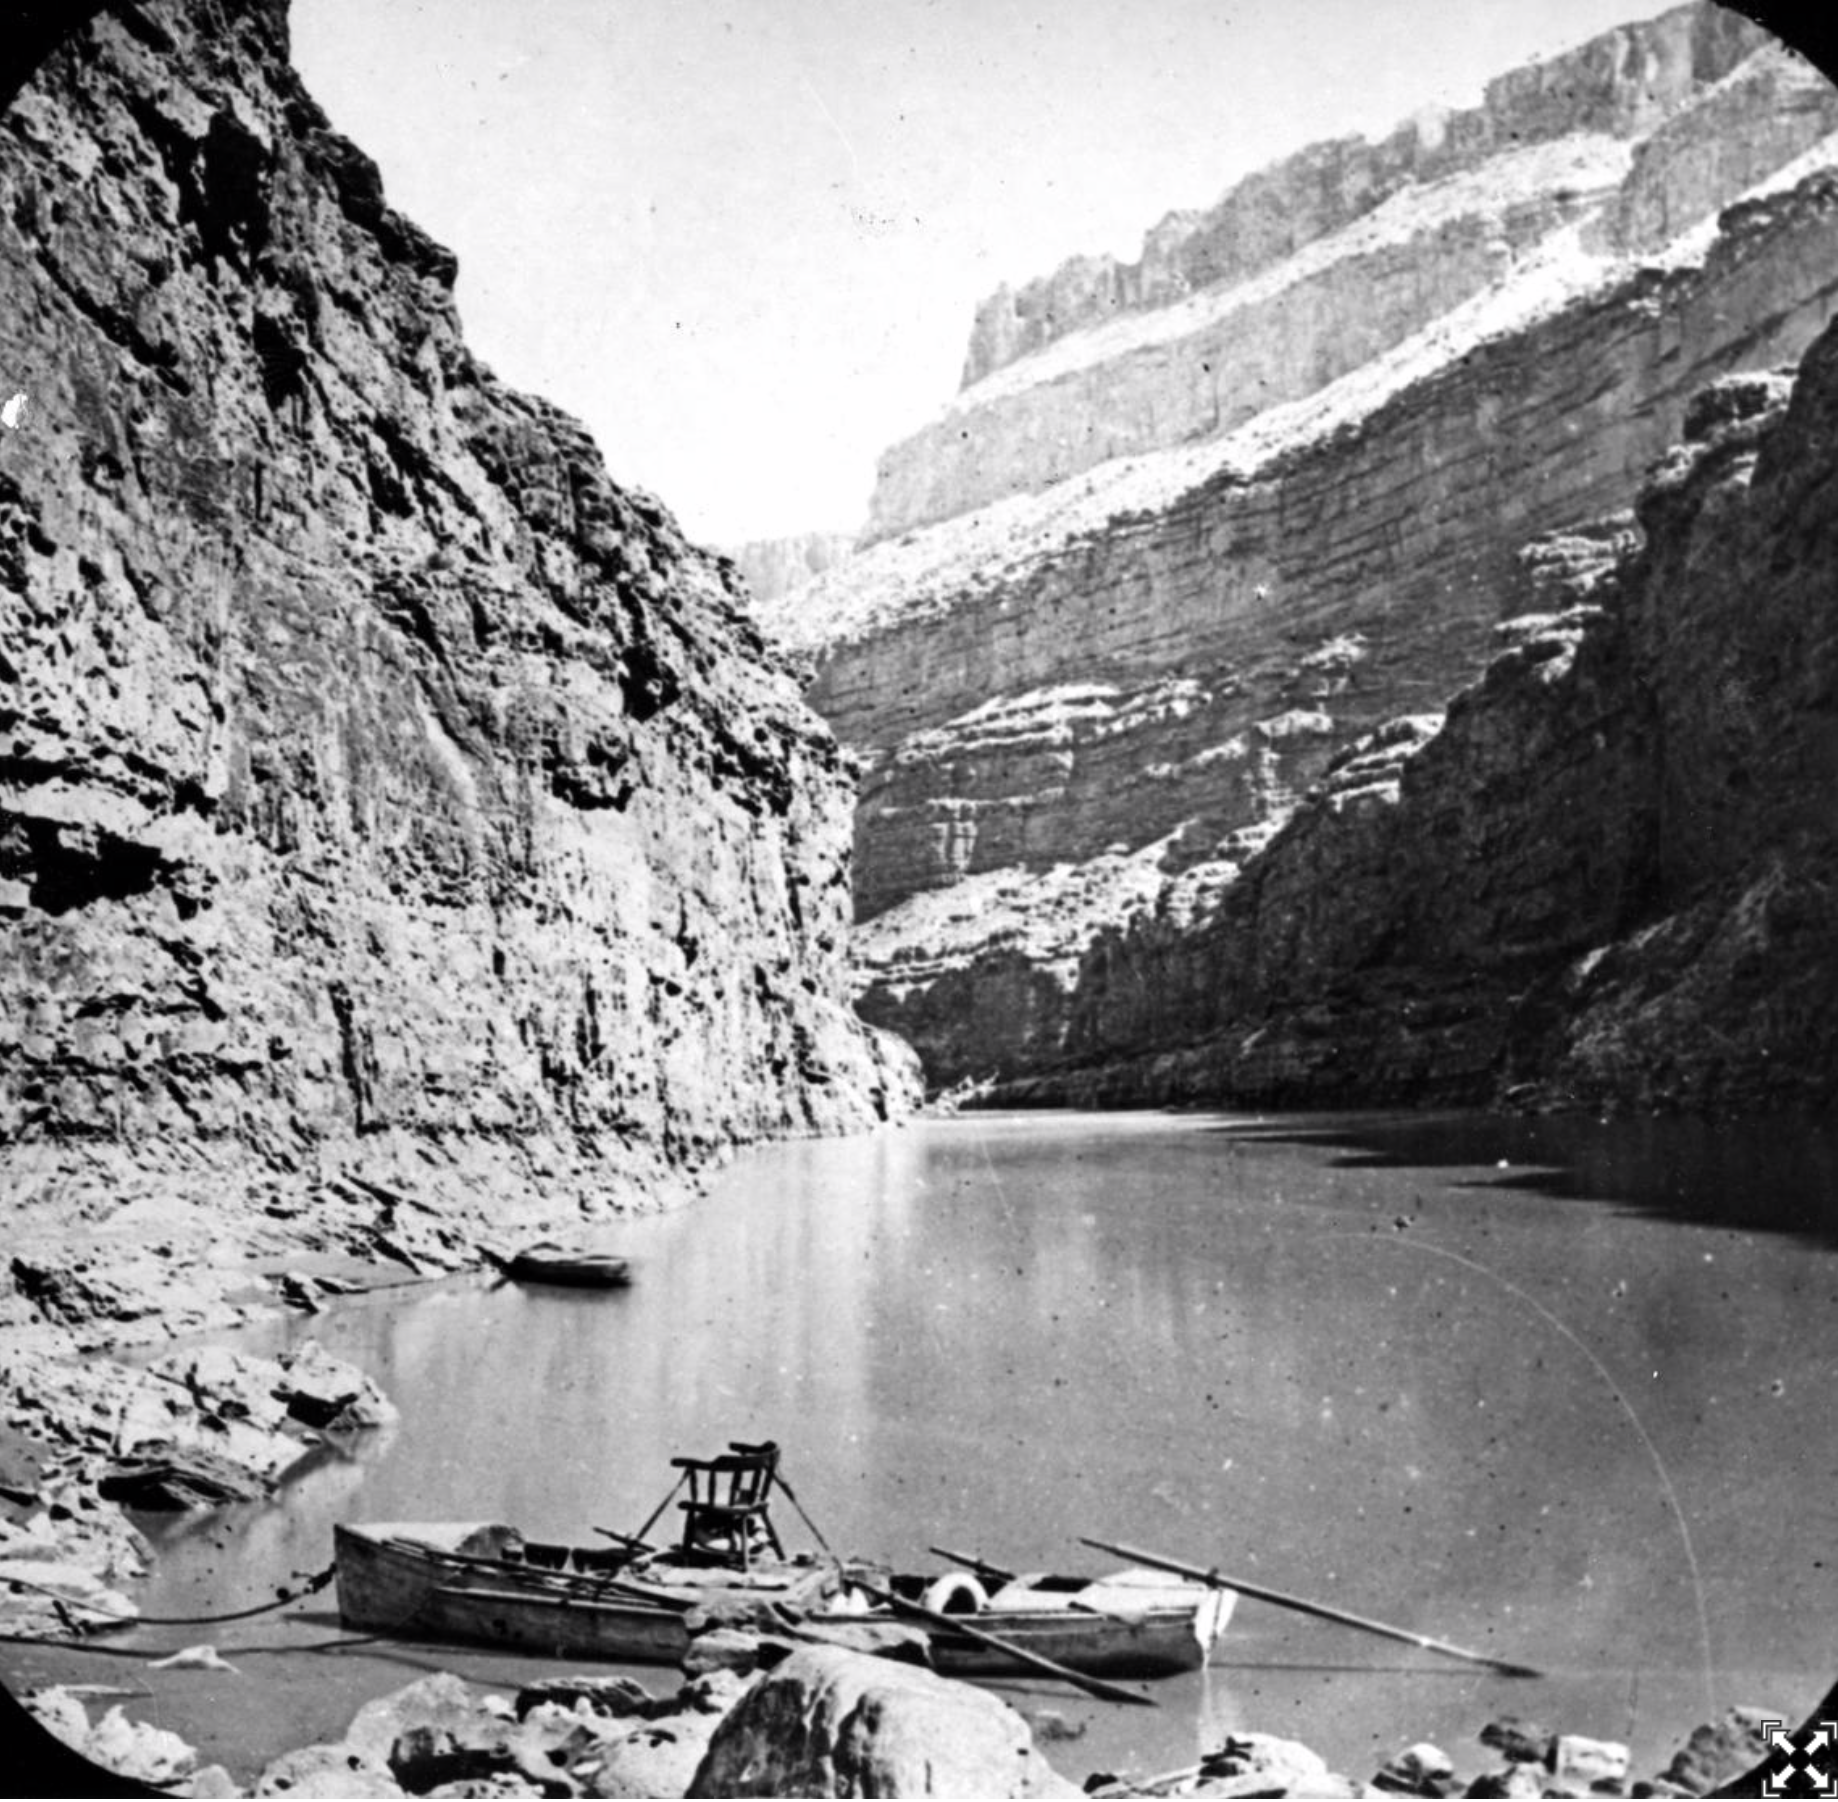
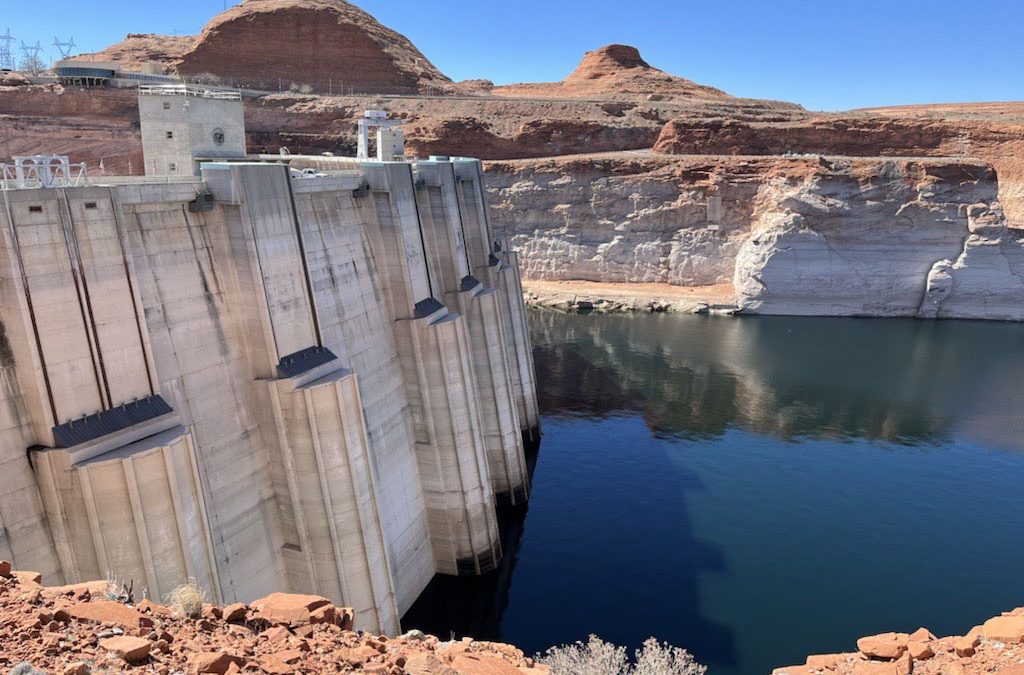
The white bathtub ring clinging to the sandstone walls of Glen Canyon is more than a marker of a receding lake; it is a physical manifestation of a century-old accounting error. For decades, the conventional story of the Colorado River’s decline has been framed as a tragic stroke of bad luck. The narrative, popularized in modern classics like Cadillac Desert, suggests that the framers of the 1922 Colorado River Compact simply did their best with a limited record of “eighteen years of streamflow measurement” taken during an unusually wet “binge.”
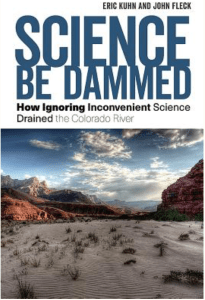
However, emerging historical research and systems analysis tell a more complicated and troubling story. In their definitive study, Science Be Dammed, authors Eric Kuhn and John Fleck argue that the crisis we face in 2026 was not an accident of nature but a predictable consequence of “selective science.” The decision-makers of 1922 were not victims of ignorance; they were sophisticated professionals who chose to ignore inconvenient data in favor of a political vision that required the river to be larger than it actually was.
The Inconvenient Hydrologist
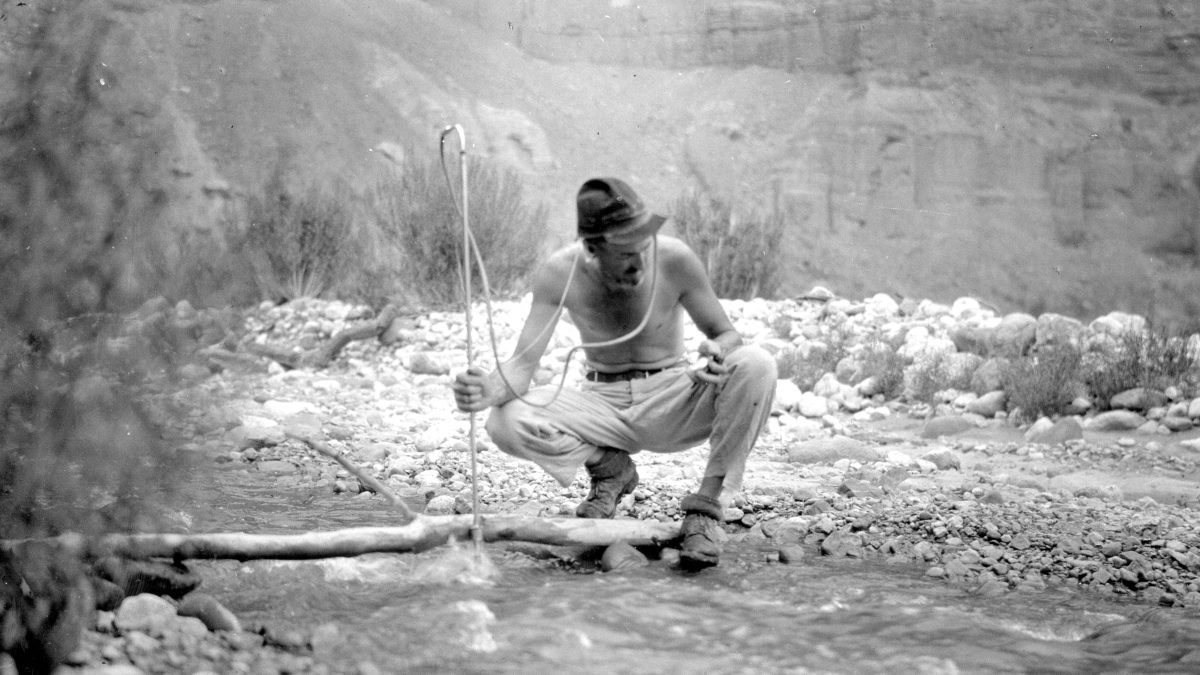
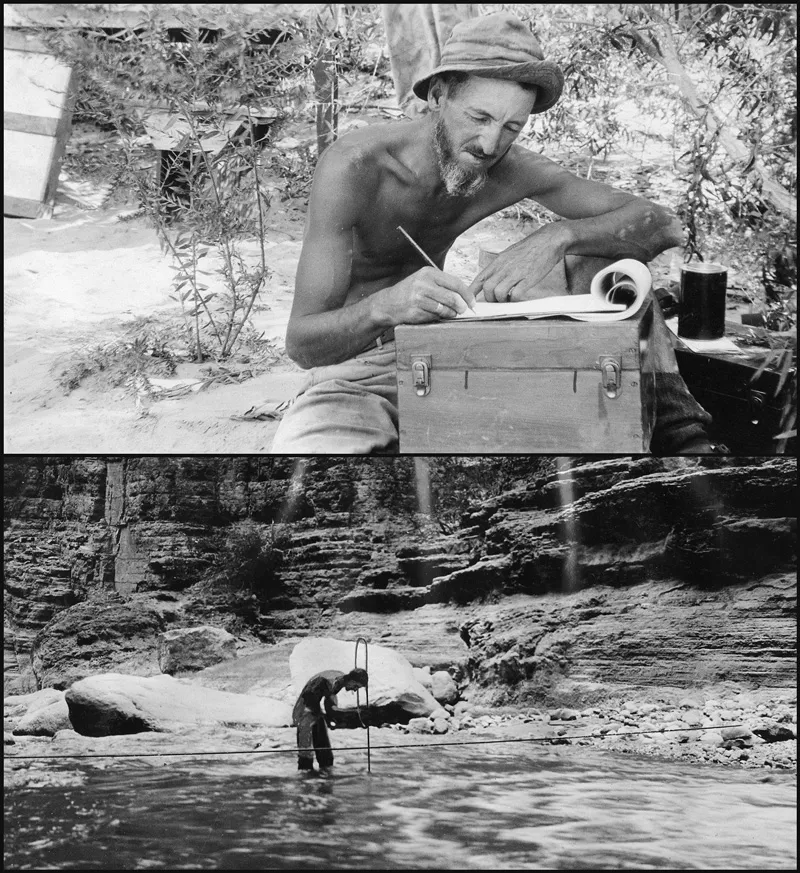
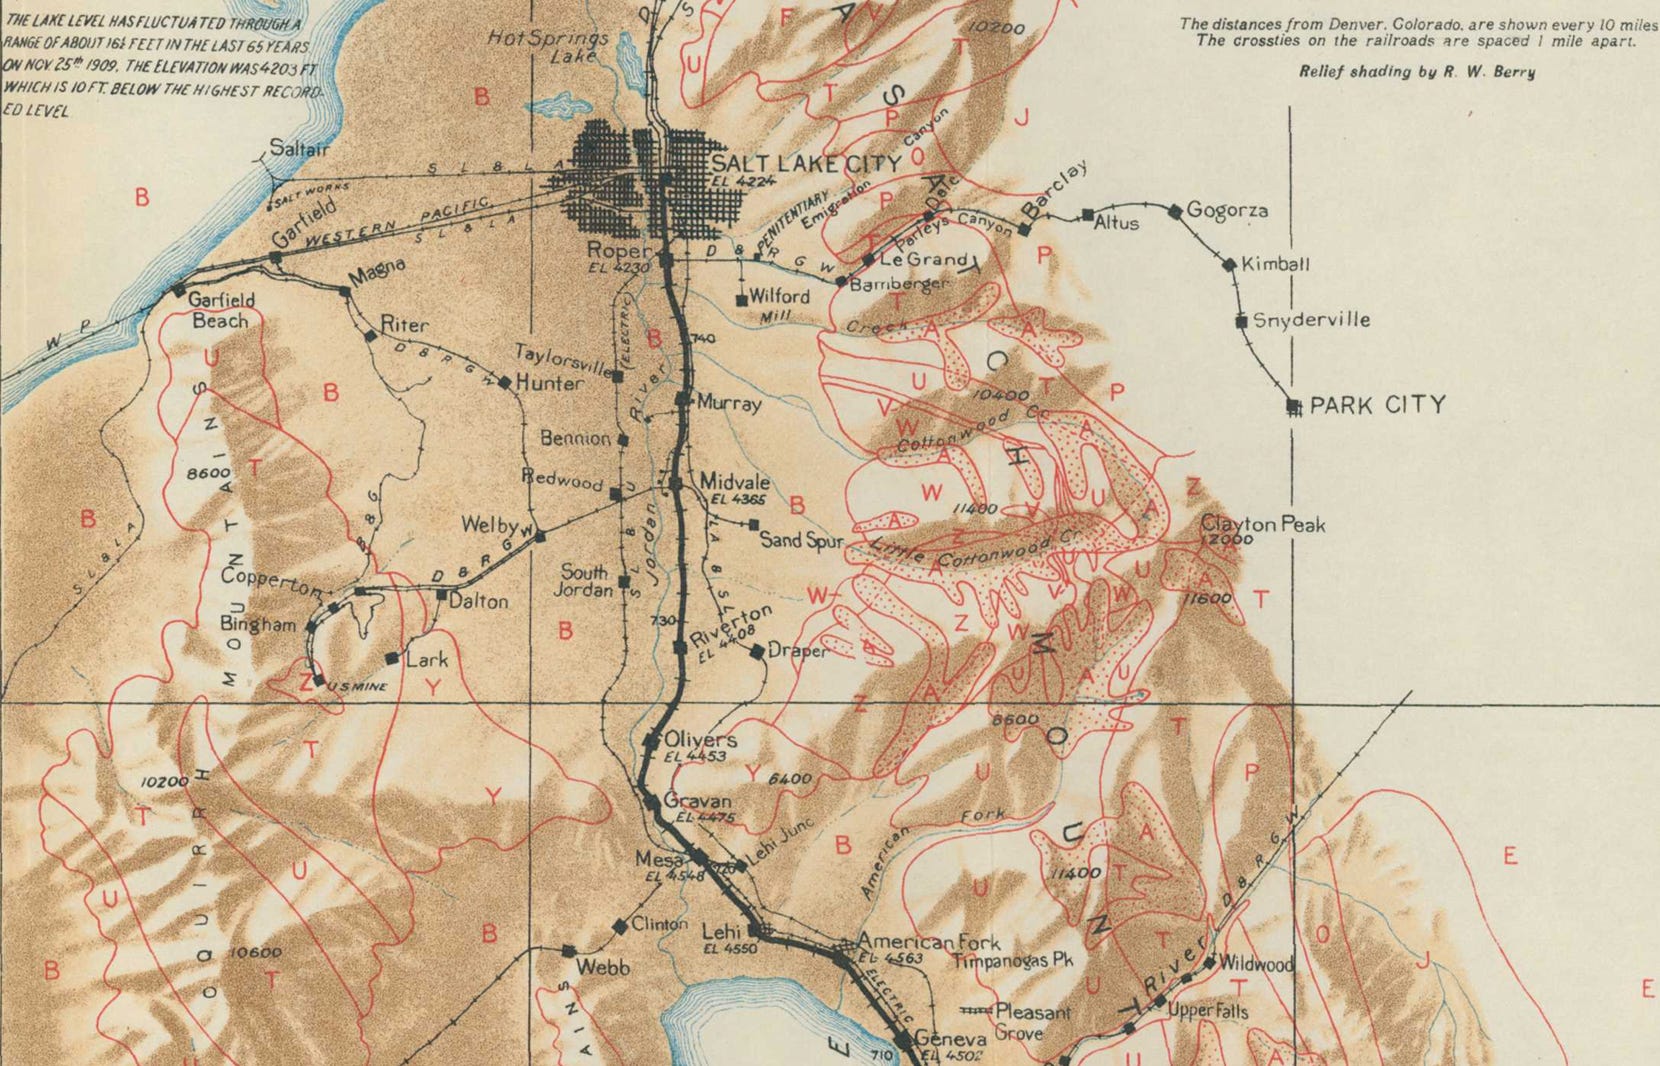
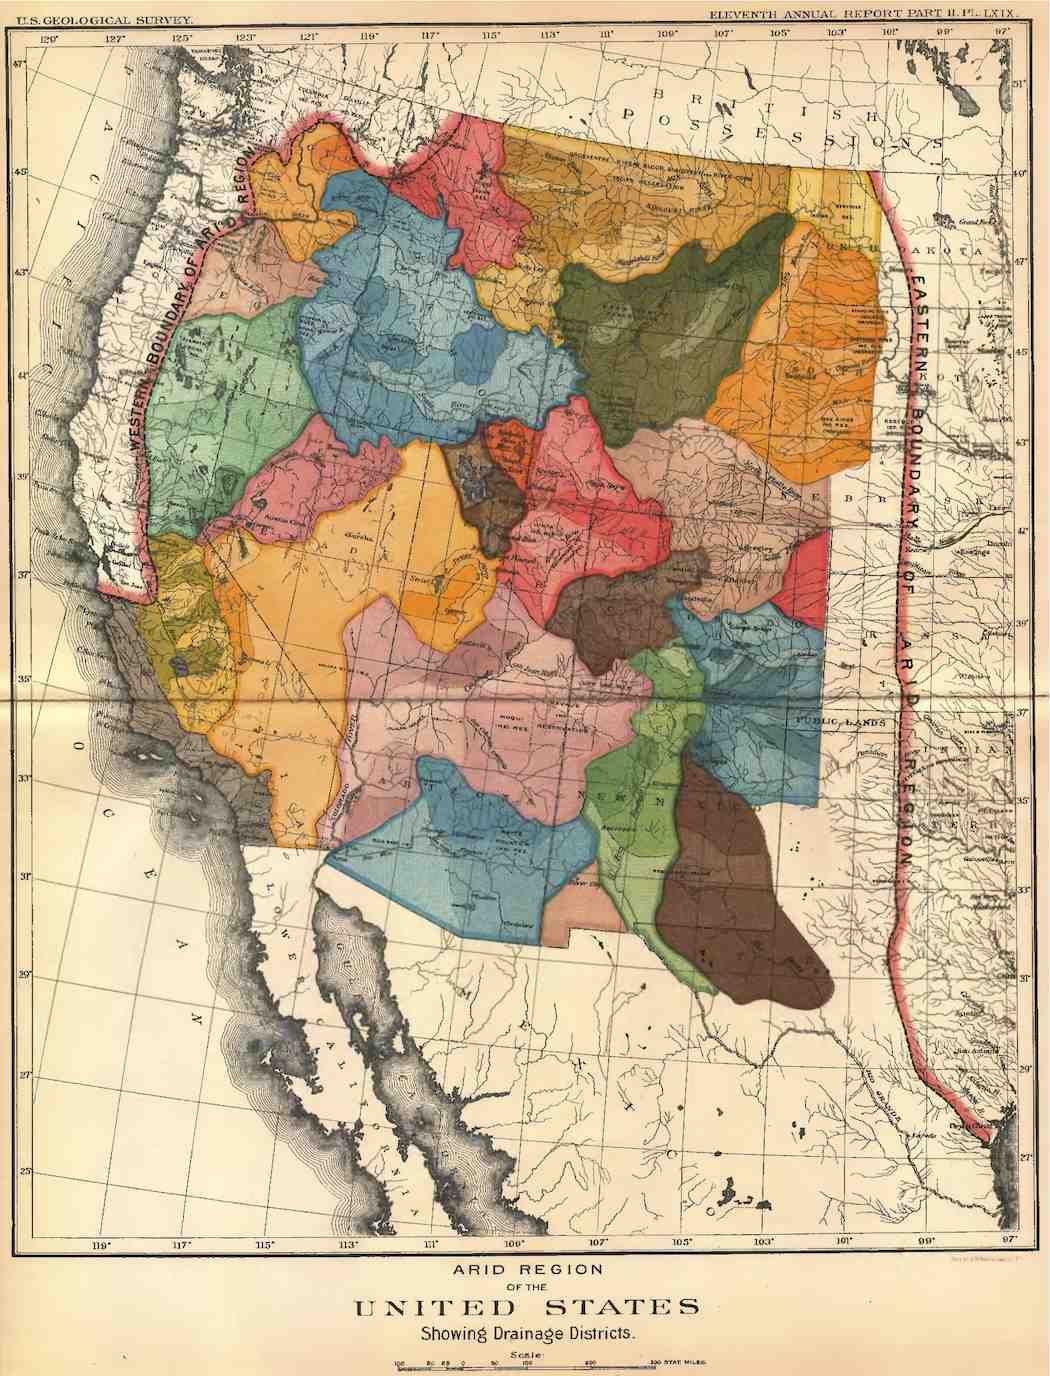
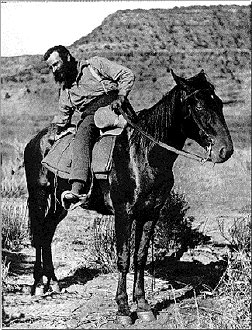
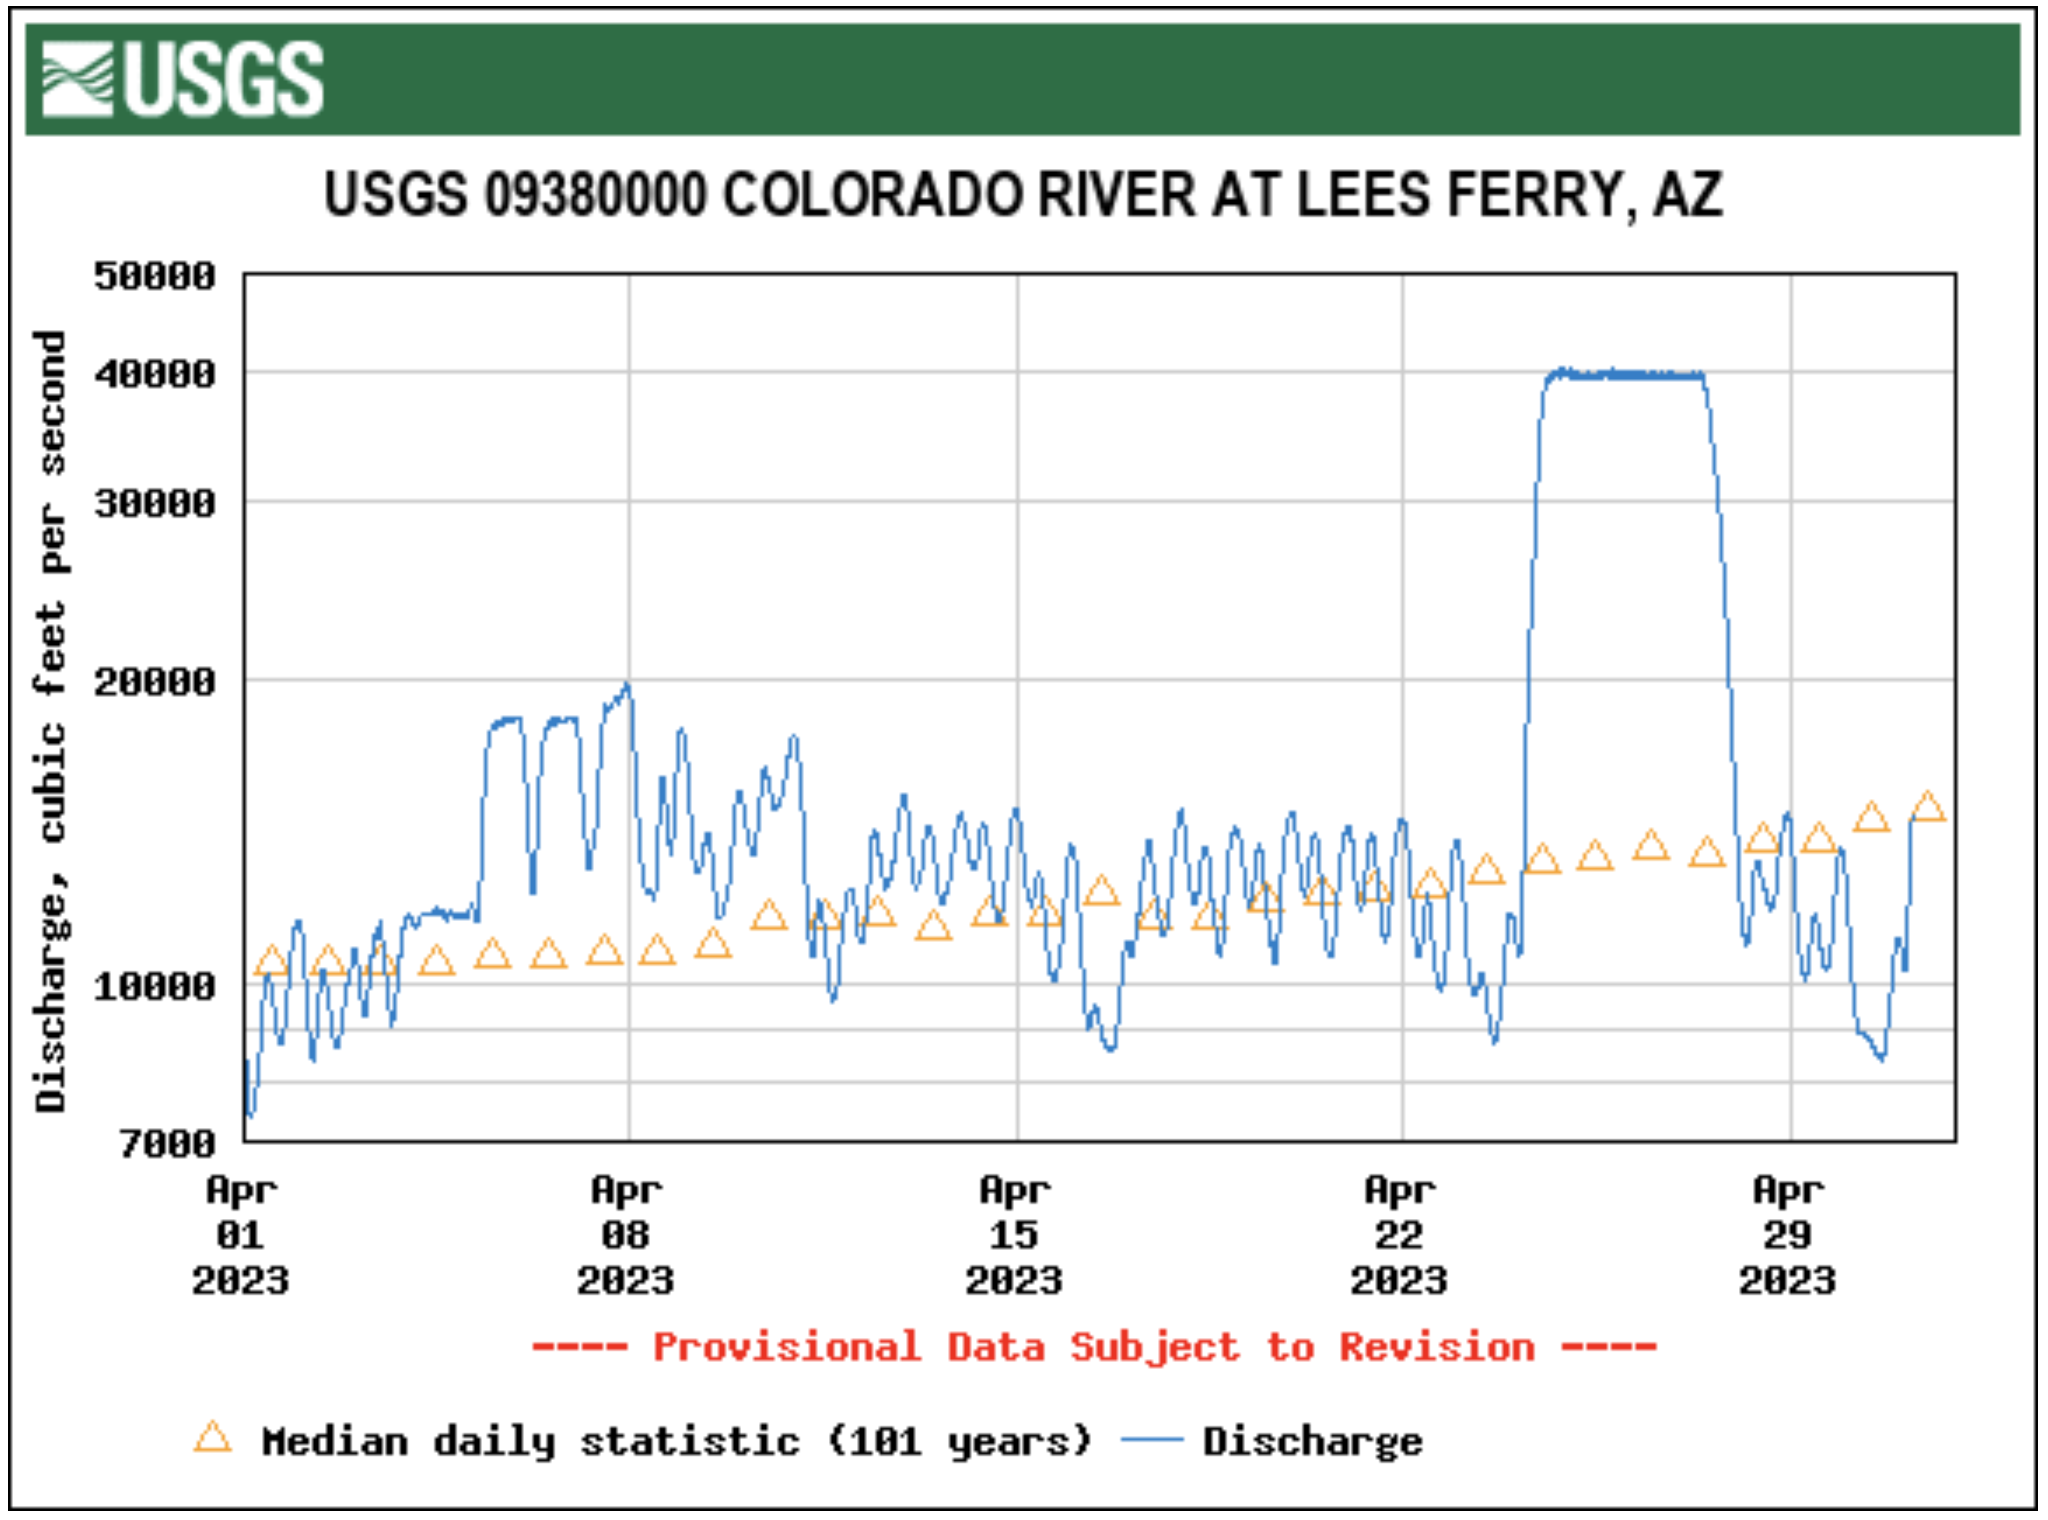
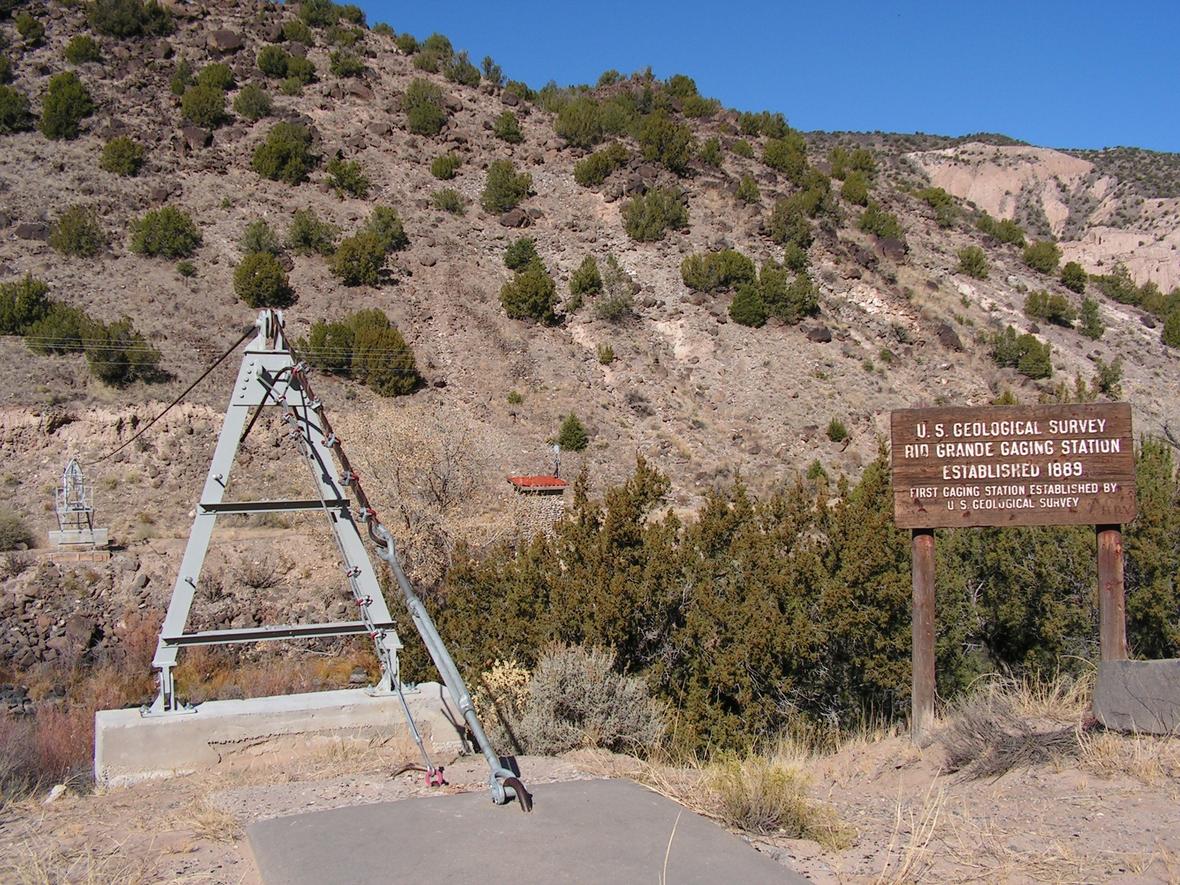
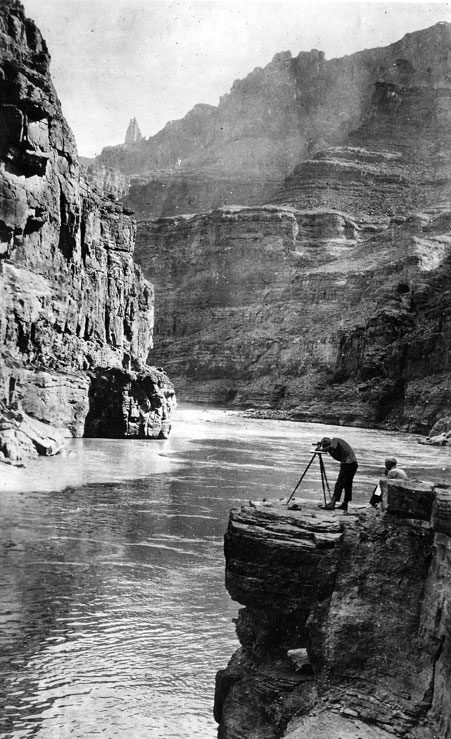
As the seven basin states gathered at Bishop’s Lodge in Santa Fe to carve up the river, they were joined by Eugene Clyde (E.C.) LaRue, a hydrologist for the U.S. Geological Survey. [Eric Kuhn responding to my X post, “Actually LaRue was never allowed to attend a Commission meeting. He asked, but Hoover said no.] LaRue presented the commissioners with a conclusion that threatened the very foundation of their negotiations. His data, which included early gauge records and historical flood markers, suggested that the river’s long-term average was approximately 15 million acre-feet (maf)
LaRue explicitly warned the commission that the period between 1905 and 1922 was a hydrological anomaly. Had the negotiators included the drier records from the late 1890s, the estimated annual flow would have dropped significantly. As Kuhn and Fleck note, the decision-makers had at their disposal a relatively thorough, almost modern picture of the river’s hydrology. They chose to ignore it because accepting LaRue’s science might have left them with a flow too low to reach the compromises necessary to develop the West.

Paper Water and the System Trap
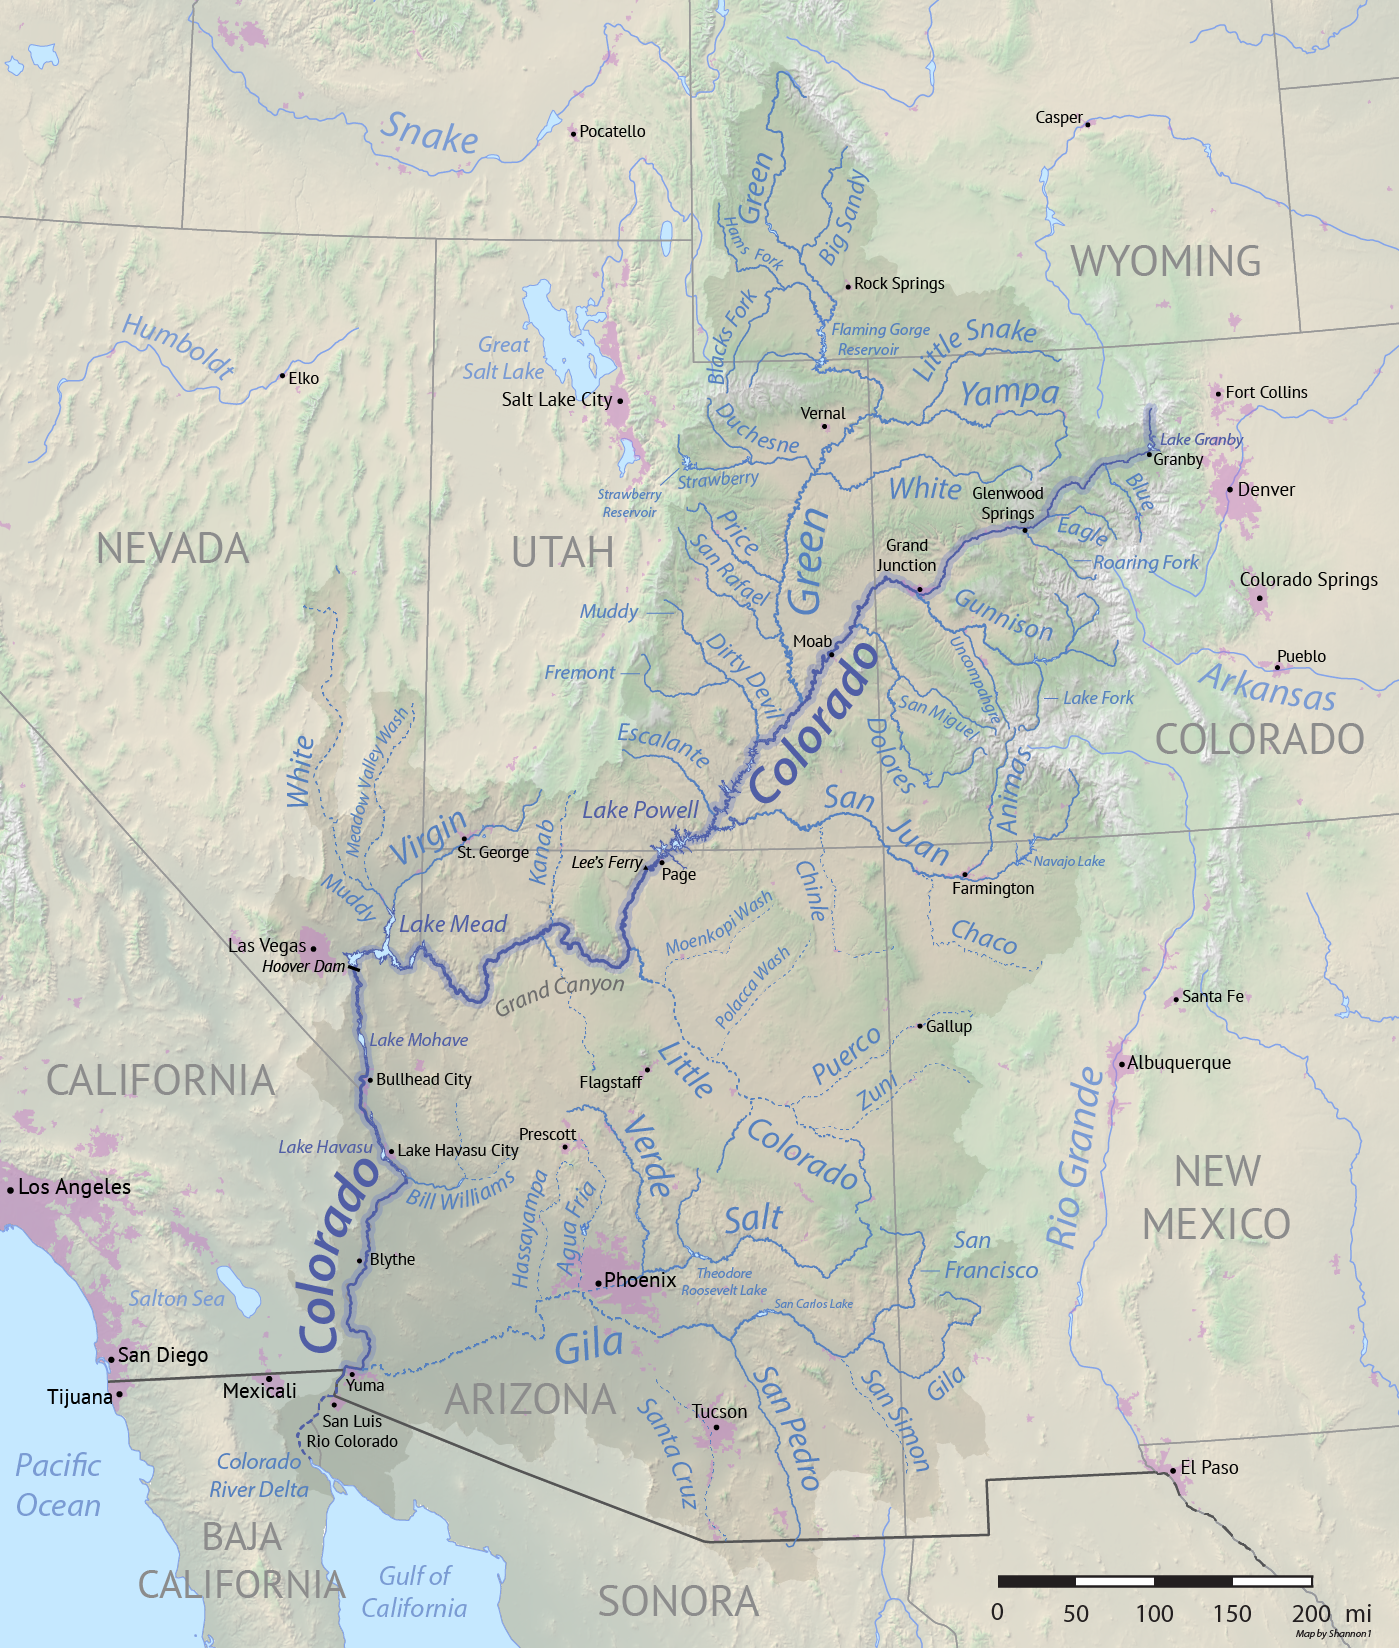
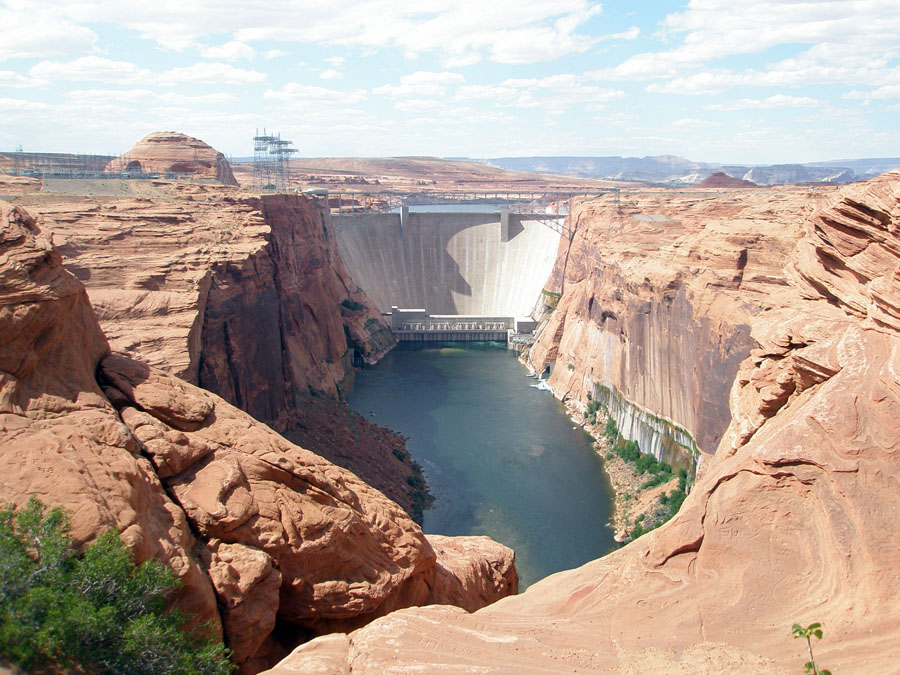
By sidelining LaRue and enshrining a “paper water” figure of 16.4 million acre-feet into the Law of the River, the commissioners fell into a classic “system trap.” They created a legal stock of water rights that far exceeded the river’s physical flow. This inflated number was essential to the “reinforcing loop” of 20th-century growth. It provided the legal certainty needed to secure federal funding for massive infrastructure projects like the Hoover Dam and the Glen Canyon Dam.
This intentional overestimation created a massive “information delay.” For eighty years, the system appeared stable only because the Upper Basin states were slow to develop their shares, allowing their “unused” water to flow downstream. This masked the fundamental deficit, leading to a state of “overshoot” in which the regional economy came to depend on water that did not exist. Professor Rhett Larson describes the resulting legal framework as a system of “calling shotgun” that was excellent for settling a desert but is catastrophic for managing one in a time of scarcity.
The End of the Delay
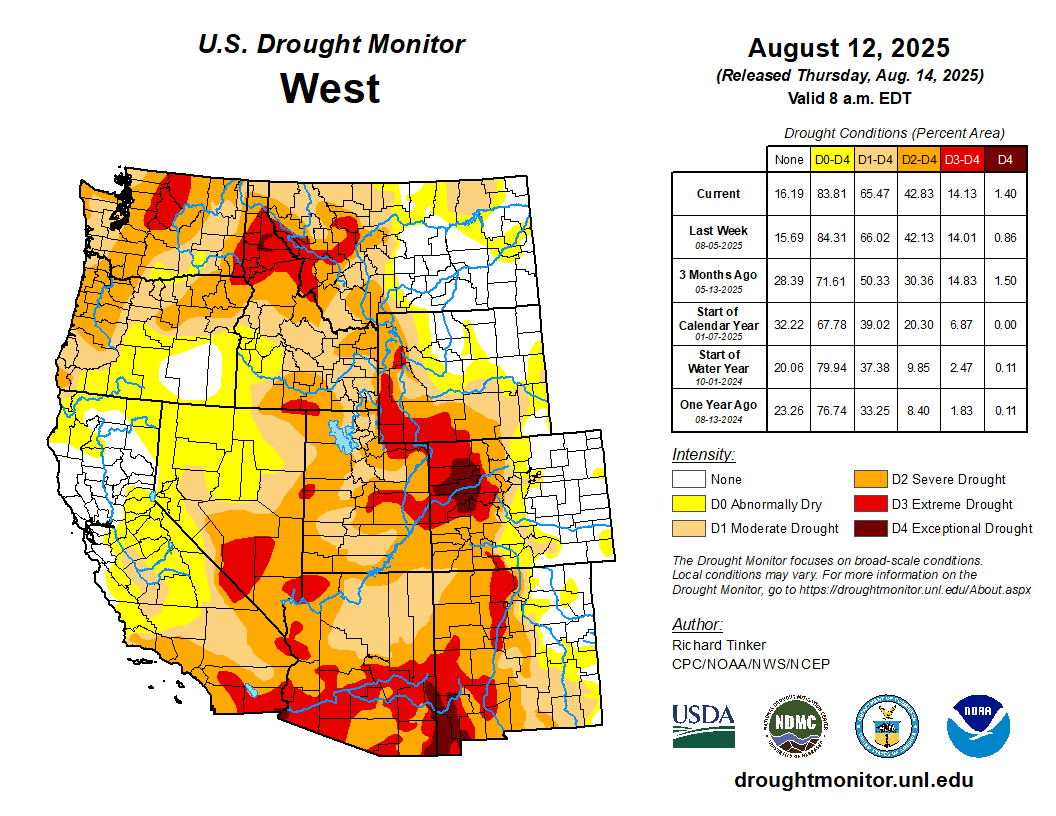
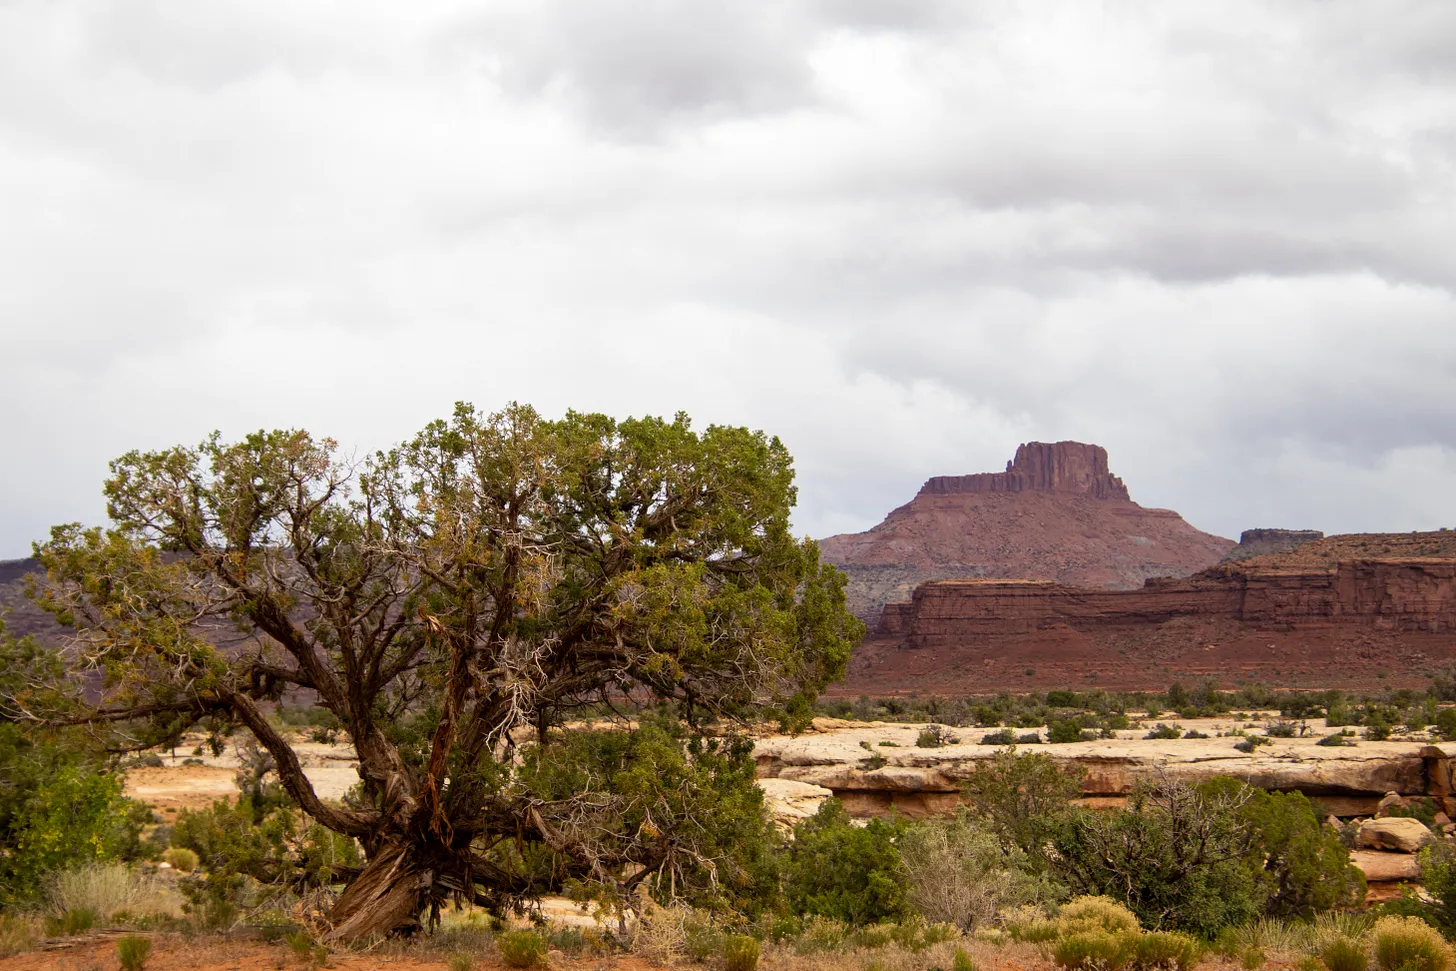
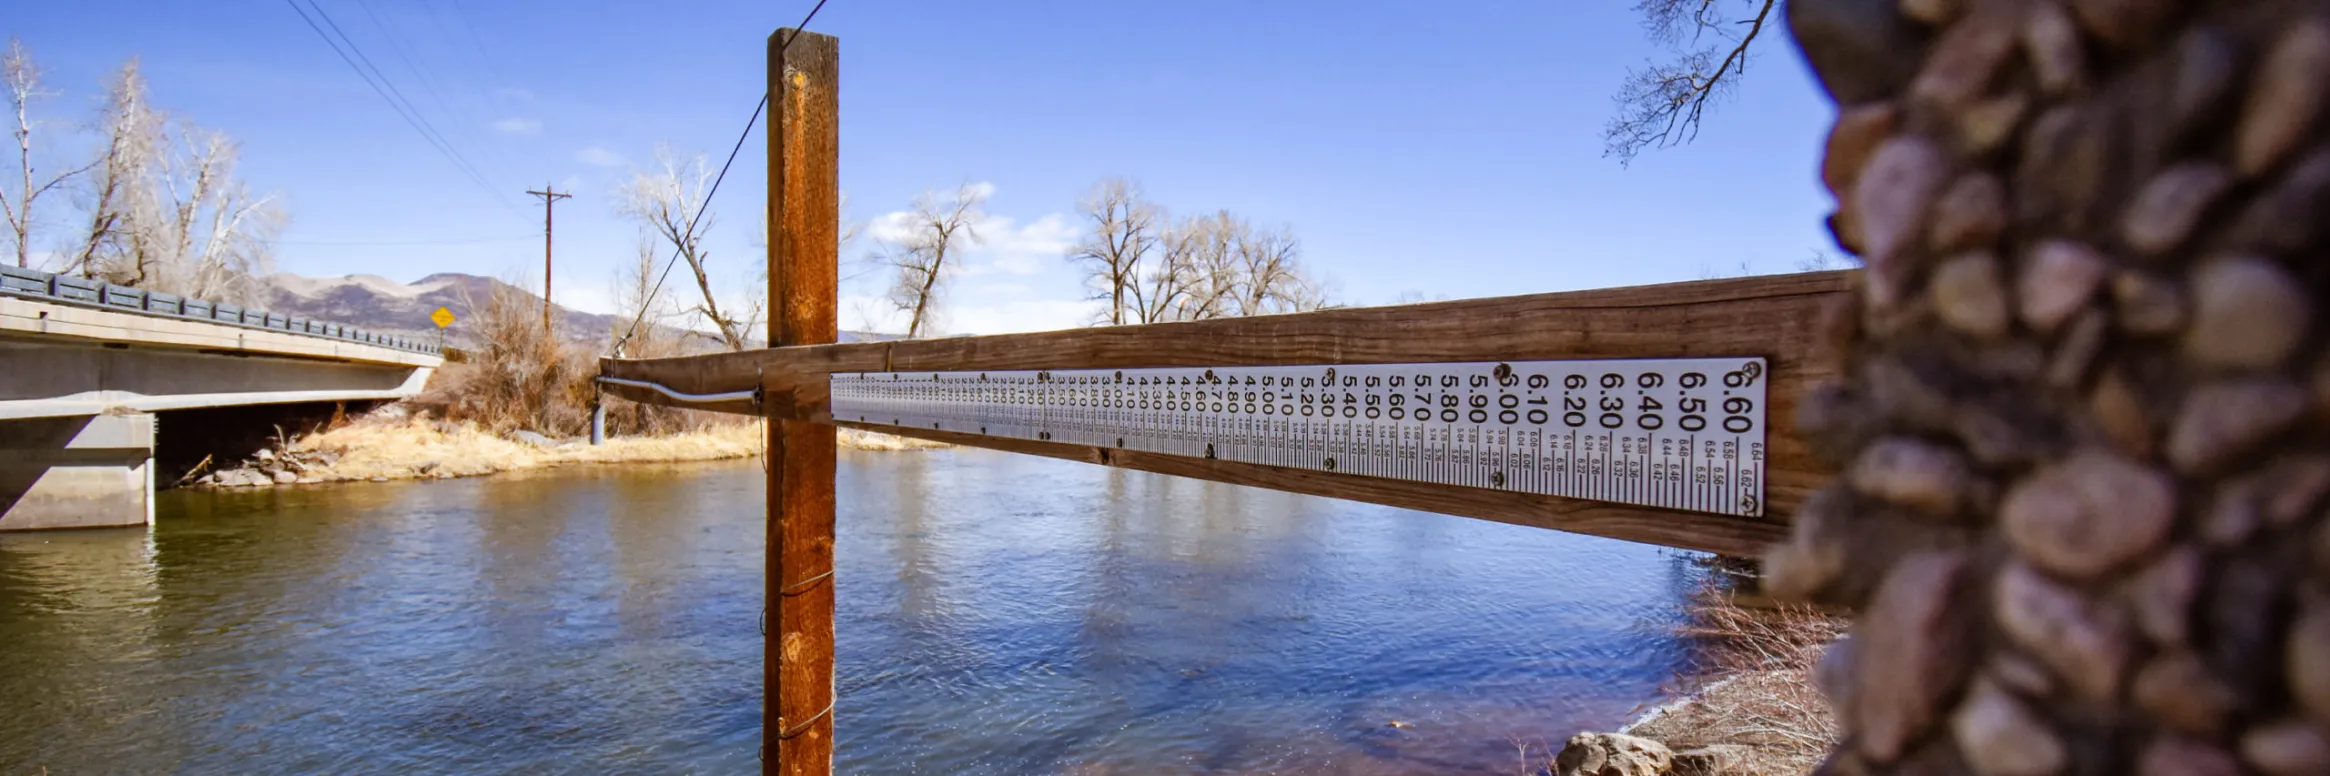
Today, the “delay” has finally ended, and the “inconvenient science” of 1922 has become the undeniable reality of 2026. The river’s source is being further depleted by “aridification,” a process climate scientist Brad Udall describes as a “sponge above our head” that evaporates moisture before it can reach the streamflow. We are now witnessing the collision of a 100-year-old legal fiction with a 21st-century climate reality.
The current impasse between the Upper and Lower Basins is a symptom of “policy resistance,” where every actor is incentivized to protect their “paper” share even as the “wet” water disappears. As Professor Andrea Gerlak observes, if a system has 25 years to produce an agreement and fails, there is likely something fundamentally wrong with the system itself. Solving the crisis at Lake Powell will require more than engineering; it will require a paradigm shift that finally aligns our laws with the river’s actual physical limits.


 wikipedia")


