Click the link to read Colorado Mother of Rivers by Greg Hobbs on the Water Education Colorado website. Greg was one of my best sources for stories and experiences about Colorado.
COLORADO MOTHER OF RIVERS
By Justice Greg Hobbs
When I was young the waters sang of being here before I am, of falling sweet and soft and slow to berry bog and high meadow. And held me in her lap and cooed the willow roots, the gaining pools, and called me through bright dappled grass and called me O, My Shining One; And shaped a bed to lay me on and played the flute so high and clear. And shape the stones to carry me, when I am young and full of fight for roaring here and roaring there, for pouring torrents in the air. When I am young as mountain snow in crag and cleft and cracked window; I call the green-backed cutthroat trout, I call the nymph and hellgrammite, I call the hatch to catch a wind, I call upon the mountain track; I call the scarlet to the jaw as morning calls her own hatchlings, call Yampa, White, the Rio Grande, San Juan, the Platte, the Arkansas.
(in celebration of the 30th year of Colorado’s instream flow law)
Take a little tour around Colorado.
The upper South Platte River, above the confluence with the North Fork of the South Platte. Photo: Brent Gardner-Smith/Aspen Journalism
Browns Canyon National Monument protects a stunning section of Colorado’s upper Arkansas River Valley. The area is a beacon to white water rafters and anglers looking to test their skills at catching brown and rainbow trout. Photo by Bob Wick / @BLMNational
Redrock reflection on the Dolores River near Gateway, downstream from the confluence with the San Miguel. Jonathan P. Thompson photo.
Black Canyon of the Gunnison. Photo credit: NPS/Kris Toy
Uncompahgre River Valley looking south
Colorado River “Beginnings”. Photo: Brent Gardner-Smith/Aspen Journalism
The Blue River flowing through Silverthorne just below Dillon Dam in May 2025. Photo/Allen Best
A view of the White River between Meeker and Rangely. The Rio Blanco Water Conservancy District on Jan. 7 secured a conditional water storage right for 66,720 acre-feet for the Wolf Creek Reservoir. Photo credit: Brent Garndner-Smith/Aspen Journalism
The Roaring Fork River in Aspen on July 8. Pitkin County Commissioners gave initial approval to buying more shares of Twin Lakes water to boost low flows on the Fork. CREDIT: HEATHER SACKETT/ASPEN JOURNALISM
The Crystal River runs parallel to County Road 3 as it flows past the town of Marble. The Pitkin County Healthy Rivers board has expressed interest in a water quality monitoring program to see if the diversion of Yule Creek, a tributary of the Crystal, is having downstream impacts. Photo credit: Heather Sackett/Aspen Journlism
Eagle River
Yampa River May 3, 2025. Yampa River on Saturday evening was flowing strongly through Steamboat Springs, but the snowpack in the the Yampa-White drainage area of northwest Colorado was still less than two-thirds of average. Photo credit: Allen Best
The Little Snake River is about to join the Yampa River on Oct. 8, 2020. Photo credit: Allen Best/Big Pivots
North Platte River
Laramie River
No Name Rapid, Class V, mile 10, Upper Animas River, Mountain Waters Rafting.
The San Miguel River near its headwaters in Telluride, Colorado. @bberwyn photo.
Cache la Poudre River from South Trail via Wikimedia Foundation.
You know the Colorado River crisis is serious when the Trump administration is willing to use hundreds of millions of dollars from President Biden’s climate law to help to solve it.
As of Wednesday night, federal officials had yet to release their plan for mandatory water cutbacks along the Colorado — a crucial water source for tens of millions of people and millions of acres of farmland across the American West. But with a plan expected later this week, details were starting to trickle out.
The L.A. Times’ Ian James reported that Trump’s Interior Department would accept a proposal submitted by California, Arizona and Nevada — the Lower Basin states — to slash their water use by 12%, 31% and 28%, respectively, through 2028. They’ll receive $350 million from Biden’s Inflation Reduction Act to support water conservation.
The Upper Basin states — Colorado, Utah, New Mexico and Wyoming — will get $100 million in conservation funding. But unlike their downstream neighbors, they won’t face mandatory water cuts. However much water they end up saving, that will be good enough.
It’s always possible the plan will change. I’m eager to see the final details.
While we wait, let’s hear from one of the West’s most thoughtful and well-informed Colorado River chroniclers.
That would be Zak Podmore, author of “Life After Dead Pool: Lake Powell’s Last Days and the Rebirth of the Colorado River.” Earlier this week, he and I talked for an hour and took audience questions on Zoom; it was a great time. Thank you to everyone who joined us. Paid subscribers to Climate-Colored Goggles can scroll up to watch the full video.
Here are five lessons that stood out to me from our conversation — all of which are relevant to the high-stakes conflict playing out among the states.
1. We’re not doomed. Earth is resilient
My favorite thing about “Life After Dead Pool” is its hopeful message.
Most headlines about the Colorado River these days are gloomy. For instance, the last time Lake Mead and Lake Powell held as little water as they do right now was 1956 — before Lake Powell existed, meaning all the water was in Mead. Powell is currently 23% full; Mead is 27% full. These are the largest reservoirs in the United States.
A river returns. Almost 50 miles of the San Juan, once inundated by Powell Reservoir, are flowing free. Photo credit: Morgan Sjogren
But Podmore’s book flips the script, offering a firsthand look the amazing ecological recovery taking place as Lake Powell shrinks.
In and around the reservoir, which was flooded by Glen Canyon Dam more than 60 years ago, native vegetation is returning much faster than scientists thought possible — especially in narrow side canyons inundated by Powell. Exploring these remote, newly accessible places inspired Podmore to write his book.
“Instead of hearing the story that I grew up hearing — which was that Glen Canyon Dam had all these negative environmental consequences, it drowned this beautiful place — I was hearing these conversations from these researchers who were talking about the landscape that was coming back, and how excited they were about the way the ecology was recovering, and the way the endangered fish were expanding their habitat,” Podmore said.
“Instead of a story about being too late, it was a story about realizing that I was right on time, as we all are, to see the rebirth of Glen Canyon,” he added.
The Colorado River flows through Glen Canyon in 1958, before the dam was built. (Photo via Wikimedia Commons)
2. Those who don’t learn from history…
Podmore starts the book by imagining what Indigenous life might have been like in and around Glen Canyon nearly 1,000 years ago — when the region had a far larger population than it does today.
He wanted to show that the Colorado River Basin’s human history began long before white settlement — and that even environmentalists have often ignored the watershed’s Indigenous past.
“I was definitely indoctrinated into the mainstream environmental school of thought as I was growing up,” he said. “I had a copy of the really famous book about Glen Canyon called, ‘The Place No One Knew,’ which was published by the Sierra Club in the ’60s and talked about how nobody cared enough about Glen Canyon to protect it. And then I realized later on that [the] title was very offensive, and [in fact] there were people who knew Glen Canyon very well and lived there for thousands of years, and who were displaced as the waters of Lake Powell started to fill, in the case of many Navajo families.”
Podmore’s opening scene describes a 10,000-gallon stone water tank built by Ancestral Pueblo farmers, the ruins of which were eventually buried by Lake Powell. The tank’s key feature: a drain at the bottom, so that irrigation could continue no matter how low water levels got.
Diagram showing critical reservoir levels at Glen Canyon Dam and Lake Powell. Land Desk diagram with data from the Bureau of Reclamation.
Lake Powell doesn’t have a drain at the bottom. It could certainly use one.
3. The Upper Basin states aren’t doing enough
If Powell’s water levels sink much lower, water won’t be able to pass through the dam’s hydropower turbines, which generate cheap electricity for communities across the West. That wouldn’t be a “dead pool” situation; water could still flow downstream to the Grand Canyon and Lake Mead through bypass tubes lower in the dam. But the bypass tubes are surprisingly frail and could break with sustained use.
Translation: We are frighteningly close to “de facto dead pool.” That’s why the Trump administration is ordering everyone to use less water.
Well, not everyone. California, Arizona and Nevada are willing to cut back dramatically, and federal officials seem happy to make them do it. The Upper Basin states — the ones upstream of Lake Powell — say they shouldn’t have to commit to mandatory reductions, in part because they already consume a lot less.
[ed. It is not possible to measure or marshall water to Lake Powell (lack of infrastructure, gaining and losing reaches, priority, no way to color water in the river). Inflows are calculated values, or the height of the column at the dam. The Upper Basin consumes a lot less than their allocation under the compact, so yes, much less than the Lower Basin. Here’s an AI recap of inflows to Lake Powell.]
In a New York Times opinion piece earlier this year, I argued that the Upper Basin states need to do more. Podmore agreed.
“It’s a tricky situation, because the Lower Basin has always used more water, and that’s a convenient argument for the Upper Basin,” he said. “But also, there’s more people in the Lower Basin. And the most productive agricultural land that’s irrigated with Colorado River water is located in the Lower Basin.”
“Even with the cuts that the Lower Basin has offered, we still have a long way to go to balance the water budget,” he added. “Everyone needs to pitch in.”
Farmland in California’s Imperial Valley, irrigated with Colorado River water. (Photo by Sammy Roth)
4. Alfalfa isn’t (always) the enemy
Farmers are often vilified for sucking up copious amounts of water — and with good reason. Irrigated agriculture consumes more than half the water in the Colorado River Basin, with alfalfa and other cattle feed accounting for a stunning 32% of overall water use. (This is one of several good reasons to eat fewer hamburgers.)
The Colorado River’s largest water user, by far, is California’s Imperial Valley, where farmers grow vegetables, alfalfa and other crops. There’s no sustainable future for the American West that doesn’t involve Imperial using less water.
But easy as it is to hate on Imperial, Podmore pointed out that when the Lower Basin uses water, that water stays in the river for a long time, supporting healthy ecosystems along the way. And because Imperial is very far downstream, water flowing to alfalfa farmers there carries huge environmental benefits.
“The way that water gets from the Rocky Mountains to the Imperial Valley — or to Los Angeles or Las Vegas or Phoenix — is through the Grand Canyon. It’s through Glen Canyon. It’s through Canyonlands National Park,” Podmore said. “It’s through all these important and beautiful places.”
“If the Lower Basin agrees to a bunch of cuts — if L.A. builds tons of desalination plants — that would in theory be good, because you have to divert less water from the river,” he added. But at the same time, “that means less water in the river.”
Colorado River “Beginnings”. Photo: Brent Gardner-Smith/Aspen Journalism
The Bureau of Reclamation has released the Final Environmental Impact Statement, which designates a preferred course of action for future management of Lake Powell and Lake Mead. The preferred alternative establishes an adaptive decision framework to be used to develop operating guidelines designed to ensure reliable operations in the Colorado River Basin while maintaining the flexibility to respond to changing conditions over a 10-year period through 2036. The framework also preserves the opportunity for the Basin to continue working towards consensus agreements, and if successful, be incorporated into future operations.
The framework will be used to develop operating guidelines for operations at Lake Powell and Lake Mead that can be adjusted for shorter and longer term periods.
“The Department has a responsibility to ensure the Colorado River system remains reliable and resilient for the millions of Americans, communities and industries that depend on it,” saidSecretary of the Interior Doug Burgum. “This framework provides the flexibility to respond to changing hydrologic conditions while preserving the opportunity for the Basin States to continue working toward durable, consensus-based solutions.”
The framework establishes the operational principles, sideboards—key thresholds and ranges for operational elements—and a process that will govern development and issuance of operating guidelines through 2036. Operational sideboards were chosen to ensure that the Department would have flexibility and environmental compliance to operate the system in a way that is responsive to actual hydrologic conditions and allows for the incorporation of Basin-wide innovative water management solutions. The sideboards, which are analyzed in the Final EIS, provide for annual releases from Lake Powell between 5.0 maf and 12.0 maf, Lower Basin shortages of up to 3.0 maf, the ability to store up to 8.0 maf and 3.0 maf of conserved water in Lake Powell and Lake Mead for future use, respectively, and the opportunity for voluntary Upper Basin conservation up to 200 kaf, subject to hydrology.
The Department would issue operating guidelines, within these sideboards, at anticipated 2-year periods, unless consensus-based agreements provide for a longer duration. It also establishes a structure under which operating guidelines will be developed, reviewed and periodically updated. This approach provides certainty regarding a decision process over the next 10 years while preserving the flexibility to adapt to changing conditions.
“This plan strikes a balance between flexibility and predictability for the Colorado River system that is vital to the 40 million people who rely on it given unprecedented hydrologic conditions and the potential for considerable impacts on water users,” saidAssistant Secretary for Water and Science Andrea Travnicek. “It also allows a new flexibility to respond to changing conditions and potential consensus.”
The Colorado River provides water for more than 40 million people and fuels hydropower resources in seven states. It serves as a vital resource for 30 tribes and two Mexican states, sustaining 5.5 million acres of farmland and agricultural communities throughout the West, while also supporting critical ecosystems and protecting endangered species.
Udall/Overpeck 4-panel Figure Colorado River temperature/precipitation/natural flows with trend. Lake Mead and Lake Powell storage. Updated through Water Year 2025. Note the tiny points on the annual data so that you can flyspeck the individual years. Credit: Brad Udall
Drought conditions over the past 25 years, combined with expectations of continued dry conditions, have made development of future operating guidelines for the Colorado River particularly challenging. The combined contents of Lake Powell and Lake Mead have not been this low since before Glen Canyon Dam began filling in 1963, and since 2000 water use has exceeded total system inflow in most years. The Colorado River Compact apportioned 7.5 million acre-feet to both the Upper and Lower Basins based on the estimated pre-compact average inflow (1906-1921) of approximately 18 million acre-feet. However, inflows from 2000 to 2024 have only averaged 12.9 million acre-feet and the unregulated inflow into Lake Powell this year as of July is estimated to be only 3.5 maf.
Between 2020 and 2024, the average consumptive use in the Colorado River Basin was 13.1 million acre-feet. That is broken down by:
Upper Basin Use: 3.8 million acre-feet (29%).
Lower Basin Use: 6.5 million acre-feet (49%).
Mexico Use: 1.4 million acre-feet (11%).
Evaporation: 1.4 million acre-feet (11%).
This Final EIS is the culmination of a NEPA process that was initiated in June 2023. Over this three-year period Reclamation engaged extensively with Basin stakeholders and that input is reflected in the alternatives analyzed in the Final EIS and the Preferred Alternative.
Reclamation received more than 18,000 comments, including 785 unique submissions from the public, tribes, states, federal agencies and others after releasing the draft EIS in January 2026. Reclamation evaluated substantive comments and updated the final EIS, with public input helping to shape the preferred alternative.
The Final EIS is available on Reclamation’s website.
The final EIS addresses only domestic river operations. A separate binational process addressing water deliveries to Mexico is nearing completion and the Department is committed to continued collaboration with Mexico. The Department will conduct all necessary and appropriate discussions regarding post-2026 operations and implementation of the 1944 Water Treaty with Mexico through the International Boundary and Water Commission in consultation with the Department of State.
Click the link to access the EIS on the Reclamation website. Here’s the abstract:
July 31, 2026
The Secretary of the Department of the Interior, acting through the Bureau of Reclamation, proposes the adoption of new guidelines and coordinated management strategies to address Lake Powell and Lake Mead through their full operating range to take effect when the current agreements expire in 2026. Management strategies will primarily focus on the operation of Glen Canyon Dam and Hoover Dam, but may include actions upstream and downstream of these facilities to protect critical reservoir elevations.
This Final EIS has been prepared to inform the Secretary’s timely adoption of a new set of guidelines that would be sufficiently robust and provide improved predictability to all water users and managers in the Colorado River Basin. This Final EIS has been prepared pursuant to the National Environmental Policy Act to address the formulation and evaluation of specific interim criteria and to identify the potential environmental impacts of implementing such criteria.
Map of the Colorado River drainage basin, created using USGS data. By Shannon1 Creative Commons Attribution-Share Alike 4.0
Big Thompson Flood, Colorado. Cabin lodged on a private bridge just below Drake, looking upstream. Photo by W. R. Hansen, August 13, 1976. Photo via the USGS.
Re-upping this post for July 31, 2026. The flood remains Colorado’s deadliest. Here’s a link to Coyote Gulch coverage mentioning the Big Thompson Flood.
July 31, 1976, Steamboat Springs: I had been wandering around the Flat Tops Wilderness for a week or so with Mrs. Gulch. Drizzle in between downpours during the monsoon. We were holed-up in a hotel to dry out and I phoned my mother to check in.
She asked, “Johnny are you anywhere near the Big Thompson Canyon? There’s been a terrible flood.”
And it was a terrible flood. After the September 2013 floods Allen Best wrote about being part of the disaster response in The Denver Post. It’s a good read on this 40th anniversary. Here’s one passage:
I was at the Big Thompson disaster. I was living in Fort Collins then and was among scores of young men (sorry, women, those were different times) with strong backs who could be summoned in case of forest fires. My only fire was at an old sawmill site in the foothills. The joke was that one of us had set the fire because we were so desperate for minimum-wage work.
Then came July 31. It was hot that night in Fort Collins. It hadn’t rained a drop.
I was living above Gene’s Tavern, just two blocks from the Larimer County Courthouse. When the call came, I was at the sheriff’s office almost immediately. It was 9 p.m.
Being among the first at the command center at the Dam Store west of Loveland, near the mouth of Big Thompson Canyon, I was assigned to a pickup dispatched to look for people in the water near the turnoff to Masonville. Already, the river was out of its banks. From the darkness emerged a figure, dripping and confused. “I went fishing at Horsetooth (Reservoir) and was driving home and then there was all this water,” he sputtered. He was befuddled. So were we.
Our leader decided we’d best get out of there. From what I saw the next morning, that was an excellent decision. Water later covered the road there, too. I spent the night at the Dam Store as the water rose. Helicopters were dispatched, but there was little that could be done. Our lights revealed picnic baskets, beach balls and propane bottles bobbing in the dark, roiling water that raced past us, but never any hands summoning help.
In the morning, we found those hands. The bodies were stripped of clothing and covered with mud. The first I saw was of a woman who we guessed was 18, not much younger than I was then. This thin margin between life and death was startling in my young eyes.
Eventually, 144 people were declared victims of the flooding that night (although one turned up alive in 2008 in Oklahoma).
Estes Park got some rain, but not all that much. The larger story was partway down the canyon, in the Glen Haven and Glen Comfort areas, where the thunderstorm hovered. In just a few hours, it dropped 10 to 14 inches of water.
Downstream in the canyon, just above the Narrows, some people were unaware that anything was amiss until they went outside their houses and saw the water rising in their yards. It hadn’t even rained there. One cabin I saw a few days later was stripped of doors and windows but stood on its foundations, a mound of mud 5 or 6 feet high in the interior. I seem to recall a dog barking as we approached, protecting that small part of the familiar in a world gone mad.
At the old hydroelectric plant where my family had once enjoyed Sunday picnics, the brick building had vanished. Only the turbines and concrete foundation remained. In a nearby tree, amid the branches maybe 10 or 15 feet off the ground, hung a lifeless body.
The river that night carried 32,000 cubic feet per second of water at the mouth of the canyon, near where I was stationed. It happened almost instantaneously — and then it was gone. It was a flash flood.
Here’s an excerpt from a look back forty years from Michelle Vendegna writing for the Longmont Times-Call.
Night on the ledge
“We, Terry Belair-Hassig and Connie Granath-Hays, graduated from Berthoud Jr. Sr. High School the month before, and were anxious to begin the summer. We spent the beautiful, sunny day of July 31, 1976, at a Hewlett-Packard company picnic at Hermit Park not far from Estes Park. After the picnic, we drove up to Estes Park and had dinner at Bob and Tony’s Pizza.
The clouds started moving in about 6 p.m., so we began the drive down to Loveland via U.S. 34. Within minutes, Connie had to pull her car over because the driving rain was causing zero visibility. We needed to get home, so she started out again, but we didn’t get too much farther before we were blocked by trees, boulders and debris washing down the canyon sides. We had just passed the Loveland Heights area — barely three miles since entering the canyon. The closest town, Drake, was miles away.
Connie pulled over to the side of the mountain as far as she could. There were a few other cars in this section doing the same, but we all sat in our cars — planning to wait out the storm. However, once the river began to rise and the water was hitting the tires, we decided to leave the car and start climbing. Connie’s dad had taught her to always ‘be prepared,’ so she had a tarp and a few extra jackets stored in her trunk. We grabbed them before climbing. It was a dark, treacherous climb.
A small group of people scrambled up the mountain near us. Connie gave one of the men her extra jacket. She also had a flashlight which came in handy later in the evening when the lightning wasn’t lighting up the canyon. The other people were lucky enough to find an overhang of rocks to sit under. We tentatively settled on a ledge out in the open, and wrapped ourselves in the tarp. Of course, the tarp was just an old tarp, not waterproof like the ones are today. It protected us for a while, but with the downpour of rain and runoff from the hillside, it too became drenched.
After only a little while, we watched her car, during the lightning flashes, being lifted up and carried down the river. We decided at this point we should climb higher, so we found a ledge where we spent the long, cold night. We had spent many winters skiing and had never been as cold as we were that night.
We sat on that little ledge (3 foot by 1 foot) with our knees drawn up to keep us from sliding off. We sang, shivered, cussed and did anything we could to keep our minds off of how cold and achy we were. We heard and saw cars, houses and propane tanks floating down the river during flashes of lightning. We thought by now it must be about morning time, but looking at our watch, it was about 10 p.m. We had a long night ahead of us.
The next morning was another blue bird day and we were freezing and soaked to the bone. We decided it would be warmer to take our jackets off and left them on the ledge. The road below us had been washed away, but the river had receded enough that we could get off the ledge and move around a little on the steep mountainside. We heard the helicopters for a long time before we saw one. Finally, we were rescued off the side of the mountain by a four-seat helicopter,and dropped off up river on a section of the highway that had survived. There were several other people there. I remember we were all surveying the canyon in a daze. There wasn’t much conversation. I leaned over and picked up a small piece of asphalt and put it in my pocket.
Click here to read the Fort Collins Coloradoan special about the flood.
On July 31, 1976, during the celebration of Colorado’s centennial, the Big Thompson Canyon was the site of a devastating flash flood that swept down the steep and narrow canyon, claiming the lives of 143 people, 5 of whom were never found. This flood was triggered by a nearly stationary thunderstorm near the upper section of the canyon that dumped 300 millimeters (12 inches) of rain in less than 4 hours (more than 3/4 of the average annual rainfall for the area). Little rain fell over the lower section of the canyon, where many of the victims were.
Around 9 p.m., a wall of water more than 6 meters (20 ft) high raced down the canyon at about 6 m/s (14 mph), destroying 400 cars, 418 houses and 52 businesses and washing out most of U.S. Route 34. This flood was more than 4 times as strong as any in the 112-year record available in 1976, with a discharge of 1,000 cubic meters per second (35,000 ft³/s).
Officials on Friday detailed how a Big Thompson River that was flowing at 30 cubic feet per second increased to 30,000 by the time it got to the narrows near Sylvan Ranch and the Dam Store.
The 2013 flood, by contrast was flowing at 16,000 cubic feet per second at the same point. But Bob Kimbrough, from the U.S. Geological Survey, said that number can be misleading. Just because it was flowing at less than half the rate, doesn’t mean the water was half as high as it was in 1976. It could have been a foot or two lower, Kimbrough said.
Further, the 2013 flood lasted longer. Where the 1976 flood dissipated nearly as quickly as it rose, the 2013 flood flowed over saturated ground for days, causing foundation failures and greater erosion than the 1976 flood.
Click here to read the extensive coverage from The Estes Park Trail-Gazette.
Between the reservoir and the endangered fish in the lower Gunnison sits the Gunnison Tunnel, which diverts water just below Crystal Reservoir at the head of the Black Canyon and carries it to about 80,000 acres in the Uncompahgre Valley. It belongs to the Uncompahgre Valley Water Users Association (UVWUA), which, as Colorado River District engineer Caleb Foy puts it, “holds a very senior water right” In Colorado, the oldest rights have priority over more junior rights. UVWUA is not untouched. It opened the season at 50% allocation — “just seeing the writing on the wall in regard to the poor hydrologic conditions,” Foy said. This means all UVWUA users receive half as much water as they would in a normal year. UVWUA’s other supply, Ridgway Reservoir, is ~85% full, but by design: the association told shareholders this spring that its “goal is to maintain storage in Ridgway Reservoir until mid-July to help support peak season demands.” And the natural flows in the Uncompahgre and Cow Creek that normally supplements UVWUA through the Spring and summer, delivered nothing — the association “received zero water in regard to direct flow water from the Uncompahgre system this year to date,” Foy said. Blue Mesa, he said, holds “multiple colors of water” — some stored under Aspinall Unit rights, some belonging to the association under a Taylor Park first-fill right. If the reservoir ever fell far enough that only the UVWUA’s water remained, that “would effectively dry up the Black Canyon.” Avoiding that is why the flows in the lower Gunnison are so low. It leaves the basin, in Foy’s words, in “a less risky neighborhood than we would have otherwise been in.”
Ruedi Reservoir was 65% full as of Wednesday. Increased releases out of Ruedi could bump up flows in the Fryingpan River to as high as 700 cfs. Credit: Heather Sackett/Aspen Journalism
Residents and anglers can expect to see high flows in the Fryingpan River in the month of August as water managers increase releases out of Ruedi Reservoir in an attempt to relieve the worst drought conditions downstream.
The Colorado Water Trust plans to begin releasing from a 4,700-acre-foot pool it leases in Ruedi on Monday. The Glenwood Springs-based Colorado River Water Conservation District also plans to begin releases from its 10,500-acre-foot Ruedi pool next week. Flows in the Fryingpan River are expected to typically be between 300 and 500 cfs while the releases are happening, though they could climb higher. It’s unclear how long the increased releases will last; it will depend on weather and precipitation over the coming weeks.
Water managers say flooding on the Fryingpan begins to be a concern around 800 cfs; River District officials say water managers will aim to keep the river below 700 cfs.
“We do not want to cause any flooding; we are very aware of that,” said Brendon Langenhuizen, director of technical advocacy for the River District.
Langenhuizen laid out details of the planned releases at a remote Zoom meeting of local leaders and water managers on Wednesday.
Although flooding may not happen until 800 cfs, impacts to the Fryingpan’s famous Gold Medal trout fishery happen long before that. Anglers generally like flows to remain below 300 cfs, the level at which wading becomes difficult and potentially dangerous.
Aspen Mayor Rachel Richards noted the dire conditions downstream, but asked if flows could be kept in the 300 to 350 cfs range when possible.
“Additionally, it’s more about the warning to fishermen if the water releases are changing rapidly,” Richards said. “I think the notification on the Fryingpan is what’s really critical here.”
Rick Lofaro, executive director of the Basalt-based Roaring Fork Conservancy, said his organization has already started getting the word out.
“There is an organization called the Roaring Fork Fishing Guide Alliance, and we are in lockstep with them,” Lofaro said. “We have already started to alert people to these increased flows, and the fishing community will be notified by the Roaring Fork Conservancy, along with the greater community.”
Bill Nein, of Salida, prepares to release a brown trout he caught back into the Fryingpan River. Anglers generally like flows to stay below 300 cfs for easy wading. CREDIT: HEATHER SACKETT/ASPEN JOURNALISM
As of Wednesday, Ruedi was about 65% full. Tim Miller, a hydrologist with the U.S. Bureau of Reclamation, noted that this year’s reservoir operations are pacing about 10 days ahead of 2002, which was another year where drought conditions increased releases and lowered water levels at the reservoir. When asked by a U.S. Forest Service representative about when the water level would become too low for the boat ramp to operate, Miller said exactly when is unclear but that it would happen in the next month.
Westwide SNOTEL basin-filled map May 31, 2026.
The Ruedi releases are aimed at alleviating the impacts of the worst snow-drought on record in the upper Colorado River basin, which are being felt on local waterways, as well as farther downstream. Pitkin County has issued a mandatory closure of the Roaring Fork River through the North Star Nature Preserve – a popular stretch for paddleboards and kayaks – because of unprecedented low flows. And Colorado Parks and Wildlife has issued voluntary fishing closures on portions of the Roaring Fork, Crystal and Colorado rivers due to low flows and high water temperatures.
The effects of drought are also being felt in the Grand Valley, one of the big agricultural hubs on the Western Slope with some of the most senior water rights on the Colorado River. The water from Ruedi will flow down to be used by irrigators in this area, who are currently about 500 cfs short of the water they need, according to Langenhuizen.
“This has been a tough year for a lot of people from the bottom of the basin all the way to the top, and a lot of people have been pitching in to help us get through and share resources,” he said. “Everybody’s kind of taking a hit this year.”
The River District’s Ruedi releases are part of its 2026 drought response plan. They are meant to cushion the blow of shortages in a pool of water in Green Mountain Reservoir known as the Historic Users Pool. HUP water is released mainly to satisfy farmers and ranchers in the Grand Valley, whose group of senior water rights — known as the Cameo call — are the commanding force on the river.
When Cameo places a call for its water, it can force junior users all the way up to the headwaters to shut off. The HUP also protects other water users, known as HUP beneficiaries, because without the releases from Green Mountain, Cameo would place more frequent calls, forcing these users to cut back.
However, this year, the HUP did not fill, causing repercussions up and down the river.
“This is really driven because we don’t have HUP coverage, which has an impact on a lot of users in the Colorado River basin, both municipal and irrigators,” Langenhuizen told Aspen Journalism in a separate interview. “We really tried to look at this as wholesale, like how can we help as many people in the Colorado River basin as possible?”
Depending on water demands, the 4,700 acre-feet from the Water Trust could be used by irrigators in the Grand Valley, or it could be used for hydropower generation in the Grand Valley and then flow into the 15-mile reach, a chronically water-short stretch of the Colorado River that is critical habitat for endangered fish.
Bicycling the Colorado National Monument, Grand Valley in the distance via Colorado.com
To bolster the Colorado River’s flow downvalley through historic drought, water authorities will be increasing the flow out of the Ruedi Reservoir through August. That water will flow into the Fryingpan River…Water will then flow into the Roaring Fork River, then down the Western Slope, where populations in Grand Valley are in “dire need,” he said…
Green Mountain Reservoir (back in the day) is owned by the U.S. Bureau of Reclamation and located in Summit County north of Silverthorne along the Blue River. Photo credit: Denver Water.
Traditionally, the Western Slope relies heavily on the Green Mountain Reservoir — about 17 miles south of Kremmling — to sustain a steady Colorado River flow. But due to the state’s dry, warm winter, that reservoir struggled to fill over the spring. The administrators of Green Mountain Reservoir found that low water levels and fast releases were exacerbating a slow-moving landslide on its banks, so they limited how much water could be released out of the reservoir to half a foot a day…
Tim Miller, a hydrologist with the U.S. Bureau of Reclamation that manages the levels at Ruedi Reservoir, said the reservoir played a similar supplemental role in 2002, when Colorado saw another historic drought. This year’s use of the reservoir is about 10 days ahead of then, he said.
On July 8, the Getches-Wilkinson Center visited the Kawuneeche Valley restoration site at Beaver Creek in Rocky Mountain National Park. Upon arriving at Beaver Creek, the team met with Isabel de Silva Shewell, the lead ecologist on the project with a background in riparian restoration, who gave us a tour of the restoration site.
The 30-acre area is located at the headwaters of the Colorado River, and is surrounded by an exclosure fence tall enough to prevent moose and elk from jumping over. While we were fortunate enough to meet with Isabel and receive a guided tour, members of the public are welcome to enter through the gates and see the restoration efforts firsthand.
The Kawuneeche Valley Restoration Project/Beaver Creek Site Description
The Kawuneeche Valley restoration project is an effort to restore the ecosystem impaired by human activity and the climate-driven stressors such as an unpredictable snowpack and overbrowsing by moose.
Nestled at the base of the Never Summer Mountains, Beaver Creek is one of four tributaries to the mainstem of the Colorado River included in the project’s restoration efforts. Since the 1950s, there has been a loss of 94% of surface waters associated with beaver ponds, and a 77% loss of tall willow acreage since 1999. As a result, the Kawuneeche Valley has transitioned from its historical beaver-willow wetland ecosystem with a high water table, that supported hydrophilic vegetation and was dominated by tall willow.
These changes have been driven by human diversion of water, the effects of climate change, and the loss of tall willow due to the influx of large populations of moose. The once-booming beaver population in the area declined with the loss of suitable habitat. Without beaver dams, the water saturation in the soil became insufficient to support a stable riparian buffer. Beaver Creek became loaded with sediment, and water quality declined. The site has been identified as a major contributor of sediment to the mainstem of the Colorado River.
The Impacts of Moose and Elk at Beaver Creek and Potential Solutions
In 1978-1979, moose were re-introduced into Rocky Mountain National Park on the west side. https://www.nps.gov/articles/moose-research-in-rocky-mountain-national-park.htm. Initially, only 24 moose were released and largely remained on the west side of the park. Id. Moose are typically solitary animals; however, warmer, shorter winters allowed moose to congregate and populations to boom. Id. Easier passage facilitated the movement of moose across the continental divide to the east side of the park. Id.
As of 2025, there were 240 moose estimated to be in the park. Id. Willows are a primary food source for moose. However, willows, whose stems only grow about six inches per year, do not regenerate quickly enough to support such a large moose population. Today, the site is marked by what Isabel referred to as “zombie willows,” or willows that have been chewed down by moose, leaving only the woody stems of the plants.
Evidence of the former beaver-willow ecosystem is found throughout the site. Depressions indicate where beaver dam surface waters had existed in previous decades; willows that had been chewed down to woody stubs have new growth, and wetland vegetation such as sedges dominate the area.
In addition to constructing beaver dam analogs, the park service is attempting to address moose populations. Exclosure fences have been successful in keeping moose and elk from entering the restoration site. However, this is only one component of long-term population management measures. Discussions of potential solutions include measures put in place in 2008 by the Elk and Vegetation Management Plan (EVMP). In addition to exclosure fences, these efforts also include the culling of individual moose. Hunting is not permitted in the park, and moose have no natural predators in the area to keep populations in check. Therefore, such measures may be necessary to restore balance to the ecosystem.
“Beaver Dam Analogues” or “Temporary Wood Grade Structures,” or TWGS, (pronounced like twigs), are designed to help back up water and create a lively wetland habitat that encourages healthy biodiversity not just for the cutthroat, but the entire ecosystem. They are being employed in what’s called “Process-Based Restoration.” These man-made structures are relatively easy and straightforward to make. They are built with natural resources such as wooden posts, willow branches, aspen branches, and rocks. Though they are simple to create, Remshardt said “we’re not as good at building them” as the beavers. Photo courtesy Rio Grande Headwaters Restoration Project
Beaver Dam Analogs
The main tool utilized to restore the site to a functioning beaver-willow wetland ecosystem are beaver analogs. Beaver analogs are wooden structures that span the creek in a manner that mimics beaver dams. They raise the water table upstream, increase channel complexity, promote resilience to high runoff in the snowpack, trap fine sediment, and store water across the floodplain. The analogs were built using lodgepoles from the surrounding area to mimic the natural ecosystem sourced from fuel-mitigation events in the park.
Restoration efforts are already yielding encouraging results. Groundwater quantity is continuously monitored at the site. Since the installation of the analogs in 2024; levels have slowly and steadily risen. Water quality at the site has improved, and benthic microorganisms highly sensitive to water quality have reappeared in the creek.
With the diminishment of willows over the years, invasive plant species such as the Canada Thistle flourished. Since the start of the project, Isbabel said there has been an evident decrease in Canada Thistle, leaving more room for willows to grow.
Takeaways and Further Information
Overall, the GWC would like to thank Isabel and all those at RMNP and the Kawuneeche Valley Restoration Project for this fantastic opportunity. The team greatly enjoyed seeing the site first-hand, looking at the impact of overbrowsing, and how the ecosystem has begun to heal. Being on the headwaters of the Colorado River was a reminder of all the components that go into maintaining a healthy, thriving river that can support the surrounding habitat and those downstream.
If would like to help out, please consider volunteering at a future event. Previous volunteer opportunities have included revegetation efforts such as willow staking. There is potential for volunteers to help build and maintain materials for dam infrastructure at events in the future. More information can be found here: https://www.nps.gov/romo/getinvolved/volunteer.htm
A pronghorn hangs out among Wyoming wind turbines. Better integration of the Western grid would allow California and Arizona to draw on Wyoming wind to back up solar when the sun goes down. Jonathan P. Thompson photo.
Countries around the globe are proving that cutting greenhouse gas emissions doesn’t have to come at the expense of vulnerable communities, workers, Indigenous peoples or ecosystems. A new United Nations Environment Programme report released Tuesday highlights a range of international laws and policies that are putting the once-aspirational idea of a “just transition” into practice.
In climate and energy policy, a just transition aims to shift economies away from fossil fuels while ensuring that the costs and benefits are shared fairly. That means creating alternative livelihoods for workers and communities dependent on fossil fuels, involving affected people in decision-making and creating new economic opportunities.
Although the term “just transition” often is swept into ideological debates about climate and energy policy, the underlying concept is simple. It’s like planning to replace an unsafe community bridge. Everyone agrees a new bridge is needed, but if people can’t afford the toll, or if the construction cuts off neighborhoods, the project may solve one logistical problem while creating several others. A just transition means designing the changes so the benefits outweigh the burdens, especially for the people most affected, by involving them in the process.
The report marks a shift from 10 years ago, when “just transition” was a broad principle embedded in the Paris Agreement. Drawing on legal and policy developments from around the world, the UNEP report emphasizes that integrating principles such as participation and transparency is key to accelerating the transition to a low-carbon economy and making it more sustainable.
Fairness is not an optional add-on; it’s crucial for the long-term success of transition policies, said Patricia Kameri-Mbote, director of UNEP’s law division, who reviewed the report for the international agency.
“The design and implementation of transition processes will determine whether there is a transition at all,” Kameri-Mbote said. “Just transition is a test of governance, legitimacy, and the rule of law.”
After studying just transition approaches in different countries, the authors wrote: “There is no one-size-fits-all model for just transition. It must be context-specific and grounded in national realities.”
In Poland, where coal has long been central to the economy, the government negotiated a long-term agreement with mining unions before closing mines. The plan included a gradual phaseout with retraining, economic assistance for towns and support for families to give communities years, not months, to adjust to the changes.
Colombia is granting Indigenous and Afro-Colombian communities a stake in renewable energy projects and the revenue they generate. Indonesia is helping former coal towns rebuild economies around tourism and local businesses. And Canada has backed financing that allows Indigenous communities to own stakes in clean-energy and infrastructure projects, rather than simply hosting them.
“Making just transition work in practice is complex, nuanced and context-specific,” Kameri-Mbote wrote via email. But the case studies analyzed in the report helped identify key elements of a resilient and just transition, including strong human rights and environmental laws, effective access to courts and “adequate and accountable financing,” she added.
A Fairer World
Ultimately, a just transition is about making the world fairer, said Rachel Cleetus, senior climate and energy policy director with the Union of Concerned Scientists. The report shows that what matters most is people’s everyday lives, affordable access to energy and protecting vulnerable populations from the devastating impacts of intensifying climate extremes.
Cleetus said the report doesn’t directly address the fossil fuel industry’s near-stranglehold over climate and energy policy. Policies to promote just transitions must, at some point, also break that power, she said. [ed. emphasis mine]
Nikki Reisch, climate and energy program director at the Center for International Environmental Law, said via email that the report’s focus on rule of law, rights and inclusion is critical, but added that “it’s also critical to name what we are transitioning away from – fossil fuels – and what justice looks like after centuries of harm.”
Last year’s International Court of Justice climate advisory opinion made clear that “States have a legal duty to prevent and remedy climate harm and protect human rights,” she said. “That’s not possible without leaving fossil fuels behind and holding polluters to account.”
Grounded in Law
The report traces the roots of the just transition concept to the U.S. labor movement in the 1970s as an emerging response to perceived threats of environmental regulation to jobs in certain industries. Unions began adopting transition resolutions, and in 1997, an international coalition of unions and environmental advocates founded the global Just Transition Alliance.
The idea entered climate discussions in the late 1990s, “when international trade union federations started using the term to describe potential job losses associated with a rapid move away from fossil fuels, while acknowledging the labor risks posed by climate change itself,” according to the report.
As the United Nations climate talks eyed binding emissions targets under the Kyoto Protocol in the late 1990s, climate change was controversial in the international labor movement. British, German and Spanish unions supported binding greenhouse gas cuts, while many North American unions, including the United Mineworkers of America, lobbied against them.
At the COP30 climate summit in Brazil in 2025, the 198 countries in the United Nations Framework Convention on Climate Change agreed to shift from planning to implementation.
They confirmed that transition pathways are nationally determined, must align with the goal of the Paris Agreement to limit global warming and should be implemented through each country’s climate plan.
The new report “rightly argues that justice must be built into both the process and the outcomes of the transition,” said Chukwumerije Okereke, professor of global governance and public policy at the University of Bristol, United Kingdom.
“People are talking about a ‘just transition’ because experience has shown that climate policies succeed only when they are perceived as fair,” he said. “If workers lose jobs, communities bear disproportionate costs, or developing countries are expected to decarbonize without the resources to do so, political resistance grows.”
For many developing countries, justice also means “preserving the policy space to pursue economic development while tackling climate change,” he said. The next phase of global debates about just transitions will extend beyond protecting workers to making sure countries maintain economic independence so they can design transition plans best suited to their own circumstances, he said.
The new report tries to formulate a definition of just transition that goes beyond the traditional labor-centric or sectoral approach “by leveraging an environmental rule of law framework,” Kameri-Mbote said.
The growing urgency of the energy transition bolsters the need for strong environmental laws and institutions because governments can be tempted to focus on cutting emissions while overlooking who bears the costs, who benefits and who gets a say, she said. The report shows that environmental rule of law provides guardrails that can help ensure a rapid transition is fair and sustainable.
Directly writing just transition principles into law is a key step, including rights-based approaches aimed at preventing violations. And, the report says, affected people must have real influence early in the planning process. They also need a reliable legal system to challenge bad decisions or when governments or companies don’t follow the rules.
Environmental rule of law is the machinery that turns just transition from a good intention into something enforceable and implementable, Kameri-Mbote said.
L to R: Allen Best, Alan Salazar, Siri Roman, Pat Mulroy during the panel discussion “Liquid Courage” at the Museum of Nature & Science, July 21, 2026. Photo credit: Big Pivots
Click the link to read the article on the Big Pivots website (Allen Best):
July 27, 2026
“We know climate change is real. We know we’re living it, but no one expected it to move this quickly.”
As moderator at last week’s water forum held at the Denver Museum of Nature and Science, I posed the question to our three panelists about this hot and dry summer after last winter’s exceptional warmth and dearth of snow.
“From where you sit now, is this any different from what we’ve been through before?”
Pat Mulroy, a senior fellow at the University of Nevada, Las Vegas’ Boyd School of Law and the former longtime general manager of the Southern Nevada Water Authority, is an advocate for extensively rethinking how the Colorado River is managed. (Image: University of Nevada, Las Vegas’ Boyd School of Law)
Pat Mulroy was quick to answer. She calls herself a “recovering CEO.” For 23 years she oversaw the Southern Nevada Water Authority‘s operations in Las Vegas and its suburbs. Early in her watch, the population of Clark County, where Las Vegas is located, exceeded the population of Manhattan. It now has a population of 2.5 million people.
The metro area there gets 90% of its water from the Colorado River via tunnels into three levels of Lake Mead. The newest — one she championed, despite a cost of $1 billion — comes up from underneath the reservoir. Even when Hoover Dam backs up too little water to be released downstream, Las Vegas will have access to water.
“I always love coming to Denver, now that I no longer come to Denver as the protagonist from the evil lower basin,” she said.
Footnote here: Many who had never heard Mulroy speak before were astonished at her liveliness.
“This summer is different only because the cumulative effect of all the summers that went before has come home to roost,” she continued.
“All the cushion we have (had) is gone. I mean, it’s one thing to have 2002 when you had a bad winter and Lake Powell started going down rapidly, but Lake Mead still had (water to an elevation of) over 1,200 feet. We’re now seeing the very real possibility that Lake Mead is going to go to 900 feet by next year. That would be 10 feet above deadpool.”
Deadpool is the water level that is so low that water can no longer be released from a dam. The level at which electricity can no longer be produced is higher.
Mulroy went on to say that while the Metropolitan Water District of Southern California is taking steps to “replenish” Mead — by taking less water than allotted — the problem continues to worsen. That indicates the depth of this problem.
“It’s never ending, and the rate of change is so much faster than any of us expected,” added Mulroy. ” We know climate change is real. We know we’re living it, but no one expected it to move this quickly.”
Siri Roman via her Facebook page.
Siri Roman was next. She manages the Vail-based Eagle River Water and Sanitation District. “I think that 2002 changed water in Colorado, and 2026 is going to change it completely again. A lot of our planning and assumptions are being challenged this year,” she said.
“I mean, it was 80 degrees for two weeks in March. Watching our very little snowpack — the lowest snowpack we had on record — nearly melt out in March was quite alarming to us.”
Eagle River Water and Sanitation District has several small reservoirs. Among them is the reservoir at Vail Pass, another near Camp Hale, and a third near Minturn.
“They weren’t able to fill because the stream flows were so low. There are a lot of things we rely on that we’re not going to be able to rely on moving forward. How do we get creative, looking at demand and other solutions about how to prepare for a drier year?” Roman continued.
“Statistically, they always say you won’t get two years like this in a row. I don’t think we can say that anymore. We can’t rely on the statistics because we’re seeing such abnormal patterns.” [ed. emphasis mine]
Denver Board of Water Commissioners/Courtesy photo.
Alan Salazar, the third panelist, is CEO of Denver Water. The water agency delivers water to about 25% of the 6 million Coloradans. “We use just 2% of the state’s water, and that has been pretty steady going back through the 1970s. That didn’t happen by accident, because we took measures. My predecessor and Denver water employees in the last 20 years use water more efficiently and with conservation in mind.”
Salazar had high-level positions as policy advisor to several elected officials, mostly in Colorado. One of them was the former U.S. Sen. Mark Udall, an advocate of protecting natural resources and an early advocate of public awareness around climate change. He recalled what his boss had told him: “Alan, no matter how many laws we pass, no matter how many regulations we implement, Mother Nature bats last. And boy, is she batting.”
As compared to 2002, he said, this year is more extreme. “We had a heat dome that made the spring more difficult, and it’s partly why the response from our customers has lagged, because even though there are water restrictions, the extremes in temperatures have put greater pressure on water use. So, it’s quite a bit different.”
These remarks were delivered early in the 90-minute sessions devoted to water and urban uses in Colorado and somewhat beyond.
The museum’s Institute for Science and Policy will hold another session on Aug. 27 in its two-part Liquid Courage series. This next session will have four panelists:
Robert Sakata, a farmer from Brighton and now a senior adviser at the Colorado Department of Agriculture;
Anne Castle, a former Interior Department undersecretary for water in the Obama administration now affiliated with the Getches-Wilkinson Center at the University of Colorado Law School;
Nathan Coombs, a San Luis Valley farmer and a member of the Colorado Water Conservation Board; and
Sarah Jones, co-founder of Rye Resurgence and co-owner of Jones Farm Organics near Hooper, in the San Luis Valley.
A utility-scale solar facility on BLM land outside Boulder City, Nevada. The proposed Townsite Solar 2 data center would be located near here. Jonathan P. Thompson photo.
First they came for your electricity, then they came for your water, then they came for your brains, and now the AI data centers are coming for your public lands.
Okay, that’s a bit dramatic, but it is true, at least in one case. This summer, the Bureau of Land Management quietly approved a Texas natural gas and power market-focused hedge fund’s proposal to build a large data center on public land outside Boulder City, Nevada. The agency did not seek public input on the decision, nor did it subject the project to an environmental review, drawing pushback and criticism from Boulder City residents and officials as well as state and federal lawmakers.
This is the only known incidence of the BLM approving a data center on public land. But it may not be for long. Cities, towns, and counties are growing increasingly wary of the facilities, imposing stricter regulations and even outright bans that could push developers to seek cheaper, friendlier places to build. Under the Trump administration, which is looking to win the AI “war,” federal lands may be the cheapest and most regulation-free place to put a server farm. Both the Biden and Trump administrations invited data center developers to look to Department of Energy lands, but there hasn’t been an open call to do the same with BLM lands.
The Boulder City saga started years ago, when Skylar Energy Resources, a subsidiary of Skylar Capital Management, proposed the 19-megawatt Townsite Solar 2 facility on 76 acres of BLM land four miles southwest of Boulder City, the town created in the 1920s to house Hoover Dam construction workers. The project would have been adjacent to the existing Townsite solar facility, which was developed by Skylar but is now owned by Arevon Energy. In 2023 the BLM approved the project, though construction has yet to begin.
Late last year, Skylar — operating as Townsite Solar 2 (TS2) — proposed a 170 MW, “high-density,” AI data center campus on 88.5 acres of land owned by Boulder City that is also near the existing solar facilities. TS2 had previously planned to build a solar-plus-battery-storage installation on this parcel. That proposal was met with strong opposition from Boulder City residents, who worried about the facility’s outsized energy use and its potential water consumption. Following the backlash, developers said they would use a hybrid closed-loop “ultra-low or zero liquid discharge” cooling system, which would use treated effluent rather than potable water (also increasing energy consumption). The lease would generate approximately $1.47 million annually for the city, plus property taxes and permit fees.
At the same time that it applied to the city, however, Skylar also went to the BLM, requesting an amendment to its solar facility right-of-way so that it could build a data center on the public land, instead. In June the BLM granted its approval, sans environmental review or public input, and withdrew its application for the city-owned property.
I’ve written here frequently about the Big Data Center Buildup, as tech firms build bigger and bigger — and more and more water- and energy-intensive — server farms in Phoenix, Tucson, southeastern New Mexico, on the shores of the Great Salt Lake, outside Cheyenne, and even in Page, Arizona, and Alaska. Perhaps inevitably, the Big Buildup is now confronting an even bigger backlash.
People from across the political and demographic spectrum are rising up and opposing these facilities for a variety of reasons. All data centers use a lot of energy, with the newer “hyperscale” facilities gobbling up even more power. Some are purchasing solar, wind, or geothermal energy to power the facilities, but even many of the greenest-leaning ones rely on dirty natural gas generators for backup. Meanwhile, the natural gas and coal industries are licking their chops at the prospect of rising demand for fossil fuel-generated power, since renewables alone can’t keep up with the skyrocketing rise in demand. Also, data centers can exacerbate urban heat islands, which sucks if you happen to live next door to one.
Data centers also use quite a bit of water, but the amount varies depending on what type of cooling system is used. Closed-loop systems need to be filled up only occasionally, and are less water-intensive, while evaporative systems use far more water. The catch is that using less water for cooling often means using more energy for the same; if the energy comes from a thermal plant fired by gas or coal, power-generation can also use a lot of water. Still, the volumes pale compared to some other uses, most notably agriculture.
When a region suffers through a hot and dry winter a quarter century into the worst megadrought to hit the area in 1,200 years, many of us will intuitively link it to climate change and global warming. But intuition is not science, and there may be other plausible explanations.
Most of the West has just experienced the warmest nine-month period during the last 131 years, putting the region on pace to have its hottest water year on record.
But now the science has spoken — in the form of a peer-reviewed paper* out of the Colorado School of Mines — and it has determined that this year’s snow drought was almost certainly the result of human-caused climate change.
The authors used a probabilistic approach to assessing climate change’s role in the West’s 2026 snow drought. And they found that across the West as a whole, the 2026 snow drought was about four times more likely to occur in the current climate than during the 1850-1900 comparison period. In the Upper Colorado River Basin, where the drought was most severe, this year’s dire conditions were about 14 times more likely in our current climate than in pre-industrial times, “with the uncertainty range reaching into conditions so extreme that probabilities are difficult to estimate with confidence.”
This isn’t just confirmation of what may seem obvious to long-time observers. More critically, it indicates that this year’s lack of snow is no longer just a once in a century event, and that if the climate continues to heat up, these dry spells may become more common.
*A.M. Marshall,M. Cowherd,S. Rahimi, & Y. Ye, The 2026 western US snow drought was about four times more likely due to climate change, Proc. Natl. Acad. Sci. U.S.A. 123 (30) e2612961123, https://doi.org/10.1073/pnas.2612961123 (2026).
🛢️ Hydrocarbon Hoedown 📈
The Navajo Methane Coalition has released an animated video explaining how methane emissions from oil and gas facilities can harm Diné communities, and detailing ways to tackle the problem. It’s an especially important issue now, as the Trump administration rolls back methane waste prevention rules. Check it out:
⛈️ Wacky Weather Watch⚡️
The monsoon is here and it is causing some serious mayhem in some places, especially in western New Mexico and in Arizona.
The Gallup area received at least two inches of rain in one day, causing the Rio Puerco to go from dry to raging river in a matter of hours. And it wasn’t just the Puerco. Several Gallup streets, including Route 66, turned into virtual rivers that were more than tire-deep in some places, causing hazards for motorists. Zuni Pueblo was also was inundated with water.
The Rio Puerco does not seem to have a working streamflow gage, so I checked out the Little Colorado River near Winslow, downstream from its confluence with the Puerco, and it got really, really big.
📸 Parting Shots 🎞️
The beauty of the monsoon sky. Jonathan P. Thompson photo.
The beauty of the monsoon sky. Jonathan P. Thompson photo.
This U.S. Drought Monitor (USDM) week saw very hot and dry conditions across areas of the Western U.S. and the Plains states where average temperatures soared well above normal levels—significantly elevating evaporate demand, especially across the Upper Midwest, Northern Plains, Colorado, and the Texas Panhandle where conditions deteriorated rapidly. Elsewhere, heavy rains across areas of the Mid-Atlantic states, Southeast, and the South, led to widespread improvements on the map in drought-affected areas. In North Carolina, rainfall totals for the week ranged from 3 to 8+ inches across the state leading to a significant improvement in drought-related conditions statewide. In the Northeast, recent isolated shower activity helped to improve drought conditions; however, the impacts of the longer-term drought continue to affect groundwater conditions in areas of Rhode Island and Massachusetts. In the Upper Midwest, drought expanded and intensified on the map, especially across Minnesota and Wisconsin where composite flash drought indicators were showing severe to extreme flash drought conditions during the past week. Out West, the Four Corners states continued to receive beneficial monsoonal rainfall with isolated areas receiving 2 to 4 inches. In portions of Arizona and western New Mexico, precipitation during the past 30-day period has been above normal, boosting streamflow and soil moisture levels while improving vegetation health. In the Pacific Northwest, short-term dryness has led to a dip in soil moisture and streamflow levels in areas of western Oregon and Washington. In the Great Basin, recent monsoonal rains have provided some minor relief to drought-affected areas of eastern Nevada.
In terms of reservoir storage in the West, California’s reservoirs continue to be at or above historical averages for the date (July 28), with the state’s two largest reservoirs, Lake Shasta and Lake Oroville seeing slight decreases over the past week, at 99% and 108% of average, respectively. In the Southwest, the U.S. Bureau of Reclamation is reporting (July 26) Lake Powell at 23% full (33% of average for the date; lowest on record for the date in the last 30 years), Lake Mead at 27% full (45% of average for the date; lowest on record for the date in the last 30 years), and the total Colorado River system (July 26) at 33% of capacity (compared to 39% of capacity the same time last year). [ed. emphasis mine] According to the Salt River Project, the Salt River reservoir system in Arizona is currently 48% full, Verde River system 59% full, and the total reservoir system at 50% full (compared with 59% full a year ago)…
For the week, drought-related conditions deteriorated across the region including in the Dakotas, Nebraska, and Kansas where temperatures were well above normal, especially in western portions of the region where anomalies ranged from 3 to 9 °F above normal. NDMC’s flash drought composite map (July 27) also showed flash drought conditions developing with numerous drought impact reports coming into the NDMC’s Condition Monitoring Observer Report (CMOR) reporting system during the past 7-day period—especially in the Dakotas in relation to crop and rangeland conditions. Looking at climatological rankings for the past 30-day period, numerous locations ranked among their warmest or near warmest mean temperatures on record, including: Rapid City NWS Weather Forecast Office, SD (warmest on record; +8 °F departure); Custer, SD (3rd warmest; +6 °F departure); Bismarck, ND (5th warmest; +5 °F departure); and Fargo, ND (3rd warmest; +5 °F departure)…
Colorado Drought Monitor one week map ending July 28, 2026.
On the map, drought-related conditions deteriorated in areas of eastern Colorado, eastern New Mexico, southeastern California, and western Washington. Conversely, beneficial monsoonal rainfall led to improvements across Arizona, northwestern New Mexico, southeastern Utah, and northeastern Nevada. In the Southwest, an active monsoonal pattern (June 15 to present) has led to above-normal precipitation, especially in Arizona where percentages of normal have ranged from 150% to 250% above normal across southeastern, central, and northern portions of the state. According to the NWS Forecast Office in Tucson, AZ monsoon statistics, the following Arizona locations have received above-normal rainfall for the monsoon season: Nogales, Sierra Vista, Wilcox, Ajo, Globe, Apache Junction, Flagstaff, Kingman, Page, Prescott, Show Low, and Winslow. In Colorado, drought expanded and intensified on the map in response to anomalously warm temperatures, decreased soil moisture levels, and elevated evaporative demand. Looking at climatological rankings for the past 30-day period, numerous locations ranked among their warmest or near warmest mean temperatures on record, including: Montrose, CO (warmest on record; +3 °F departure); Dinosaur, CO (warmest on record; +4 °F departure); Grand Junction, CO (2nd warmest; +4 °F departure); Trinidad, CO (2nd warmest; +4 °F departure); Denver, CO (2nd warmest; +3 °F departure); Rock Springs, WY (3rd warmest; +4 °F departure); Casper, WY (3rd warmest; +5 °F departure); Salt Lake City, UT (5th warmest; +4 °F departure); and Pocatello, ID (5th warmest; +4 °F departure)…
On this week’s map, widespread improvements were made in drought-affected areas of Tennessee where rainfall has been well above normal during the past 30-to-60-day period across much of the state. In southern Texas, areas of drought expanded where hot and dry conditions have prevailed during the past 30 days. In the Texas Panhandle, short and longer-term dryness led to intensification of drought with year-to-date precipitation deficits ranging from 3 to 8+ inches. Looking at the reservoir situation, Water Data for Texas (July 29) reports statewide reservoirs at 78% full, with eastern reservoirs in good condition while numerous western, northern (Panhandle), and southern reservoirs remain below normal. Looking at climatological rankings for the past 30-days, record to near-record mean temperatures were observed in areas of the region, including in Brownville, TX (2nd warmest on record; +2 °F departure), Amarillo, TX (8th warmest; +3 °F departure), Gulfport, MS (4th warmest; +2 °F departure) and Jackson, MS (5th warmest; +2 °F departure). Average temperatures for the week were above normal across most of the region (1 to 10+ °F) with the greatest anomalies observed in the panhandles of Oklahoma and Texas…
Looking Ahead
The NWS Weather Prediction Center’s 5-Day Quantitative Precipitation Forecast calls for the heavy precipitation accumulations across portions of the Gulf Coast from southeastern Louisiana to west-central Florida, where totals ranging from 3 to 5+ inches are expected. In other areas of the Southeast and Mid-Atlantic, lighter accumulations, generally ranging from 1 to 2+ inches, are expected. In the Northeast, Midwest, and eastern portions of the High Plains, precipitation accumulations generally ranging from 1 to 4+ inches are expected. In the Four Corners states, isolated monsoonal rainfall with accumulations ranging from 1 to 2 inches are forecast, while dry conditions are expected across most of the Intermountain West, Great Basin, and West Coast states.
The NWS 6-10-Day Temperature Outlook, valid August 3-7, 2026, favors above-normal temperatures across most of the contiguous United States, with the highest probabilities centered across California, the Great Basin, Desert Southwest, and portions of the central and southern Rockies. Above-normal temperatures are also favored across the Plains, Midwest, South, Southeast, and the Northeast. Near-normal temperatures are favored across portions of the Pacific Northwest and central Gulf Coast. Across Alaska, above-normal temperatures are favored, while near-normal temperatures are forecast for Southwest Alaska and the Aleutian Islands. Above-normal temperatures are favored across Hawaii.
The NWS 6-10-Day Precipitation Outlook favors above-normal precipitation across portions of the Southwest, western and southern Texas, southern Florida, Upper Midwest, and the Northeast. Below-normal precipitation is favored across portions of the Pacific Northwest, northern Rockies, northern Great Basin, and western portions of the Plains states. Elsewhere, near-normal conditions are expected. In the Hawaiian Islands, above-normal precipitation is favored.
US Drought Monitor one week map ending July 28, 2026.
When a devastating heat wave, hurricane, flood or wildfire strikes, people often want to know: How much did human-caused climate change influence this event, if at all?
For many years, scientists could answer that question only in general terms. They knew that human-caused climate change was increasing the frequency or intensity of some kinds of extreme weather, but determining its influence on a particular event was much more difficult.
Rapid attribution studies suggested that climate change made the heavy rainfall from Hurricane Helene’s remnants, which devastated mountain communities like Marshall, N.C., more likely than if the storm had occurred in a cooler climate. Jabin Botsford/The Washington Post via Getty Images
Weather events result from many interacting factors, including the day-to-day state of the atmosphere.
Scientists conducting extreme event attribution studies aren’t asking whether climate change caused a hurricane, heat wave or flood. Instead, they’re asking how climate change influenced that event: How would this event have differed in a world without increased greenhouse gases, and how have the chances of it occurring been altered by warming?
Researchers answer that question using two complementary approaches:
One compares how often that type of event, for example an extreme downpour that causes flooding, occurs in today’s climate with how often it would have occurred in a climate without human-caused climate change.
Both approaches combine weather and climate data, physical understanding of how the climate system works, and computer models. Scientists can compare results from multiple approaches to determine whether they point to the same conclusion and how much confidence to place in the results.
For example, studies of Hurricane Harvey, which dumped 50 inches of rain in parts of the Houston area in 2017 and caused widespread flooding, concluded that climate change increased the amount of rainfall the storm produced. Multiple studies using different approaches reached broadly consistent conclusions, illustrating how scientists conducting attribution studies can build confidence in the conclusions by drawing on several independent lines of evidence.
Scientists are more confident about some events than others
One of the report’s most important conclusions is that attribution science is not equally able to assess every kind of extreme weather.
Confidence is highest for events whose relationship to a warming climate is well understood and well represented in climate models.
Scientists have the highest confidence in extreme attribution for events with temperature extremes and the lowest confidence for convective storms, such as tornadoes. The bubble size is proportional to the number of extreme event attribution studies conducted. National Academy of Sciences
Extremeheat is the clearest example. As greenhouse gas concentrations have increased with the burning of fossil fuels, just about every region of the world has experienced more frequent and more intense heat extremes. Scientists understand how increasing greenhouse gases warm the atmosphere and make heat extremes more likely and more intense, making it possible to attribute many individual heat waves with high confidence.
The contribution of climate change remains more difficult to assess for other weather hazards. Severe thunderstorms, tornadoes, large hail and damaging straight-line winds depend on small-scale atmospheric processes that global climate models still struggle to represent accurately. Data for these events is also less complete, making it harder to detect long-term changes and evaluate climate models.
Some events are becoming increasingly complex. For instance, multiple events can occur simultaneously or in succession, leading to compounding or cascading effects, such as drought that worsens wildfire risk. Attribution science is just beginning to account for these interactions.
These challenges do not mean climate change has no influence on these events. Rather, they reflect a fundamental principle of science: confidence depends on the strength of the available evidence.
Understanding how climate change influences extreme events helps communities, businesses and governments better assess changing risks, improve planning and infrastructure, and make more informed decisions about preparedness and adaptation. Just as importantly, knowing where confidence is lower helps ensure that decisions remain grounded in the strength of the available scientific evidence.
Why attribution science is getting better
The science of extreme event attribution has progressed significantly since the National Academies’ last assessment of it in 2016.
Researchers now have access to longer and better observational records from weather stations, satellites and other monitoring systems. Climate models have become more sophisticated, better representing the physical processes that produce extreme weather, thus representing many types of extreme weather more realistically.
At the same time, the number of attribution studies analyzing climate change’s role in extreme events has grown considerably, covering more types of extreme weather and climate events than a decade ago. International research groups now apply established methods to conduct rapidattributionstudies, often within days of disasters, providing scientifically grounded information while events are fresh in the public mind.
Studies suggested that higher temperatures caused by anthropogenic climate change turned the 2020-2022 Western drought into an exceptional drought. In some areas, ranchers facing drying rangeland sold off cattle. Justin Sullivan/Getty Images
Scientists are also asking a new question: How did climate change affect the results of the event? For example, how did it affect the number of heat-related deaths, the extent of flooding, economic losses or ecological damage?
Hurricane Harvey again provides a useful example. The National Academies report highlights research showing that climate change increased Harvey’s rainfall by roughly 20% to 38%. Studies also found that the increase in rainfall attributed to climate change led to a proportionally even larger increase in the number of flooded properties, showing that relatively modest increases in the intensity of an extreme event can sometimes translate into much larger increases in societal impacts.
Extreme weather and climate change moving forward
As extreme weather affects communities around the world, attribution science is becoming an increasingly robust way to understand how climate change influences individual extreme weather events, providing information that can help communities prepare for and adapt to future risks.
Equally important, attribution studies identify where scientific confidence is high, where important uncertainties remain, and where additional research is needed. Together, these advances help ensure that scientific conclusions remain grounded in observations, physical understanding and careful analysis.
The Thomas E. Levy Groundwater Replenishment Facility, operated by the Coachella Valley Water District. Photo by Robert Marcos.
by Robert Marcos, photojournalist
The half-million residents of Southern California’s Coachella Valley have a lot to worry about. Toxic dust storms sweeping up from the Salton Sea. New concerns about the Coachella Canal, after the USGS reported that the canal crosses directly over the San Andreas Fault which is 150 years overdue for an major earthquake. The agency said the forecasted 7.8 – 8.3 magnitude quake could cause surface displacement of up to eight meters. 1
Residents also worry about the future viability of the Colorado River – which provides 430,000 acre feet of water that’s used to irrigate 76,000 acres of farmland, 120 golf courses, and to replenish the aquifer in an effort to prevent the serious subsidence issues like those that first appeared in 1948. And it’s this replenishing that’s causing new problems for the aquifer. 2
Colorado River water that’s diverted to the Coachella Valley is both highly-oxygenated and has a high pH, (meaning it’s alkaline). When raw Colorado River water is injected into the Coachella Valley’s aquifer, its oxygen chemically reacts with (naturally occurring) chromium-3 that’s bound up in the sediment. The oxygen oxidizes the chromium-3 and converts it into soluble, toxic, chromium-6. This chromium-6 has been measured at levels exceeding the state’s new limit of 10 parts per billion – at 33 of the Coachella Valley Water District’s 92 wells. 3
The worst contamination is found on the aquifer’s southeastern side, which not only contains high levels of chromium-6 but also arsenic, agricultural nitrates, and perchlorate runoff. When the aquifer on the Valley’s eastern side is replenished the river water’s alkalinity triggers a chemical reaction that releases (naturally occurring) arsenic from the sediment and then it disperses into the groundwater. 4
Tough new standards: The State of California’s tough new standards for chromium-6 is causing major headaches for the Valley’s five water districts. California had formerly limited chromium-6 contamination to 50 parts per billion in drinking water. Conforming to the state’s new limit of 10 parts per billion is going to be costly. The Coachella Valley Water District estimates that it will cost them $350 million dollars, with no funding provided by the State. Meanwhile the standards that were established by the EPA for arsenic, which are also 10 ppb, have remained unchanged since 2001. 5
Mitigation Efforts
The four water agencies that manage the Coachella Valley’s groundwater – the Coachella Valley Water District, Desert Water Agency, Indio Water Authority, and Coachella Water Authority, have submitted structural compliance plans to the State Water Resources Control Board. They plan to mitigate naturally occurring chromium-6 to meet California’s strict limit through a mix of infrastructure overhauls, advanced filtration, and operational adjustments. Because California’s mandate depends on the size of the water system, these agencies are working against a rolling compliance deadline spanning from October 2026 through October 2027. 6
Advanced Water Treatment Infrastructure
Ion-Exchange Technology: Agencies like the Indio Water Authority (IWA) are expanding the use of strong base anion exchange systems. These systems route groundwater through tanks filled with resin beads that magnetically trap and remove chromium-6 molecules.7
Reduction Coagulation Filtration (RCF): The IWA has also piloted RCF treatment, which chemically alters the chromium-6 into a harmless, filterable solid form before water enters the distribution grid. 8
Well Offline Management and Decommissioning
• Taking Impacted Wells Offline: The largest provider, Coachella Valley Water District (CVWD), has identified 34 out of its 96 drinking water wells that exceed the 10 ppb threshold. Impacted wells across the valley are being selectively pulled from service or restricted during off-peak seasons to prevent contaminated groundwater from mixing into municipal supplies. 9
Drilling New Deep-Water Wells
Bypassing the Contaminated Strata: Chromium-6 in the Indio Subbasin is entirely naturally occurring, leaching out of specific geological rock layers and sediment over centuries. Water districts plan to construct new, deeper wells that tap into lower layers of the aquifer where chromium-6 levels are safely below the state limit. 10
Well Clustering and Pipeline Blending
Dilution and Interconnection: Agencies are designing “well-clustering” projects. This technique involves building miles of new connecting pipelines to merge water from higher-chromium wells with water from pristine wells. Blending the water dilutes the total chromium-6 footprint down to legally compliant levels before it reaches household taps. 11
Click the link to read the article on the Big Pivots website (Allen Best):
July 26, 2026
Eads, a small town on Colorado’s windy eastern plains, has been shedding population for many decades. Defense Secretary Pete Hegseth isn’t helping any.
Federal law requires the developer of wind projects with turbines higher than 200 feet to submit plans to the Federal Aviation Administration for review. The FAA, in turn, refers those projects to the Department of Defense to assess whether they could affect military operations, radar systems, flight paths, or national security.
In August 2025, Hegseth’s department slowed those reviews. In April came reports that the laggard pace of reviews had stalled entirely.
In Colorado, this stall has impacted at least one project, the 500-megawatt Towner Wind Energy II (or West) Project. A twin project, the similar-sized Towner Wind Energy I (or East) project had already received clearance and is now under construction.
Colorado Attorney General Phil Weiser in July joined 17 other states and the District of Columbia in seeking to intervene in a lawsuit that contests what they call a freeze on reviews. They say the unresponsiveness of the Department of Defense is politically motivated and violates federal law.
“Since President Trump took office in 2025, his Administration has attempted to halt wind projects through presidential memoranda, secretarial orders, agency instruction, permit denials, sudden reversals of established policies and practices, unlawful settlements, and a host of other actions,” says the motion to intervene.
At least $2.687 billion in private investment and 7,124 jobs are at risk in Colorado, according to the court filing. Big Pivots was unable to identify other wind projects in Colorado that may be in limbo because of the federal freeze. Nationwide, according to American Clean Power Association, 150 wind projects have been affected.
With little irrigated land and virtually no oil and gas installations, Kiowa County has the lowest assessed valuation of Colorado’s 64 counties.
In Eads, at the Kiowa County courthouse, County Administrator Tina Adamson has been looking forward to when the two Towner wind projects go on the property tax rolls. The county has an assessed valuation of $39.4 million, lowest among all of Colorado’s 64 counties. Several mountain counties in Colorado also have relatively small assessed valuations. Mineral County (Creede) has $55.7 million, Hinsdale (Lake City) $58.1 million, and Jackson (Walden) $101.9 million.
Kiowa County, which is much larger in area, gets far less federal assistance called Payment in Lieu of Taxes, or PILT, compared to the mountain counties. The property tax is correspondingly far, far higher: a mill levy of 46.5 compared to 15 to 22 mills for the small mountain counties.
In short, Kiowa County needs tax base. The two big wind farms will help. Because of the federal freeze, according to Weiser’s court filing, only one is moving forward.
The county has a population of 1,446 as of 2020, almost exactly half of its population in 1950. It is bisected by Highway 287, which produces a steady stream of trucks at all hours of day and night. In Eads, the Love’s station produces a healthy — for a very small town — stream of revenue in sales taxes. Less frequently, travelers stop for a meal while visiting Sand Creek Massacre National Historic Site, 23 miles east of Eads.
Neighboring counties along the Kansas border benefit from the higher property taxes levied against oil and gas operations and lands with irrigated agriculture. Kiowa County has little or none of either. Most land is used for livestock grazing or growing wheat, milo or other crops that need little moisture.
“We have such a small population and a pretty large area, all ag,” Adamson said. “We have very, very little oil and gas.”
With such a small treasury, keeping employees is hard. Neighboring jurisdictions pay higher salaries. As for upgrades of any sort, they’re out of the question unless Adamson can secure a grant — and sometimes two or more — to help pay for the project.
Work on Towner East is already underway, the Kiowa County Independent reported in February. Adamson said pouring of concrete for footers began in July and installation of towers has now begun. That project is to have 115 turbines east of Eads. The original permit identified Vestas towers that are just above 600 feet. That compares with the 714 feet of the Republic Plaza, Denver’s tallest building.
Invenergy, the project developer. on its Towner Energy Center website projects that Towner East will yield more than $120 million in state and local tax revenues over the life of the project. After construction is completed, it is expected to yield roughly 15 full-time jobs. The project is now owned by Xcel Energy.
At the Kiowa County courthouse, Adamson said she expects far less annual revenue than the $1.25 to $1.5 million annual boost predicted by the developers. Based on evidence from other counties in eastern Colorado, she expects no more than $500,000 in new annual revenue. Even so, that amounts to a substantial boost for the county budget.
Towner West, the second project, is to have 148 towers. Weiser’s court filing says it has been frozen by the federal inaction. Invenergy, the developer, did not confirm that, saying only that “planning on Towner West continues” and that the company is “optimistic about its future.” Kiowa County expects that wind farm, if it is completed, to yield another $500,000 in property tax revenues.
Both wind projects are located along Xcel Energy’s 345-kV Colorado Power Pathway, a 550-mile transmission line intended to deliver renewable electricity to metropolitan Denver.
Xcel Energy’s 550-mile Colorado Power Pathway loops around eastern Colorado. The two Towner wind projects are north of the May Valley substation.
An irony of the federal freeze is that Kiowa County has been a strong supporter of Trump. In the 2024 election, for example, he got 744 votes compared to 101 for his Democratic opponent, Kamala Harris. The margins were similar in the 2020 and 2016 elections.
The New York Times, in a story published in May, pointed out Trump’s dislike of wind turbines. He has called them ugly and expensive. “My goal,” he said in January, “is to not let any windmill be built.”
On his first day in office, Trump issued an executive order halting all leasing of federal lands or waters for wind turbines.
Congress in 2011 had adopted a law that said before large wind farms begin construction, developers must apply for clearances from the Federal Aviation Administration, which regulates the national airspace. The FAA in turn refers the application to the Pentagon, which checks to see whether a project might interfere with military radar or nearby air bases.
The Times said that many wind projects in the past quickly received “no hazard” determinations, allowing them to move forward. Some projects do create issues, and they typically need to reach a mitigation agreement with the Pentagon. That might involve the company paying to upgrade nearby radar systems or modifying the layout of its turbines.
Colorado Gov. Jared Polis, in a June 8 letter to Dale Marks, the assistant secretary of defense for energy, installations and environment, said the clearinghouse method ordered by Congress in 2011 had worked out well. “Unfortunately, in Colorado and other states across the country, (Defense) is not advancing mitigation discussions, issuing draft agreements following completed negotiations or executing agreements already negotiated and signed by developers,” the letter said.
Taken together, he said, the defense department’s actions represent a “de facto nationwide moratorium on all land-based wind energy development — blocking projects critical to maintaining electric reliability, meeting rising energy demand, and lowering energy prices for consumers.”
Asked for comment, the Colorado Energy Office offered this: “The DOD freeze on wind projects hurts building clean energy generation that will drive up energy costs, increase customer energy bills, and impact reliability. Delaying wind projects risks missing out on federal clean energy tax credits and will directly increase costs to homeowners for electricity.”
In June, a coalition of renewable energy groups filed a lawsuit asking a federal court to order the Pentagon to quit doddering. Colorado, and the other states in July have asked to be part of that lawsuit.
In his filing, Weiser said that national security and production of electricity from wind can be successfully balanced. He called the freeze “simply another attempt to unlawfully interfere with the deployment of renewable energy.”
Some wind projects that have already completed mitigation negotiations awaited only final federal approval.
Weiser’s filing also asserts the federal inaction harms Colorado’s pursuit of energy goals. The state has a statutory requirement of reducing greenhouse gas emissions caused by producing electricity by 80% by 2030 compared to 2005 levels.
In the first three months of 2026, this year, wind was responsible for 35% of Colorado’s electricity. In 2025, according to the Energy Information Administration, it had been responsible for 30%.
Kiowa County may add property taxes from other renewable projects in coming years. Three solar projects have been proposed, one for 500 megawatts, a second for 580 megawatts, and the third for 1,025 megawatts.
Wind turbines, Weld County, 2015. Photo credit: Allen Best/The Mountain Town News
A plane drops fire retardant on the Hartman Hill Fire, which has since been contained, that was sparked by lightning near the border of Summit and Grand counties. As the monsoon season kicks into gear, wildfire officials say they are hopeful that it will bring moisture — but wary that it can also bring lightning. Grand County Sheriff’s Office/Courtesy photo
Colorado is in the middle of a historic drought after a record-low snowpack last winter. Much of Summit, Eagle, Pitkin, Grand, Garfield, Rio Blanco and Routt counties have been under exceptional drought — the highest level — for more than three months, according to the U.S. Drought Monitor. Even as the North American monsoon kicks into gear, bringing moisture and increased chances for precipitation over the coming days and weeks, public safety officials say the severity of the drought means the fire danger could linger for weeks, even if rain continues. But, if the rain stops, officials warn conditions could quickly dry out again.
“The rain is awesome, but don’t get complacent,” said Brad White, the fire chief of Grand Fire Protection District No. 1. “It’ll minimize the number of starts, but we’re still going to have starts. Once something starts up, then those dry fuels are just going to make it difficult to deal with, even with the moisture.”
Click the link to read the article on the Crested Butte News website (Katherine Nettles). Here’s an excerpt:
July 22, 2026
Given the severe drought throughout the past water year, Blue Mesa Reservoir and the dams below it that serve downstream users are all at precariously low levels this summer. This is impacting recreation, power generation and aquatic life. As reservoir levels fall dangerously close to “power pool” level at which point hydroelectric power becomes impossible, the Bureau of Reclamation (BOR) last week made some adjustments to try and prevent that. The hope is that the new flows will hold up Blue Mesa power production, and protect various other uses and aquatic biology through the end of the year…According to Andrew Limbach with BOR’s Western area office, the release schedule from the Crystal Dam below Blue Mesa changed over a period of three days from 1,465 cubic feet per second (cfs) on July 15 to 1,265 cfs by July 17. Gunnison River flows in the Black Canyon/Gunnison Gorge were scheduled to decrease from 360 cfs to 250 cfs over the course of those same three days. “In response to the extreme drought conditions, the BOR has collaborated with US Fish and Wildlife and the National Park Service to reduce the target flows to 500 cfs at Whitewater and 200 cfs through the Black Canyon of the Gunnison until further notice…
Jennifer Erickson, public affairs officer with the Department of the Interior, shared the latest information available regarding Blue Mesa elevation. “As of our last projections, Blue Mesa Reservoir is expected to fall to elevation 7,412 ft by the end of September. That number is from last month’s 24-Month study projections.” When full, the elevation is at 7,519 feet…
“To maintain safe and operational marina facilities, the NPS has moved the Elk Creek marina infrastructure to deeper water. Approximately half of the Lake Fork Marina has also been moved to deep water. Trailered watercraft can no longer use the Lake Fork boat ramp and will not be able to use the Elk Creek boat ramp when reservoir elevations reach 7435’. Hand-launching of non-trailered watercraft will remain available at both ramps.”
The NPS also advised that on Sunday, July 26remaining Lake Fork marina operations will no longer be operational at 4 p.m., and on Monday, July 27 all boats must be out of Lake Fork Marina slips by noon.
On Friday, July 31, the NPS projected that the Elk Creek boat ramp will no longer be safe for launching or retrieving trailered watercraft. “All trailered watercraft on Blue Mesa reservoir should be retrieved before this elevation is reached. The ramp will remain open for hand-launching,” according to the release.
So while Blue Mesa shouldn’t go to “deadpool” mud or canyon levels, it will be as low as it’s been in decades.
A few miles north of Mt. Sopris, down another dirt road that leads to the Roaring Fork River, Wenning stopped his car at a small brick building near the riverbank: The Roaring Fork Well House. Nearby are three wells that draw from the Roaring Fork River, providing another source of municipal water. After the call on the Crystal in 2018, Carbondale water managers decided to reduce the town’s reliance on Nettle Creek by leaning more heavily on the Roaring Fork River, where the town also has water rights. Carbondale currently has installed three wells — each of which produces roughly the same amount of water as the Nettle Creek plant (around 300 gallons per minute). But, the town has permits for seven more wells. Shifting Carbondale’s focus to the Roaring Fork River makes sense, said Wenning. Since the Roaring Fork is a bigger river, it’s less affected by a low-snow year. The wells are also 40 feet deep, allowing them to access groundwater…
The Roaring Fork Treatment Plant lies at the edge of the Carbondale Nature Park. Inside the barn-like building, a loud whirring sound echoes through the cavernous interior. The town recently installed new cartridge filter technology at the plant, expanding its capacity to treat water from 0.5 million gallons to 1.4 million gallons per day. According to Wenning, the town plans to expand the plant’s capacity further to treat up to 2.3 million gallons per day from the Roaring Fork River alone — more than enough to meet Carbondale’s peak summer demand, even when some of the water treatment equipment needs repair or servicing…
Beyond the shift to a more resilient water source, water experts see more opportunity to boost capacity through conservation. Maggie McHugh, an engineer with Roaring Fork Engineering, helps communities in the Roaring Fork Valley adapt to climate change.
“We can’t put any more water into the system, but we can take less out,” she said. “That will be the ultimate goal, especially in years like this.”
A constantly dripping faucet won’t only drive you crazy but it will freak Mother Nature out, too. Even a small faucet leak can waste up to three gallons of water each day. Photo credit: Delta Faucet
Despite recent rains, most of Colorado remains in deep drought and a governor’s task force has now put forward four recommendations to help deal with the problem. State climatologist Russ Schumacher said the monsoon rains were welcome, and certainly bringing some relief — increasing stream flows on the Western Slope and helping control widespread wildfires — but it’s unclear that the rain will continue in the fall or reduce the risk of another snow drought next winter…
The four recommendations
The first was to reduce onsite water consumption at all state facilities. This would require the state to develop water efficiency and drought plans, including water use audits, leak detection, landscape evaluations and other efficiency measures. It’s an expansion of Colorado’s “Greening Government” framework, which requires state facilities to proactively address water use.
The second is to direct state facilities to shift outdoor water management practices and reduce lawn watering and irrigation use. Kat Weismiller, section chief at the Colorado Conservation Water Board, said the goal was to “advance efficiency and conservation efforts on state facilities through long-term planning that can reduce onsite water consumption and build drought resilience.” It directs the state to evaluate outdoor water use at state facilities and make recommendations to reduce that water use or change landscaping.
The third recommendation directs the state to reduce washing state-owned vehicles. The goal is to reduce water waste by reducing the frequency of washing vehicles, while maintaining essential safety and health standards.
The fourth recommendation is to extend state tax deadlines for small businesses impacted by the drought. This temporary administrative waiver, which is similar to the wildfire tax relief already being offered in 2026, would apply to all eligible taxpayers, including agricultural producers and recreational businesses, which could apply for extensions.
Farmer Randy Friend grows corn in the Olathe area. He left the debris from last year’s crop on the ground as a form of mulch to try to retain moisture in this exceptionally dry year. CREDIT: HEATHER SACKETT/ASPEN JOURNALISM
Fourth-generation Olathe farmer Randy Friend stopped his pickup truck next to a row of corn whose green leaves were limp and curling, with a gray tinge. Friend’s corn was stressed as the valley endured a July heat wave with temperatures nudging close to 100 degrees.
“I hate to see it looking like that with our water situation,” Friend said.
Next was a field of onions, a thirsty crop with a long growing season. The furrows between the dark-green sprouts were still damp, an indication the field was just irrigated that morning.
“Onions are our most expensive crop to grow and the most reward on a good year,” Friend said. “But they can also bankrupt you because they take so much more water.”
Friend farms corn, onions and forage crops for livestock as part of the Uncompahgre Valley Water Users Association, a vast expanse of farmland that extends from just south of Montrose to Delta, on Colorado’s Western Slope. Water from the Gunnison and Uncompahgre rivers, along with miles of tunnels, canals and ditches, transforms about 76,000 acres of high desert into lush green fields of corn, pinto beans, onions and alfalfa.
But this year, Uncompahgre Valley farmers are making tough decisions and developing new tools as they try to adapt to one of the hottest, driest years on record in the Upper Colorado River basin. Many are leaving fields dry, culling their cattle herds, switching to crops that use less water and relying on crop insurance payouts as the association faces a 50% cut to its irrigation water supply.
“I’ve been farming 30 years now, and this is by far the most extreme, biggest cut of water that I’ve ever had to deal with,” Friend said.
Some producers in the Uncompahgre Valley Water Users association have left some fields unplanted due to drought. The association has only about half its normal water supply this year. CREDIT: HEATHER SACKETT/ASPEN JOURNALISM
The Uncompahgre water users get about half of their water supply from Taylor Park Reservoir, at the headwaters of the Gunnison River, via the Gunnison Tunnel, a six-mile-long aqueduct that can bring up to about 1,175 cubic feet per second to the valley. The other half comes from the Uncompahgre River, a much smaller river basin that saw an abysmal end-of-season snowpack with just 14% of median April 1. That means the association has only about half its normal water supply for irrigation season.
“We’re limping along right now, but it’s going to be a challenging year,” said association manager Steve Pope. “We got to get our producers through Labor Day; we’re going to need the water then. It’s just a physical supply issue; the water just wasn’t there.”
With its water cut by half, many producers in the Uncompahgre Valley have chosen to irrigate only some of their fields, leaving others unplanted for the season. The district’s northwest area, which is where much of the valley’s row crops are grown, has been the hardest hit. Pope estimates those farmers are fallowing between 30% and 60% of their ground. Driving around the district revealed many fields that were brown and dry.
“There’s just a tremendous amount of land out there that’s just barren, and there’s nothing you can do about it,” he said.
This field in the Uncompahgre Valley Water Users Association district has been fallowed this season due to a lack of water. The state of Colorado announced Wednesday that it will set up a conservation program using federal dollars, which means more fields on the Western Slope could soon look like this. CREDIT: HEATHER SACKETT/ASPEN JOURNALISM
Friend, an association board member, said he is fallowing about one-fourth of the land he farms and using about 30% to 40% of his acres to grow forage crops that use less water, such as sorghum-Sudangrass. But switching to drought-resistant plants is a strategy that doesn’t work for every grower. Friend also owns a feedlot so he can mix these drought-tolerant crops with higher-quality feed to make it work. Although some growers on the Western Slope are experimenting with alternative forage crops, such crops have yet to be grown on a large scale. Water-intensive alfalfa, with its high protein content, remains dominant.
Daris Jutten, a fifth-generation rancher in Ouray and Montrose counties, said the lack of water has prompted him to cut his herd back to the fewest cows he has ever had on his ranch. He has also left some of his alfalfa fields fallow.
West Drought Monitor map July 30, 2002.
West Drought Monitor map July 31, 2012.
West Drought Monitor July 31. 2018
West Drought Monitor map July 21, 2026.
“I’ve seen it bad before, but I’ve never seen it this bad,” Jutten said. “2002 was bad. 2018, 2012 were all bad. But they don’t even come close to what this thing is.”
The Uncompahgre River in Olathe was nearly dried up in July due to agricultural diversions and drought. The Uncompahgre Valley Water Users Association is the biggest agricultural water user in the Upper Colorado River Basin. CREDIT: HEATHER SACKETT/ASPEN JOURNALISM
Colorado’s new conservation program adds pressure to cut water use
This year’s lack of water and a management crisis have brought the Colorado River system to the brink of collapse.
As the nation’s two largest reservoirs, Lake Powell and Lake Mead, plummet to new lows, water managers are taking emergency steps to keep Lake Powell levels high enough to produce hydropower at Glen Canyon Dam. At the same time, federal officials are crafting a plan for how the seven states that share the Colorado River will share shortages and how the reservoirs will be operated for the next two years.
Upper Basin water managers have focused on the fact that their farmers and ranchers are affected first by a warming climate and are already experiencing shortages because the water simply isn’t there. The Upper Basin states (Colorado, New Mexico, Utah and Wyoming) suffer because there aren’t major reservoirs from which they can draw in dry years the way that the Lower Basin states (Arizona, California and Nevada) do. Both basins are increasingly expected to reduce consumption because supplies are shrinking and the Colorado River system as a whole must be managed within these new limits.
Onions are one of the water-intensive row crops grown in the Uncompahgre Valley. Farmers in the region are adapting to drought by fallowing fields and planting crops that use less water. CREDIT: HEATHER SACKETT/ASPEN JOURNALISM
On July 15, state officials announced the creation of a “near-term contribution program” that will pay water users to voluntarily cut back in 2027 and 2028, using $100 million in promised funding from the U.S. Bureau of Reclamation. The Upper Basin states have a goal of saving 100,000 acre-feet by the end of September 2028, which marks the end of water year 2028. The saved water will need to have a home in Upper Basin storage buckets — Lake Powell, Navajo, Blue Mesa or Flaming Gorge reservoirs — but precisely how it will be used and how it will fit into broader Colorado River management are still unknown.
The program has been a long time coming, and the concept is not new to Colorado. Officials said they are incorporating the lessons learned from previous demand-management studies beginning in 2019, stakeholder input and recent pilot programs.
As the biggest agricultural user in the Upper Basin, the Uncompahgre Valley — drought-stricken as it is — is ideally located for these types of programs and is considered one of the lowest-hanging fruits when it comes to finding places to save water.
When Colorado’s contribution program is implemented next year, the association will be ready. Knowing that a program was inevitable, Western Slope water managers have been proactive, developing a data-mapping tool that can help the association adapt to drought.
UVWUA Manager Steve Pope stands at the spot where water from the South Canal dumps water from the Gunnison River into the Uncompahgre River. It’s then diverted to the west side of the valley where it irrigates fields and row crops. CREDIT: HEATHER SACKETT/ASPEN JOURNALISM
Mapping tool helps plan conservation
With 550 miles of interconnected canals and laterals snaking through the valley, downstream irrigators often depend on reusing the water that runs off an upstream neighbor’s fields, and leaving a field dry could have unintended downstream consequences.
Developed by the Colorado River Water Conservation District and The Freshwater Trust, the tool can pinpoint where the greatest opportunities for water savings are, as well as how to avoid the worst consequences of fallowing ground. It can show what happens when efficiency improvements are made to the association’s century-old infrastructure and can show which ditches should be lined to provide the most bang for the buck to reduce seepage loss.
“From our perspective, it’s a great management tool because it allows us to track water through our system,” Pope said. “Let’s say there’s [a conservation] program, well, what would be the best farms to go to a deficit irrigation or fallow that would create the most (water savings), and you can target that.”
The tool is aimed at helping producers adapt to drought and can show which projects would result in the most water savings. Although the River District does not endorse a large-scale conservation program, it has long recognized that one was inevitable and has sought to mitigate the worst impacts to rural agricultural communities.
The intent of the tool is to help create a program that can maximize economic and environmental benefits as well as water conservation, said Raquel Flinker, director of interstate and regional water resources with the River District.
“It was always to provide data and analytics that would make whatever entity [is] creating a program design it in a way that seemed the most sensible,” Flinker said.
Some Uncompahgre Valley producers have participated in experimental programs that pay them to cut their water use, including the federally funded System Conservation Pilot Program, which took place in 2023 and 2024. Friend and a few others in the association enrolled in 2024 and were paid to reduce their water use. The association’s board has allowed their members to participate in conservation programs, but they remain somewhat controversial. An irrigation district in the Western Slope’s other big agricultural area, the Grand Valley, does not allow its members to participate.
Pope said instead of programs that pay farmers not to irrigate, he would rather see federal money pay for more efficiency upgrades to water-delivery systems such as lining ditches and improving headgates. The recently announced state program is meant to include a broad range of water-saving actions, but pilot conservation programs in the Upper Basin have always defaulted to paying irrigators to temporarily stop using water.
“The problem I see with it is if somebody enrolls and they sign off the year before, and then we don’t get any water and they are 50% fallowed anyway, did the program really generate any water?” Pope said. “It’s very difficult to measure the benefits of these types of programs when you have such an unreliable supply to begin with.”
Pope brings up an inherent contradiction about Upper Basin conservation: How can agricultural water users cut back when they already don’t have enough in drought years like this?
Despite the 100,000-acre-foot goal for the Upper Basin, Colorado leaders have long said they can’t commit to saving a specific amount of water. They said that figure can be reached only if sufficient federal funding is available and hydrologic conditions allow. And for now, the program remains short-term, while the effects of a warmer and drier climate appear likely to continue for the long-term.
“If this is the new normal, it’s going to get way more difficult,” Friend said. “If we have another winter like this last one, a lot of people are pretty worried about it.”
REMINDER: There’s just [2 days] left to comment on the Trump administration’s proposal to rescind ban on new oil and gas leases and mining claims within a 10-mile radius of Chaco Culture National Historical Park. The BLM is accepting public comment until July 29 on three alternatives: 1. keeping the ban in place; 2. shrinking the 10-mile buffer zone to just five miles; 3. eliminating the ban altogether. To comment, click on this link and then click on the “Participate Now” button at the top of the page.
🐓 Regulatory Capture Chronicles 🦊
Wall at the Twin Angel site, a Chacoan outlier that lies along the Great North Road. Note the oil and gas facility in the background. Jonathan P. Thompson photo.
President Donald Trump’s proclamations virtually eliminating Grand Staircase-Escalante and Bears Ears national monuments this month listed several arguments purportedly justifying the shrinkage. One of those was that national monument protections aren’t necessary, because the land and antiquities in question are already protected by various federal laws. The same argument is used to justify revoking the mining-claim and mineral-leasing ban around Chaco Culture National Historical Park.
There is some truth in this: There is a suite of federal laws, from the Federal Land Policy and Management Act to the Endangered Species Act, that are intended to protect environmental and cultural resources on all federal land, whether it’s in a national monument or not. But those laws aren’t always adequate, and now the administration is actually working to weaken Section 106 of the National Historic Preservation Act, which would be key to protecting the cultural sites in the former national monuments and the Chaco “buffer zone.”
When a mining or drilling company proposes a project on a mining claim or mineral lease on public land, the National Historic Preservation Act requires the jurisdictional agency to determine whether the proposed development might affect historic properties. If so, it triggers Section 106 of the law, which requires the agency to consult with tribal nations or other potential stakeholders, to identify potentially affected properties, and to work to avoid, minimize, or mitigate adverse effects on those properties.
Section 106, commonly referred to as “identify and avoid,” requires oil companies or other developers to conduct a cultural inventory of all land in the path of development. If the surveyors happen upon a “significant” site, the well pad, road, or pipeline must be relocated. This can prevent direct impacts to larger sites; you’re not likely to see a Chacoan great house bulldozed for a well pad, for example. But archaeological surveys can miss more subtle cultural features such as stone shrines, Chacoan “road” segments, or ancient cornfields. And the agencies aren’t likely to let a cultural landscape get in the way of the drill rigs or their “multiple use” mandate. Section 106 has not prevented gasfield roads from cutting across Chaco’s Great North Road in several places, nor has it kept several oil and gas wells from being drilled within a half mile of Pierre’s Site, a Chaco outlier within the 10-mile buffer zone.
Ruth Van Dyke, a professor of anthropology at Binghamton University cataloged the impacts of oil and gas development on the sound- and view-scapes at Pierre’s. “I found that, despite the due diligence agencies have exercised to protect the ground footprint of Pierre’s, there have been significant impacts,” she wrote. Twelve pumpjacks are visible from the Acropolis, and it’s likely that . When I visited a few years back, the whir-pop-pop-whir of the machines was irritatingly audible, affirming Van Dyke’s observation: “Rather than a sacred landscape and part of a UNESCO World Heritage Site, the Pierre’s community had the feeling of an industrial park.” (While many people have pointed out that there’s scant recoverable oil within the buffer zone, there is plenty of natural gas, which could be targeted if and when commodity prices increase).
Given the inadequacies of Section 106 now, it has stunned historic preservation advocates to learn that the Trump administration’s Advisory Council on Historic Preservation is proposing to weaken the law even further by giving the agencies more power, while taking input away from the public and other stakeholders, including tribal nations.
That last clause is especially important when it comes to the lands cut out of the two Utah national monuments and the Chaco “buffer zone,” if it were to be rescinded as the administration proposes. We have seen that this for this administration, the quixotic quest for “energy dominance” outweighs nearly every other consideration, at least when it comes to public lands. That means that if the changes to Section 106 go through, we can no longer rely on that law to even partially protect the vast, numerous, and cultural sites and landscapes within Bears Ears, Grand Staircase-Escalante National Monument, and the Greater Chacoan Landscape. It makes the mineral withdrawals more important than ever.
Several years back, when writing about the Greater Chacoan Landscape, I spoke with Theresa Pasqual, former director of Acoma Pueblo’s Historic Preservation Office, about Chaco, the landscape, and how federal laws weren’t enough. I’ll leave you with a sagacious quote from her:
⛈️ Wacky Weather Watch⚡️
It’s feeling downright apocalyptic lately. We’ve had crippling drought, hellish temperatures, locust plagues, cataclysmic fires,pestilence, and all that was just prelude to an especially sporadic and violent monsoon, so far, which helped some firefighting efforts, but also unleashed flash flooding in Arizona, Utah, and Colorado.
The most severe flooding generally occurred on burn scars left by this season’s wildfires, but the intensity of the downpours also wreaked havoc in unburned areas, including Telluride and, most tragically, outside Bicknell, Utah, where a family of five was killed by a flash flood.
Here’s a rundown of some of the most notable flooding:
In Telluride, a downpour kicked off flash floods and debris flows that shut down the Tomboy Road (it remained closed as of Monday morning), temporarily closed Hwy 145, and inundated the Telluride Middle/High School, where three to four feet of mud and water blasted and oozed into the Palm Theatre.
The Cottonwood Fire burned through more than 97,000 acres in southwestern Utah before being mostly contained. Over the past several days, it has been the recipient of heavy rainfall, which have turned area streams, including the Beaver River, into raging, slate-gray-colored, debris-clogged torrents. The flooding closed down I-15 for a period of time, and forced the evacuation of parts of Beaver City. I should make some crack here about semiaquatic rodents that build dams, but I will refrain.
A cloudburst let loose on a year-old burn scar near the Black Canyon of the Gunnison National Park, spurring major debris flows that covered roads with rocky detritus and forced the evacuation of about 20 people from a campground.
I-70 in western Colorado was shut down when water and mud washed onto the highway between New Castle and, appropriately, Silt, on Monday evening.
Flash flooding in the Prescott Valley in central Arizona was big enough to turn at least one large shipping container into, well, a ship floating down the road. The Prescott area remained under a flood watch on Tuesday and Tuesday night, while the Phoenix area was facing an extreme heat watch later this week.
Any amount of moisture is welcome on the drought-desiccated earth, but if the videos of raging rivers in what usually are nearly dry arroyos give you the idea that the water woes are alleviated, think again. So far these cloudbursts are just that: Short, intense, and isolated bursts of precipitation that get arroyos and debris flows running, but only cause quick spikes in nearby river streamflows. Yes, that’s better than nothing, but no, it’s not going to halt Lake Powell’s precipitous decline.
All of those Telluride-area storms, for example, only pushed the San Miguel River near Placerville to about 160 cubic feet per second for a few hours. That’s about double what it had been running at, but just over half of the median flow for this time of year.
We’re also seeing a lot of precipitation inequality. While Telluride and the surrounding mountains were hammered, locales to the southwest of there remained relatively dry. The Dolores River gage at Slick Rock (downstream from the burn area) remained at a steady and unblinking zero cfs, although just a little ways downstream the gage at Bedrock registered 100 cfs, which is pretty good for the Lower Dolores in July.
Still, this does appear to be only the beginning of the monsoon. If the past is any indication, then the storms are likely to become more frequent and more widespread, and hopefully a little less intense, in the coming weeks.
Meanwhile, in the Northwest, lightning has sparked dozens of blazes that are growing together into massive complexes. The Hay Creek Complex in Gilliam, Wasco, and Sherman counties in Oregon is up to 92,000 acres and the Rowe Creek Complex to the south of there is at about 143,000 acres with 0% containment as of Monday night. Further east, the Powder River Fire in Baker County near the Idaho border was up to 20,500 acres.
Razorback sucker. Credit: The Land Desk
🦫 Wildlife Watch 🦅
The Trump administration’s U.S. Fish and Wildlife Service last week quietly downgraded Environmental Species Protections for the razorback sucker, a fish native only to the Colorado River Basin, from endangered to threatened.
“This remarkable fish is very abundant in the river channels of the Colorado Basin,” wrote David Starr Jordan in his 1889 report on the fish of Colorado and Utah. “It reaches a weight of 8 to 10 pounds and is largely used for food.” The razorback sucker, or Xyrauchen cypho, once thrived in the mid- and lower-elevation portions of the Colorado River and its tributaries. But human activities such as dumping mine waste into streams, irrigation diversions, dams, and stocking of non-native fish that prey on the sucker’s eggs and young diminished the population of razorback sucker and other native fish.
So in 1991, the USFWS listed the fish as endangered under the ESA, bringing it extra protections and resources toward its recovery. A propagation and stocking effort helped bring the population back, and fish stocked in the Colorado and Green Rivers have been found to be reproducing, according to Colorado River Endangered Fish Recovery Program. As a result, the USFWS determined that the species is “not currently in danger of extinction throughout all or a significant portion of its range,” and in 2021 proposed “downlisting” it to “threatened” status. That action was finalized last week.
Advocates understandably question the timing of the move. One of the main threats to the sucker is low streamflows, and we’re seeing some of the lowest streamflows on record throughout the Colorado River Basin right now, and climate change is likely to make them worse. The non-native fish that prey on the sucker tend to thrive in warmer water, also a result of climate change (Colorado wildlife officials have enacted voluntary fishing closures on several rivers in the state due to high water temperatures).
“The razorback sucker’s outlook is no better today than when the fish was originally protected under the Endangered Species Act in 1991, so this move makes no sense,” said Taylor McKinnon, Southwest director at the Center for Biological Diversity, in a written statement. “It’s still in danger of extinction throughout its range, which should preclude this downlisting.”
If you happen to be anywhere near Mancos, Colorado, from mid-August to the end of September, I urge you to visit the Sundog Gallery to see the “Portal” exhibit, featuring oil paintings by the late Stanton Englehart. I consider Englehart to be thepainter of the Four Corners Country — no one captures the light, and darkness, of the Great Sage Plain, the mesas, the canyons, and even the waters of Lake Powell quite like Englehart did.
The show opens Aug. 14 with a reception from 4 p.m. to 7 p.m. at the Sundog Gallery on Grand Avenue in downtown Mancos and runs until Sept. 30.
Denver Water’s Gross Reservoir Expansion Project reached a milestone in June as workers completed major construction on raising the dam.
On June 3, 2026, workers placed the final load of roller-compacted concrete on the top of the dam, bringing Gross Dam to a height of 470 feet. Roller-compacted concrete is the type of concrete put in place to raise, thicken and lengthen the dam over the past three years.
The project is designed to nearly triple the capacity of Gross Reservoir, increase Denver Water’s reservoir storage capacity by 11%, and provide balance, resiliency and flexibility to the utility’s water collection system.
Additional work to complete the dam will take place over the next year, including adding one more foot of conventional, protective concrete to the top of the dam, which will bring it to its final height of 471 feet above the valley floor below.
At this point, dam is taller and also has a new shape.
“We have fundamentally changed how this dam works. The old Gross Dam was a gravity dam that held back the water by its sheer weight. We’ve now transformed this into an arch dam which holds the water back by its weight and also transfers the loads laterally like a Roman arch. This is the first time that we know that this dam transformation has ever been done in the world.”
Gross Dam on June 2, 2026, on the final day of roller-compacted concrete placement work. Photo credit: Denver Water.
In the video above, you can see new images of the dam and hear from Jeff Martin, Denver Water’s program manager for the project.
“We’re excited and proud of this accomplishment,” Martin said.
“Hundreds of people helped us reach this milestone, which will provide a secure water future to Denver and the surrounding communities.”
Roller-compacted concrete will be placed on top of the existing dam to raise it to a new height of 471 feet. A total of 118 new steps will make up the new dam. Image credit: Denver Water.
Click the link to read the release on the USDA website:
July 24, 2026
USDA is investing $3 million to support the development of wetland mitigation banks for agricultural producers. through the Wetland Mitigation Banking Program (WMBP).
The U.S. Department of Agriculture (USDA) is investing $3 million to support the development of wetland mitigation banks for agricultural producers. Through the USDA’s Wetland Mitigation Banking Program (WMBP), wetlands are restored, created or enhanced, generating credits that can be purchased by producers looking to compensate for unavoidable impacts to wetlands at another location.
“Wetland mitigation banks provide farmers and ranchers a clear and efficient compliance pathway, while at the same time helping to restore and protect vital wetlands and all the benefits they provide,” said USDA’s Natural Resources Conservation Service (NRCS) Chief Colton L. Buckley. “Through the Wetland Mitigation Banking Program, we can help ensure the long-term resilience and productivity of American working landscapes.”
WMBP awardees work with NRCS to develop a mitigation banking instrument that provides details for developing, establishing and operating a mitigation banking program. Priority will be given to banks in states with significant numbers of individual wetlands, wetland acres and conservation compliance requests. Based on NRCS data, these states are Georgia, Illinois, Indiana, Iowa, Michigan, Minnesota, Nebraska, Ohio, Pennsylvania, South Dakota and Wisconsin.
City and county governments, organizations, tribal governments and other entities are eligible to apply. See the notice of funding on Grants.gov for a full list of eligible entity types.
Applications are due by September 8, 2026. Visit the Grants.gov opportunity for additional details and to apply.
More About WMBP
To participate in most USDA programs, agricultural producers agree to comply with the wetland conservation provisions, meaning producers will not plant agricultural commodities on converted wetlands or convert wetlands to enable agricultural production. In situations where avoidance or on-site mitigation is challenging, the Farm Bill allows for off-site mitigation through the purchase of mitigation banking credits.
Purchasing credits from a wetland mitigation bank provides a legal mechanism for agricultural producers to maintain their eligibility for USDA program benefits if they convert agricultural wetlands.
WMBP award recipients can use the funding to support the costs of developing and establishing a mitigation bank, like costs for site identification, development of a mitigation banking instrument, site restoration, land surveys, permitting and title searches, and market research. WMBP funding cannot be used to purchase land or a conservation easement.
NRCS awarded the first WMBP grants in 2016. Since then, NRCS has awarded 39 projects supporting the creation or expansion of wetland mitigation banks in 14 states.
Awardees can request up to $1 million for a project. Projects may last up to four years.
When a mitigation bank is established, the landowner retains ownership and use of the property, while a conservation easement protects the wetlands from incompatible degrading activities.
To learn more about the Wetland Mitigation Banking Program, and how wetland mitigation banks work, visit the WMBP webpage.
For more than 90 years, NRCS has helped farmers, ranchers and forestland owners make investments in their operations and local communities to improve the quality of our air, water, soil, and wildlife habitat. NRCS uses the latest science and technology to help keep working lands working, boost agricultural economies, and increase the competitiveness of American agriculture. NRCS provides one-on-one, technical advice and financial assistance and works with producers to help them reach their goals through voluntary, incentive-based conservation programs. For more information, visit nrcs.usda.gov.
Wetlands, like these in the Prairie-Pothole Region of North Dakota, may capture and store nutrient runoff from cropland fields. Photo Credit: U.S. Fish and Wildlife Service
The Northern Colorado Water Conservancy District (Northern Water), the U.S. Bureau of Reclamation, Grand County, the Northwest Colorado Council of Governments (NWCCOG), the Colorado River Water Conservation District (Colorado River District) and the Town of Grand Lake today announced a landmark agreement establishing the Three Lakes CLEAR Initiative, a long-term effort to improve water clarity, watershed health and resilience across Grand Lake, Shadow Mountain Reservoir and Granby Reservoir (the Three Lakes).
The Three Lakes System is part of the federal Colorado-Big Thompson (C-BT) Project, which collects and stores water in Grand County and then diverts it for use by C-BT beneficiaries on the Front Range through a series of reservoirs, ditches and tunnels. The CLEAR Initiative continues the ongoing Grand Lake Adaptive Management framework for managing C-BT Project operations and incorporates additional collaborative initiatives to enhance clarity and provide watershed health benefits within and upstream of the Three Lakes System.
CLEAR stands for Clarity, Legacy, Ecosystem, Adaptation and Resilience, reflecting the shared commitment by partners to protect and improve this important resource.
The agreement marks a major milestone following two decades of coordinated work to improve clarity in Grand Lake and water quality in Shadow Mountain Reservoir and reflects a renewed commitment to sustained action and investment. It also provides a long-term framework to continue and expand this work as the Grand Lake Clarity Stakeholders’ Memorandum of Understanding (MOU), established in 2016, expires in December 2026. Today’s action renews and expands upon that MOU, protecting the Three Lakes and tributary watersheds for the next 30 years.
As part of the agreement, Northern Water, the Northern Colorado Water Conservancy District Municipal Subdistrict, and the Windy Gap Firming Project Water Activity Enterprise will provide $30 million over 30 years to address both C-BT Project operations and the broader environmental conditions influencing water quality by supporting implementation of projects and initiatives that address watershed and lake conditions. Of that amount, $20 million will be directed toward project funding to accelerate near-term, priority on-the-ground improvements initiatives, while $10 million will build a long-term reserve fund intended to provide sustained, legacy funding and the flexibility to address future needs as conditions evolve beyond the 30-year agreement.
The initiative continues and strengthens the collaborative adaptive management of C-BT Project operations in the Three Lakes that began with the original MOU, using real-time adjustments to improve clarity in Grand Lake while balancing water supply, power generation and environmental needs. At the same time, the initiative establishes a dedicated fund directed by the parties, to invest in watershed and system health projects that improve water quality and ecological conditions across the Three Lakes system and tributary watersheds.
Projects will focus broadly on watershed and forest health, reducing sediment and nutrient inputs, improving lake and reservoir conditions, and strengthening monitoring and adaptive management tools across the interconnected system.
“The foundation for this landmark agreement to improve Grand Lake clarity and create the Three Lakes CLEAR Fund was laid over decades of effort by many, representing all parties, to improve and use our knowledge of the Three Lakes System for actionable projects that can move the needle for better Grand Lake clarity. The parties have differing interests for sure, but we strive to find common ground because we have a spirit of mutual trust and respect,” said Jeff Metzger, Town of Grand Lake.
Northern Water emphasized the enduring framework the agreement creates to support the long-term health and resilience of the Three Lakes System while benefiting communities on both sides of the Continental Divide.
“The Three Lakes CLEAR Initiative demonstrates how shared stewardship of Grand Lake clarity and the health of the broader Three Lakes System and its watersheds can strengthen the long-term resilience of the Colorado-Big Thompson Project for the benefit of Front Range water users while supporting the natural resources and thriving West Slope communities that depend on them. By creating a lasting legacy of collaboration and investment, this agreement helps ensure these shared resources will continue to be protected for generations to come,” said Esther Vincent, Environmental Services Director for Northern Water.
Grand County Board of County Commissioners Chair Edward Raegner highlighted the importance of the agreement for Grand County and the local communities that have stewarded the Three Lakes watershed for generations.
“This 30-year MOU reflects an unprecedented commitment to Grand Lake’s health and the long-term future of the Three Lakes System. Grand County is proud to work alongside our partners to help preserve Grand Lake’s water clarity for generations to come.”
The Colorado River District emphasized the value of continuing the collaborative approach that has guided clarity improvements in the Three Lakes System for the past decade.
“This MOU continues the collaborative approach that has guided clarity work in Grand Lake and water quality throughout the Three Lakes system since 2016. Over the past decade, we’ve gained valuable knowledge about how to effectively use adaptive management in the system, and this agreement will provide a strong foundation to continue that work for the long term. As a signatory to this MOU, the Colorado River District will continue to be a voice for the Western Slope and advocate for solutions that protect our water resources and the communities which depend on them,” said Rebecca Briesmoore, Senior Water Resources Engineer with the Colorado River District.
Former NWCCOG Executive Director Jon Stavney also welcomed the long-term commitment.
“Since the 1970s, our organization has been engaged in multiple efforts to protect and enhance the water quality of Grand Lake. This MOU represents a new beginning backed by a long-term commitment of substantial resources to the clarity of Grand Lake.”
Colorado-Big Thompson Project map. Courtesy of Northern Water.
The different sides each presented closing arguments, but it was the reflections of Division 3 Water Court Judge Michael Gonzales that had the courtroom thinking as he brought to a close the water trial dealing with the Subdistrict 1 Fourth Amended Plan of Water Management.
At times it was a bruising trial Gonzales noted Thursday in his closing remarks, as he encouraged all the parties to move on and to not let the four-week trial wear on them and their own personal relationships.
“We all know that there’s no way this court can fashion an order or an opinion that’s going to satisfy everybody. It’s just not going to happen,” the judge said. “I mean, it can’t because we know that we have mutually exclusive and competing interests. We know that this petition when it was created recognized that, but we still said ‘cooperation’ and all those nice things. And in reality, I think we all knew at some point that was going to come to a head. And I think we’re there, but that doesn’t mean we still don’t move forward.”
San Luis Valley Groundwater
This was the big water trial because it dealt with a plan to recover the unconfined aquifer of the Upper Rio Grande Basin, Gonzales noted. He pointed to testimony of Mosca-area farmer Lyle Nissen as one he enjoyed the most.
“I just loved his testimony. Someone who’s made some recognition, someone who’s made some changes, someone who didn’t come in here and complain and just said, ‘This is how it is. I recognize it and I move forward.’ And that was great to hear,” Gonzales said.
He also referenced a term he learned during the course of the trial, “deep percolation,” and used it to provide further insight into his thinking.
“I sat in my back yard and I watched the rain come down,” he said of the week’s weather. “I watched puddles form and I thought about my second favorite term from this trial, ‘deep percolation’ and I said, ‘Aha.’ And then I came back 10 minutes later and that puddle was completely gone. I said, ‘Wow.’
“I also sat there and I thought about the testimony I think was from this current state engineer when he said that we need rainstorms of biblical proportion to get us where we need to be, and that hit home. And no matter how wonderful that rain was, there needs to be things that happen.”
The state Division of Water Resources and the Rio Grande Water Conservation District are asking Gonzales to reject the protestors’ arguments and approve the plan. Without it, they argued, the unconfined aquifer won’t recover and broad groundwater well curtailment in the subdistrict becomes inevitable.
The cornerstone of the new plan is the “one-for-one” feature, which limits groundwater pumping to the amount of natural surface water that flows into the subdistrict over a five-year running average. The intent is to put more water into the unconfined aquifer system than is taken out and one-for-one pumping guarantees that, according to the state and subdistrict.
Gonzales noted “the monstrosity of an equation” within the Fourth Amended Plan when he was quizzing Rio Grande Water Conservation District attorney Pete Ampe during his closing remarks.
The one-for-one pumping feature, the equation to determine success, and a new “depletion fee” that sets the value of water in the subdistrict at $500 per acre-foot were all argued over, discussed and debated throughout the month-long trial.
Attorney Mirko Kruse, representing his family’s farming interest, and attorney Andy Jones, representing L Cross Ranch, want Gonzales to refer the plan back to the subdistrict for adjustments they’re requesting but are otherwise good with the plan.
Two other protesting groups, Northeast Water Users Association and Sustainable Water Augmentation Group, want the plan tossed entirely on grounds it isn’t legal; they asked Gonzales to order the subdistrict to only make changes to the existing third plan of water management.
Gonzales told all the attorneys to address Rule 8.7 of the state groundwater rules governing the Upper Rio Grande Basin. That rule determines how “proportional responsibility for maintaining a sustainable water supply is divided among all the well users within the Response Area.”
It gets to one of the key arguments made by SWAG and its belief that groundwater irrigators like their clients are being illegally targeted and asked to share a disproportionate share of the burden in the unconfined aquifer recovery efforts.
Gonzales provided a timeline that leads to this Thanksgiving for when all the case documents and filings will be completed and he can begin his deliberations.
“I guess if there’s one message that we all need to take to heart is that we need to change the things we’ve been doing,” Gonzales said in completing his comments. “We can’t continue down the path we’ve been because if we think that’s the only way we can go, we’re dooming our children, our children’s children. And I don’t want to be a part of that time.”
Aspen Utilities Resource Manager Steve Hunter stands at the city’s Castle Creek water diversion in this February 2021. CREDIT: HEATHER SACKETT/ASPEN JOURNALISM
The city of Aspen Drought Response Committee is recommending to continue the current Stage Three Water Shortage Declaration amid persisting drought conditions and an approximately 75% compliance with Stage Three Water Shortage Restrictions. The Drought Response Committee meets monthly in order to discuss current conditions and assess what level of restrictions are necessary to meet demand for essential uses. According to an information update provided to Aspen City Council prior to their Monday meeting, the latest drought data for Aspen and the Roaring Fork watershed necessitate the continuation of the current Stage Three Water Shortage Declaration and Restrictions. Aspen’s municipal water supply comes from Castle and Maroon Creeks, and the Aspen water system relies primarily on direct streamflow through the consistent release of water from snowmelt throughout the year. The information update confirms that, during drier than normal years, the city’s water policy enables council to enact its Water Shortage Ordinance by selecting an appropriate water shortage stage. A Stage Two Water Shortage went into effect Sept. 1, 2025, and was elevated to a Stage Three Water Shortage declaration on May 12, effective May 15…
Colorado Drought Monitor map July 21, 2026.
“Since the Stage Three declaration was made in May, drought conditions have remained throughout the Roaring Fork Watershed,” the update reads.
It confirms that the July 16 U.S. Drought Monitor continues to show Aspen and Pitkin County fully in the Exceptional Drought — D4 — Category, the highest level of drought. Stream flow in June in the Roaring Fork watershed was at 27% of normal, and the Maroon Creek stream gauge measured peak runoff on June 7 at 143 cubic feet per second; the historical average peak runoff occurs between June 15-30 at over 300 cfs.
Below is the Precipitation Accumulation in South Platte graph from the NRCS for July 27, 2026. This morning precipitation is at 76% of the median (up 4% one week), and 65% of the water year median (up 5% one week). There are 65 days left in the water year.
Thunderstorrms are likely today through Wednesday, there is a chance for thunderstorms Thursday, a slight chance for thunderstorms Friday, with a chance for showers/thunderstorms Saturday and Sunday, in the central mountains. Light rain is currently falling and thunderstorms are likely today, there is a slight chance for showers then thunderstorms are likely Tuesday and Wednesday, with a chance for thunderstorms Thursday and Friday, and a slight chance for showers/thunderstorms Friday and Saturday in the northern mountains. There is a chance for thunderstorms today, thunderstorms are likely Tuesday and Wednesday, with a slight chance for thunderstorms Thursday and Friday, and a slight chance for showers/thunderstorms Sunday, down here, about 12 miles from Golden, where the Colorado Central Railroad was chartered February 9, 1865. From Wikipedia:
The railroad was chartered as the Colorado and Clear Creek Railroad Company on February 9, 1865, by Loveland and other entrepreneurs in the town of Golden, then the capital of the Colorado Territory. Loveland and his partners desired to build a 4 ft 8+1⁄2 in (1,435 mm) standard gauge railroad up Clear Creek Canyon to Central City and other mining centers, and to connect to nearby Denver and Boulder. During the three years before construction on the line began the company underwent several reorganizations. On January 20, 1866, the name of the railroad was changed to the Colorado Central & Pacific Railroad. The following year, in June 1867, the company was reorganized; Union Pacific investors were in control, but provided no funds for construction. That year, the seat of territorial government for Colorado was relocated from Golden to Denver…In May 1871 local interests regained control of the railroad from Union Pacific investors. By the following September, 150 men were at work in the mountains west of Golden to extend the line to the mining communities. In the spring of 1872 the company acquired critical right-of-way along Clear Creek to extend its line. West of Golden, the line built as 3 ft (914 mm) narrow gauge. In late August, the company took delivery of its first two locomotives (both 0-4-0T), the General Sherman, No. 2, followed a week later by General Sheridan, No. 1. On September 1, the track was completed 13.3 miles to Forks Creek. By mid-December, the line had been extended 7.7 miles further to Black Hawk. By February 24, 1873, a second line from Forks Creek had been extended 3.3 miles to Floyd Hill. In September, the company’s shop in Golden produced the first passenger car in Colorado. On May 11, 1874, the company took delivery of an 18-ton Mogul locomotive from Dawson & Baily. The new locomotive replaced the “Sheridan” as the #1 locomotive.
Here’s a look at the 7-Day Colorado precipitation map through July 26, 2026 from the High Plains Regional Climate Center. Precipitation in the South Platte Basin along the Continental Divide of the Americas ranged from 0.10” to 1.90”.
Here’s the 7-Day percent of normal precipitation map through July 26, 2026 from the High Plains Regional Climate Center. Precipitation in the South Platte River Basin along the Continental Divide of the Americas ranged from 50% to 400% of normal.
Below is the 7-day Quantitative Precipitation Forecast for the week of July 27, 2026. Precipitation is anticipated for the mountains of the South Platte River Basin and may total up to 1.50″.
Below are the 8-14 day outlooks from the Climate Prediction Center, issued July 26, 2026, for temperature and precipitation, for the week starting July 27, 2026. The CPC expects above normal temperatures and near normal to below normal precipitation for the mountains of the South Platte River Basin.
Below is the Colorado Drought Monitor map from June 21, 2026. There were one class degradations in Douglas, Elbert, Arapahoe, Adams, Denver, Jefferson, Clear Creek, Gilpin, Boulder, Weld, Morgan, and Larimer counties, in the South Platte River Basin. Drought and abnormal dryness covers 97.14% of Colorado. The South Platte Basin is experiencing Abnormally Dry, Moderate, Severe, Extreme, and Exceptional drought conditions.
Below is the Colorado Drought Monitor one week change map ending July 21, 2026.
Here’s the US Drought Monitor Map from last week along with the one week U.S. change map.
In the spring of 2026, anomalously low snow conditions in the western United States threatened winter recreation and water supplies. Here, we investigate: to what extent was this snow drought attributable to the climate change that has occurred since the pre-industrial period? We find that a snow drought this severe across the western United States was approximately 4.4 [95% CI: 2.6, 9.4] times more likely in the current climate than in the preindustrial period. In the Upper Colorado River Basin, the snow drought was approximately 14 times more likely [0.09, 4,300]. Given a projected increase in the frequency of snow droughts at least this severe in a moderately high emissions warming scenario, the lived experience of this event may help scientists, resource managers, and the public consider what western US snow might look like if greenhouse gas emissions are not aggressively reduced.
The cuts followed a long campaign by Utah’s Republican leadership to remove the designation and reopen the land for mining. Gov. Spencer Cox and members of the state’s congressional delegation stood with Trump at the signing, and Sen. Mike Lee said he had been working toward the reduction for roughly 18 months.
They argue that the original monuments were far larger than the Antiquities Act allows, since the law limits a monument to the “smallest area compatible” with protecting the objects inside it. Grand Staircase-Escalante was designated by Bill Clinton in 1996, and Bears Ears by Barack Obama in 2016. Cutting the monuments’ size opens the excluded land to mining. The Bears Ears proclamation points to the minerals underneath, including copper and uranium, as critical to national security.
As a scholar of Native American and Indigenous Studies I see this decision as part of a pattern that is more than a century old: the United States repeatedly acknowledges that these lands are sacred. Yet, that recognition never comes with lasting protections.
What makes these places sacred
Bears Ears takes its name from twin buttes that resemble the head and ears of a bear rising above the canyon country of southeastern Utah.
For the Pueblo nations among them, the Hopi and Zuni, Bears Ears is inseparable from their own origin stories. The Zuni account of their origin holds that people came up into this world from beneath it, arriving in the Grand Canyon, and that the long migration afterward carried them across the plateau and into the Bears Ears country.
The Zuni built villages, shrines and altars in that country, and what they built stayed sacred. “Once those structures were built, they were consecrated,” Jim Enote, a Zuni tribal member and former director of the A:shiwi A:wan Museum, told National Geographic in 2018. “Once they’re consecrated they become sacred forever. We never consider them abandoned.” The Zuni still return, making pilgrimages to the region to affirm what their oral history tells them, reading petroglyphs – images carved into the rock by their ancestors – that match those at their present-day home of Zuni Pueblo in New Mexico.
Anthropologists working with the Kaibab Paiute tribe and the monument’s own staff reported that Southern Paiutes understand their traditional lands as a “holy land” where the Creator originally placed them, and that Grand Staircase is part of it. The bond, the tribe believes, was established at Creation and passes to every generation that follows. The federal government funded that research.
The practices continue across Bears Ears. Members of the five nations gather ceremonial plants, minerals and water, and cut herbs, firewood and cedar poles for ceremonies, as they have for generations. A 2021 study in the Proceedings of the National Academy of Sciences found that at least 31 culturally significant species, among them the Four Corners potato, grow abundantly at the ancient habitation sites and are rare elsewhere, evidence that the people who lived there planted them. Each summer, runners carry prayers more than 50 miles from the town of Bluff, Utah, to the high country below the buttes, and the White Mesa Ute community beside the monument holds its Bear Dance each year.
Southern Paiutes still travel to ancestral sites across Grand Staircase for ceremonies, prayer and gathering, and they understand the plants and water of the Holy Land as living beings, able to speak to people and willing to give life to them.
Not a point on a map
Both monuments also hold a history of refuge. In the 1860s, the U.S. Army forced the Diné, also known as the Navajo, from the Four Corners country where the borders of present-day Utah, Colorado, Arizona and New Mexico meet, marching thousands of people more than 300 miles (480 km) east to Bosque Redondo in what became known as the Long Walk.
Families who evaded the removal hid in the Bears Ears canyons, where they found deer and roots for food and plants for medicine. The Paiute, whose sacred places include Grand Staircase, sheltered others fleeing the same soldiers. As Davina Smith-Idjesa, who represents the Navajo Nation on the Bears Ears Inter-Tribal Coalition, has recounted, when the government drove the Navajo from their homelands, “the Paiute Nation fed and clothed and sheltered us.”
These histories of origin, ceremony and refuge point to something U.S. law has never fully grasped: For these nations, the sacred is not a shrine that can be fenced off while the land around it is opened to mining. It is the whole living landscape. Enote puts the distinction plainly: “These are sacred places, not sacred sites. A site to me is a point on a map.”
A boundary can protect a point. It cannot protect a relationship that runs through an entire landscape, which is why lines drawn and redrawn on federal maps keep failing to hold what they are meant to protect.
A century of recognition
The government has recognized this land’s importance longer than almost any place it manages. As early as 1904, advocates told Congress that cultural sites across the Southwest were being destroyed and named Bears Ears one of seven areas needing immediate protection. That campaign helped spur passage of the Antiquities Act of 1906, which made it a federal crime to loot or destroy antiquities on public land.
But the government moved to protect the artifacts, not the living religion that made them meaningful. In those same years the same government was jailing traditional healers under the Religious Crimes Code of 1883, which outlawed Native ceremonies and dances, including the Sun Dance, and punished participants with imprisonment or the withholding of food rations. The ban held for over 50 years.
Congress appeared to correct course with the American Indian Religious Freedom Act of 1978, declaring it U.S. policy to protect Native peoples’ right to exercise their traditional religions, including access to sacred sites.
Ten years later, however, the U.S. Supreme Court set the national rule allowing a federal road through high country sacred to the Yurok, Karuk and Tolowa peoples of Northern California, even though a government study found that it would devastate religious use of the area. Blackfeet scholar Rosalyn LaPierargues that the tribes lost because the court viewed the 1978 act “as a policy and not a law with legal protections.” The land was recognized as sacred and could be destroyed anyway.
Bears Ears in 2016 looked like the moment that pattern might finally break. For the first time, the tribal nations most tied to a landscape did not just ask the government to respect it. They asked it to be protected as a national monument, with the force of law behind it. The five nations – the Hopi Tribe, Navajo Nation, Ute Mountain Ute Tribe, Ute Indian Tribe and the Pueblo of Zuni – petitioned for the monument together, the first ever created at tribal request.
But a monument is not a national park. Congress creates parks, and only Congress can undo them. Presidents create monuments by proclamation, which leaves them far more vulnerable to changes in administration.
The Native communities’ ceremonies will continue after September, as they continued through the decades when such practices were criminalized. Zuni pilgrims will still read the petroglyphs. The runners will still set out from Bluff, Utah. Southern Paiutes will still hold Grand Staircase as the holy land where the Creator placed them.
For these tribal nations the sacredness of the land does not change. What changes in September is whether the law stands between the ground the tribes consider to be sacred and the mining that lifting these protections might enable.
After four weeks of testimony and now closing arguments set for Thursday morning, the decision before the Colorado Division 3 Water Court and Judge Michael Gonzales boils down to this: Was the Colorado state engineer’s review of the Subdistrict 1 Fourth Amended Plan of Water Management proper and legally done?
Attorneys for farmers protesting the plan, namely groundwater irrigators organized as the Northeast Water Users Association and Sustainable Water Augmentation Group, accused retired Colorado Division of Water Resources state engineer Kevin Rein of “bias” during Rein’s testimony Wednesday. Rein, who retired as state engineer in December 2023, took the witness stand as a “lay” witness looking to add clarity for the court on his steps in reviewing and approving the new plan and to rebut the testimony of Ken Knox, SWAG’s expert witness who cast doubt on Rein’s review.
“Bias is always relevant to credibility, Your Honor. This line of questioning goes directly to the witness’s bias at the time he approved the fourth plan,” argued attorney Ryan Donovan.
Donovan and fellow SWAG attorney Brad Grasmick have been working to bolster their case by arguing the Fourth Amended Plan unfairly targets groundwater irrigators like their clients, and their clients are being asked to bear a disproportionate share of the burden in the subdistrict’s efforts to recover the unconfined aquifer of the Upper Rio Grande Basin.
San Luis Valley Groundwater
It is the recovery of the unconfined aquifer to sustainable levels that is at the heart of the Subdistrict 1 water management plan and has been since the first plan was adopted in 2009 and certified by the water court in 2010.
The SWAG attorneys contend Rein didn’t conduct a full legal review of the sustainability and proportionality rules contained in state statutes governing recovery of the unconfined aquifer and didn’t require all the necessary documentation to approve the plan.
Donovan then tried to show bias to the court by taking Rein back to July 2023 and the sudden end to another, but related water trial dealing with his clients’ efforts to get the Division 3 Water Court to approve an alternative augmentation plan for the SWAG farmers to operate in Subdistrict 1. Gonzales presided over that trial, as well.
The key to the July 2023 trial was the timing: SWAG was trying to get its alternative augmentation plan approved by the court ahead of the current court trial dealing with the Fourth Amended Plan of Water Management. Instead, the SWAG augmentation trial ended when it lost a source of the water from the town of Del Norte that it was counting on its plan and withdrew the case.
On Wednesday, Donovan accused Ryan and the state engineer’s office of deliberately fast-tracking approval of the Fourth Amended Plan and then getting the town of Del Norte to terminate its agreement with the SWAG farmers for water to undermine the alternative augmentation plan.
“Mr. Rein, Did you feel the need to get the approval of the fourth plan fully completed? Meaning your approval and the subsequent approval by the district board prior to the start of SWAG’s trial on July 17th, 2023?” Donovan asked.
“I can say no, absolutely not. I did not feel that, any urgency other than the urgency that this is something we have been working on for a long time. We needed to move it along. And I can state unequivocally and absolutely that there was no consideration, there was no bias that this plan needed to be approved prior to the beginning of the SWAG case,” Rein answered.
In addition to closing arguments Thursday, Gonzales will also lay out a timeline for how the case proceeds with final submissions to the point where he issues a decision.
Donovan earlier in the week, as he argued against Rein testifying, accused the judge of creating an appearance of impropriety when Gonzales made known his interest to hear testimony from Rein.
Gonzales responded that from his perch, it has seemed throughout the trial that the attorneys involved have had the intent to file an appeal with the Colorado Supreme Court whichever way he rules.
Rio Grande and Pecos River basins. Map credit: By Kmusser – Own work, Elevation data from SRTM, drainage basin from GTOPO [1], U.S. stream from the National Atlas [2], all other features from Vector Map., CC BY-SA 3.0, https://commons.wikimedia.org/w/index.php?curid=11218868
Click the link to access the report on the PNAS website (Adrienne M. Marshall, Marianne Cowherd, Stefan Rahimi, and Yuhong Ye). Here’s the abstract:
In the spring of 2026, anomalously low snow conditions in the western United States threatened winter recreation and water supplies. Here, we investigate: to what extent was this snow drought attributable to the climate change that has occurred since the pre-industrial period? We find that a snow drought this severe across the western United States was approximately 4.4 [95% CI: 2.6, 9.4] times more likely in the current climate than in the preindustrial period. In the Upper Colorado River Basin, the snow drought was approximately 14 times more likely [0.09, 4,300]. Given a projected increase in the frequency of snow droughts at least this severe in a moderately high emissions warming scenario, the lived experience of this event may help scientists, resource managers, and the public consider what western US snow might look like if greenhouse gas emissions are not aggressively reduced.
In the winter and spring of 2026, a snow drought gripped the American West; “record-low” conditions were widely reported. The snow drought was associated with anomalously high temperatures, with moderately dry to average precipitation. While it is still too early to know how the consequences of this snow drought will materialize, the US Bureau of Reclamation projected for the first time in spring 2026 that Lake Powell would fall below its minimum power pool threshold by the following winter in median climatological conditions. The snow drought is also likely to increase fire risk and reduce water availability for energy, agriculture, and municipalities.
As the snow drought progressed, scientists, the recreation industry, and the press asked whether the low snow anomaly was attributable to climate change. The frequency, severity, and temperature of snow droughts increase in climate models but formal climate attribution has only rarely been applied to snow drought [see Mote et al. for one exception]. Since then, the science and data available for climate attribution studies have advanced substantially. Here, we ask: to what extent is the 2026 western US snow drought attributable to climatic changes that have occurred since the preindustrial period?
Northern Water will pay $30 million over the next 30 years to solve long-standing clarity and water quality problems at one of Colorado’s most treasured natural wonders, Grand Lake.
Under the terms of the agreement, the giant water provider will spend $1 million annually to test and implement new solutions to the problem, including weed control, aeration and sediment removal. The deal is the first time a dedicated source of money has been set aside to help the lake, Northern Water spokesperson Jeff Stahla said.
Grand Lake, located near the west entrance to Rocky Mountain National Park, is Colorado’s deepest natural lake and has been a major tourist destination since the late 1800s. A coalition of federal and state agencies, and local advocacy groups have been working and arguing over how to restore it since at least 2008.
“It has been a long and arduous process to get here,” Stahla said. “We’re hopeful that this is a turning point for being able to work together for the common good.”
Grand Lake is a key element of Northern Water’s Colorado-Big Thompson delivery system, which provides water to more than 1 million people on the northern Front Range and thousands of acres of irrigated farmlands.
Owned by the U.S. Bureau of Reclamation and operated by Northern Water, The C-BT gathers water from the Upper Colorado River, and stores it in two holding pools built by the federal government: Lake Granby and Shadow Mountain Reservoir. From there it is eventually moved into Grand Lake and delivered via the Adams Tunnel under the Continental Divide to Carter Lake, west of Berthoud, and Horsetooth Reservoir, west of Fort Collins.
Colorado-Big Thompson Project map. Courtesy of Northern Water.
During that process, algae and sediment are carried into Grand Lake, clouding its formerly clear waters and causing algae blooms and weed growth, and harming recreation.
In 2008, the Colorado Water Quality Control Commission moved to set a clarity standard, but it has since been replaced with a clarity goal and the aim of achieving “the highest level of clarity attainable.” Since then, Northern Water and others have implemented different management techniques, including changing pumping patterns, to find ways to improve water quality in all three water bodies.
In 2016, the U.S. Bureau of Reclamation took the first steps required under the National Environmental Policy Act of 1969 to do the scientific and engineering studies needed to fix the system and hold public hearings. But Reclamation stopped the process in 2020, saying that it could not definitively establish any structural alternatives that would work, nor could it find a way forward on funding such a major infrastructure redesign.
Frustration among Grand Lake advocates continued to build, however, and in 2024, Colorado lawmakers passed a resolution calling for more work on the issue.
In 1941, before the Colorado-Big Thompson Project began operating, clarity was measured at 9.2 meters in depth, about 32 feet, according to Northern Water. Since 2016, the goal has been to achieve clarity of 3.2 meters, just over 9 feet. “We’ve been hitting the goals much more steadily than we have before, thanks to changes in the way the water is pumped through the system,” Stahla said.
Still the lake is plagued by infusions of warm, murky water during the summer and algae blooms that harm its recreational value, locals say.
Mike Cassio, president of the Three Lakes Watershed Association and a long-time Grand Lake advocate, said the new agreement was the only way the local interests could see to move forward, given what they say is an imbalance of power between the federal government and Northern Water, and the people of Grand County.
“The Bureau of Reclamation has estimated that replumbing and fixing Grand Lake is a $1 billion project and it would take a congressional mandate to fund it,” Cassio said. “Is this agreement the best that we have? Probably. Is anybody up for a fight with Northern and the Bureau? Probably not. So the best thing to do is to work together.”
In addition to the $30 million, the new agreement also expands the governing body overseeing the work to include the town of Grand Lake, which will for the first time have an official role in how the three-lake system is managed, Stahla said.
The Colorado River District, which represents 15 Western Slope counties, signed off on the deal this week, saying via email that the new agreement would provide a strong foundation for future work on the lake.
Other signers to the agreement include Grand County, the Northwest Colorado Council of Governments, Northern Water, and the town of Grand Lake. It must still be signed by the U.S. Bureau of Reclamation.
Why would a young Republican back solar power but reject a carbon tax? Why would two Democrats agree that climate change is real but split over a policy that would charge households more if they exceeded a monthly limit on energy use?
Those patterns may go against the partisan rhetoric of our times, but they reflect the reality that Americans do not sort neatly into simple camps on climate change.
We study complexsystems. In a new paper, we analyzed 20 years of Gallup environmental surveys, digging into individual responses from 2000 to 2020 that aren’t released to the public. We wanted to look beyond the usual headline that Democrats and Republicans disagree when it comes to climate change.
Rather than treating age, education, income and ethnicity as separate influences, we studied how they combine inside each party to shape climate beliefs and support for specific policies.
Belonging to the same party doesn’t necessarily mean holding the same views on climate policies, as 20 years of Gallup polls show. Al Drago/Getty Images
This deeper, more nuanced view changes the story by identifying people as more than just their political affiliations. To be clear, political party is still the strongest divide, but it does not tell us enough on its own. The same policy can mean very different things to different people, even within the same party.
We found several enduring themes.
1. Climate polarization deepened after 2017
A broad partisan split already existed, but it sharpened after Donald Trump first won election to the presidency in 2016. In Gallup polling from 2017, concern about global warming jumped among Democrats and independents, while Republicans stayed far less worried.
Our analysis shows that the greatest shifts in concern were among Democrats and independents, particularly those who worry about global warming, whether it is human-caused or natural, and whether it will threaten their way of life.
That matters because it suggests opinion on climate change and policy can be reshaped by political context.
2. Among Republicans, age is a major force
The biggest internal divide among Republicans was age.
Younger Republicans have often been much more open to renewable energy and much less supportive of fossil fuel expansion than older Republicans. In our data, Republicans ages 18 to 34 were more likely than older Republicans to oppose coal development and drilling in the Arctic National Wildlife Refuge. They also showed strong support for solar energy and alternative fuels.
Results from two decades of Gallup surveys. Yidan Sun, The Conversation, CC BY-ND
This is more than a descriptive age gap. The survey responses suggest that within today’s Republican coalition, climate and energy preferences are being sorted through different priorities. Younger Republicans appear more open to future-oriented energy development, such as spending more government money on developing solar and wind power. Older Republicans are more attached to established energy systems and the economic language surrounding them.
3. Climate policy support depends on what the policy asks people to do
One of the clearest lessons from our analysis is that support for climate action depends heavily on the design of the policy itself.
That distinction helps explain why public opinion on an issue such as climate can look inconsistent when it is viewed as a monolith. People are reacting not only to climate change itself but also to what a policy signals about government, markets, fairness and personal cost.
This finding fits with earlier research on solution aversion: When threatened by a solution, a person’s belief in the problem itself may be challenged.
We found something similar across the political spectrum with proposals to legally limit household energy use. Those were unpopular not just with Republicans but also with many Democrats and other respondents who described themselves as concerned about climate change. Even people who accept that there is a problem may resist solutions that feel coercive or too close to everyday private life, meaning policies that interfere directly with daily household choices or bills.
4. Education does not erase the partisan gap
A common but mistaken assumption is that more education naturally leads to more agreement on climate change. Our results point to a messier reality.
Among Democrats, higher education was linked to stronger support for climate policies such as carbon taxes, emissions standards for business and industry, and renewable energy investment. College-educated Democrats were especially supportive of regulatory and tax-based climate policies, such as imposing mandatory controls on carbon dioxide emissions and passing a carbon tax to encourage people and industries to reduce their carbon dioxide emissions.
Among Republicans, education did much less to reduce skepticism about climate policies. Better-educated Republicans did not simply converge toward Democrats. In some cases, they remained skeptical of climate regulation even while showing support for technologies such as nuclear power.
Results from two decades of Gallup surveys. Yidan Sun, The Conversation, CC BY-ND
We believe that this is one of the most important analytical lessons in the study. Education is not just adding information into a neutral space. It is interacting with party identity. The same increase in education can deepen support for climate policy in one partisan context while leaving skepticism largely intact in another.
5. The biggest group is the ‘mixed middle’
The largest group in our analysis was not those most concerned about climate change or the skeptics. It was the mixed middle: people with complicated, sometimes inconsistent views.
That group matters because it suggests American opinions on climate change are polarized but not fixed. The surveys showed that this middle group was the largest of the three Gallup clusters: 10,617 mixed-middle respondents, compared with 6,682 who were highly concerned about climate change and 3,102 skeptics. Many people are neither fully convinced nor fully dismissive of the need for policies to counter the drivers of climate change. Their views depend on the issue, the framing of policy proposals – for example, whether it is presented as a tax or an incentive, a regulation or a technology investment – and the trade-offs involved.
If there is a practical takeaway from 20 years of climate surveys, it is this: Political party remains the strongest clue to how Americans think about climate change, but to understand where opinion might move next – and which policies might actually gain support – requires looking deeper than the party label.
Earlier this week, President Donald Trump issued a proclamation dramatically reducing Bears Ears National Monument and terminating the Bears Ears Commission, undermining years of progress in collaborative management. The decision weakens protections for a living cultural landscape. This sacred ancestral homeland has been cared for by Indigenous peoples since time immemorial. This is a major setback to one of the nation’s most extraordinary models of collaborative management of public lands between Tribal Nations and federal agencies…
The Bears Ears Commission is composed of five Tribal Nations—the Hopi Tribe, Navajo Nation, Ute Indian Tribe of the Uintah & Ouray Reservation, Ute Mountain Ute Tribe, and Zuni Tribe. They work collaboratively with the U.S. Bureau of Land Management and U.S. Forest Service to manage and steward Bears Ears National Monument. The Bears Ears Commission exemplifies collaborative management between sovereign Tribal Nations and the federal government. The Commission was established following the designation of Bears Ears National Monument in 2016.
According to a statement from the commission last week, “The significance of Bears Ears cannot be reduced to a handful of individual sites or separate management areas. Tribal Nations understand Bears Ears as an interconnected living cultural landscape, where the land itself—and the relationships among its cultural sites, waters, plants, animals, and sacred places—are what must be protected.”
Over the past several years, the Bears Ears Commission has worked alongside the Bureau of Land Management and U.S. Forest Service developing and implementing the Bears Ears Resource Management Plan. This collaborative management framework is grounded in Traditional Indigenous Knowledge and western science. The plan remains a historic achievement. It demonstrates how Tribal leadership, Indigenous Knowledge, and western science can work together to care for one of America’s most significant regions in a way that protects the cultural, historical, ecological, and scientific values that make Bears Ears cherished by Tribal Nations and all who visit and experience it. In June 2025, the Department of the Interior stated in writing that, if it considered changes to the boundaries, management, or designation of Bears Ears National Monument, it would contact the Bears Ears Commission to schedule a meeting. The Commission expected meaningful government-to-government consultation and the Department’s written commitment to be honored before decisions affecting Bears Ears National Monument were made. But no such consultation occurred. The proclamation also terminates the Bears Ears Commission, despite years of collaborative work carried out through the Commission and its government-to-government relationship with federal agencies. The president’s action not only reneges on the Department’s assurances in the June 2025 letter, but is also contrary to the terms establishing the Commission in Proclamation 10285 and the Inter-Governmental Cooperative Agreement between the Commission Tribes, the Bureau of Land Management, and the U.S. Forest Service for collaborative management of the Monument.
Elk Ridge, Utah. Photo credit: Tim Peterson via the Bears Ears Inter-Tribal Coalition
Little doubt was left following the conclusion of Tuesday’s [July 21, 2026] water court session that the Subdistrict 1 Fourth Amended Plan of Water Management will ultimately be decided on appeal by the Colorado Supreme Court.
Division 3 Water Court Judge Michael Gonzales said as much as he ruled, following arguments, to allow testimony from former state engineer Kevin Rein, who is expected to testify as a rebuttal witness on Wednesday morning.
Ryan Donovan, attorney for the Northeast Water Users Association and Sustainable Water Augmentation Group which are protesting the subdistrict plan, argued that Rein should not be allowed to testify as a “lay witness” to rebut the testimony of SWAG expert witness Ken Knox.
He also told Gonzales that his comments at the conclusion of the court session on Friday, July 17, where the judge made known his interest in hearing from Rein, created the appearance of impropriety which would be grounds for appeal should Gonzales rule against NWUA and SWAG in their bid to have the plan rejected by the water court.
“Now the supporters wish to call the exact witness identified by the court to the stand and are using the court’s statement as a basis for doing so. This tells me that the supporters would not be calling Mr. Rein, but for those statements. The extent the court relies on Mr. Rein’s testimony to fill the gaps in the state’s case and Mr. Rein’s testimony serves as a basis for the court’s ruling, NWUA and SWAG certainly have a colorful issue on appeal because the statements and the proponent’s subsequent action in response to those statements create the appearance of impropriety,” Donovan said.
In making his ruling that Rein could testify and that Rein’s testimony would be part of the court’s deliberations, Gonzales told Donovan and Subdistrict 1 attorney Pete Ampe that from his perspective, it’s felt that all sides have been working toward an appeal rather than to convince him.
“Pretty much all the evidence I’ve heard for the last three weeks has been cumulative, could be considered a waste of time and confusing. The same argument you just made for the evidence that I potentially could hear from Mr. Rein … I’ve let you guys present as much evidence as possible. I think maybe I have sustained two objections the entirety of the trial so that all the evidence comes in so the court has a basis to make what I would call a very ‘unenviable decision’ to quote language used by others and to be able to rely on enough information, sufficient information.
“I’ve let it all come in. I haven’t stopped, really, anybody from presenting any evidence during the course of these proceedings. Quite frankly, I will tell you from my perspective…it’s felt like no one really has been concerned as to what decision this court is going to make because you’ve been setting up an appeal from the very beginning on both sides, on all sides.That’s what it’s felt like,” Gonzales said.
Earlier in the day, Jake Burris, president of the Subdistrict 1 Board of Managers, and Subdistrict 1 farmer Lyle Nissen testified in support of the Fourth Amended Plan as rebuttal witnesses to testimony from farmers SWAG put on the witness stand.
Nissen walked the court through all the ways he has retooled his farming operation in light of the declining unconfined aquifer.
“It is a different day, a different time. We’ve got to have rules. We have to have parameters. We have to get to the point where we’re sustainable,” Nissen told the court.
The water trial resumes Wednesday [July 22, 2026], with final arguments coming as early as Thursday.
As we enter the thick of watering season in mid-July, it’s a good time to assess how Denver Water customers are doing in cutting water use amid a drought.
The early verdict: Good but needs to be even better.
Denver’s Board of Water Commissioners, in its drought declaration of March 25, called for a 20% reduction in water use over the coming year.
By one important measure, the 1.5 million people Denver Water serves are meeting that goal. Customers are using about 20% less than projected — when the record-setting hot and dry weather we’ve experienced in 2026 is factored in.
By another measure, against the five-year average, customers are conserving water — but have a ways to go to hit the goal. Using the five-year average sets a tough bar, however, as those years were not generally as hot and dry as what the Denver region has seen so far this year.
Get tips for helping your lawn survive the summer on mandatory drought restrictions that allow residential water only on two assigned days per week. Photo credit: Denver Water.
Overall, when you consider the conditions, the high temperatures and lack of precipitation, we think customers are doing well,” said Greg Fisher, manager of demand planning for Denver Water. “They are showing restraint even as the spring and early summer continued the record-breaking drought numbers we saw last fall and winter, combined with extremely high temperatures.”
In fact, tracking at Denver Water’s three weather stations, spaced out west to east across the metro area, shows January through June of 2026 experienced the highest daily average temperature ever, at 67 degrees, compared to an average of 62 degrees.
9News meteorologist Chris Bianchi’s July 9 post on Twitter noted that Colorado has just experienced the hottest opening half of the year on record, “and it wasn’t even close.” Image credit: Chris Bianchi via Twitter.
Colorado as a whole is seeing the same trend, with 9News meteorologist Chris Bianchi reporting that it was the hottest opening half of the year on record, “and it wasn’t even close,” he noted on Twitter July 9.
The average temperature of 46.2 degrees beat the previous mark by a full degree. “The impact of a warming climate is clear,” Bianchi noted.
The weather has taken a toll, putting water supplies and landscapes in a major water deficit, Fisher said. Even so, customers have heard the call for conservation.
Overall, they adhered to Denver Water’s call to hold off on activating sprinkler systems until mid-to-late May or even June.
But as spring rains retreated and temperatures rose, watering season hit its stride and the hot weather predictably drove up use to levels similar to the five-year average recorded from 2021-2025.
Now, as we enter the heat of July and August, Denver Water should get a better sense of how well customers continue to keep water use in check and hold to mandatory two-day-a-week watering schedules.
Suggested watering times that comply with Denver Water’s mandatory drought restrictions that limit outdoor watering to two days per week. Image credit: Denver Water.
Mother Nature may help, with some climate models suggesting the potential for a rainier summer that could reduce the need to turn on sprinklers, cut demand and keep water in Denver Water reservoirs.
“It’s so important for customers to pay attention to the weather, and keep irrigation systems off around rain events,” Fisher said. “A good rainstorm should allow you to take your watering day off and, in some cases a rainy week means you can skip watering on both designated days.”
Preserving water supplies in Denver Water’s reservoirs is key.
Overall reservoir levels, as of July 13, are currently around 78% percent full (compared to percentage levels usually in the high-90s at this time of year), but levels are dropping as summer watering hits full stride.
The more Denver Water customers can stretch those supplies, the quicker the storage levels can begin to recover after a year — or more likely years — of better winter snowpack.
Too much drawing down of precious water supplies stored in reservoirs could be consequential for water users.
Antero Reservoir in 2026, after its water was moved to Cheesman Reservoir to reduce the amount of water lost to evaporation. Photo credit: Denver Water.
Should supplies drop too low this summer, water planners would potentially consider reducing outdoor watering to one day a week to further ease pressure on supplies and avoid an even larger storage deficit next spring. So now is the time to pay close attention to water use outdoors — and indoors.
Every bit you save, whether it’s while you shave, shower or water the lawn improves the chances we can avoid even tougher restrictions and look with hope for a stronger winter to come and begin recovering storage supplies.
“We need people to be thinking bigger than this week or this year when they think about water,” Fisher said.
“Even with watering restrictions in place now, we’ll enter next year with a water deficit due to the record snow-drought last winter. Recovering from that requires not only some good snow years, but thoughtful conservation from our customers.”
Every year, billions of migratory birds connect the world’s continents, oceans and ecosystems as they undertake epic journeys between their foraging habitats and their breeding grounds.
A bobolink (Dolichonyx oryzivorus) leaves its breeding grasslands of North America for the Pampas of South America. A Newell’s shearwater (Puffinus newelli) spends months soaring across the North Pacific before returning to the Hawaiian Islands to breed. A spoon-billed sandpiper (Calidris pygmaea) travels from Arctic Russia to the rapidly disappearing tidal mudflats of Southeast Asia for its nonbreeding season.
These birds could hardly be more different. They occupy different habitats, follow different migratory routes and face different threats. Yet they share one remarkable characteristic: Their survival depends on networks of habitats stretching across thousands of miles and multiple countries.
The bobolink breeds in the grasslands of North America, but it makes an epic migration journey to South America each year. Grayson Smith/USFWS.
Today, all three species and many others are in trouble. Their migrations remain among nature’s greatest spectacles, but the birds themselves are increasingly at risk as the habitats and ecological connections they depend upon are lost or degraded and threats to their survival and ability to reproduce increase.
The results are sobering. We found that more than half of the world’s migratory bird species are declining because of an array of threats, including habitat loss, invasive species that harm birds, collisions with buildings, hunting, the pet trade, toxic pesticides and, in some cases, being caught in commercial fishing nets.
But our study offers a second conclusion with more hope. The science around migratory birds has changed dramatically over the past two decades, and conservation can help save these incredible species – if governments act before they become endangered.
Protecting birds across their epic journeys
If migratory bird conservation is refocused on the birds’ full annual cycles, it can protect birds and their habitats throughout the year, from their breeding grounds to their nonbreeding homes and their migratory routes in between.
This approach combines protecting and restoring important places, reducing threats wherever they occur. It also relies on international cooperation and proactive conservation led by engaged governments before species become endangered.
Some of the amazing migrations that take place around the world. (a) The lines reflect prebreeding (solid) and postbreeding (dashed) migration routes of several birds. (b) Some birds, like the Hudsonian godwit (Limosa haemastica), a member of the sandpiper family whose annual cycle is shown here, travel thousands of miles. (c) The Barau’s petrel (Pterodroma baraui) spends much of its nonbreeding time over islands and open water. (d) Other species, like the giant hummingbird (P. gigas) found in the Andes mountains, travel to higher elevations after breeding. Nature Reviews Biodiversity/Peter P. Marra, et al., 2026
The encouraging news is that humans have never been better equipped to reverse these species’ declines.
Researchers attach a satellite transmitter to the back of a red knot, a rapidly declining migratory species. Tiny trackers like these show migration routes and help locate the potential harms and ways to help these species. Tim Romano, courtesy of the Smithsonian InstitutionTrackers on birds are like tiny backpacks. Smaller than a penny, birds can carry them hundreds of miles, giving scientists insight into their patterns and habitats and ways to help them survive. Tim Romano, courtesy of the Smithsonian Institution
For the first time, scientists can follow individual birds across continents and determine where conservation actions will have the greatest impact.
A new strategy
For much of the past century, migratory bird conservation focused on protecting important places, such as the breeding grounds, wetlands, nonbreeding habitats and migration stopover sites birds depend upon.
That strategy has been enormously successful and remains indispensable. Protected areas have prevented countless extinctions and will continue to be a cornerstone of biodiversity conservation.
A scientist releases a Kirtland’s warbler with its tracker attached. Tim Romano, courtesy of the Smithsonian Institution
But research has revealed something equally important: Protecting places, while essential, is often not enough to conserve species whose lives unfold across continents and oceans. It’s also important to understand where and when populations are most at risk and address those constraints across the birds’ entire annual cycle.
The three species that opened this story illustrate why.
Bobolinks breed across North American grasslands but spend much of the year in South America. Conserving breeding habitat alone cannot reverse their declines if grasslands continue to disappear or if birds are poisoned by pesticides.
Critically endangered spoon-billed sandpipers depend on a shrinking network of tidal mudflats that serve as stopover sites between their breeding grounds on Russia’s Chukotka Peninsula and their nonbreeding areas in Southeast Asia. Losing even a handful of these staging areas can jeopardize one of the world’s rarest migratory birds.
Each species requires a different conservation strategy, but all require the same way of thinking: conserving their entire annual cycle rather than focusing on a single place, season or threat.
Fortunately, this approach is already starting to take hold in the United States and demonstrates what is possible.
What success can look like
Road to Recovery is an international initiative designed to reverse the losses of North America’s fastest-declining bird species before they require protection under U.S. endangered species legislation.
Rather than waiting for populations to collapse, Road to Recovery brings together scientists, governments, conservation organizations, landowners and local communities to form species working groups. These groups help identify the harms bird populations are facing and how to be more surgical in where limited conservation dollars are invested.
However, the convention’s effectiveness is severely hindered when many of the world’s largest, wealthiest and most influential countries have not signed on to it. That includes the United States, Canada, Mexico, Russia and Japan.
Broader international participation and sustained investment from governments can help translate scientific knowledge into coordinated conservation action across the full annual cycle.
Around the world, conservation initiatives repeatedly demonstrate that when threats are identified and addressed, bird populations recover. The pesticide DDT almost caused the extinction of species such as the bald eagle, peregrine falcon and osprey, but humans stepped in, banned its use, and all species recovered.
The challenge now is applying what science has found.
Next spring, bobolinks will once again return to North America’s grasslands. Newell’s shearwaters will navigate thousands of miles of open ocean back to Hawaii. Spoon-billed sandpipers will once again attempt one of the world’s most extraordinary migrations.
Whether future generations can continue to see these magnificent migrations will depend on the choices of current generations and the steps they take to save them.
While this may not resemble the monumental structures in Chaco Canyon at first glance, a closer look reveals the outlines of ancient walls, shrines, and a Chacoan great house known as Pierre’s. The pueblo is in the San Juan Basin north of Chaco Culture National Historical Park and is just inside the 10-mile buffer zone. While the site is protected by additional federal laws, its surroundings — which can include corn fields, “roads,” and other cultural sites — would be vulnerable to oil and gas drilling if the administration rescinds the leasing moratorium. Jonathan P. Thompson photo.
THE NEWS: The Trump administration is moving forward with its bid to revoke a 20-year moratorium on federal oil and gas leasing around Chaco Culture National Historical Park in northwestern New Mexico. The Bureau of Land Management is giving the public just two weeks to comment.
THE CONTEXT: The GOP’s assault on public lands, cultural resources, and tribal nations is reaching a fevered pitch this week. The latest attack is on the 10-mile “buffer zone” around the park, where the Biden administration banned new drilling in an effort to protect a small part of the greater Chacoan cultural landscape.
When President Theodore Roosevelt wielded the brand new Antiquities Act in 1907 to create Chaco Canyon National Monument, he drew the boundaries around what is now known as “downtown Chaco,” a handful of structures including the 800-room Pueblo Bonito, constructed between the 9th and 12th centuries by ancestors of today’s Pueblo people.
That was merely the center of the Chacoan world, however, which extended over 100 miles outward into the Four Corners region, which may have been a political empire, a religious or cultural society, a school of architecture, or all of the above. Dozens of Chacoan outliers or “great houses,” along with thousands of smaller sites, shrines, and architectural features with unknown function, did not exist in isolation. They were part of a cultural tapestry woven into the natural landscape. The national monument, in other words, was vastly incomplete, which is especially concerning given that it lies in what would become one of the nation’s most heavily drilled oil and gas fields.
It was with this greater context in mind that in 2023, after years of consideration, public meetings, and analysis, President Joe Biden signed Public Lands Order 7923, which withdrew about 336,000 acres of public land from oil and gas leasing for 20 years. Tribal nations with ties to the cultural landscape, environmental advocates, and archaeologists had sought the withdrawal to provide a buffer zone around the national historical park and to add a layer of protection to the associated sites within 10 miles of the park’s boundaries.
But Project 2025 called for these kinds of withdrawals to be rescinded, and the Trump administration has begun the process of complying. Keep in mind that this does not directly affect the park or the cultural resources therein. Chaco is a national park, and oil and gas leasing and drilling and other development is prohibited; only Congress can change that. Drilling rigs won’t be going up next to Pueblo Bonito, but drilling just outside the park could affect the park’s viewsheds and soundsheds.
The BLM is now inviting public input, for a very limited time, on three alternatives: 1. keeping the ban in place; 2. shrinking the 10-mile buffer zone to just five miles; 3. eliminating the ban altogether. To comment, click on this link and then click on the “Participate Now” button at the top of the page.
The maps illustrate the carnage of the Trump administration’s evisceration of Bears Ears and Grand Staircase-Escalante National Monuments better than mere numbers, and show exactly from where the 2.93 million acres of protections were rescinded. They also lay bare just how much Trump removed from the shrunken national monuments that remained after Trump I’s 2017 reduction.
I’ve turned to the maps for another reason these past few days: To try to discern some sort of pattern or logic in where the lines were drawn this time, and why they are so radically different than in 2017. I’ve found that looking at the lines on the maps is more like taking a Rorschach inkblot test: You can come up with some decent sounding explanations, but there’s not much to back them up with.
When the Trump administration rolls back limits on smokestack pollution from coal plants, lowers royalty and reclamation bonding rates for oil and gas facilities, or lower water quality standards, it’s clearly doing so to help their corporate buddies rake in even more profits. When they slash millions of acres from two national monuments, the intent is more ambiguous, perhaps even for the ones making the decisions.
Certainly shrinkage generally is motivated by Trump’s spite towards his more popular predecessors, Bill Clinton and Barack Obama, the ones who originally established Grand Staircase-Escalante and Bears Ears national monuments, respectively. But beyond that Trump himself is in the dark: He actually believes that people are unable to hike, hunt, camp, or fish in these national monuments, which simply is not true. Not only are all of those things allowed, but so are motorized travel on hundreds of miles of designated roads, vegetation management, livestock grazing, and commercial activities.
The main activities these national monuments restricted were new mining claims and new oil and gas, coal, and other energy-related leases (existing active valid leases and claims are not affected by the designation). So, clearly, at least part of the motivation here is to reopen certain lands to the extractive industries. Trump’s proclamations affirm this: They say the land needs to be opened up to miners and drillers to extract “several resources that are vital to energy and resource independence” such as “silver, copper, molybdenum, lead, uranium, vanadium, and zinc.” And, of course, we all know by now that Trump’s “energy dominance” agenda includes leasing out as much land as possible — whether it contains oil and gas or not — to the petroleum companies.
The administration is also hoping to trigger a lawsuit that could make its way to the Supreme Court, where it would become a test of the Antiquities Act, itself. Plus it’s looking to open the door to allowing Utah or county governments have more control over federal land. That might be a gift to Sen. Mike Lee to show appreciation for his groveling sycophancy towards Trump, which has become more valuable with the death of Sen. Lindsey Graham.
In other words, the motivations are pretty similar to when Trump shrunk the monuments in 2017. It was clearly done in part to open up known reserves of oil and gas, uranium, coal, and potash. This is made obvious not only by communications between industry and the administration prior to the shrinkage, but also by the fact that Trump I’s shrinkage lines followed known resource reserves, not the boundaries proposed by local and state officials.
For example, the 2017 redraw cut out the Circle Cliffs historic uranium and copper mining district on the far northeast side of GSENM, probably to allow access to those reserves. And while it left part of the vast Kaiparowits coal field in the national monument, it made cutouts for the former Smoky Hollow coal lease, where Andalex had planned on building a gargantuan mine prior to the 1996 designation. At Bears Ears, the 2017 shrinkage cut out the White Canyon uranium mining district, where there’s also tar sand development potential.
This brings up a lot of questions. First off, why did Trump II go to the trouble of redrawing completely new boundaries this time around rather than just re-upping the 2017 lines? After all, they achieved all of the same goals as the bigger, current shrinkage, while also keeping a few more valued landmarks under monument status. The Six Shooter peaks and Bridger Jack Mesa were kept in the Indian Creek Unit of Bears Ears under the 2017 shrinkage, for example, but left out this time. Why?
The most dramatic change, even from Trump’s 2017 boundaries, is to what is now known as the Kaiparowits Horizons Unit of GSENM, where the national monument was eliminated save for a seemingly arbitrarily placed square on Long Flat and a rectangular strip on the East Clark Bench. The latter strip was kept intact because it is where anthropologists found the bones of Sarabosaurus dahli,a new taxon of sea-going dinosaur Turonian mosasaurid. But removed from monument status were hundreds of significant landmarks, from the Cockscomb to Grosvenor Arch to the entire Kaiparowits Plateau.
The 2026 shrinkage does open up the entire Kaiparowits coal field. But it also nixed the whole Grand Staircase Unit, where there are no known mineral reserves.
Perhaps trying to find logic somewhere in the collective brains of the Trump administration is a fool’s errand. I’m certainly not seeing it in these maps. But maybe you can? Check them out and let me know! As is always the case with this sort of detailed image, the best experience is had on the Land Desk website. So if you’re reading this in your email browser, you’d be best off clicking on the headline above, and it will take you straight to the site, where clicking on the images will give you a larger view.
Southern Utah Wilderness Alliance did a nice map of the cuts in Bears Ears. The cuts to the original boundaries were drastic, to put it mildly, excluding the entirety of Cedar Mesa, Mancos Mesa, White Canyon and its tributaries, Dark Canyon, most of Butler and Cottonwood washes, Grand Gulch, and the Valley of the Gods. The changes from the 2017 shrinkage were relatively small in the Shash Jaa Unit, but the Indian Creek Unit was reduced substantially this time around, leaving out the Six Shooter peaks and Jack Bridger Mesa.
The Utah Geological Survey’s Resource Overview Map (showing the original 2016 and Trump-shrunken 2017 BENM boundaries) shows that the 2026 boundaries appear to have been drawn to exclude potash and uranium resources that were left within the national monument after the 2017 shrinkage.
SUWA’s map shows the near total elimination of the central, southern, and western portions of GSENM, leaving only two little portions that are now called the Kaiparowits Horizon Unit. The southern strip is where researchers found the bones of the Sarabosaurus dahli. Source: SUWA.
The UGS Resource Overview Map indicates that Trump I slashed the Circle Cliffs area from GSENM due to its uranium, vanadium, and copper potential. The 2017 shrinkage also made cutouts for places with high coal recovery potential. But it kept the southwestern part of the national monument — where there is little known resource potential — relatively intact. The 2026 shrinkage eliminated all of that.
Here’s another map by the Utah Geological Survey showing historic coal and oil and gas leases. Again, if you compare this to the maps above, you’ll see that the 2017 shrinkage made cutouts for these places. While the 2026 shrinkage also cut these places out of the national monument, it didn’t open up significantly more leases than the 2017 shrinkage did.
Here I overlaid the Resource Overview maps onto a BLM map showing the original boundaries of GSENM (in black), the 2017 boundaries (in brown) and the 2026 shrinkage boundaries (in red). This suggests that the 2026 shrinkage was looking to free up all of the Kaiparowits coalfield. It also freed up a lithium deposit along the Hole in the Rock road. Source: BLM, USG, Land Desk map.
🏠 Random Real Estate Room 🤑
Well, here’s some relatively affordable housing. Or something like that. I could see turning this thing into a giant art studio, event-space, and housing. And it’s in a lovely part of the world, too! The ad gives a Dolores, Colorado, address. But it’s actually in Arriola, which is about halfway between Cortez and Lewis.
The North American monsoon season is ramping up across the West, with the potential to bring much-needed rain as Colorado faces a historic drought and major wildfires, according to forecasters. National Weather Service forecaster Kris Sanders said that widespread, scattered showers and thunderstorms on the Western Slope this week could be an early sign of the monsoon, or a late-summer shift in the wind patterns that brings more moisture to the region….A rainy monsoon season could be good news for the drought-stricken mountains. Large parts of Summit, Grand, Eagle, Pitkin, Moffat, Rio Blanco, Garfield and Lake counties have been experiencing exceptional drought — the highest level — for nearly three months straight, according to the U.S. Drought Monitor. Almost the entire Western Slope is experiencing severe drought, Level 2 of 4, or higher. But Smith also noted that the monsoon can be a double-edged sword that can bring lightning and wind, which can increase wildfire risk. It also creates new hazards for those recreating outdoors.
This U.S. Drought Monitor (USDM) week saw degradations across the areas of the Plains, Upper Midwest, and Florida, while rainfall during the past week led to improvements in drought-affected areas of the South, Southeast, Mid-Atlantic, and Northeast. In the West, a mix of improvements and degradations occurred on the map with improvements across areas of Idaho and Montana in response to above-normal rainfall during the past 30-day period. Conversely, areas of eastern Colorado and southeastern Wyoming saw degradation in response to dry conditions and excessive heat and elevated evaporative demand. Likewise, hot and dry conditions prevailed across the central and northern Plains leading to expansion and intensification of drought, with temperatures ranging from 2 to 10+ °F above normal and reports of poor rangeland conditions. In the South, another round of heavy rainfall in the Hill Country of Texas led to continued improvement in the long-term drought situation as well as severe flash flooding, with widespread rainfall accumulations ranging from 5 to 10 inches and isolated areas receiving totals in excess of 15 inches during the past week. In the Southeast and Mid-Atlantic, isolated shower activity led to improvements in drought-affected areas of Florida, Georgia, the Carolinas, and Mid-Atlantic states. Similarly, isolated areas of the Northeast received heavy rainfall accumulations ranging from 2 to 5+ inches, leading to improvements in New Jersey, New York, Connecticut, and Massachusetts.
In terms of reservoir storage in the West, California’s reservoirs continue to be at or above historical averages for the date (July 21), with the state’s two largest reservoirs, Lake Shasta and Lake Oroville, at 110% and 100% of average, respectively. In the Southwest, the U.S. Bureau of Reclamation is reporting (July 19) Lake Powell at 22% full (34% of average for the date; lowest on record for the date in the last 30 years), Lake Mead at 27% full (45% of average for the date; lowest on record for the date in the last 30 years), and the total Colorado River system (July 19) at 33% of capacity (compared to 39% of capacity the same time last year)…
On this week’s map, drought-related conditions deteriorated across the region including in the Dakotas and Nebraska with reports of rapidly deteriorating conditions. The recent anomalously hot temperatures and deteriorating drought-related conditions led to the South Dakota Governor issuing a drought emergency executive order last week. In terms of drought impacts, the National Drought Mitigation Center’s Condition Monitoring Observer Report (CMOR) drought impacts reporting system is showing numerous impact reports across the Dakotas during the past 30 days. For the week, average temperatures were 4 to 10+ °F above normal across the Dakotas and Nebraska. Looking at climatological rankings for the past 30-day period, several locations logged near-record dryness including Omaha, NE (3rd driest on record; -3.16 inches); Grand Island, NE (5th driest; -3.05 inches); and Rapid City NWS Weather Forecast Office, SD (5th driest; -1.48 inches)…
On the map, drought-related conditions continued to deteriorate in areas of eastern Colorado, southeastern Wyoming, and portions of southern Idaho, while improvements were made in central and northern Idaho and Montana where short-term conditions (past 30 days) improved. In the Southwest, monsoonal thunderstorms delivered much-needed moisture to isolated areas of the Four Corners states and eastern Nevada, while dry conditions prevailed across the western Great Basin and Pacific states. In the Colorado River Basin, Lake Powell is 22% full, while Lake Mead is 27% full, according to the U.S. Bureau of Reclamation. Other reservoirs in the region are experiencing low levels including at Elephant Butte Reservoir in New Mexico (2% of capacity) and Blue Mesa Reservoir in southwestern Colorado (32% full). Looking at climatological conditions for the past month, record or near-record precipitation was observed at the following locations: Nogales, AZ (3rd wettest; +2.43 inch departure from normal); Wilcox, AZ (7th wettest; +2.03 inches); and Flagstaff Airport, AZ (10th wettest; +1.76 inches); Great Falls, MT (wettest on record; +2.29 inches); Glasgow Airport, MT (3rd wettest; +2.88 inches); and Challis Airport, ID (wettest on record; +1.8 inches)…
On this week’s map, improvements were made in drought-affected areas of Texas, Arkansas, and Tennessee. In terms of precipitation during the past week, moderate to heavy rainfall accumulations (ranging from 5 to 15+ inches) were observed in the Hill Country of Texas bringing much-needed relief to the long-term drought situation and low reservoir levels. However, the torrential rains also led to severe and dangerous flash flooding across areas of the region. Looking at the reservoir situation, Water Data for Texas (July 22) reports statewide reservoirs at 78% full, with eastern reservoirs in good condition while numerous western and southern reservoirs remain below normal. In Tennessee, precipitation during the past 30-day period was above-normal across much of the western part of the state, leading to improvements on the map. Looking at climatological rankings for the past 30-days, record to near-record precipitation was observed in areas of the region, including in Junction, TX (2nd wettest on record; +5.44 inch departure), San Angelo, TX (9th wettest; +2.49 inches), Del Rio, TX (3rd wettest; +5.86 inches) and Shreveport Airport, LA (wettest; +8.36 inches). Average temperatures for the week were above normal across most of the region (1 to 5 °F)…
Looking Ahead
The NWS Weather Prediction Center 7-Day Quantitative Precipitation Forecast calls for the heaviest precipitation accumulations across portions of the Mid-Atlantic states, where precipitation accumulations generally ranging from 2 to 7+ inches are expected, with the highest amounts primarily across the coastal plains of southern Virginia and the Carolinas. Across areas of the interior Southeast, including northern portions of and Georgia as well as eastern Tennessee, precipitation accumulations generally ranging from 1 to 3+ inches are expected. In isolated areas of the Northeast, and central Plains, precipitation accumulations generally ranging from 1 to 2 inches are expected. In Texas, light to moderate accumulations (2 to 4 inches) are expected in areas of the South Texas Plains. In the West, the higher elevations of areas of the central and southern Rockies and portions of the Southwest, including the Mogollon Rim of Arizona, localized precipitation accumulations of 1 to 2+ inches are expected.
The NWS 6–10-Day Temperature Outlook (valid July 27–31, 2026) favors above-normal temperatures across most of the contiguous United States, with the highest probabilities centered across much of California, Great Basin, central and southern Rockies, Plains states, Texas, and western portions of the Midwest. Above-normal temperatures are also favored across much of the South and Southeast regions. Conversely, below-normal temperatures are favored in the Pacific Northwest in western Washington, much of the Northeast, and Alaska, while near-normal temperatures are expected across portions of the Mid-Atlantic.
The NWS 6–10-Day Precipitation Outlook favors above-normal precipitation across areas of the Pacific Northwest (Washington), portions of the Southwest and central Rockies, and along the Eastern Seaboard from Florida to Maine. Below-normal precipitation is favored across eastern portions of the central and southern Plains, Texas, South, and Midwest.
Drought Monitor one week change map ending July 21, 2026.
Photograph of fresh tomatos in Mexico, provided by Storyblocks
By Robert Marcos
The excessive pumping of aquifers in the San Quintín Valley in Baja California is threatening the long-term reliability of tomato and berry exports to the United States. Because the freshwater aquifers sit near the ocean, the overpumping has resulted with an intrusion of saltwater.
Groundwater in the San Quintín Valley, Baja California, is critically overexploited and heavily contaminated by saltwater intrusion. Pumping rates exceed natural recharge by millions of cubic meters annually, causing declining water tables and rendering underground sources too brackish for normal agricultural use or human consumption. 1
The San Quintin Valley faces one of Mexico’s most acute water crises. Located in an arid area in the northwestern region of the country, the valley lacks freshwater bodies and is structurally disconnected from other regional supply sources. To meet the water demand in the region, water is drawn from local underground aquifers, which have been subjected to increasing pressure due to overpumping and prolonged drought conditions. Current underground sources are insufficient and do not have the required water quality. The Colorado River is the region’s only other potential source of water, but it is 167 miles away and its viability is in question. 2
In 2024, the Mexican National Water Commission (CONAGUA) published three technical studies confirming the overexploitation of the four aquifers in the SQV—San Simon, San Quintin, Camalu and Vicente Guerrero—by a volume of 68.5 million cubic meters per year, jeopardizing the long-term viability of these sources. The groundwater has high levels of total dissolved solids, ranging between 1,540 and 11,000 parts per million (ppm), which is between 1.5 and 11 times higher than the maximum limit of 1,000 ppm established by Official Mexican Standard NOM-127-SSA1-2021 for water intended for human consumption. It is important to note that, due to insufficient water distribution infrastructure, low population density and overexploitation of the aquifers in the SQV, the local water utility, Comisión Estatal de Servicios Públicos de Ensenada (CESPE), is only able to supply potable water intermittently to 56% of the population through the distribution system, while the rest of the community relies on hauled water for their supply. This sporadic service increases the risk of cross-contamination within the pipelines due to backflows and leaks, as well as through the water storage methods used by residents, further compromising the safety of the water available for human consumption.3
Desalination considerations
A public desalination plant would provide a reliable source of clean, affordable drinking water to over 110,000 residents in San Quintín, drastically improving public health and daily life by reducing reliance on expensive, privately trucked water tankers (pipas). Because local groundwater wells are heavily contaminated with saltwater and unsafe for domestic use, this plant would bypass the degraded aquifers to deliver potable tap water directly to homes through a new macro-distribution pipeline network. 4
However, implementing desalination in San Quintín faces several steep hurdles:
Power Grid Limitations: The regional Federal Electricity Commission (CFE) power grid lacks the high-voltage capacity required to run a large-scale desalination facility, necessitating massive energy infrastructure upgrades before the plant can operate.
Brine Disposal: Safely discharging the highly concentrated leftover saltwater (brine) back into the ocean requires careful management to prevent destroying the fragile marine ecosystems and local fisheries.
High Operational Costs: Desalination is an energy-intensive process, making the final tap water expensive to produce and requiring long-term government subsidies to keep it affordable for low-income residents.
Financing and Bureaucracy: The project has historically suffered from prolonged political shifts, contractual re-negotiations, and delays in securing international development bank funding.
Ruedi Reservoir on the Fryingpan River is operated by the U.S. Bureau of Reclamation. Releases for the Colorado River Endangered Fish Recovery Program have boosted late summer and fall river flows in recent years. Credit: Heather Sackett/Aspen Journalism
Click the link to read the article on The Aspen Times website (River Stingray). Here’s an excerpt:
July 13, 2026
The city of Aspen’s Ruedi Hydroelectric Facility is anticipated to lose hydroelectric power in early August due to current U.S. Bureau of Reclamation reservoir forecasts and operating conditions. The updated reservoir data indicate that the timing has shifted later than previously anticipated, which the city’s Utilities Resource & Portfolio Manager Joshua Mattson confirmed to The Aspen Times. According to him, earlier planning projections that were provided by the U.S. Bureau of Reclamation indicated the reservoir could drop below the hydroelectric power pool threshold in mid- to late July.
“Updated reservoir elevations, inflow and outflow conditions, and U.S. Bureau of Reclamation operational forecasts now indicate the threshold is more likely to be reached in early to mid-August,” Mattson wrote in an email. “The shift reflects actual reservoir conditions improving relative to earlier projections and ongoing changes in reservoir operations and water demand. This remains a forecast and will continue to be evaluated as conditions evolve.”
The hydroelectric power pool represents the minimum reservoir elevation that is required in order to safely operate the hydroelectric turbine and associated equipment, according to an information update provided to Aspen City Council on Monday. When reservoir levels fall below this threshold, city staff will consequently take the Ruedi Hydroelectric Facility offline in order to protect equipment.
“This outage is not related to dam safety; rather, it is the result of hydrologic limitations associated with drought conditions,” the information update states. “The facility is expected to remain offline until reservoir levels recover above the minimum power pool elevation, which is anticipated to occur in spring 2027 as seasonal inflows increase.”
In the 1950s, the U.S. Bureau of Reclamation built the Blue Mesa, Morrow Point and Crystal dams west of Gunnison as part of the massive regional Colorado River Storage Project. The Bureau of Reclamation is currently in the process of replacing all four original valves at Blue Mesa Dam for the first time. (Photos/National Park Service)
The Wayne N. Aspinall Unit, Colorado’s only stake in a federal hydropower system that sells power across the West, is on pace to generate nearly 30% less electricity than its historical average dating to 1978, according to the Bureau of Reclamation. The shortfall is the latest sign of a decades-long decline eroding a system that accounts for about 3% of Colorado’s energy supply.
Aspinall Unit dams
The unit’s three dams on the Gunnison River — including Blue Mesa, Morrow Point and Crystal — make up Colorado’s only piece of the Colorado River Storage Project, a Depression-era network of federal dams selling power to municipalities, cooperatives, tribes and irrigation districts across the West. Blue Mesa Reservoir, the largest body of water entirely within Colorado, is expected to end the year at just 17% of its live storage capacity.
As the river shrinks under the stresses of climate change, so does the unit’s output. And the electricity that the waterway does not help to generate has to come from somewhere else, usually at a higher price.
Nationwide, residential electricity users have already seen an annual price increase of more than 7% in the year ending in March. Judging by Xcel Energy’s recent effort in Colorado to obtain rate increases that might exceed 50% by the end of the decade, additional hits to consumers’ budgets could become the most obvious consequence of the building crisis in the Colorado River Storage Project’s capacity to generate power.
That economic scenario is unfolding as the West braces for a surge in electricity demand from data centers built to power artificial intelligence. On June 18, the Federal Energy Regulatory Commission boosted the effort to hook up those large users when it ordered the nation’s six grid operators to speed transmission connections for AI data centers.
“We are setting the stage for a resilient, reliable, and forward-thinking grid that empowers communities and safeguards consumers by transforming the way large energy users access the grid,” agency chair Laura Swett said.
It’s a lopsided moment, since federal regulators are accelerating new demand onto a grid whose supply side, at least in Colorado, is apparently decaying.
A dangerous threshold
The mechanics of Colorado’s hydroelectricity system are straightforward, even if mostly invisible to consumers. Reclamation operates the dams. The Western Area Power Administration markets the power to “preference customers” at cost-based rates. The Aspinall Unit’s output is pooled with Glen Canyon, Flaming Gorge, and other project dams under the Salt Lake City Integrated Projects Area arrangement, so Colorado utilities hold a share of that pool, not an Aspinall-specific allocation.
Less water also means less pressure, or “hydraulic head,” through the turbines: At full pool, one megawatt-hour at Glen Canyon Dam on the Colorado River takes about 1.9 acre-feet of water and, at today’s lower elevations, roughly 2.9 acre feet, said Jen Pelz of the Flagstaff, Arizona-based Grand Canyon Trust, an environmental organization that advocates for conservation of Colorado Plateau natural resources.
The same mechanism plays out at Blue Mesa. At its current elevation of about 7,446 feet, the reservoir’s generating capacity is approximately 18% below the amount for which it was designed, said Nick Williams, Reclamation’s power manager for the Upper Colorado Basin. Electricity generation stops entirely at 7,393 feet, Blue Mesa’s minimum power pool.
A high desert thunderstorm lights up the sky behind Glen Canyon Dam — Photo USBR
Reclamation moved aggressively this spring to avoid a more dangerous threshold. In April, it projectedinflow at Lake Powell, behind the Glen Canyon Dam, at just 29% of average and warned that without action, the reservoir could fall below its minimum power-pool elevation of 3,490 feet by August. That is the point at which Glen Canyon Dam’s turbines stop generating.
View below Flaming Gorge Dam from the Green River, eastern Utah. Photo credit: USGS
While the agency issued a more optimistic prediction in May, it nevertheless ordered additional emergency releases from Flaming Gorge Reservoir through April 2027 and cut Powell’s release to Lake Mead for the year by roughly 1.5 million acre-feet. That protects Glen Canyon’s generators, partly by drawing down Mead, which has in turn already cut Hoover Dam’s generating capacity by an estimated 5% to 8.5%. The Hoover Dam power production decline is already reflected in the agency’s June forecasts, according to Len Schilling, the Reclamation official overseeing dam operations in the Lower Colorado Basin. None of the agency’s moves solve the shortage. Instead, Reclamation decides, reservoir by reservoir, where the pain lands first.
A test of the cost gap
The clearest documented example of that pain in dollars comes from the Western Area Power Administration’s own numbers. From fiscal 2023 through 2025, the agency paid more per megawatt-hour for replacement power than it charges customers every year and roughly tripled its rate in 2023, narrowing to about 35% above it by 2025, according to a Colorado Newsline analysis of WAPA and federal energy data. WAPA also spent $18.9 million in 2024 and $6.5 million in 2025 on replacement power tied to “Cool Mix,” a protocol that bypasses Glen Canyon’s turbines to protect native fish downstream, according to a Colorado River Research Group report drawing on an Argonne National Laboratory analysis and figures from WAPA.
Platte River Power Authority, which supplies Fort Collins, Loveland, Longmont and Estes Park and holds a direct WAPA allocation, could be the clearest Front Range-based test of that cost gap. A spokesperson for the utility said it could not respond to questions before publication. A recent organization budget cited reduced federal deliveries and rising WAPA rates as adverse financial factors, but current estimated financial consequences for the power authority, and what it will mean for the utility’s customers, remain unclear. WAPA did not respond to requests for comment.
A smaller utility in the state offers a contrasting situation. La Plata Electric Association, the rural cooperative serving Colorado’s southwest corner, relies mostly on the Southwest Power Pool for its electricity supply after joining that regional transmission organization earlier this year. But the association’s chief executive officer, Chris Hansen, said the cooperative still relies on WAPA for a hydropower allocation tied to the Southern Ute Indian Tribe. That WAPA dependence amounts to about 3% of the association’s supply. Hansen said market access and a diversified portfolio buffer the small utility against hydrologic risk.
“Even if that 3% were to double in cost, which is possible, it would have a relatively small impact on our total cost of power purchases,” he said. “So we have low exposure. Other co-ops do not. For us it would be (a) relatively small change.”
Whether joining the Southwest Power Pool can give utilities facing more financial pressure much hedge against rising power costs is not yet clear. Sydney Welter, an energy markets policy advisor at Western Resource Advocates, explained that “with just three months of market operations and without having seen data from Colorado preference customers, I’m not certain what the long-term costs and benefits will be.” While the Brattle Group, an industry watcher, predicted that utilities would save tens of millions of dollars per year by joining power pools, it is not clear whether that is happening.
Rise in demand
Colorado lawmakers considered a bill this year that would have imposed accountability requirements on data centers. Senate Bill 26-102 was killed before the General Assembly adjourned in May, though the issue isn’t likely to fade. Xcel Energy, the state’s largest utility, expects large industrial customers, mostly data centers, to drive roughly two-thirds of its new demand. Nationally, data centers consumed an estimated 4.7% of U.S. electricity, a figure that Lawrence Berkeley National Laboratory projects could reach nearly 12% by 2030. Increasing data center electricity use in Colorado would add pressure to a system that is already experiencing supply reductions caused by the loss of flows at the Aspinall Unit.
That framework also shapes the deeper risk involving a “compact call” to the Lower Basin states demanding delivery of more water from Colorado, New Mexico, Utah and Wyoming. That has never happened in the Colorado River Compact’s history, but it could increase pressure on Western Slope water and power as Front Range cities lease senior water rights across the Continental Divide, according to University of Wyoming law professor Jason Robison.
Dories at rest on a glorious Grand Canyon eve. Photo by Brian Richter
No one is predicting a call soon. But Pelz argues the standoff between electricity costs and environmental protection is a false choice: The Grand Canyon Protection Act of 1992 already requires dam operations consistent with the river ecosystem’s long-term sustainability, and Congress could have eased the cost pressure through diversified supply or a dedicated fund, but has not done so in the 30 years since that law was enacted. Reclamation is now studying a broader infrastructure fix at Glen Canyon Dam, with initial findings due in 2027.
That may be too late for the pressures already showing up this year at reservoirs like Blue Mesa.
The Colorado River Basin spans seven U.S. states and part of Mexico. Lake Powell, upstream from the Grand Canyon, and Lake Mead, near Las Vegas, are the two principal reservoirs in the Colorado River water-supply system. (Bureau of Reclamation)
As of July 12, Blue Mesa Reservoir near Gunnison sat only 32% full at 266,000 acre feet of storage water — about 35,000 acre feet less than the historic minimum for that date, down 35%…Severe drought conditions at the reservoir have resulted in critically low storage levels, a limitation on water allocation to the Uncompahgre Valley and its agricultural water users, limited flows for releasing endangered fish species, decreased recreational opportunities on the water that go hand-in-hand with a downturn in the regional recreational economy, and uncertainty over power generation and water usage in the near future. Colorado River District spokeswoman Lindsay DeFrates called it a “crisis”, as the reservoir and the Wayne N. Aspinall Unit — which stores water and generates hydroelectric power through the reservoir as well as the Morrow Point and Crystal Reservoir dams — is one of the upper units that feeds the crucial Lake Powell downstream.
“Everyone’s looking downstream at Lake Powell while we have this happening in our backyard right now,” DeFrates said…
Black Canyon July 2020. Photo credit: Cari Bischoff
When he was the Division 4 assistant engineer for the Colorado Division of Water Resources (DWR), Jason Ullmann would have never entertained the notion that the Black Canyon of the Gunnison National Park’s portion of the river could ever dry up. Now, as the DWR director and Colorado state engineer, he said it’s unlikely to happen this year or next — but it’s “not an impossibility.”
“The actual inflow from April to July this year was the lowest on record. Barring a change in the climate conditions that produce this monsoon everybody’s waiting for, it doesn’t seem like we’re going to have a significant increase in inflow. We’re going to have one of the lowest inflow seasons — if not the lowest — on record at Blue Mesa,” Ullmann said. “Blue Mesa started the year approximately 20 feet below the normal level it would start the year on. The water levels are very low and will continue to drop.”
Colorado River District Senior Water Resources Engineer Caleb Foy compared 2026 to some of the region’s driest years — 1977, 2002, 2012 and 2018 — and said 2026 “takes the gold medal in terms of poor hydrological conditions”, impacting water storage at Blue Mesa Reservoir which, in turn, has multiple impacts downstream…
Foy noted that the reservoir’s storage could drop below the power pool level, which is the minimum amount of water needed to produce hydropower from the dam. According to the U.S. Bureau of Reclamation’s June 2026 24-month study, this drop could happen as soon as February 2027. According to other forecasts, this drop could happen as soon as the end of this summer if the region sees no monsoon conditions and current operations aren’t modified to preserve storage at the reservoir…A reduction in downstream flow would negatively affect downstream diversions, Colorado River flow, the Black Canyon of the Gunnison, and endangered fish species in both the Gunnison and Colorado rivers. The BOR has worked with Fish and Wildlife to temporarily reduce flow targets while trying to minimize negative impacts to endangered fish species. Ullmann said the minimal target flow for the Endangered Fish Recovery Rights is, in a typical year, no lower than 750 cubic feet per second. This year, the target is at 750 cfs — and last week, the flow was as low as 700 cfs. This has been alarming enough to spark conversations between the state and the BOR.
This field in the Uncompahgre Valley Water Users Association district has been fallowed this season (2026) due to a lack of water. The state of Colorado announced Wednesday that it will set up a conservation program using federal dollars, which means more fields on the Western Slope could soon look like this. CREDIT: HEATHER SACKETT/ASPEN JOURNALISM
In the culmination of a process that has been years in the making, Colorado officials Wednesday announced the creation of a state-run water conservation program.
In what officials are calling a “near-term contribution program,” the Upper Basin states (Colorado, New Mexico, Utah and Wyoming) will pay water users to voluntarily cut back in 2027 and 2028, using $100 million in promised funding from the U.S. Bureau of Reclamation. Colorado will now join Utah and Wyoming in setting up a conservation program within their respective states.
The noteworthy, long-expected announcement came at the regular July meeting of the Colorado Water Conservation Board, where board members considered the criteria for the program. A draft list says the program must, among other criteria, avoid negative community impacts; encourage contributions from across the state and water-use sectors; incentivize environmental benefits; encourage tribal participation; and build local drought resiliency. The board is scheduled to finalize the program criteria at its September meeting.
These types of conservation programs have traditionally targeted agricultural water users, often seen as the low-hanging fruit for water savings because they use the majority of Colorado River water. But officials are hoping this program will have participation across all water-use sectors, including municipal and industrial.
“I love that it is called a contribution program because that kind of imagines broader participation and engagement,” said board member Taylor Hawes. “So I think that is good. I think the more flexibility we can have, the better in a program like this.”
But details were scant on exactly how much water Colorado will contribute to the program and how the saved water would be used. And although some experts have begun calling for permanent reductions in water use, it remains — for now — a temporary, short-term program.
“We cannot guarantee a certain amount of water will be conserved in a given year because we don’t know how much water our water users are going to get,” said Amy Ostdiek, interstate section chief at the CWCB. “We have been clear that we just can’t do that.”
In a May letter to federal officials, the Upper Colorado River Commission said it has a goal of saving 100,000 acre-feet by the end of September 2028, which marks the end of water year 2028, but only if sufficient federal funding is available and hydrologic conditions allow. Colorado’s share of the Upper Basin’s allocation is 51.75%, meaning Colorado could be on the hook for 51,750 acre-feet over the next two years.
But Ostdiek said they are not at this time discussing a specific target that Colorado or the Upper Basin would have to contribute in exchange for the $100 million from the Bureau of Reclamation.
“We have felt confident that we can generate up to 100,000 acre-feet by 2028,” Ostdiek said in a Q&A session with the media after her presentation to the CWCB. “But really, what we’re going to be focused on is getting robust participation.”
It’s also unclear exactly how the saved water will be used. Officials said it’s not meant for use by the Lower Basin (California, Arizona and Nevada); it will be for the benefit of the Upper Basin. The water will need to have a home in Upper Basin storage buckets — Lake Powell, Navajo, Blue Mesa or Flaming Gorge reservoirs — but how it will fit into broader reservoir operations is unknown. [ed. emphasis mine]
“I think that is going to be the subject of ongoing discussion, exactly how this water is used and characterized,” Ostdiek said. “I think what we know is that it needs to be credited to or subject to the discretion of the Upper Division states in some way.”
Missouri Heights resident Cassie Cerise pets her dog Dinah on her ranch outside of Carbondale in summer 2023. Cerise enrolled the field behind her in the Upper Colorado River Commission’s System Conservation Program, getting paid to not irrigate it. CREDIT: HEATHER SACKETT/ASPEN JOURNALISM
Conservation concept is not new
These types of programs that pay water users to cut back are not new to Colorado, and officials said they are incorporating the lessons learned from previous demand-management studies beginning in 2019, stakeholder input and pilot programs. The state participated in the 2023 and 2024 System Conservation Pilot Program, as well as an earlier version that ran from 2015 to 2018.
But conservation programs remain controversial. The Grand Valley Water Users Association, one of the largest irrigation districts on the mainstem of the Colorado River, did not allow its members to participate in SCPP for fear of negative impacts to other water users in the district.
All of the projects enrolled in SCPP involved agricultural water users on the Western Slope, a potentially risky situation, according to the Colorado River Water Conservation District. The Glenwood Springs-based agency, which represents 15 counties across the Western Slope, had tried to influence the creation of criteria for participation in SCPP to avoid negative impacts to rural agricultural communities.
Ultimately, only the Upper Colorado River Commission determined who got to participate in SCPP. Now, it seems state officials are taking to heart the River District’s recommendations. River District General Counsel Peter Fleming thanked Ostdiek for including some of the criteria that the district had set forth in its principles about how to create a conservation program.
Fleming encouraged the board members to adopt variable pricing to account for the difference in the value of relatively cheap water on the Western Slope versus more-expensive water on the Front Range. Pueblo Water had wanted to participate in SCPP, but the $509 per acre-foot offered in 2024 to Colorado participants was too far below market value.
“You can see the variable economic values of the water assigned there and the need to have variable pricing in order to encourage widespread participation,” Fleming said.
The River District’s position is that the entire burden of a conservation program shouldn’t be borne by the Western Slope, but must also be shouldered by Front Range water providers, who collectively deplete the Colorado River basin by about 500,000 acre-feet a year.
He added that a program should also have a strong element of local control.
“The River District obviously would like to stay involved in this process,” he said.
The creation of a conservation program for Colorado comes at a critical time for the basin, which remains locked in the grip of a historic drought, with combined storage in Lake Powell and Lake Mead at an all-time low since the reservoirs began filling. Although the Upper Basin has argued that it has never used its entire allocation granted by the 1922 Colorado River Compact (and therefore shouldn’t have to cut back), in the face of dwindling flows and calls for conservation from its downstream neighbors, the four states can no longer avoid reducing their water demand.
The Colorado River basin is also in the midst of a management crisis, with the seven states that share the river still unable to find agreement on a new framework after more than two years of failed negotiations. The current guidelines for how shortages are shared and how reservoirs are operated expire this year, and the feds are poised to step in with their own management plan, expected later this month.
The Upper Basin would need separate parallel agreements with Reclamation alongside the federal management plan to account for and get credit for water saved through the contribution program.
In her presentation, Ostdiek gave a preview of Reclamation’s expected plan, which could allow for a pool in Lake Powell to store up to 3 million acre-feet conserved by Upper Basin states. But board chair Barbara Vasquez worried about overestimating the amount of water that could be contributed given the recent historically dry conditions. Farmers and ranchers across Colorado are now experiencing the fallout from the worst snowpack on record in the form of shortages and fallowed fields.
“So prior programs, we spent a lot of money for very little water conserved. I worry that next year may be even worse than this year, and it’s not willingness, but ability,” Vasquez said. Given the water that’s available, she said, “that might disappoint expectations on the part of the negotiators at the table for the Colorado River.”
Aspen Journalism is a nonprofit, investigative news organization covering water, environment, social justice and more. Visit aspenjournalism.org.
Colorado River “Beginnings”. Photo: Brent Gardner-Smith/Aspen Journalism
41% of the Lower 48 states are short/very short, an 8% increase from last week
The driest topsoil conditions are in the West (except CA). The N. Plains and Upper Midwest saw big increases in topsoil short/very short. #droughtpic.twitter.com/lFj9HOtjY9

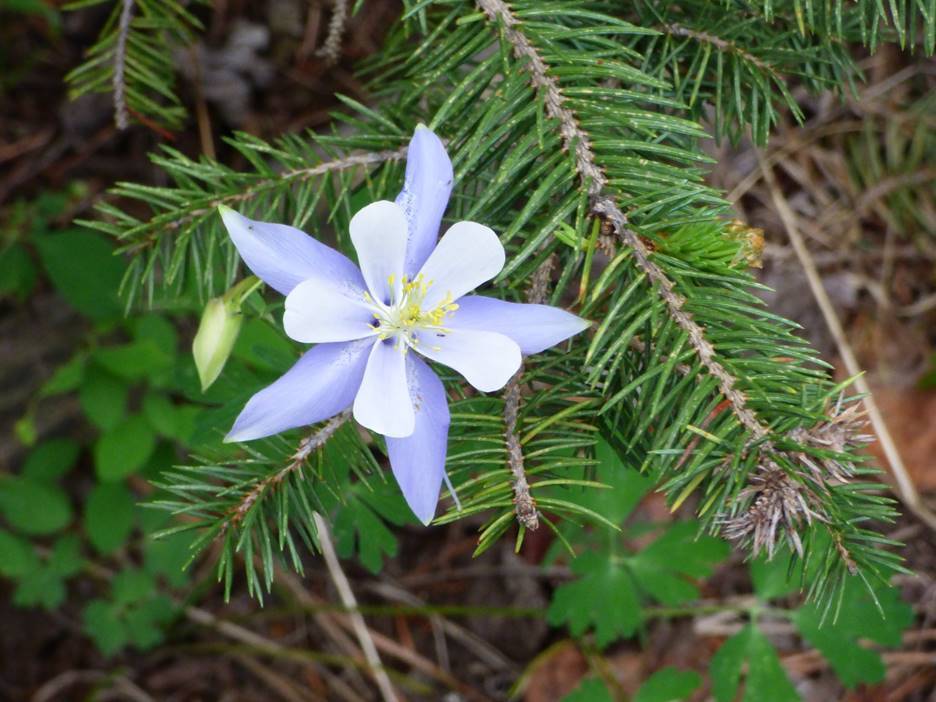
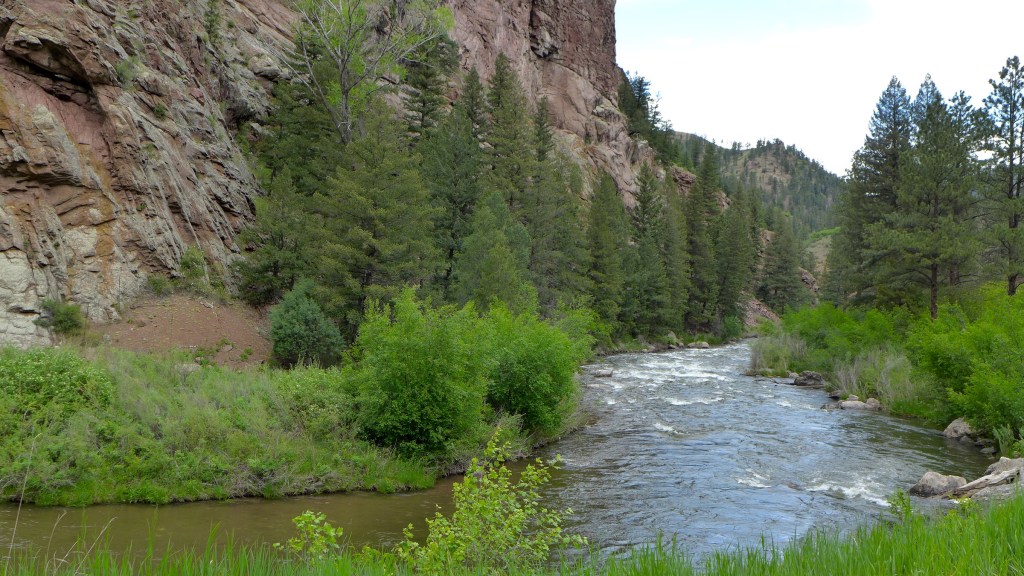

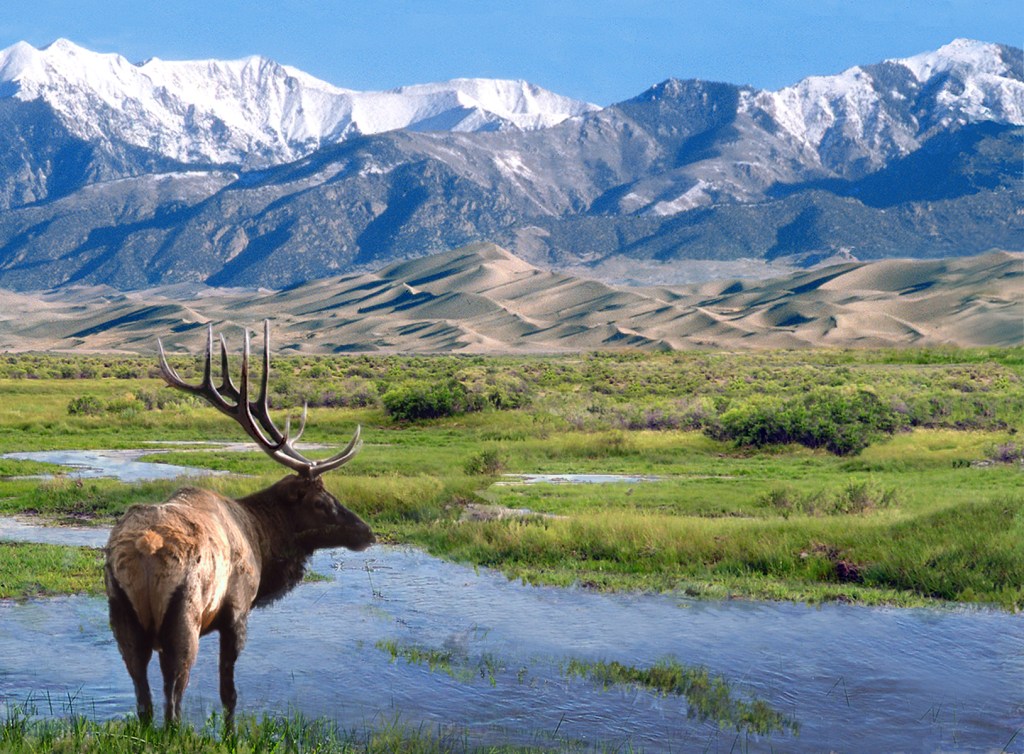


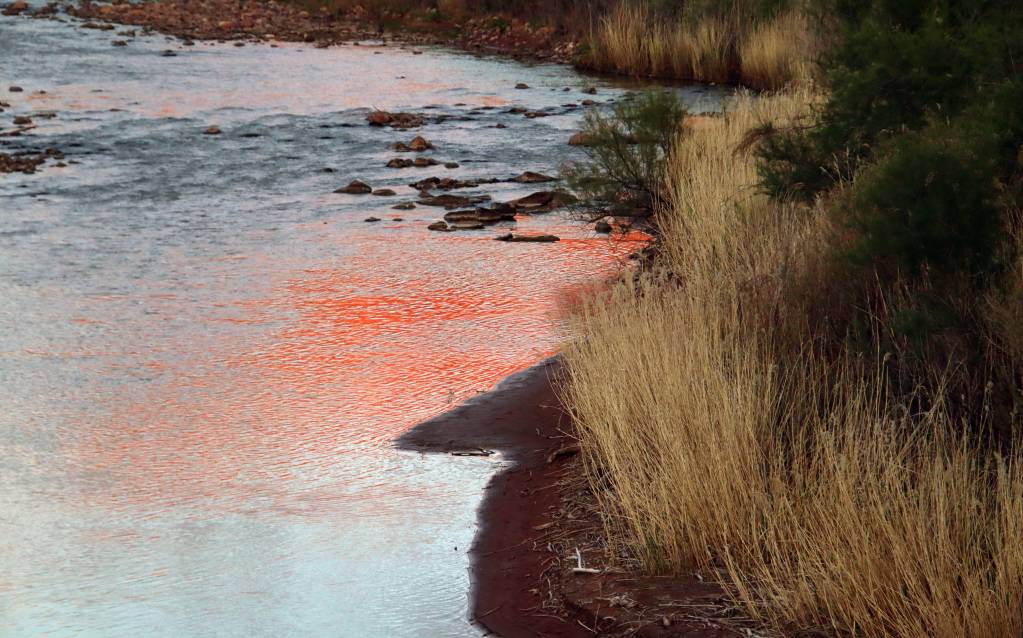
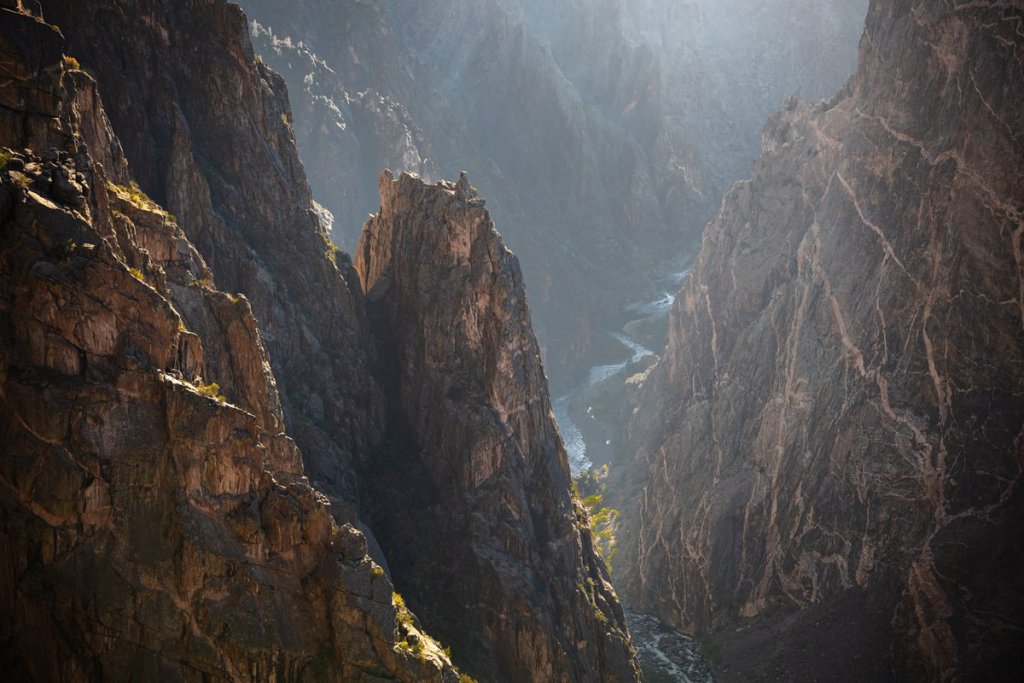


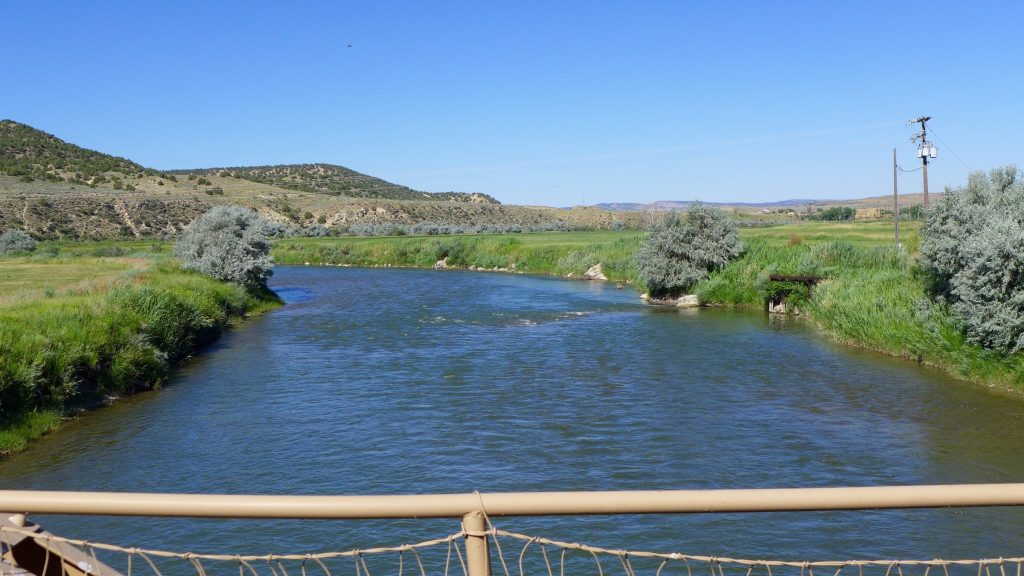
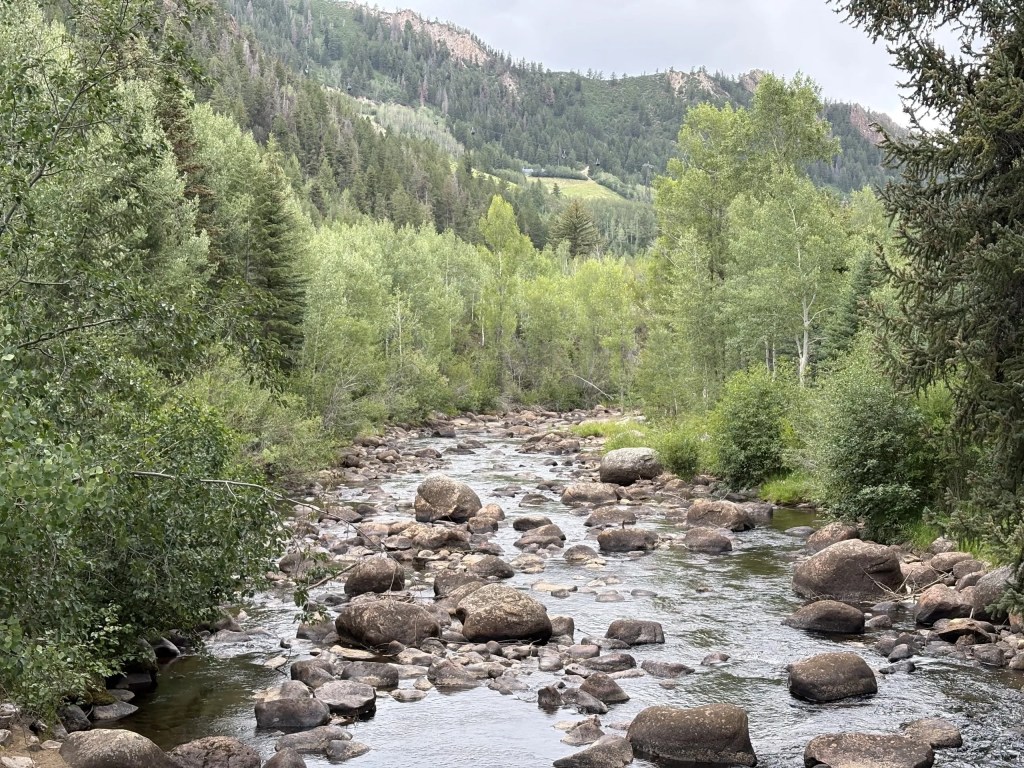
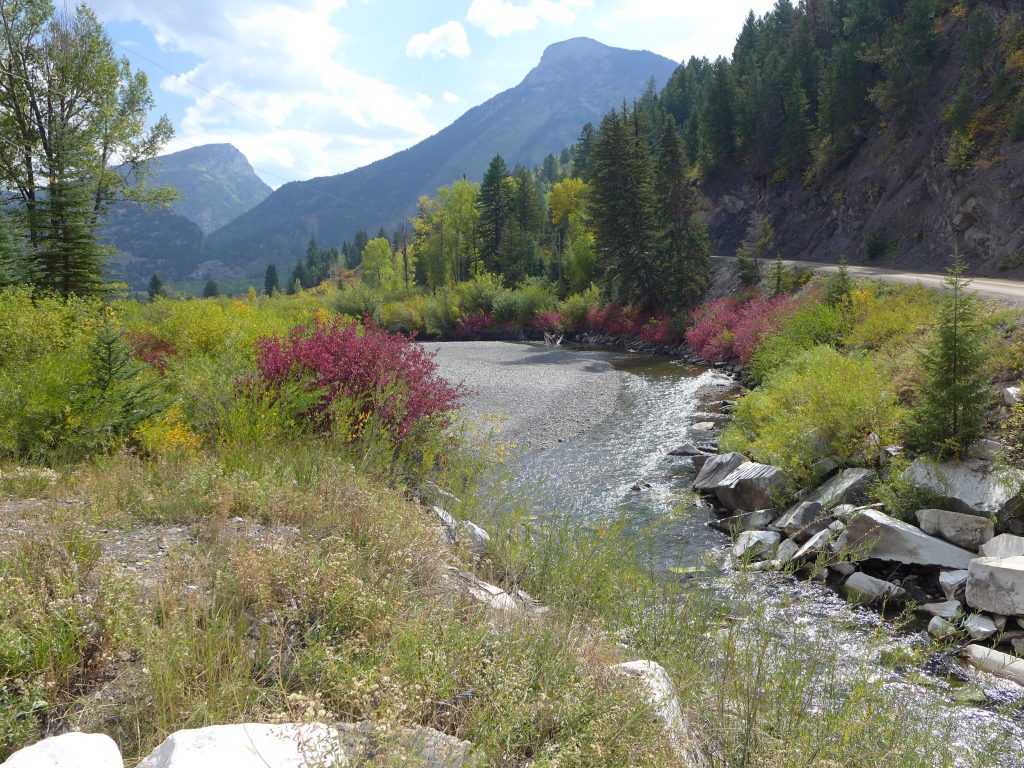
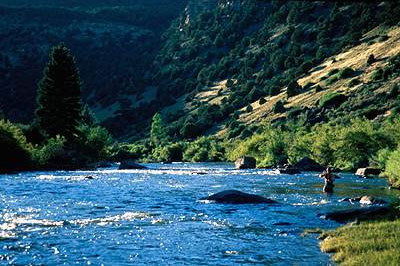
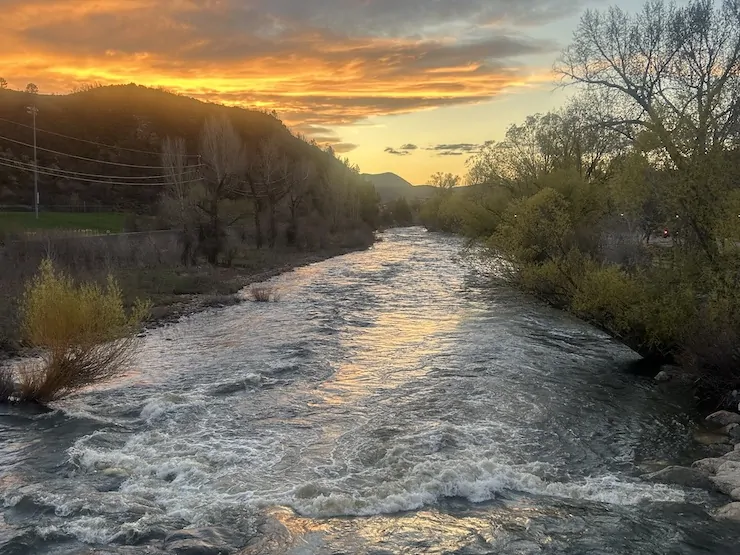
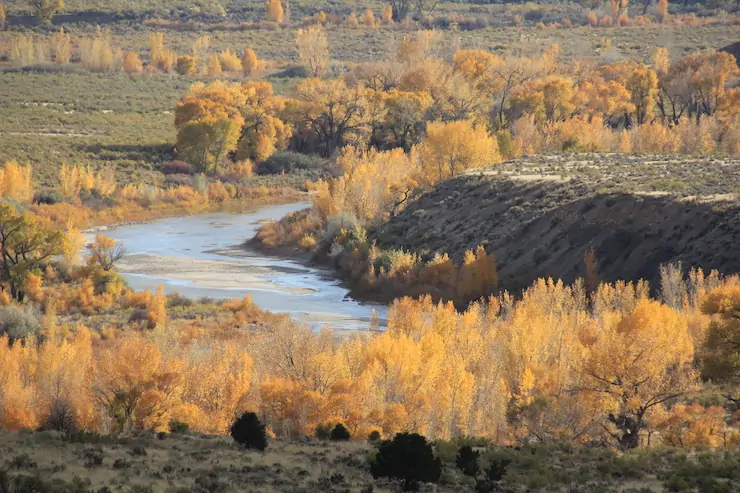


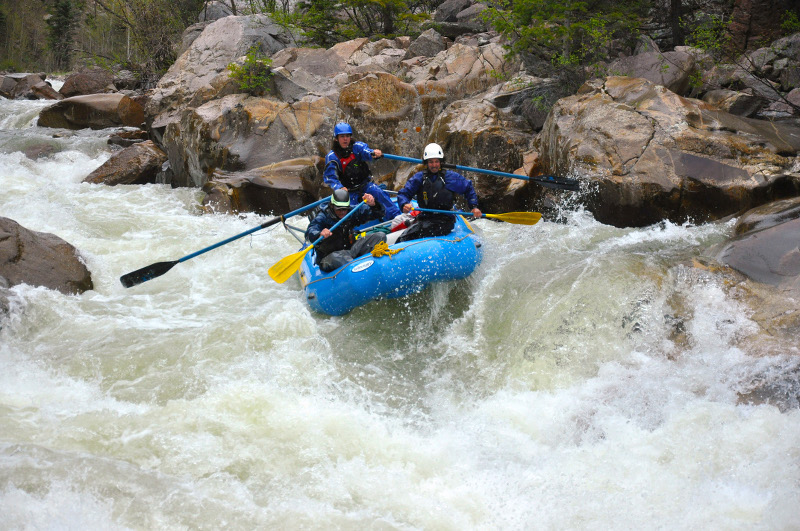


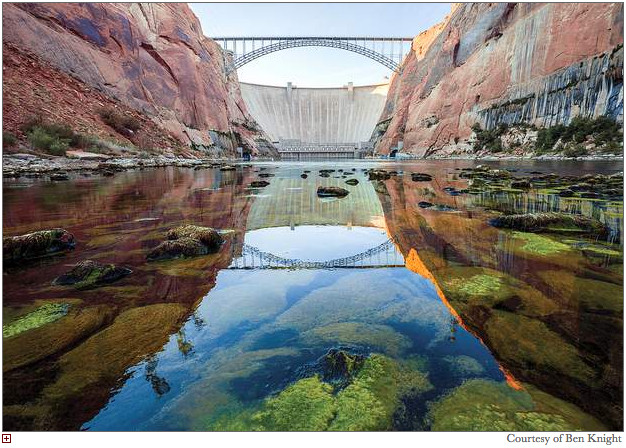
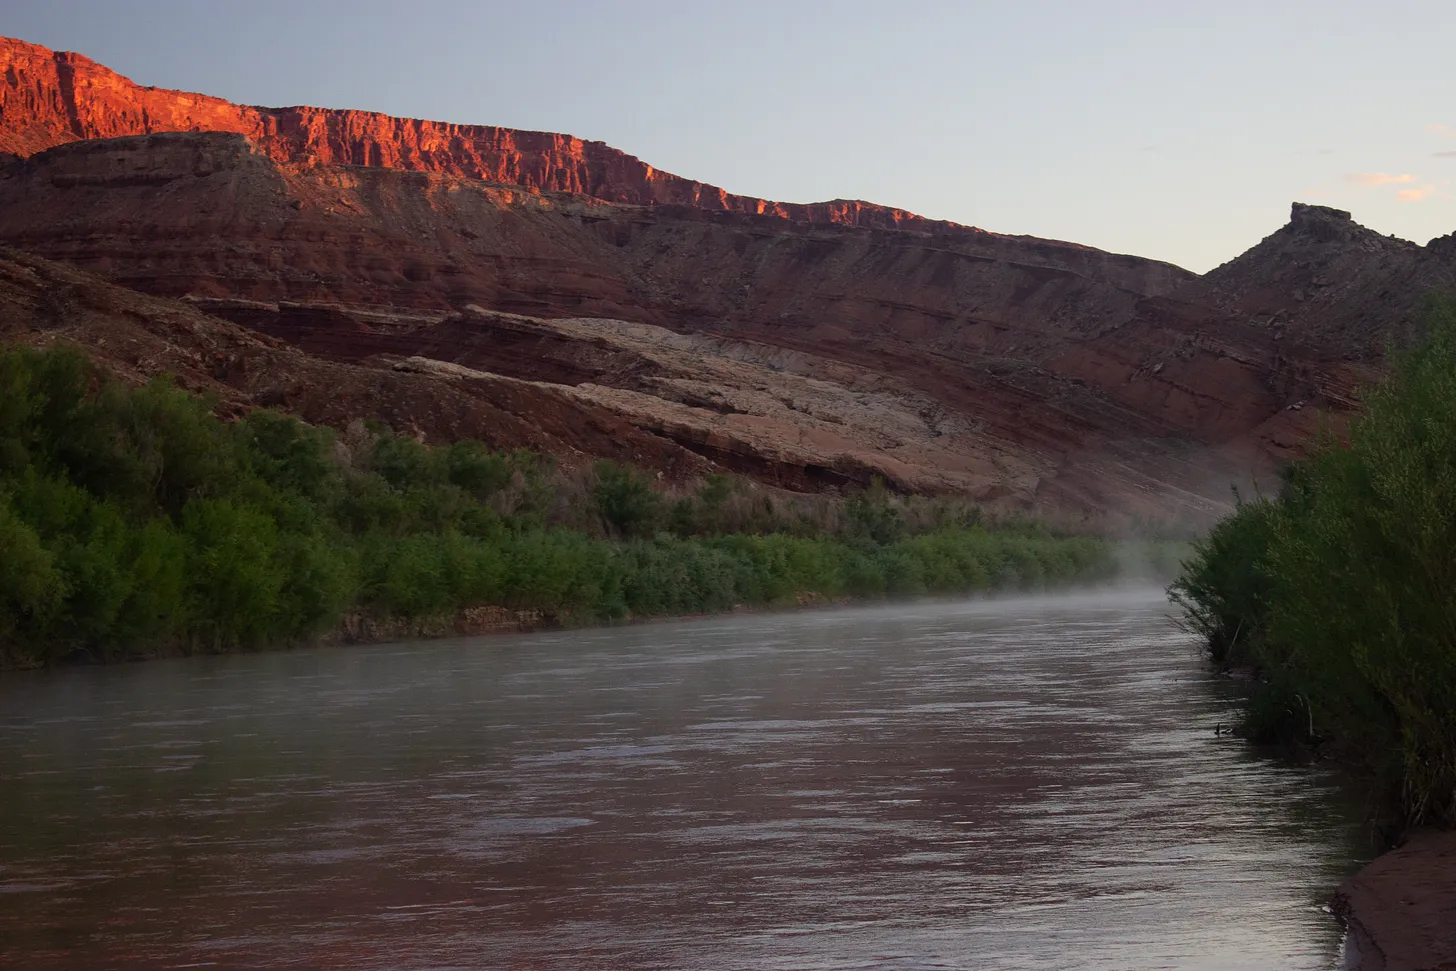
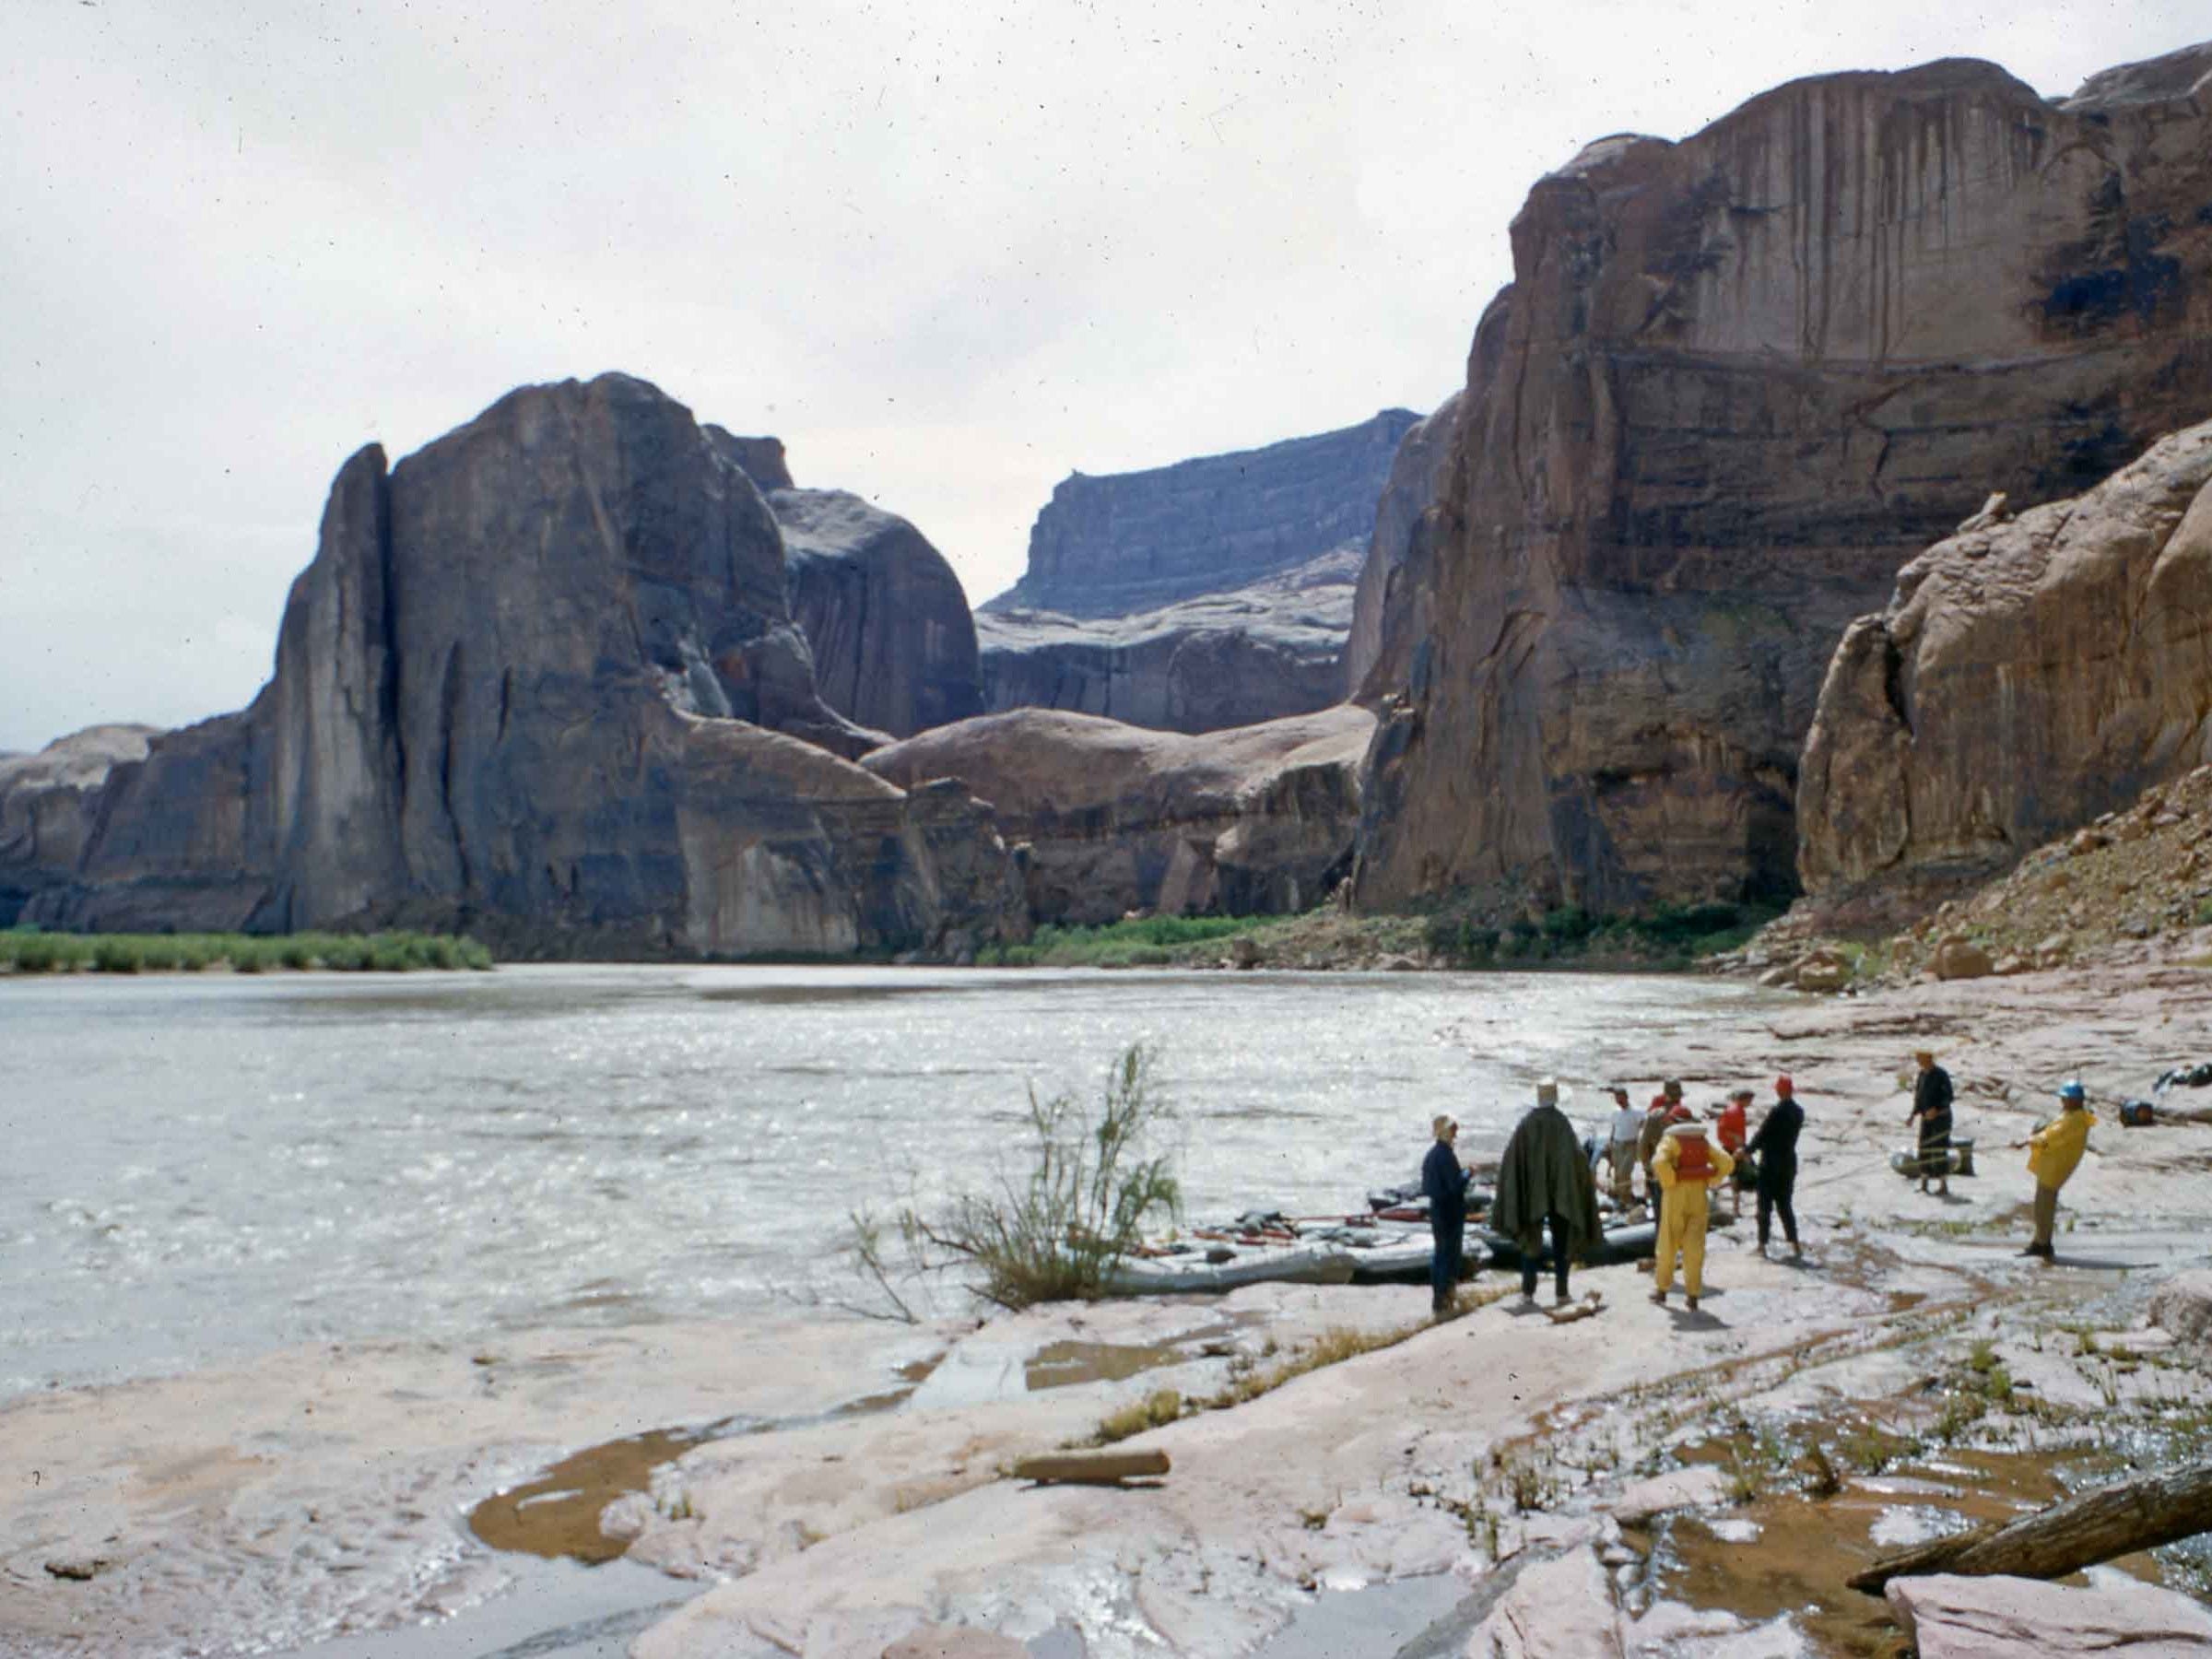

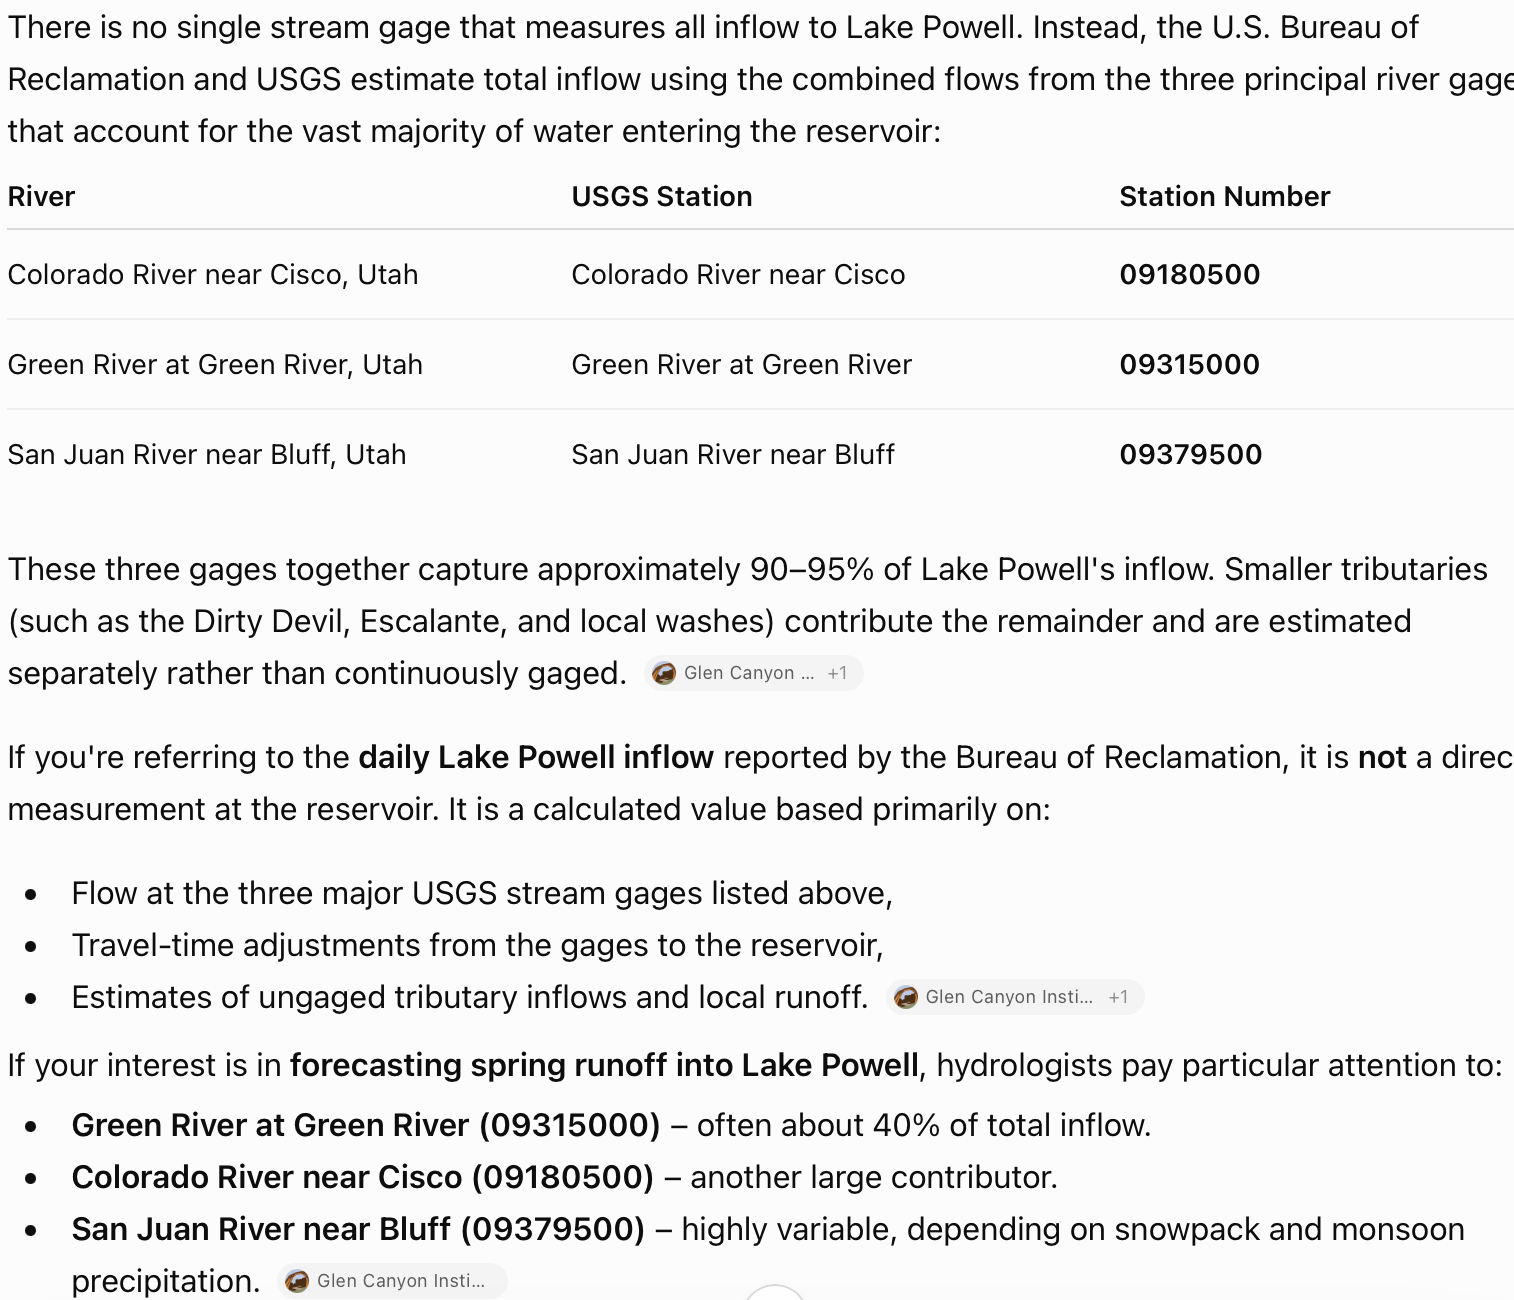
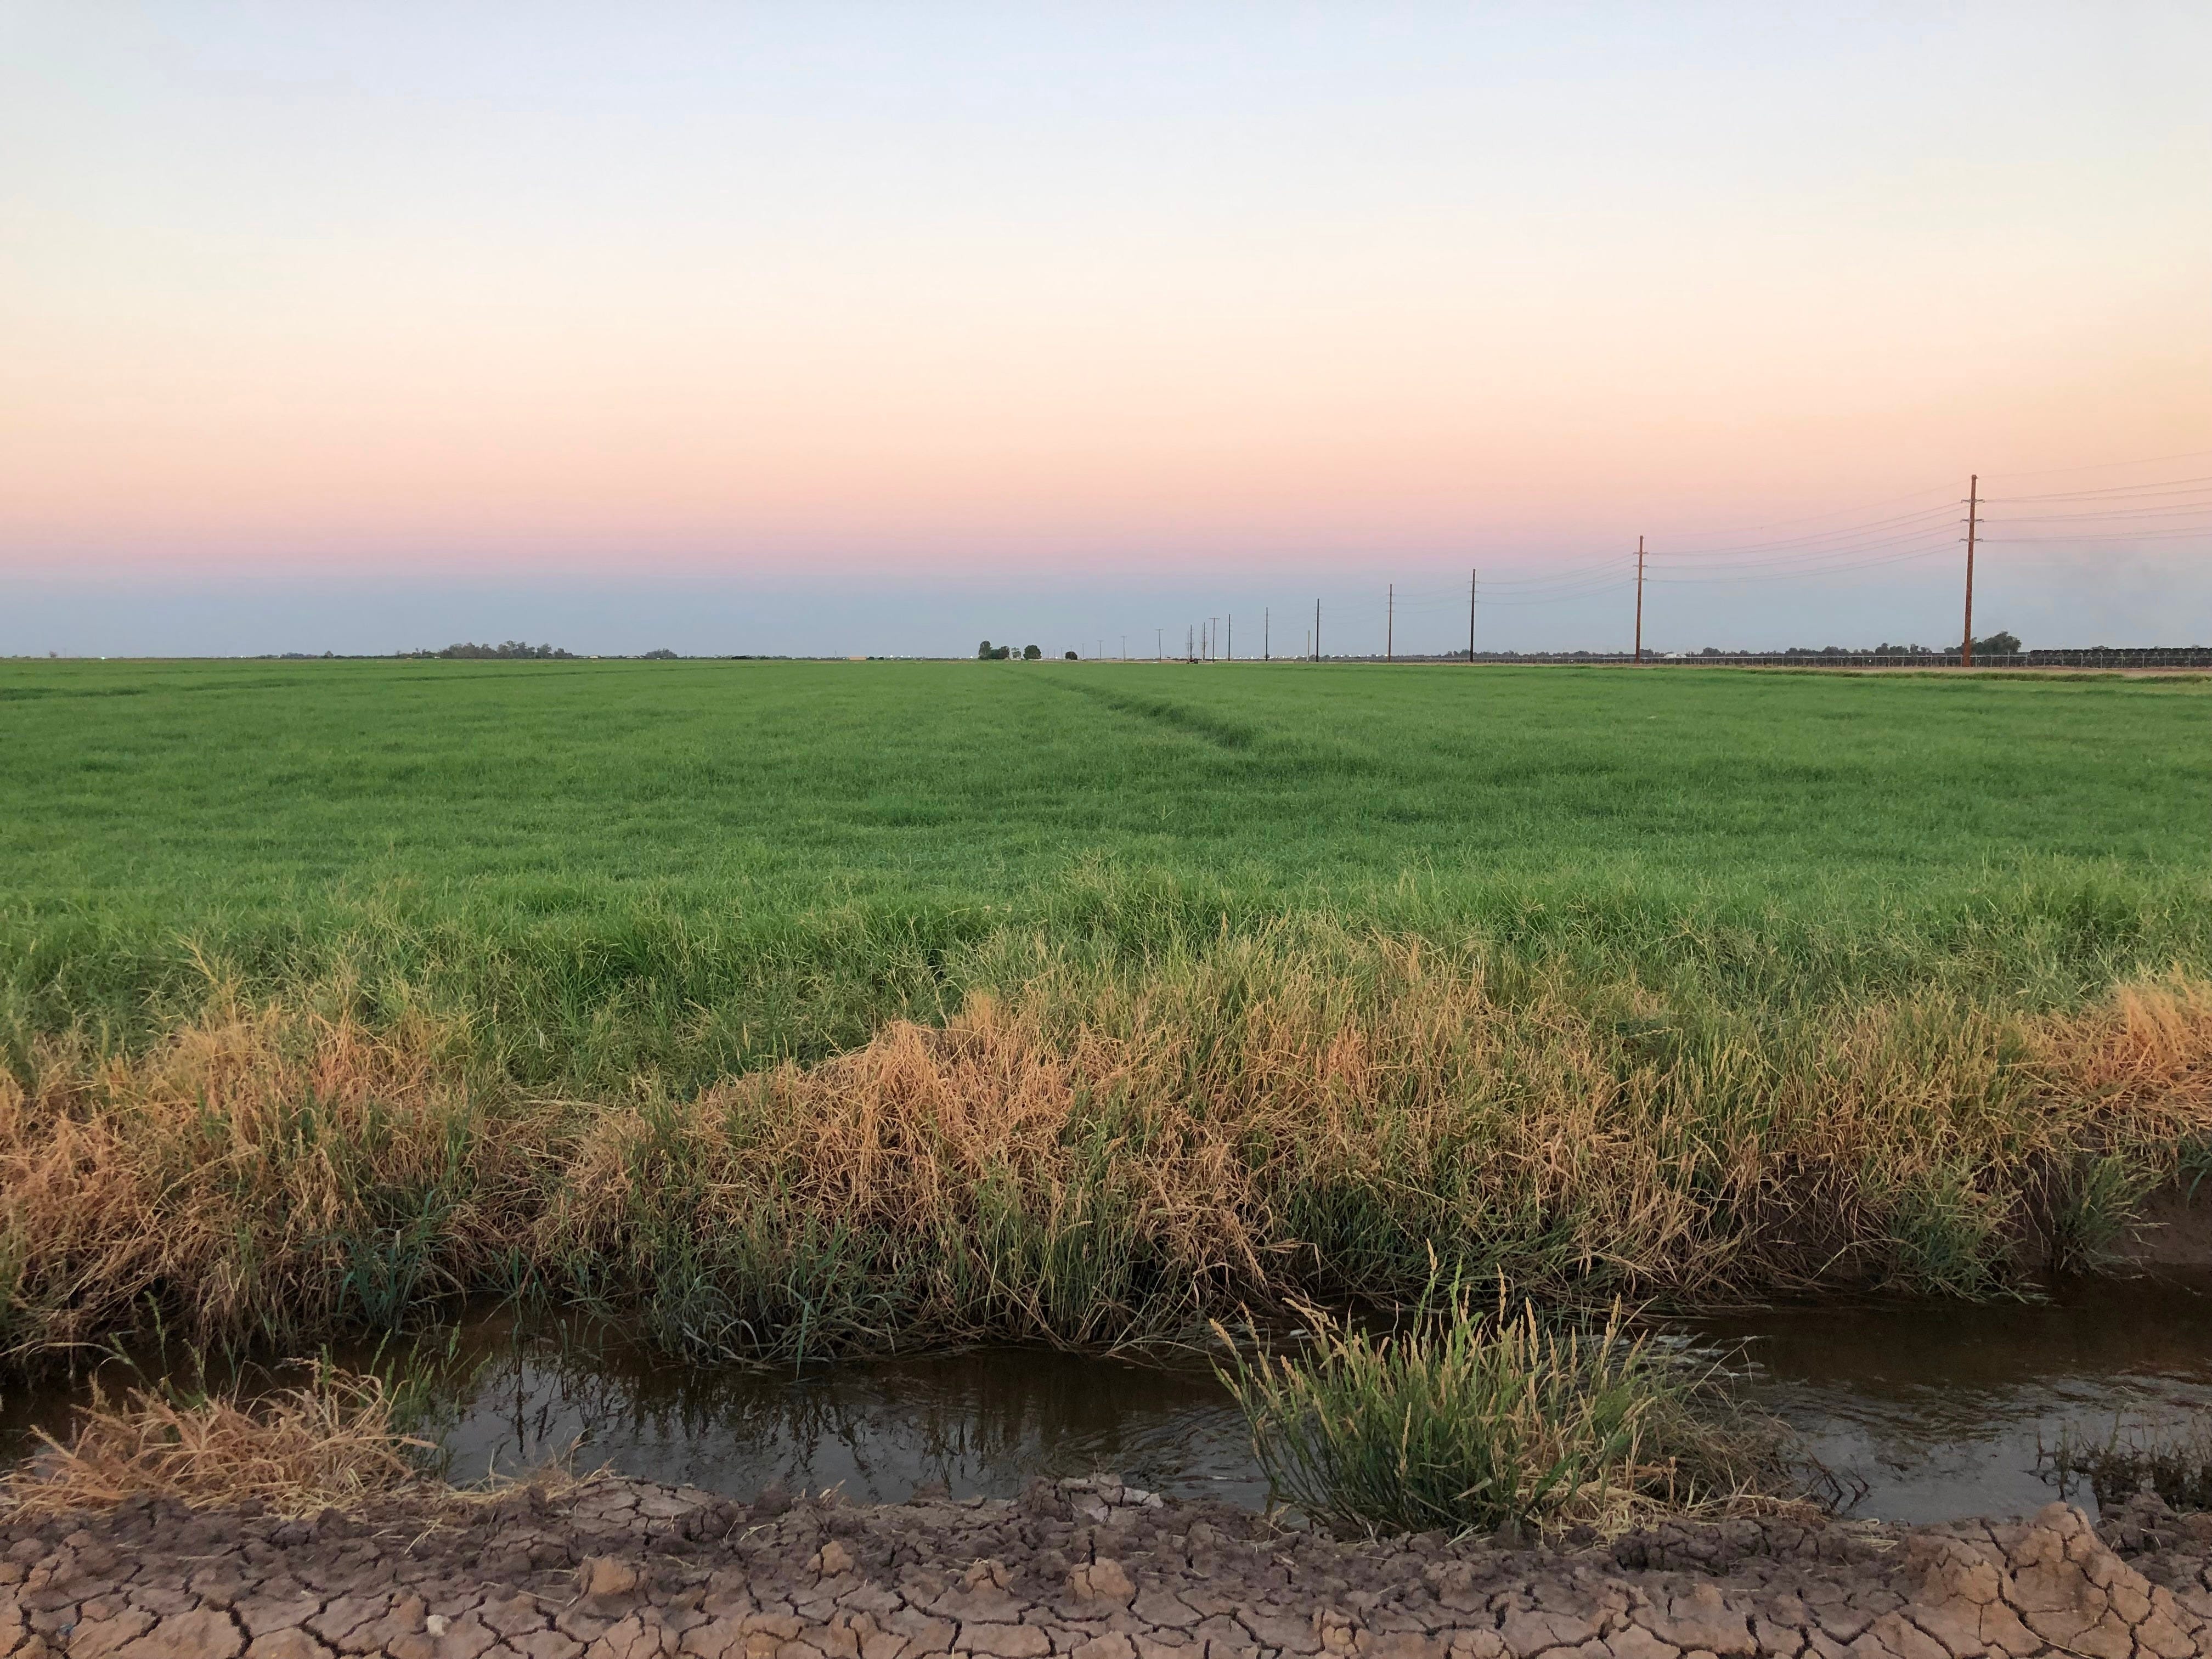

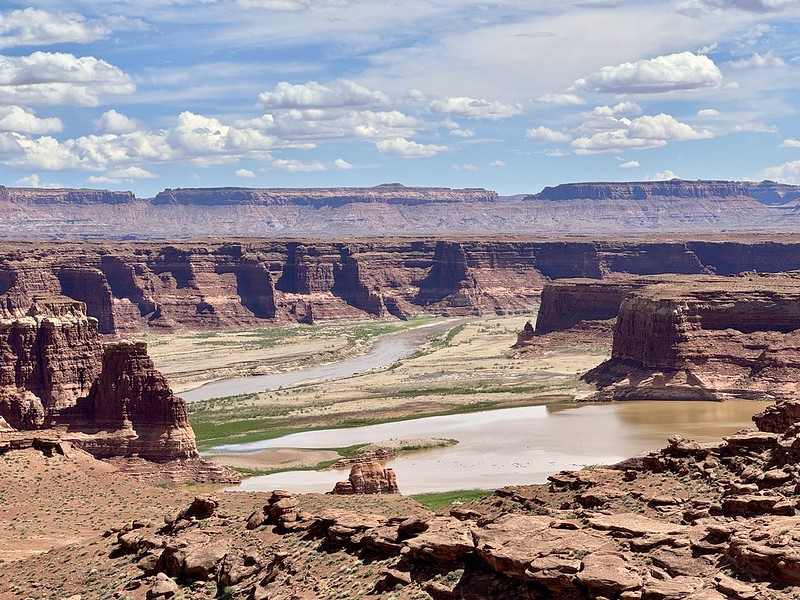
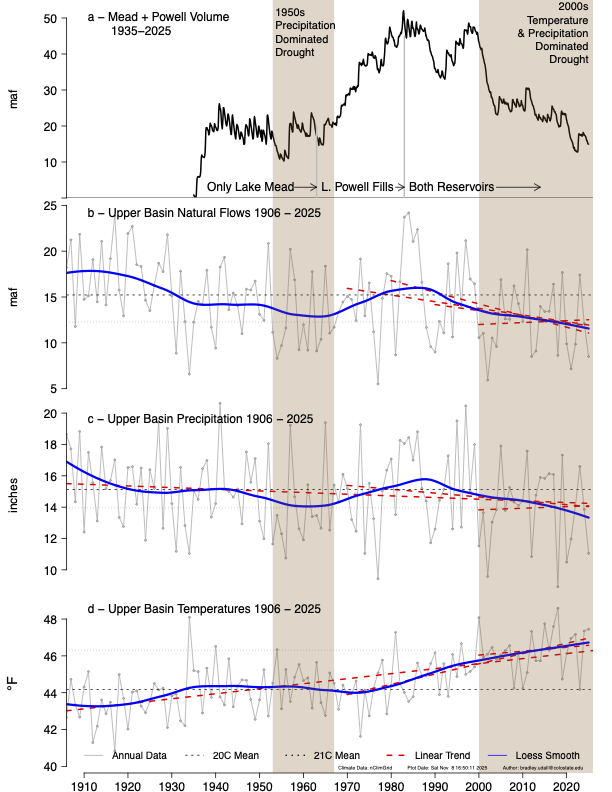


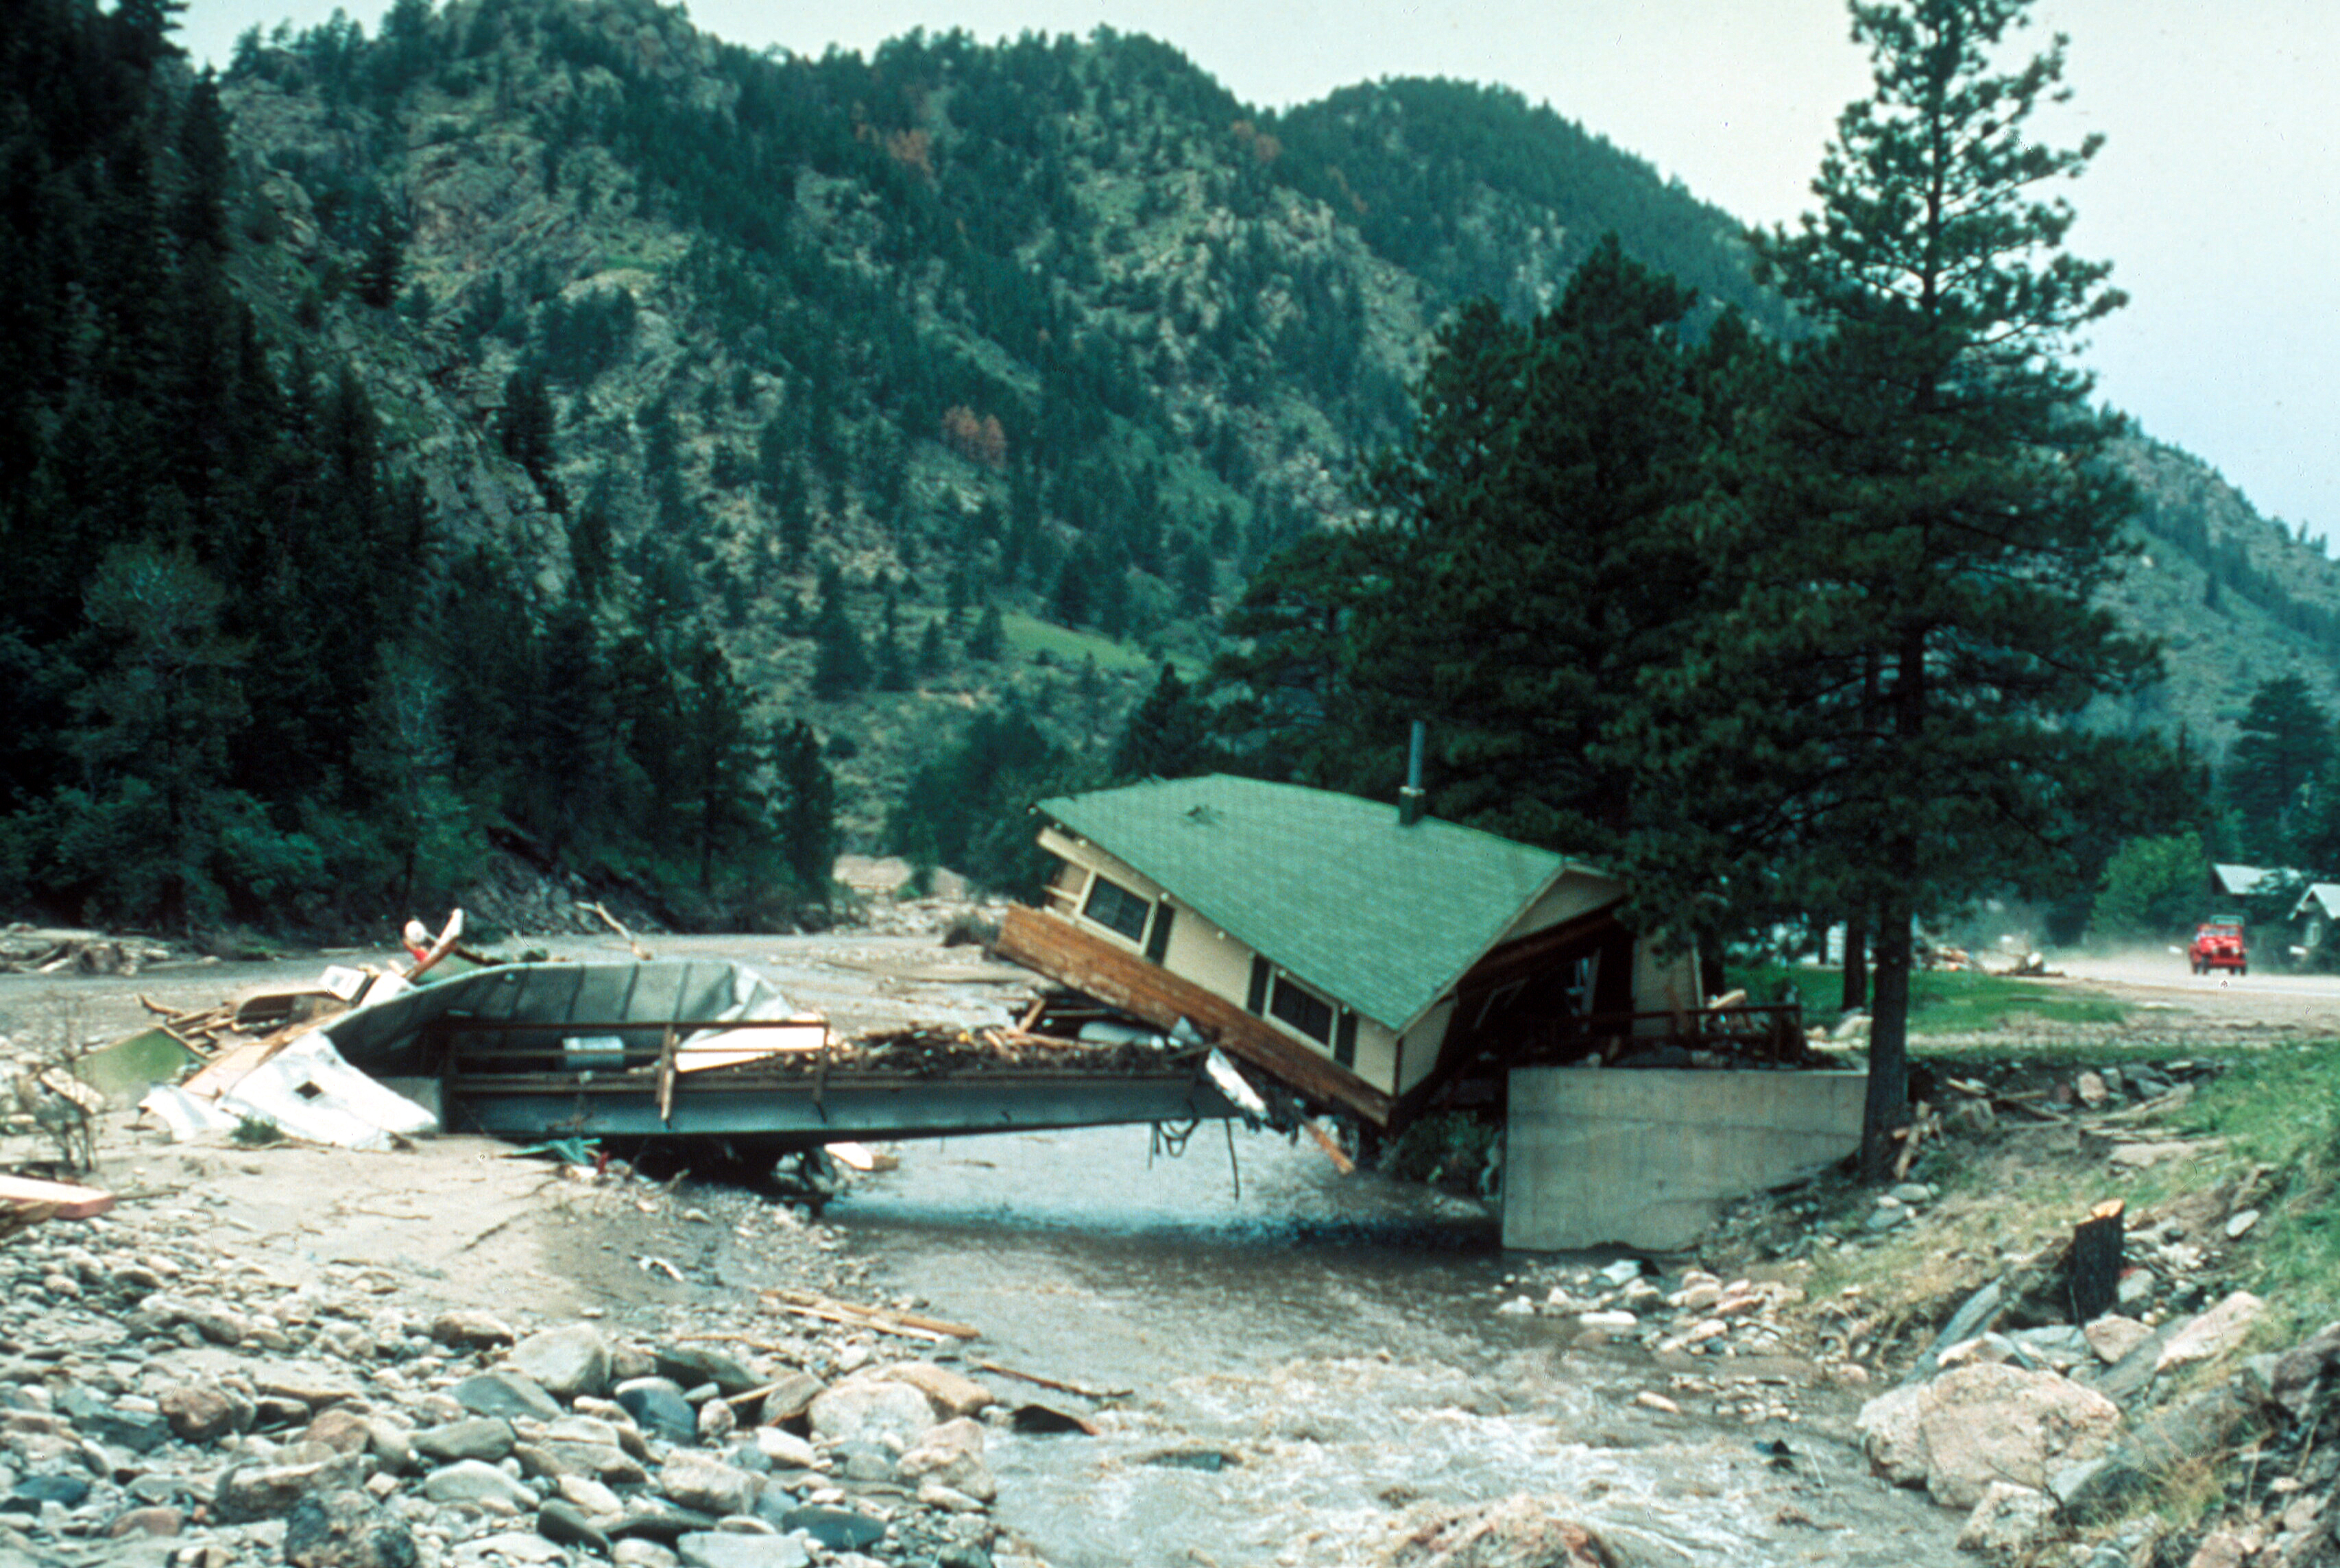
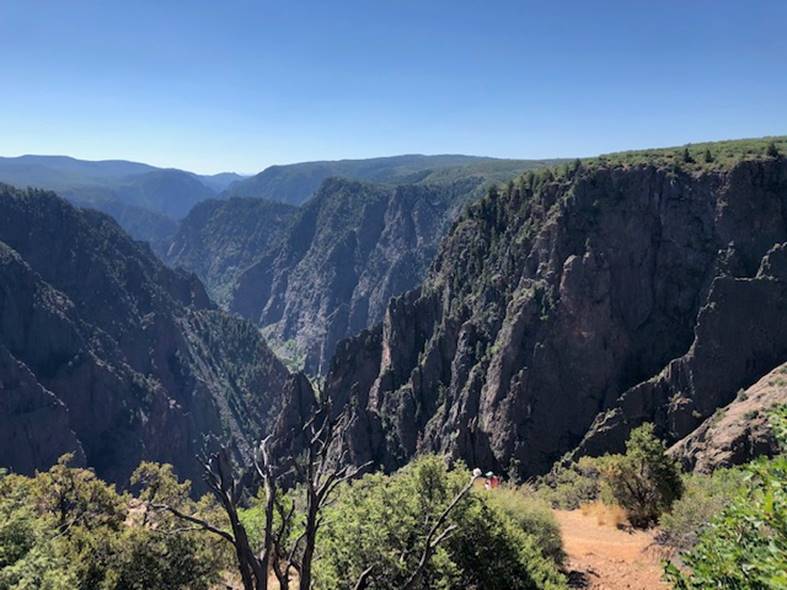


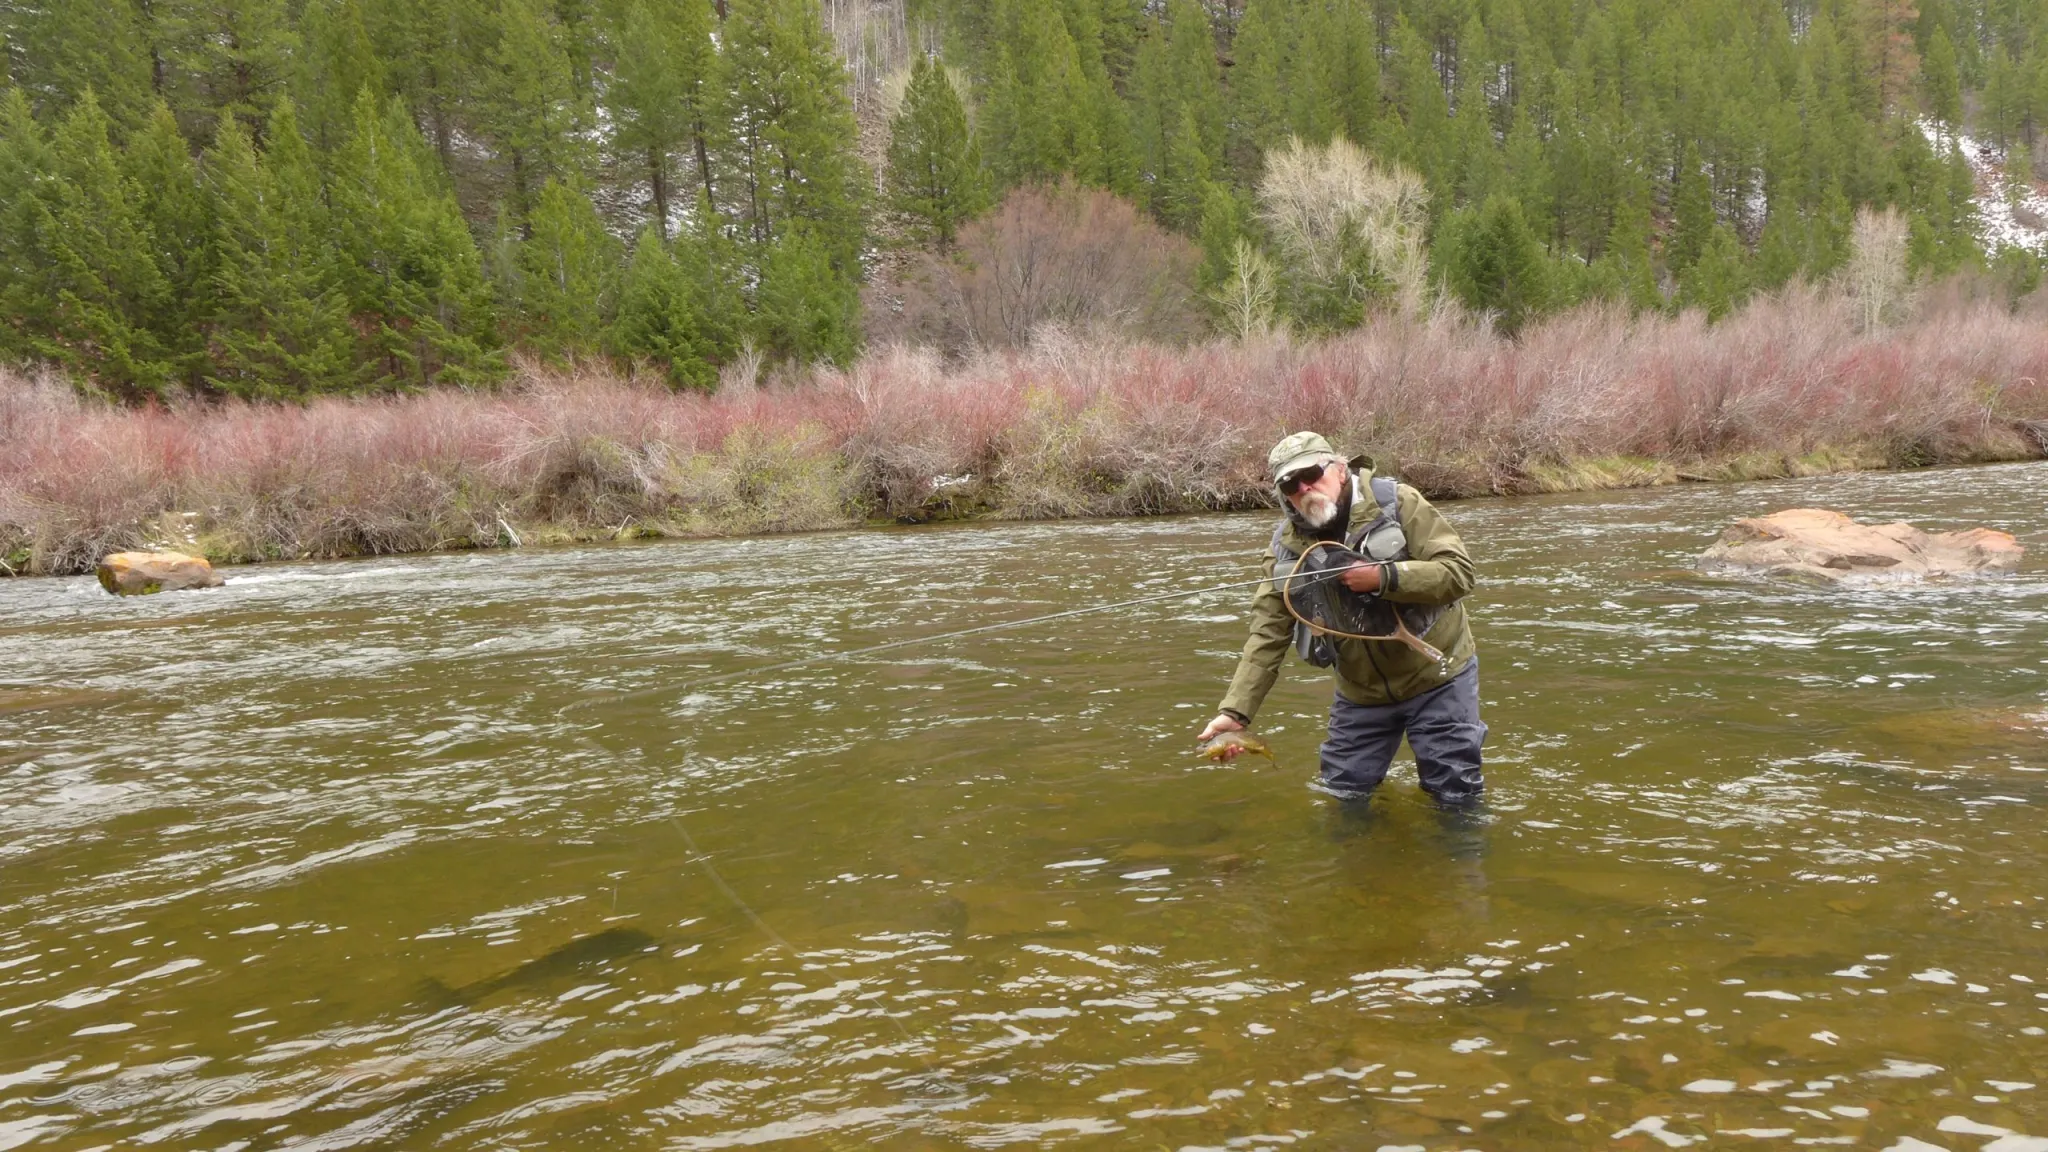
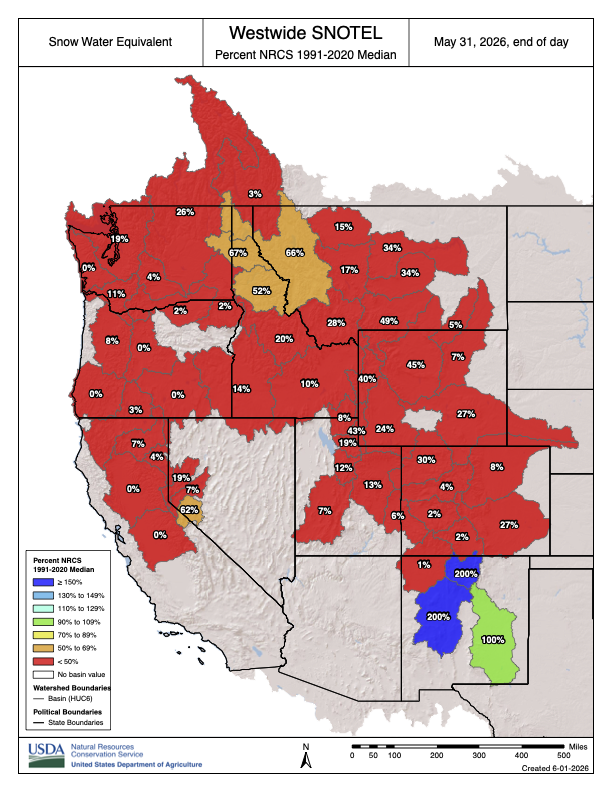

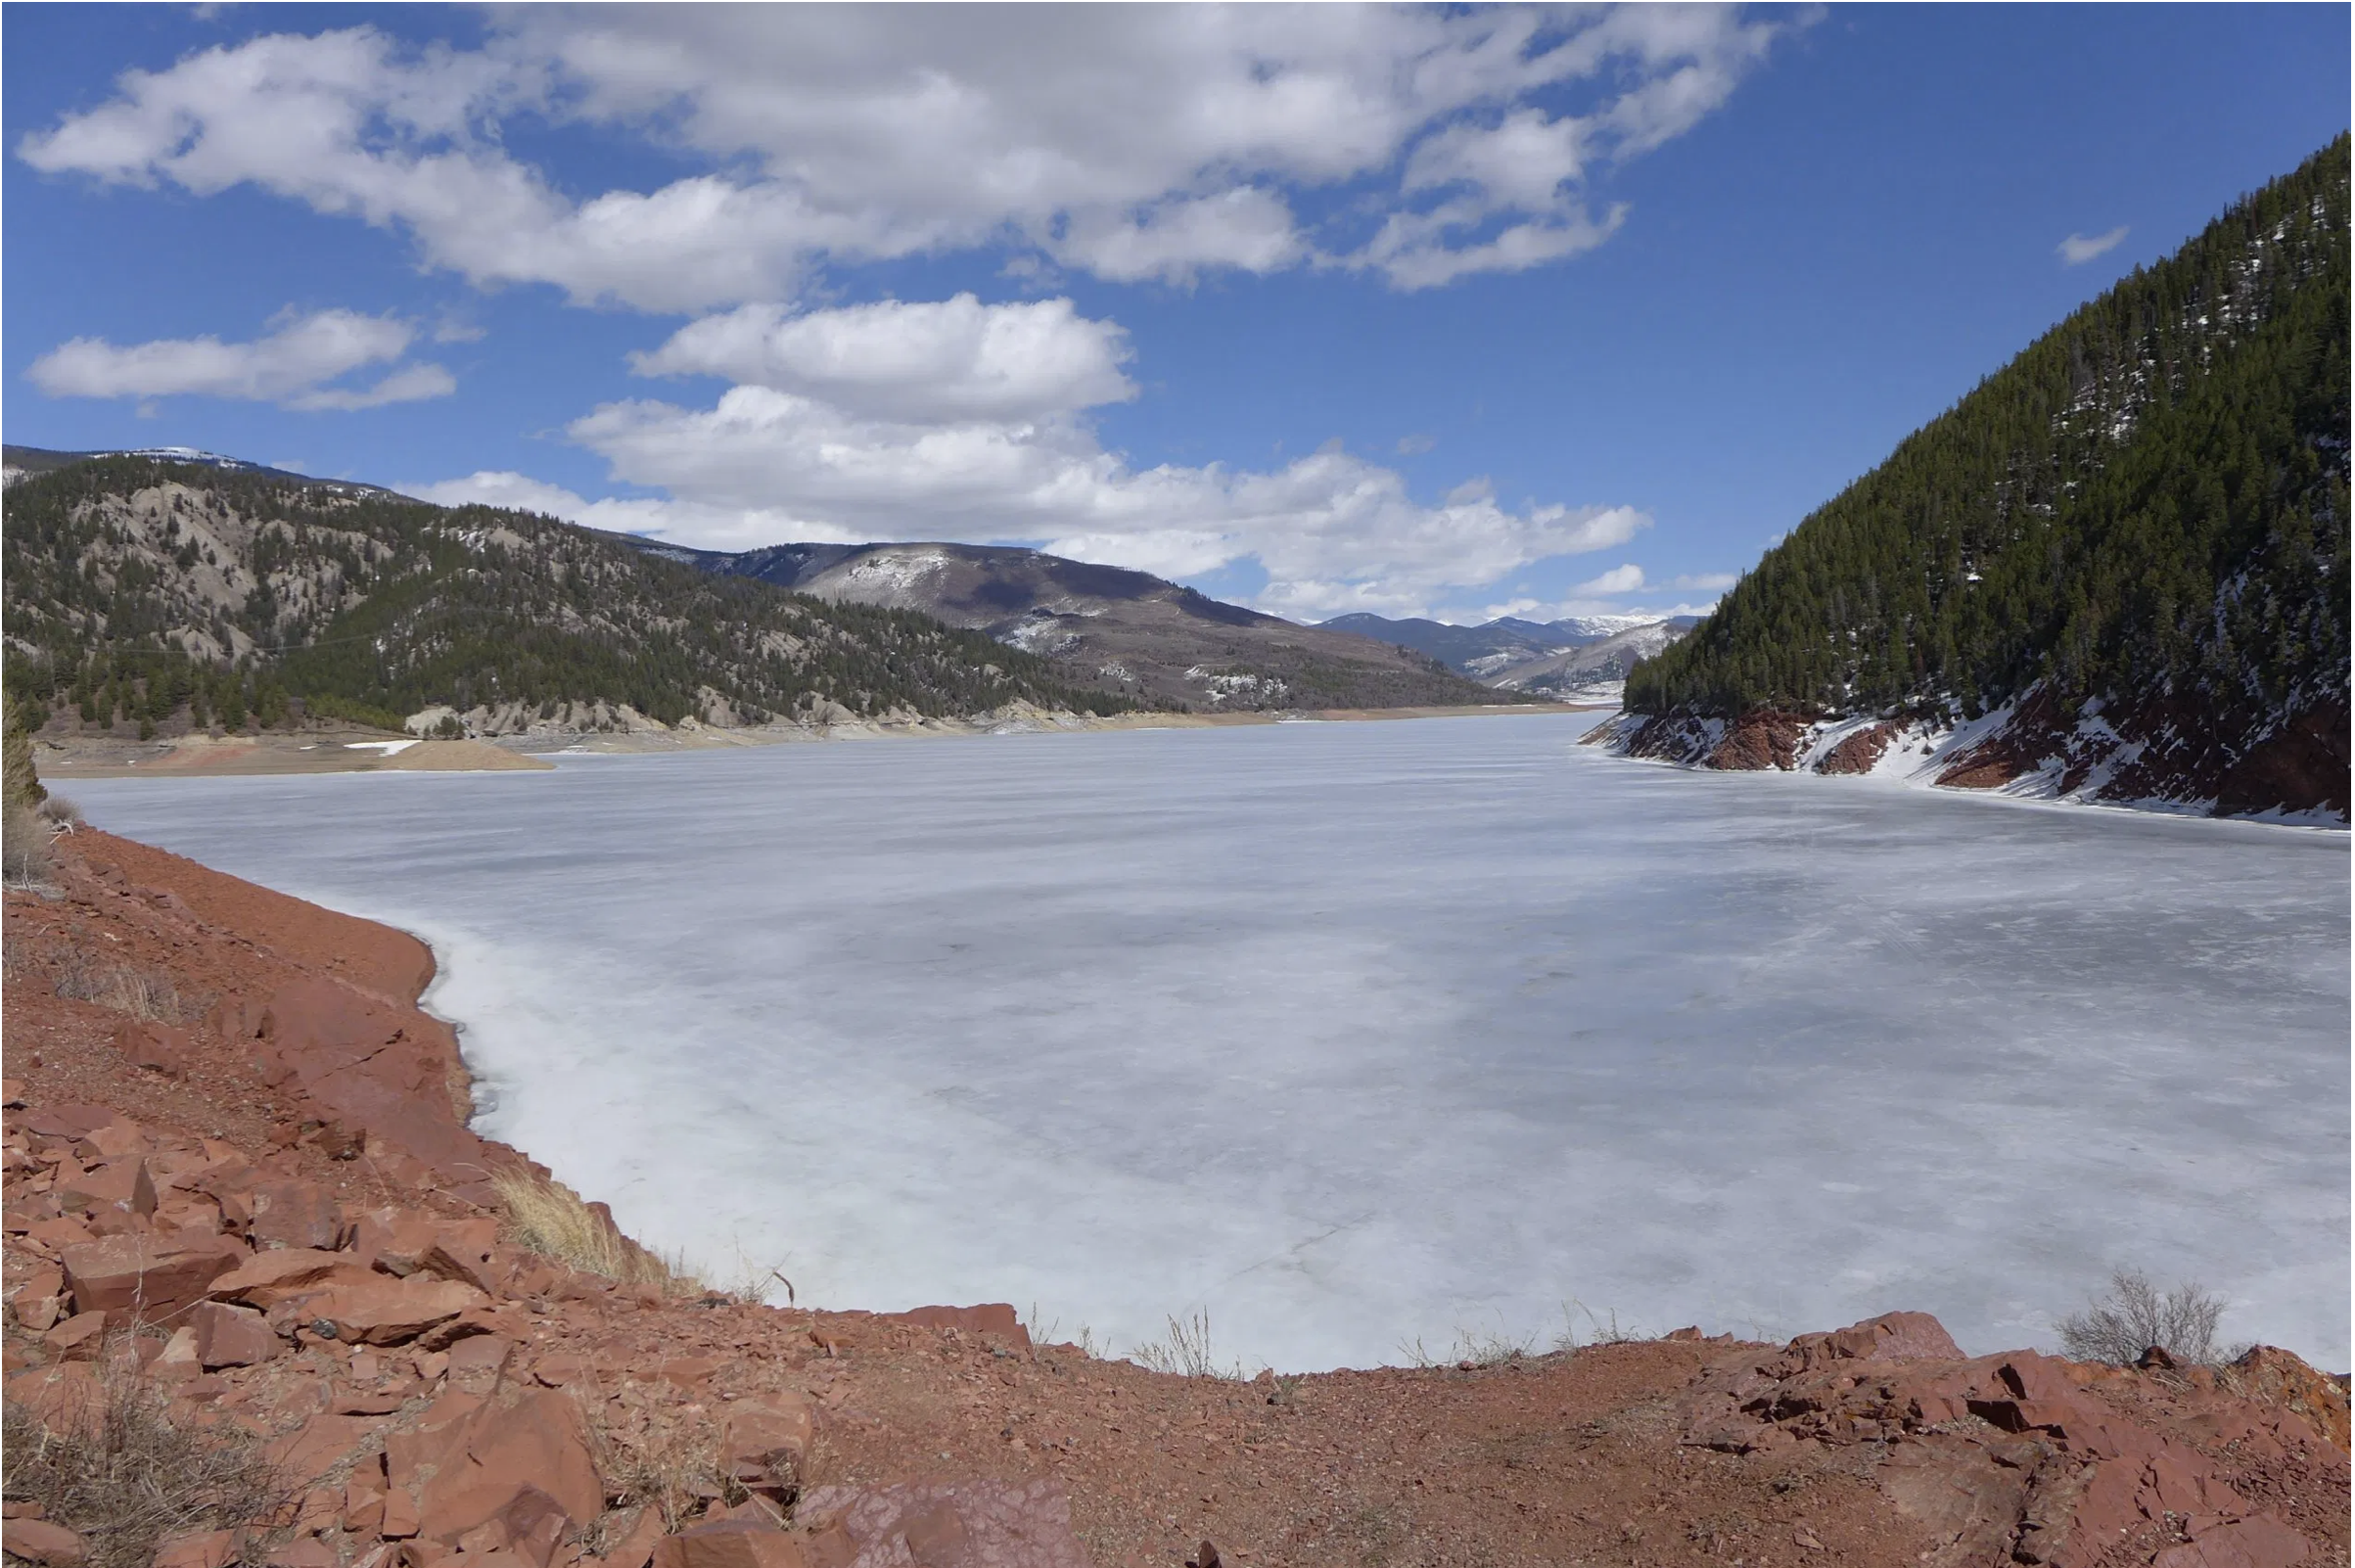


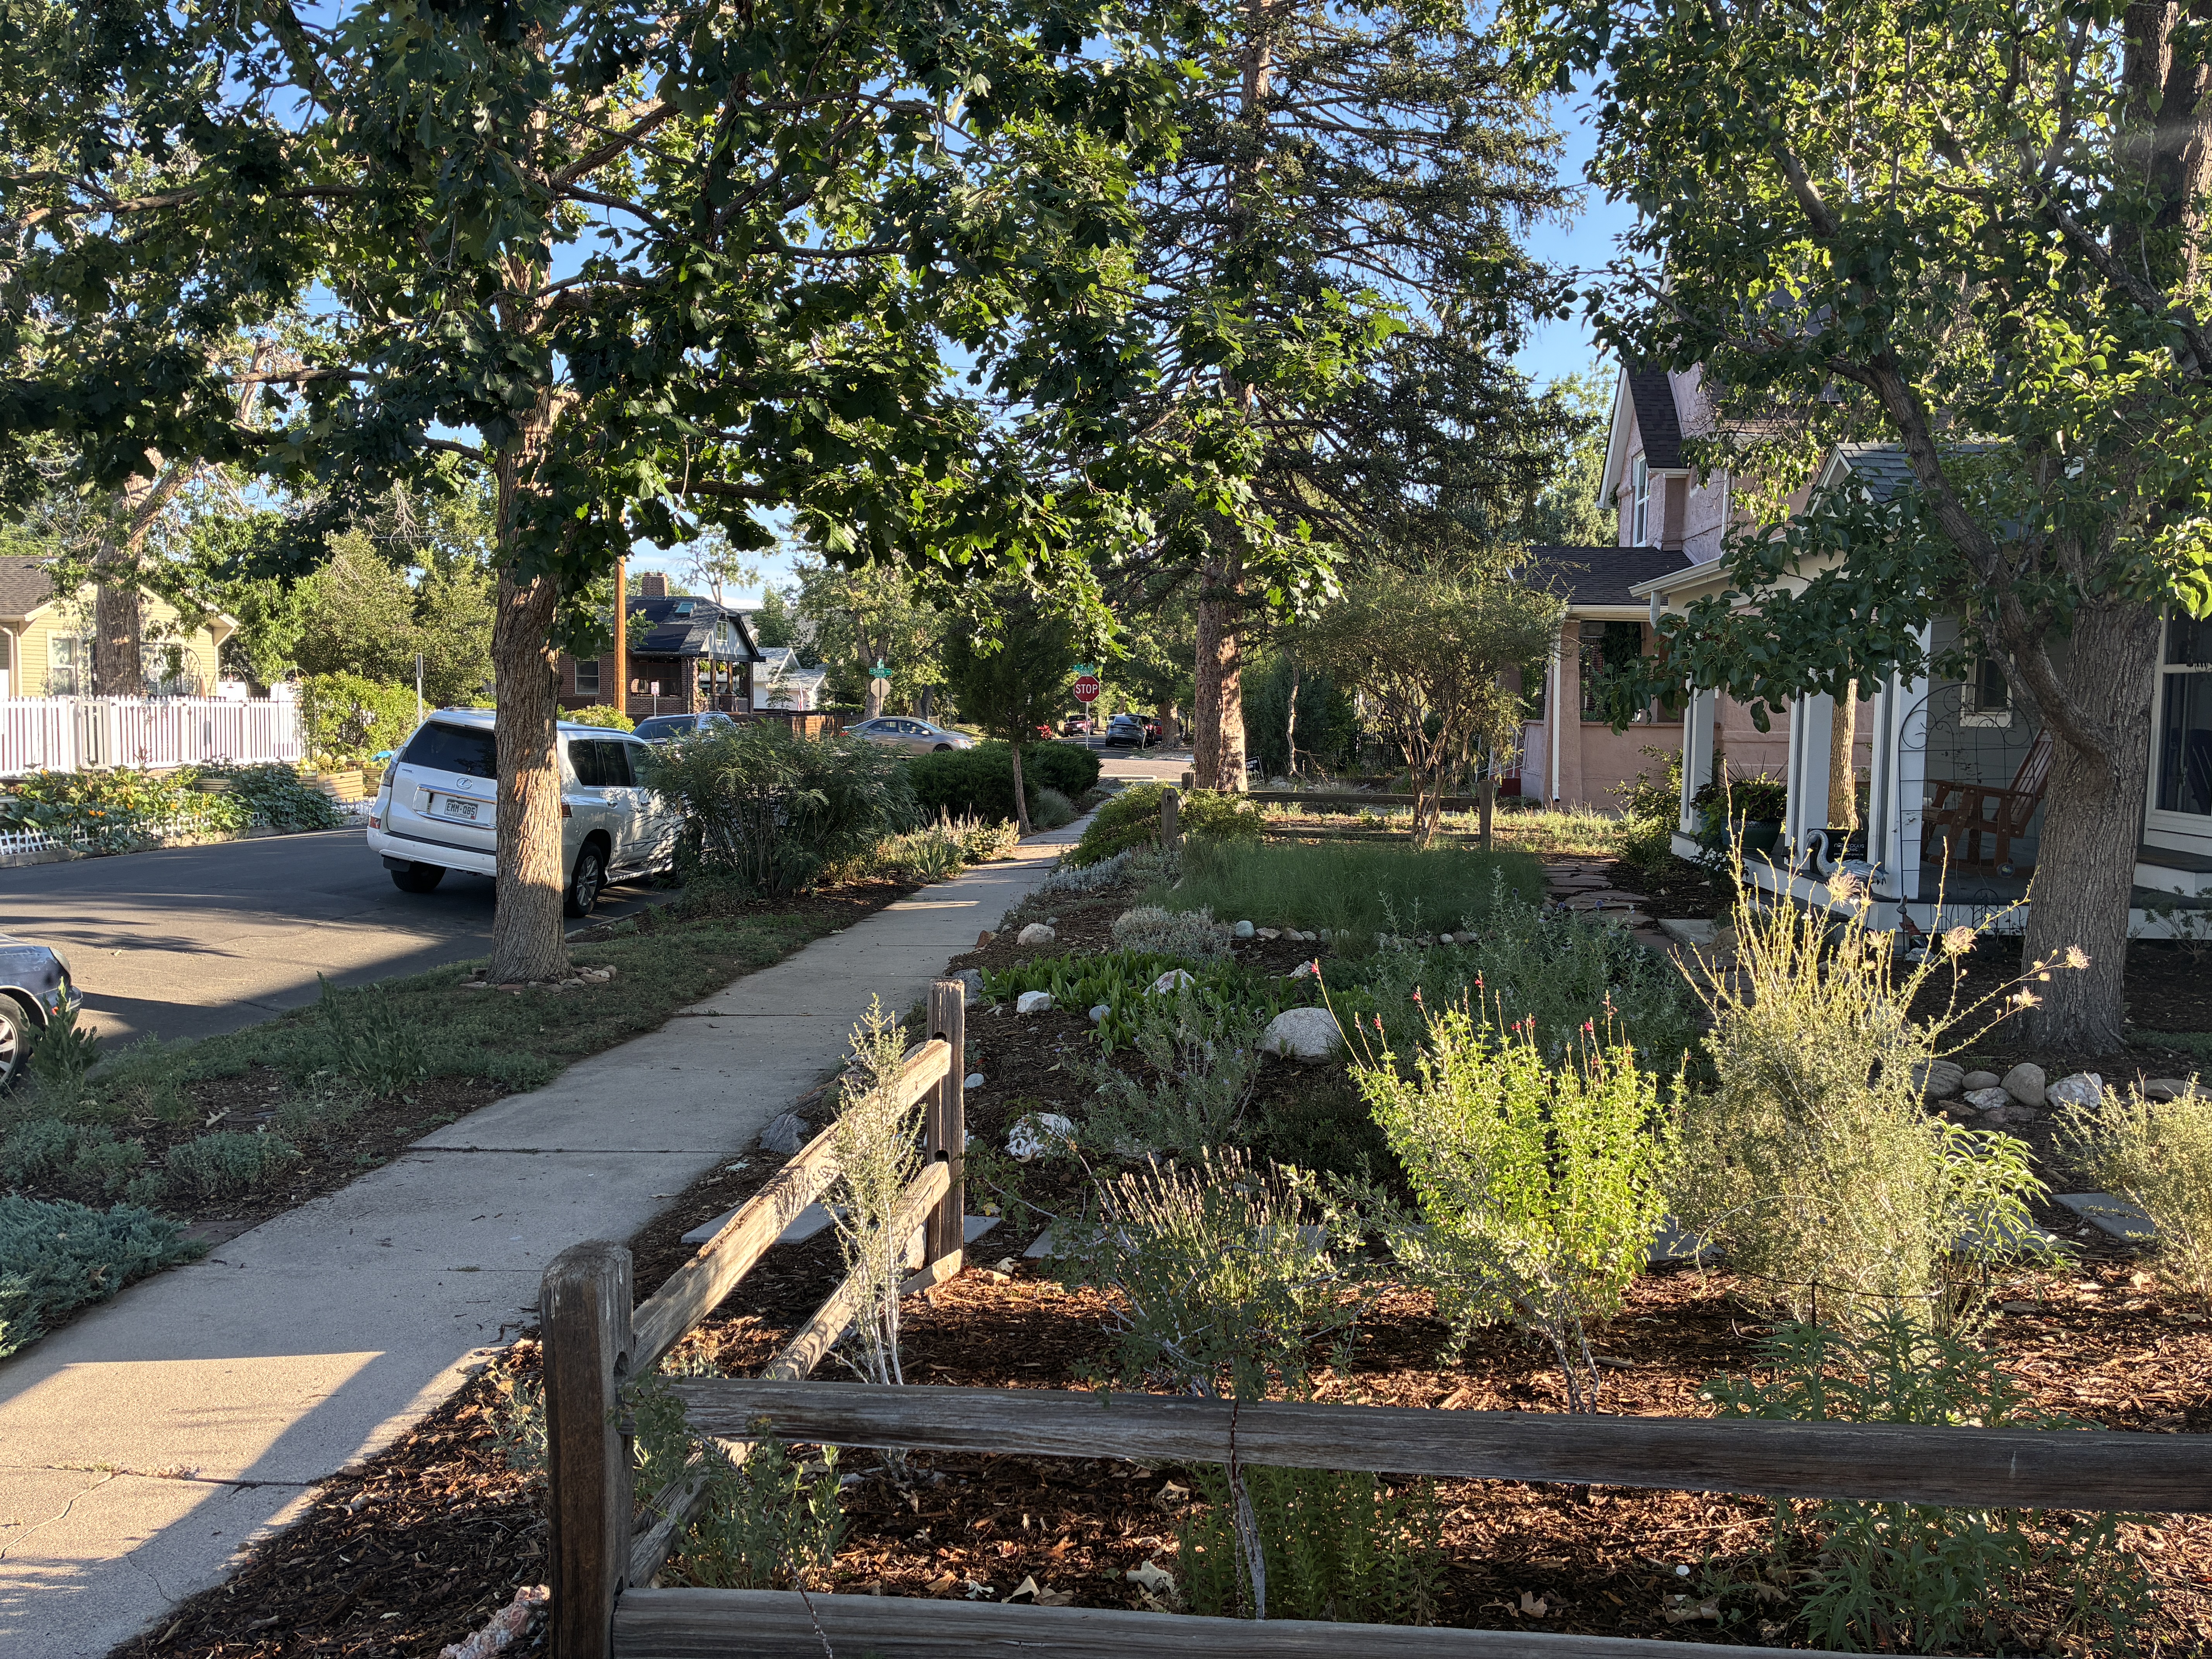


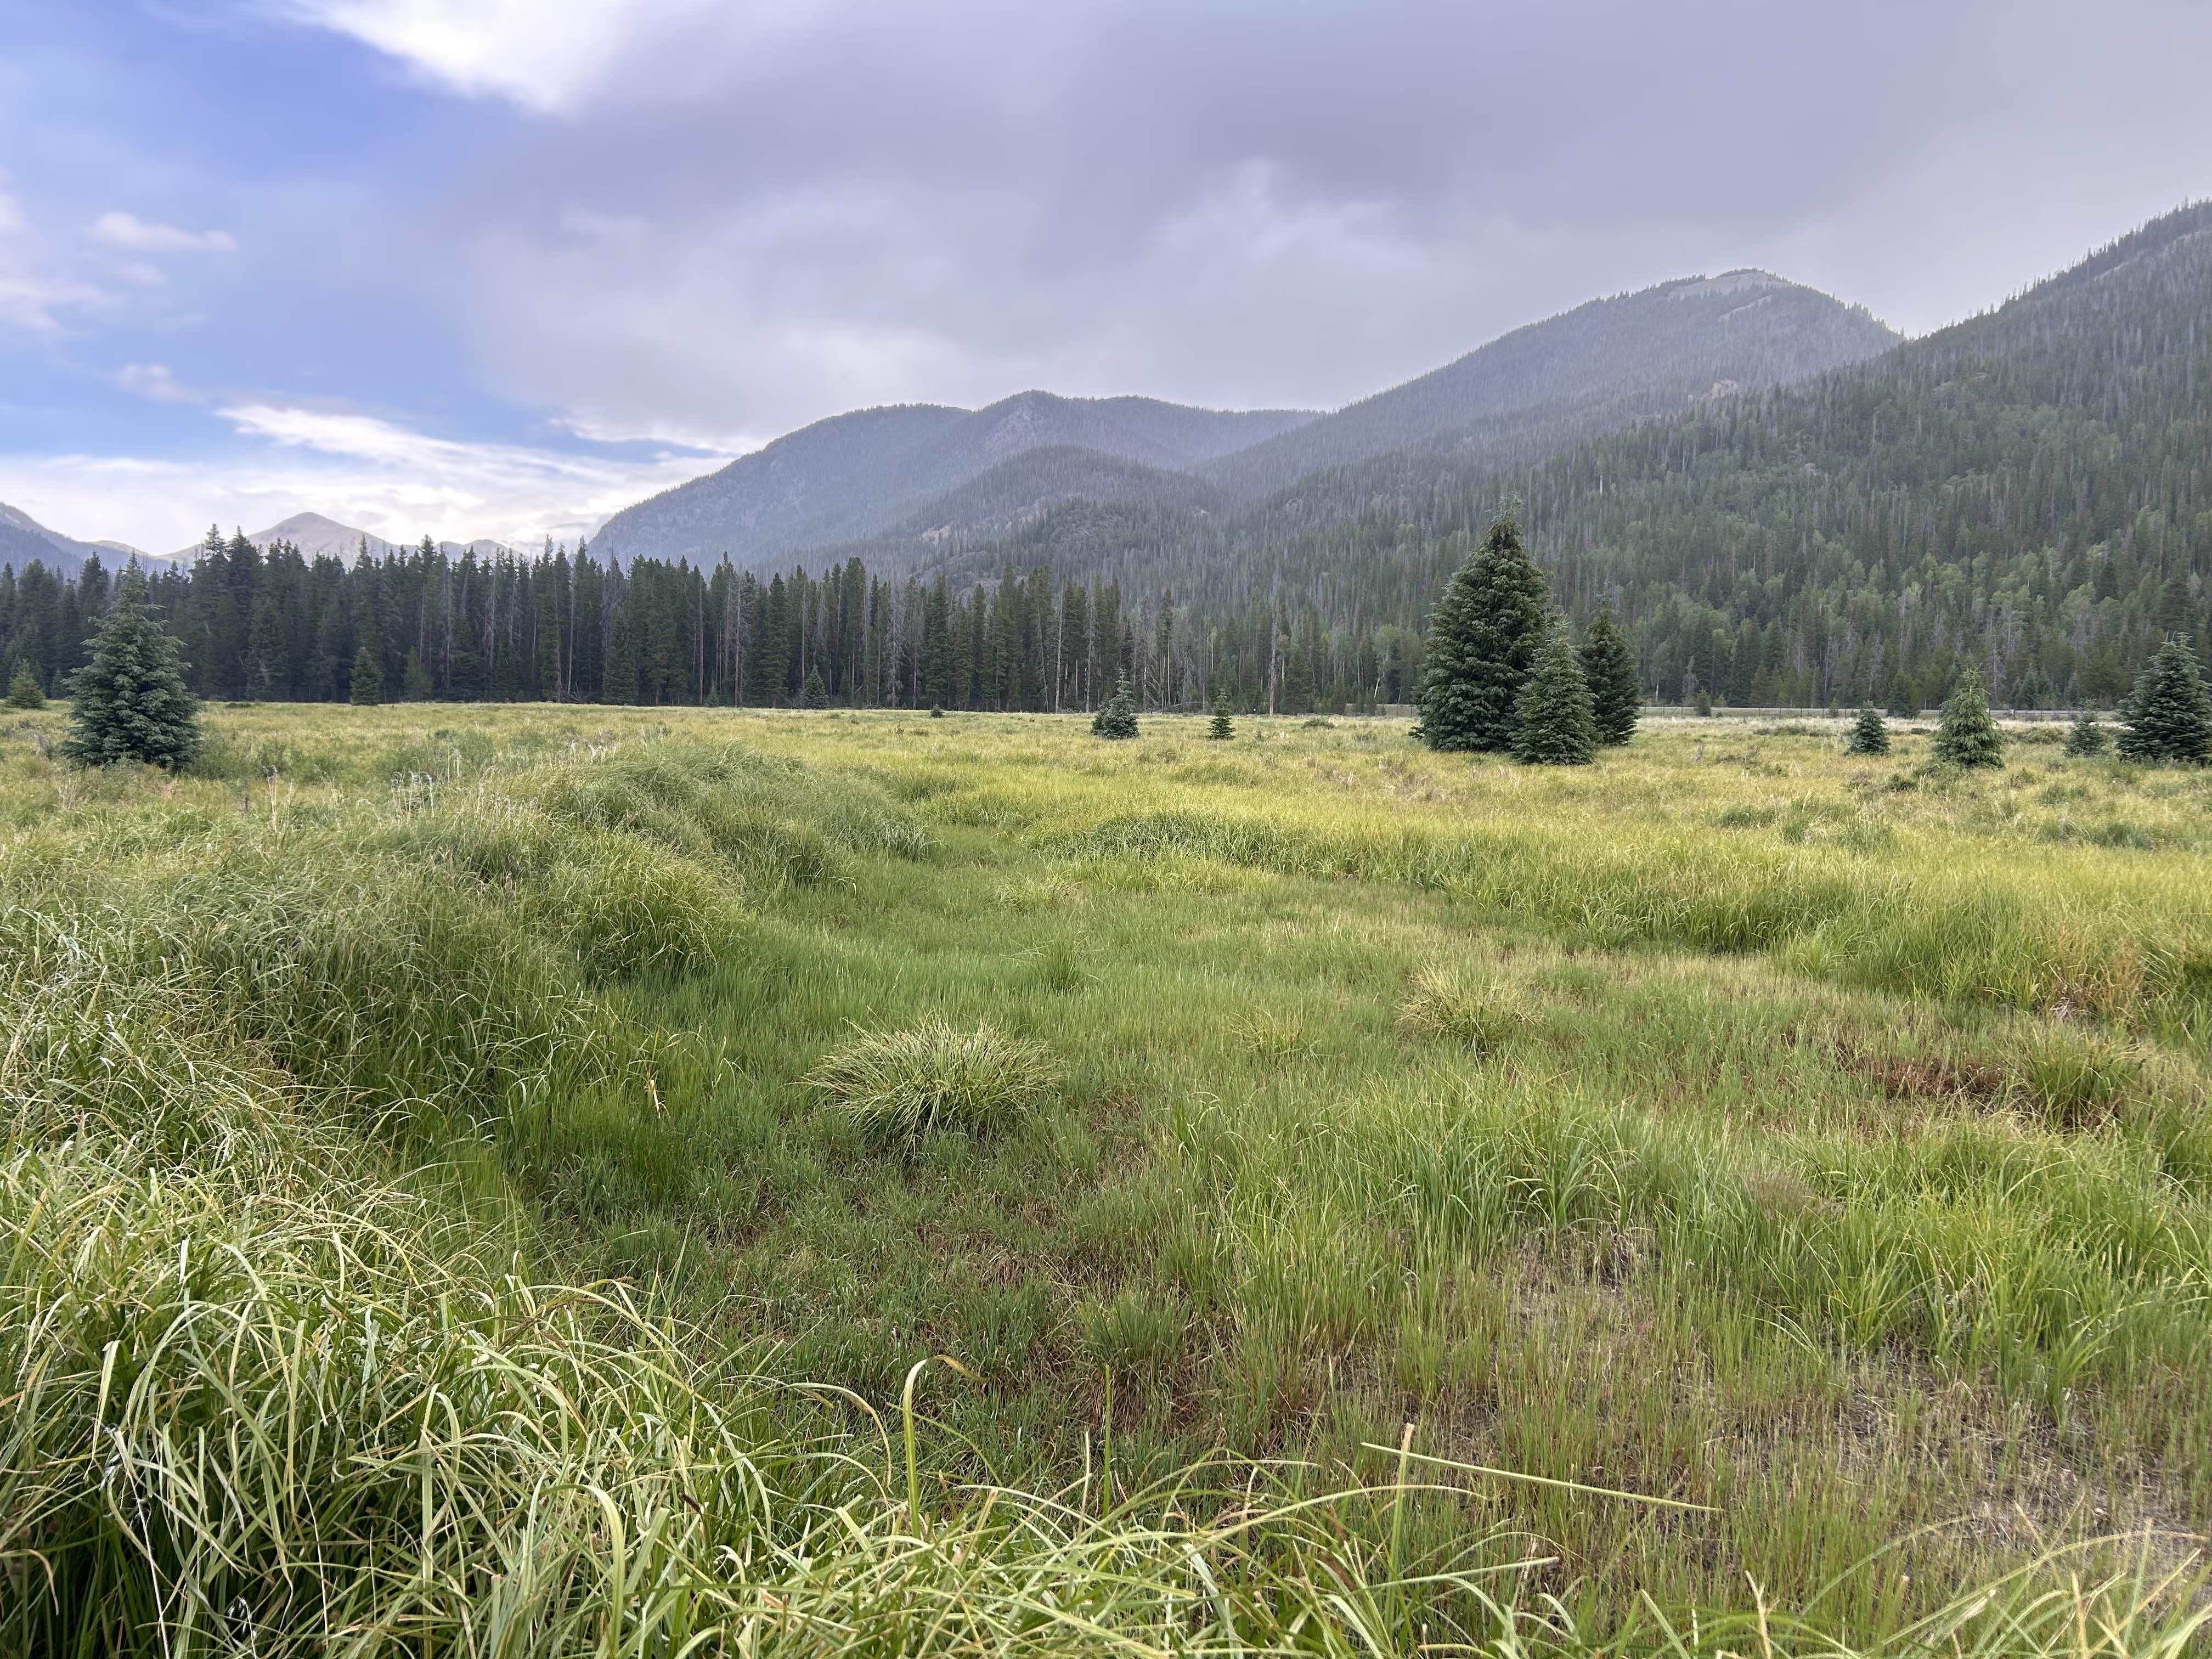

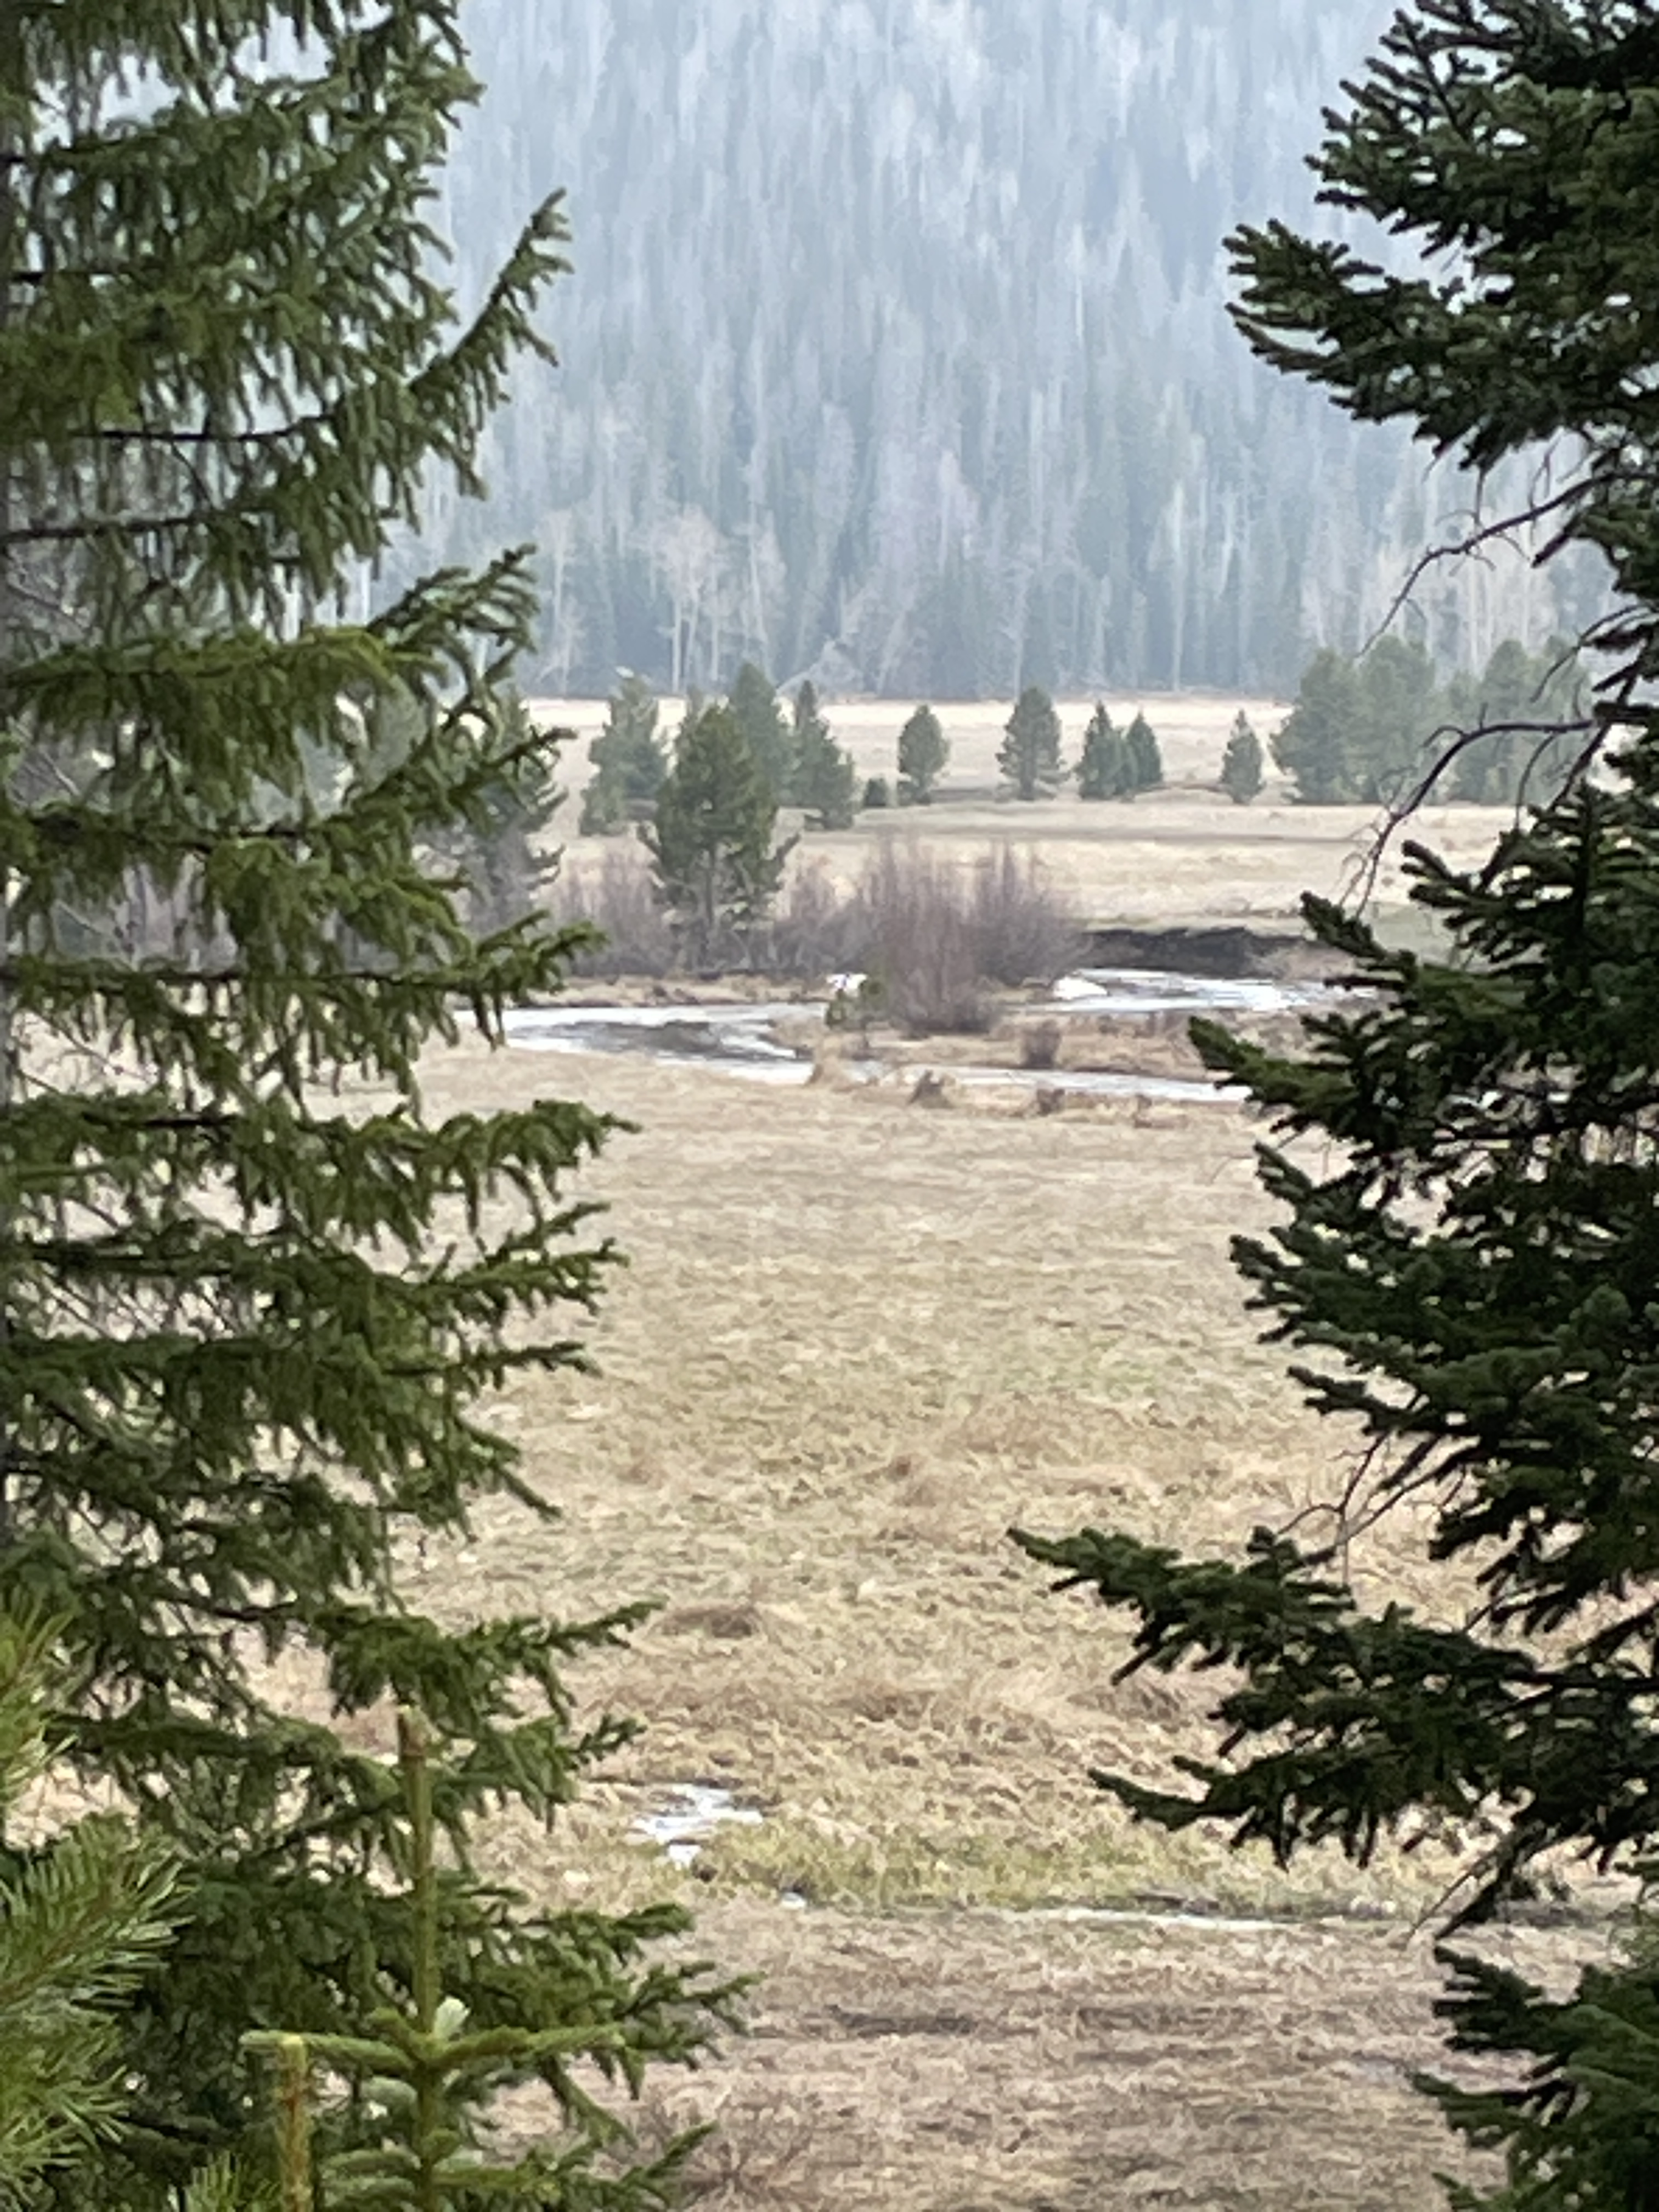


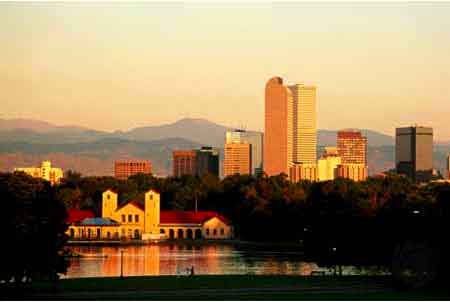
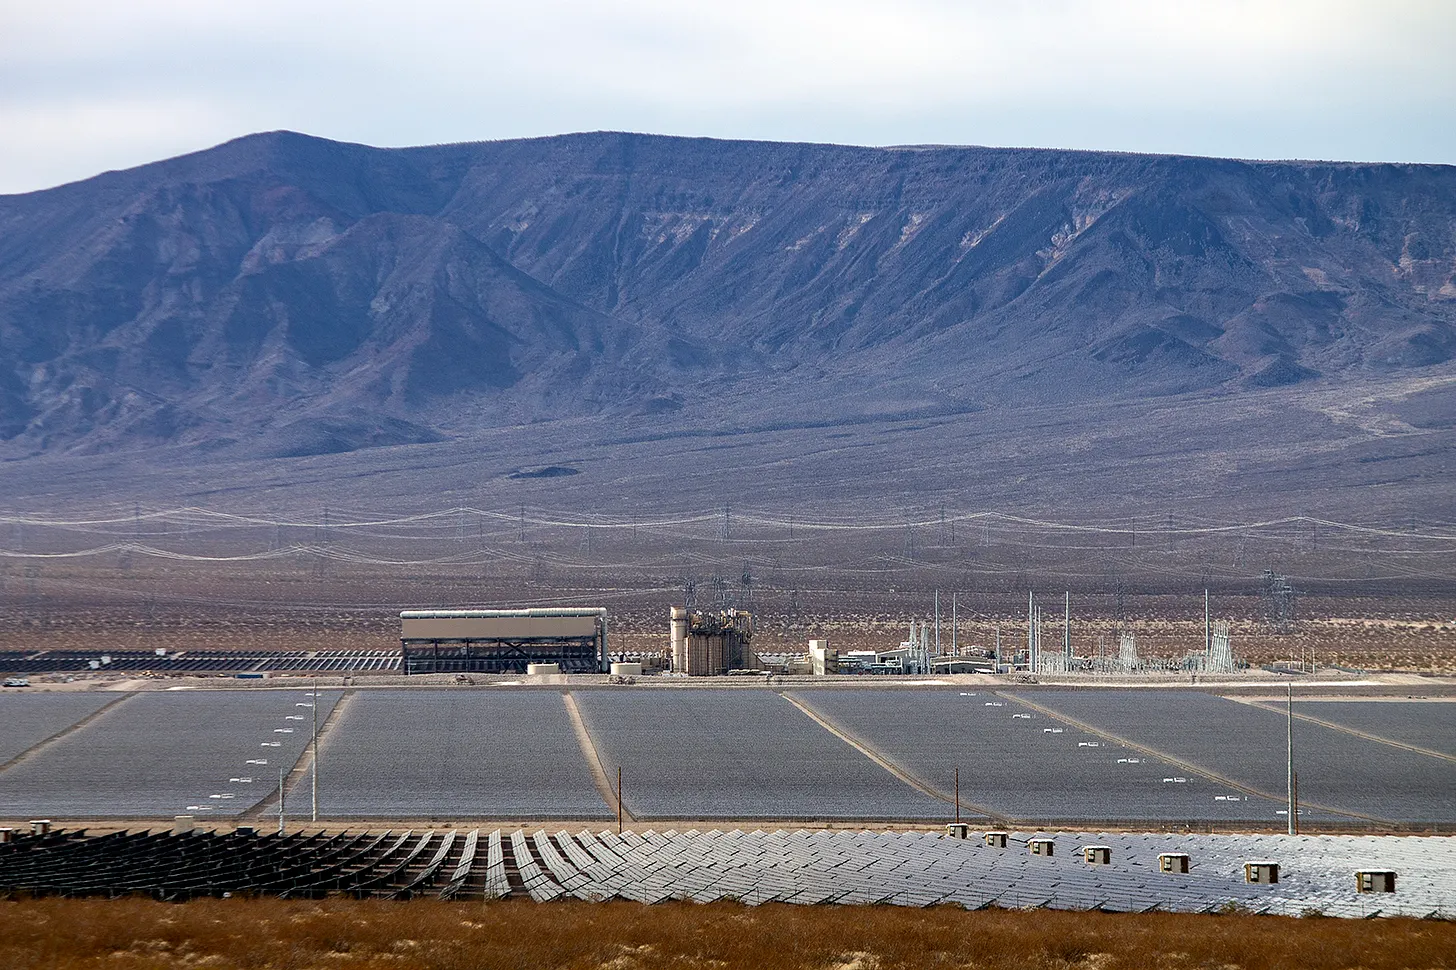
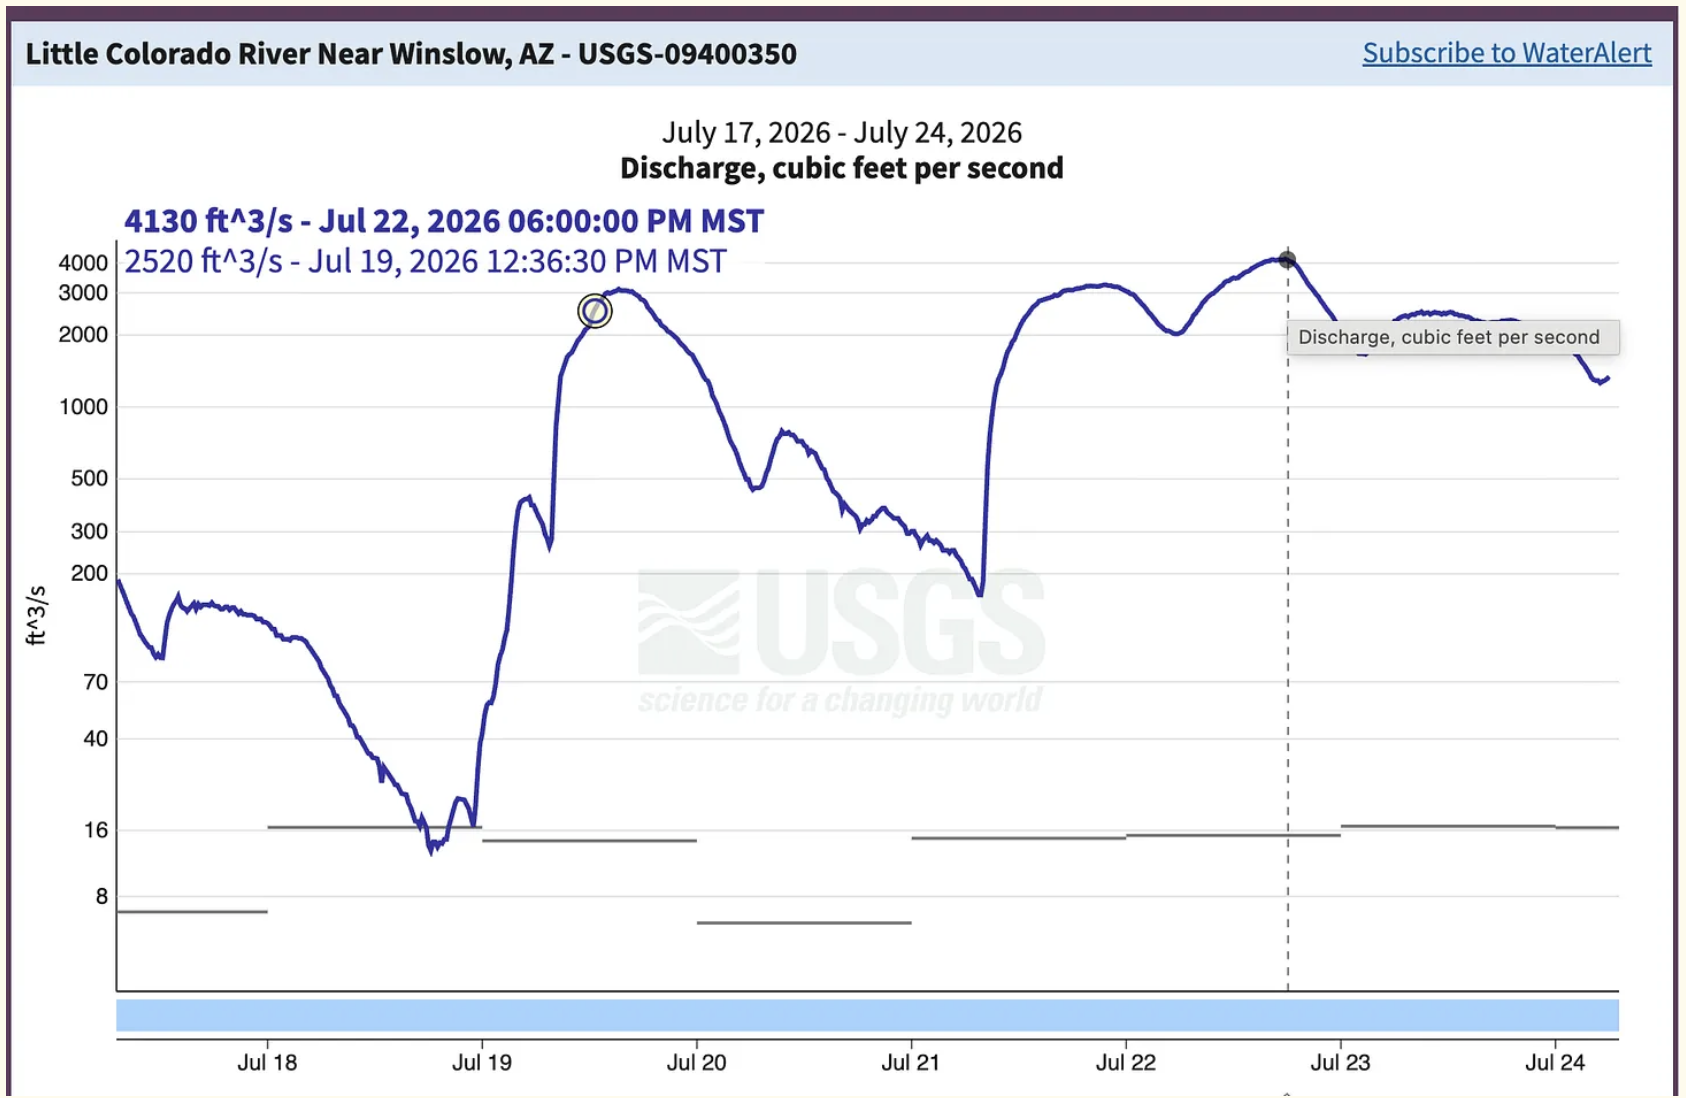
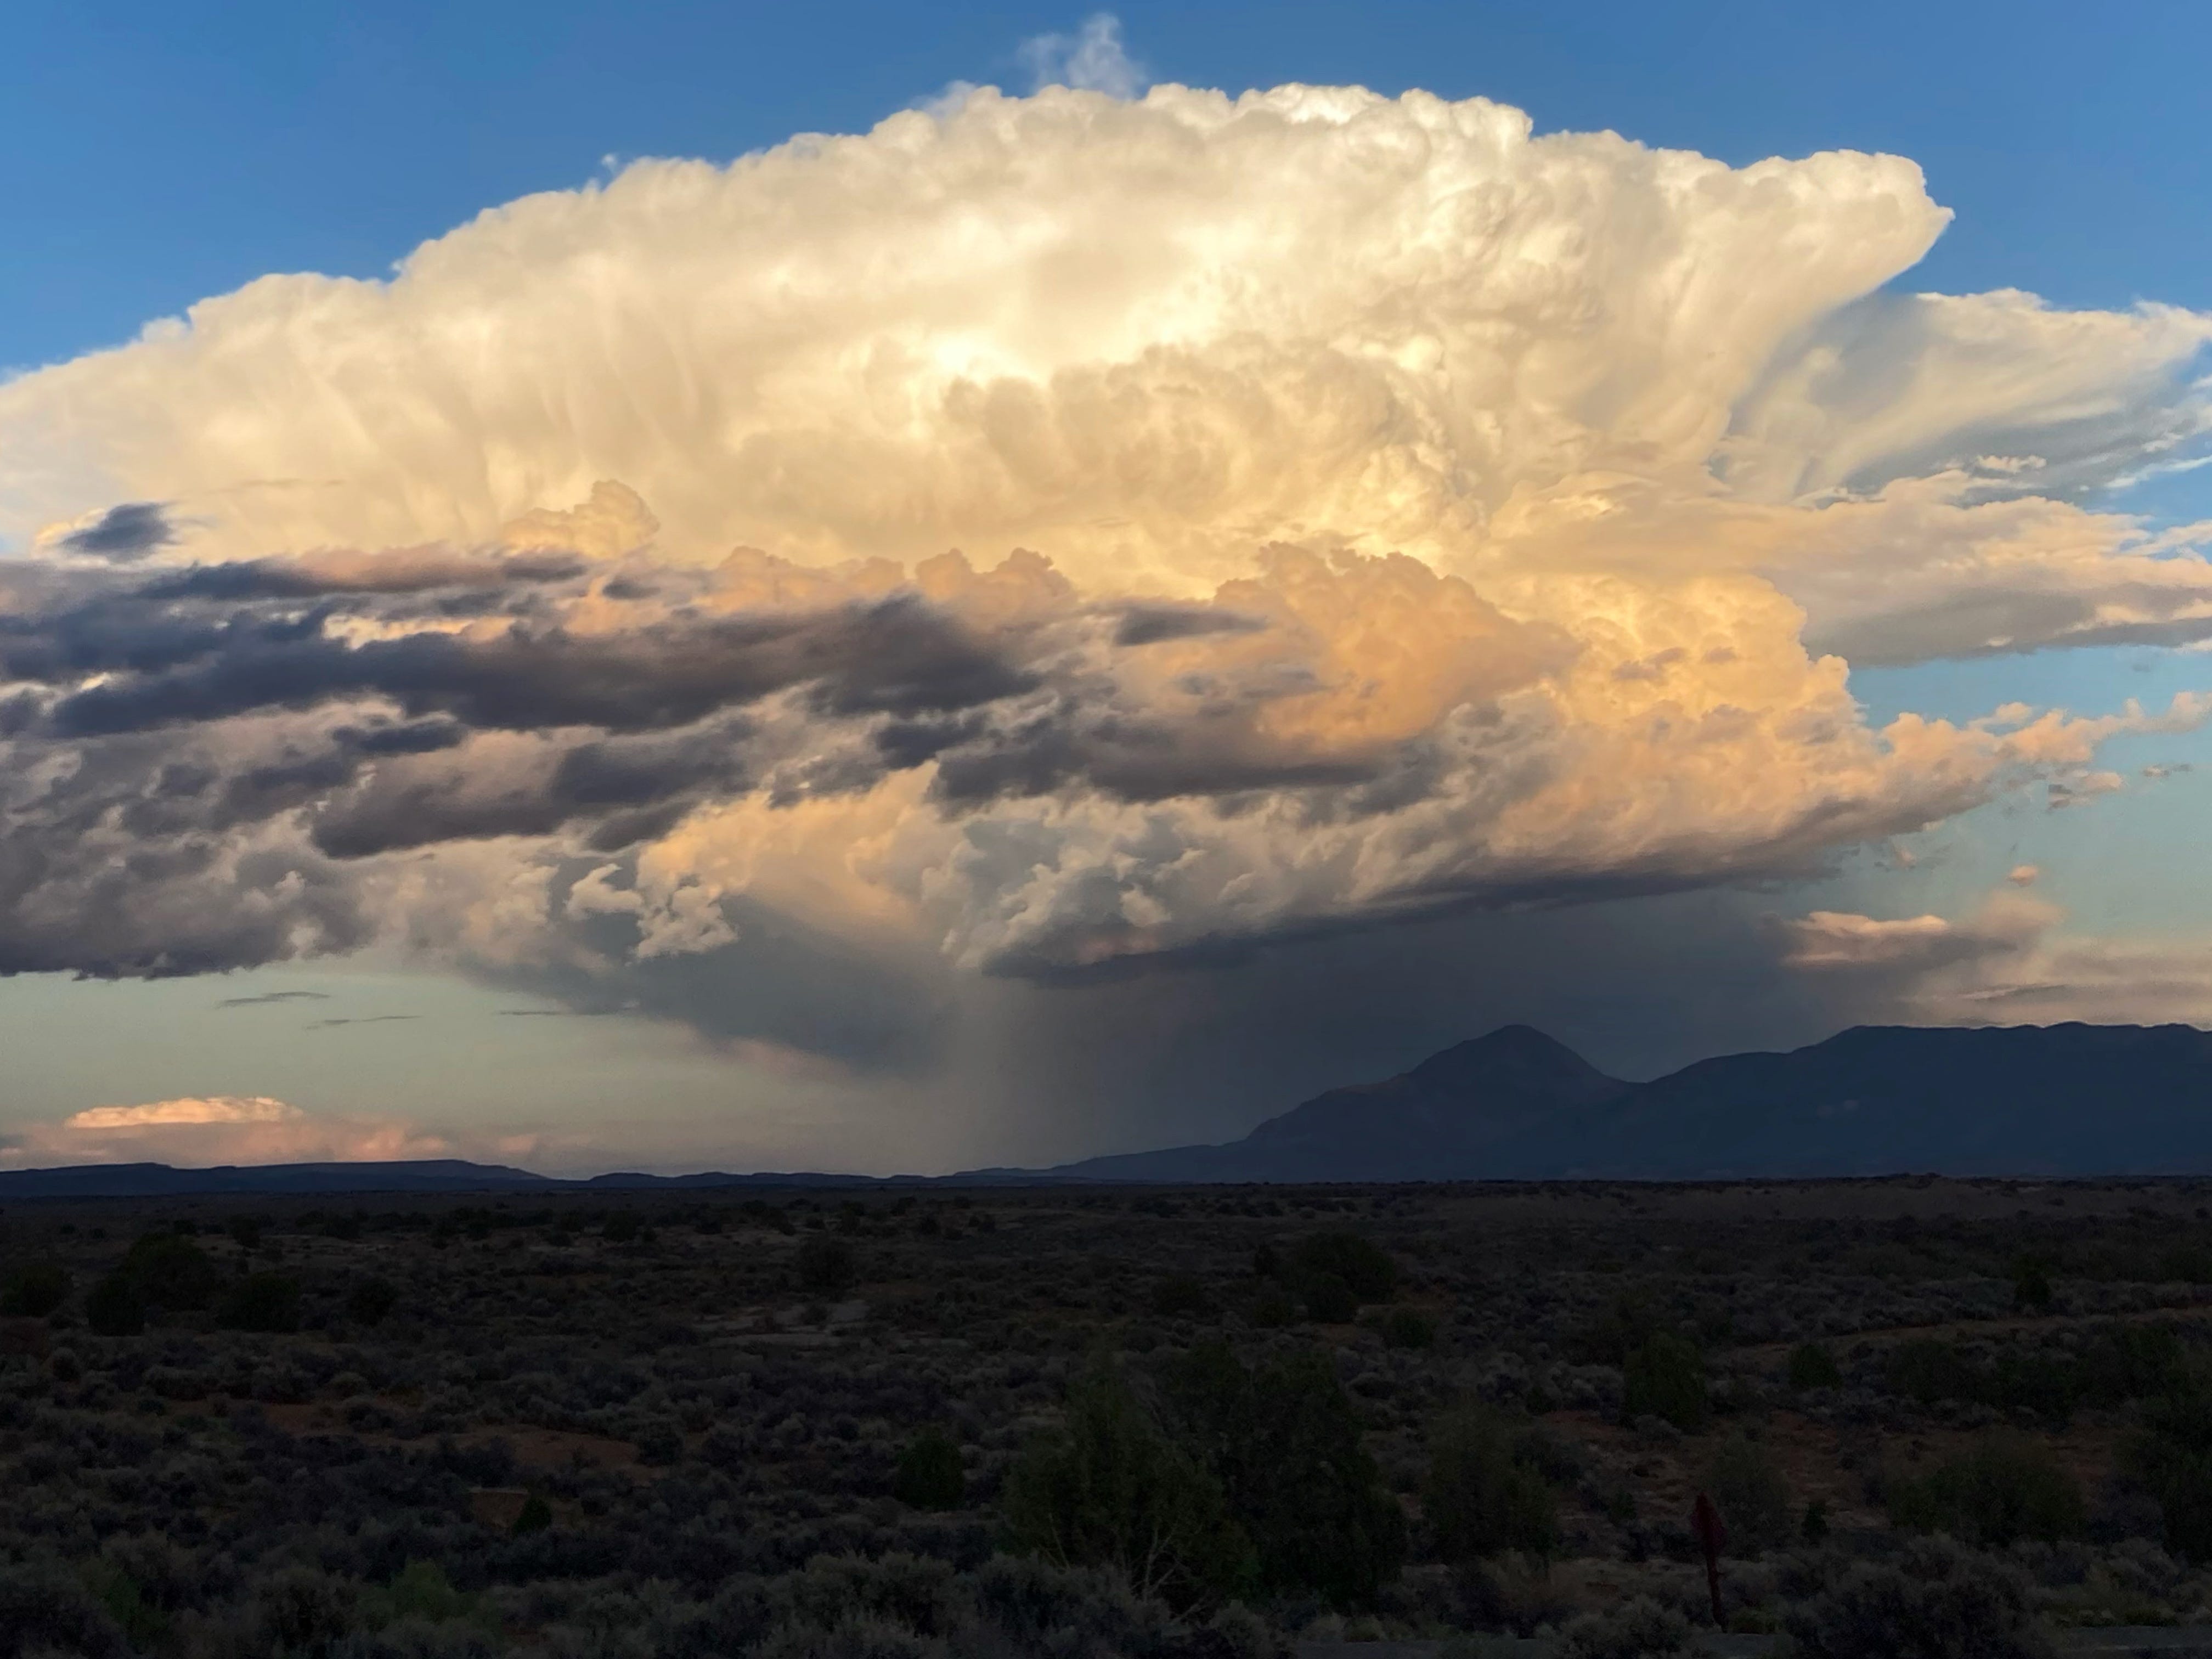

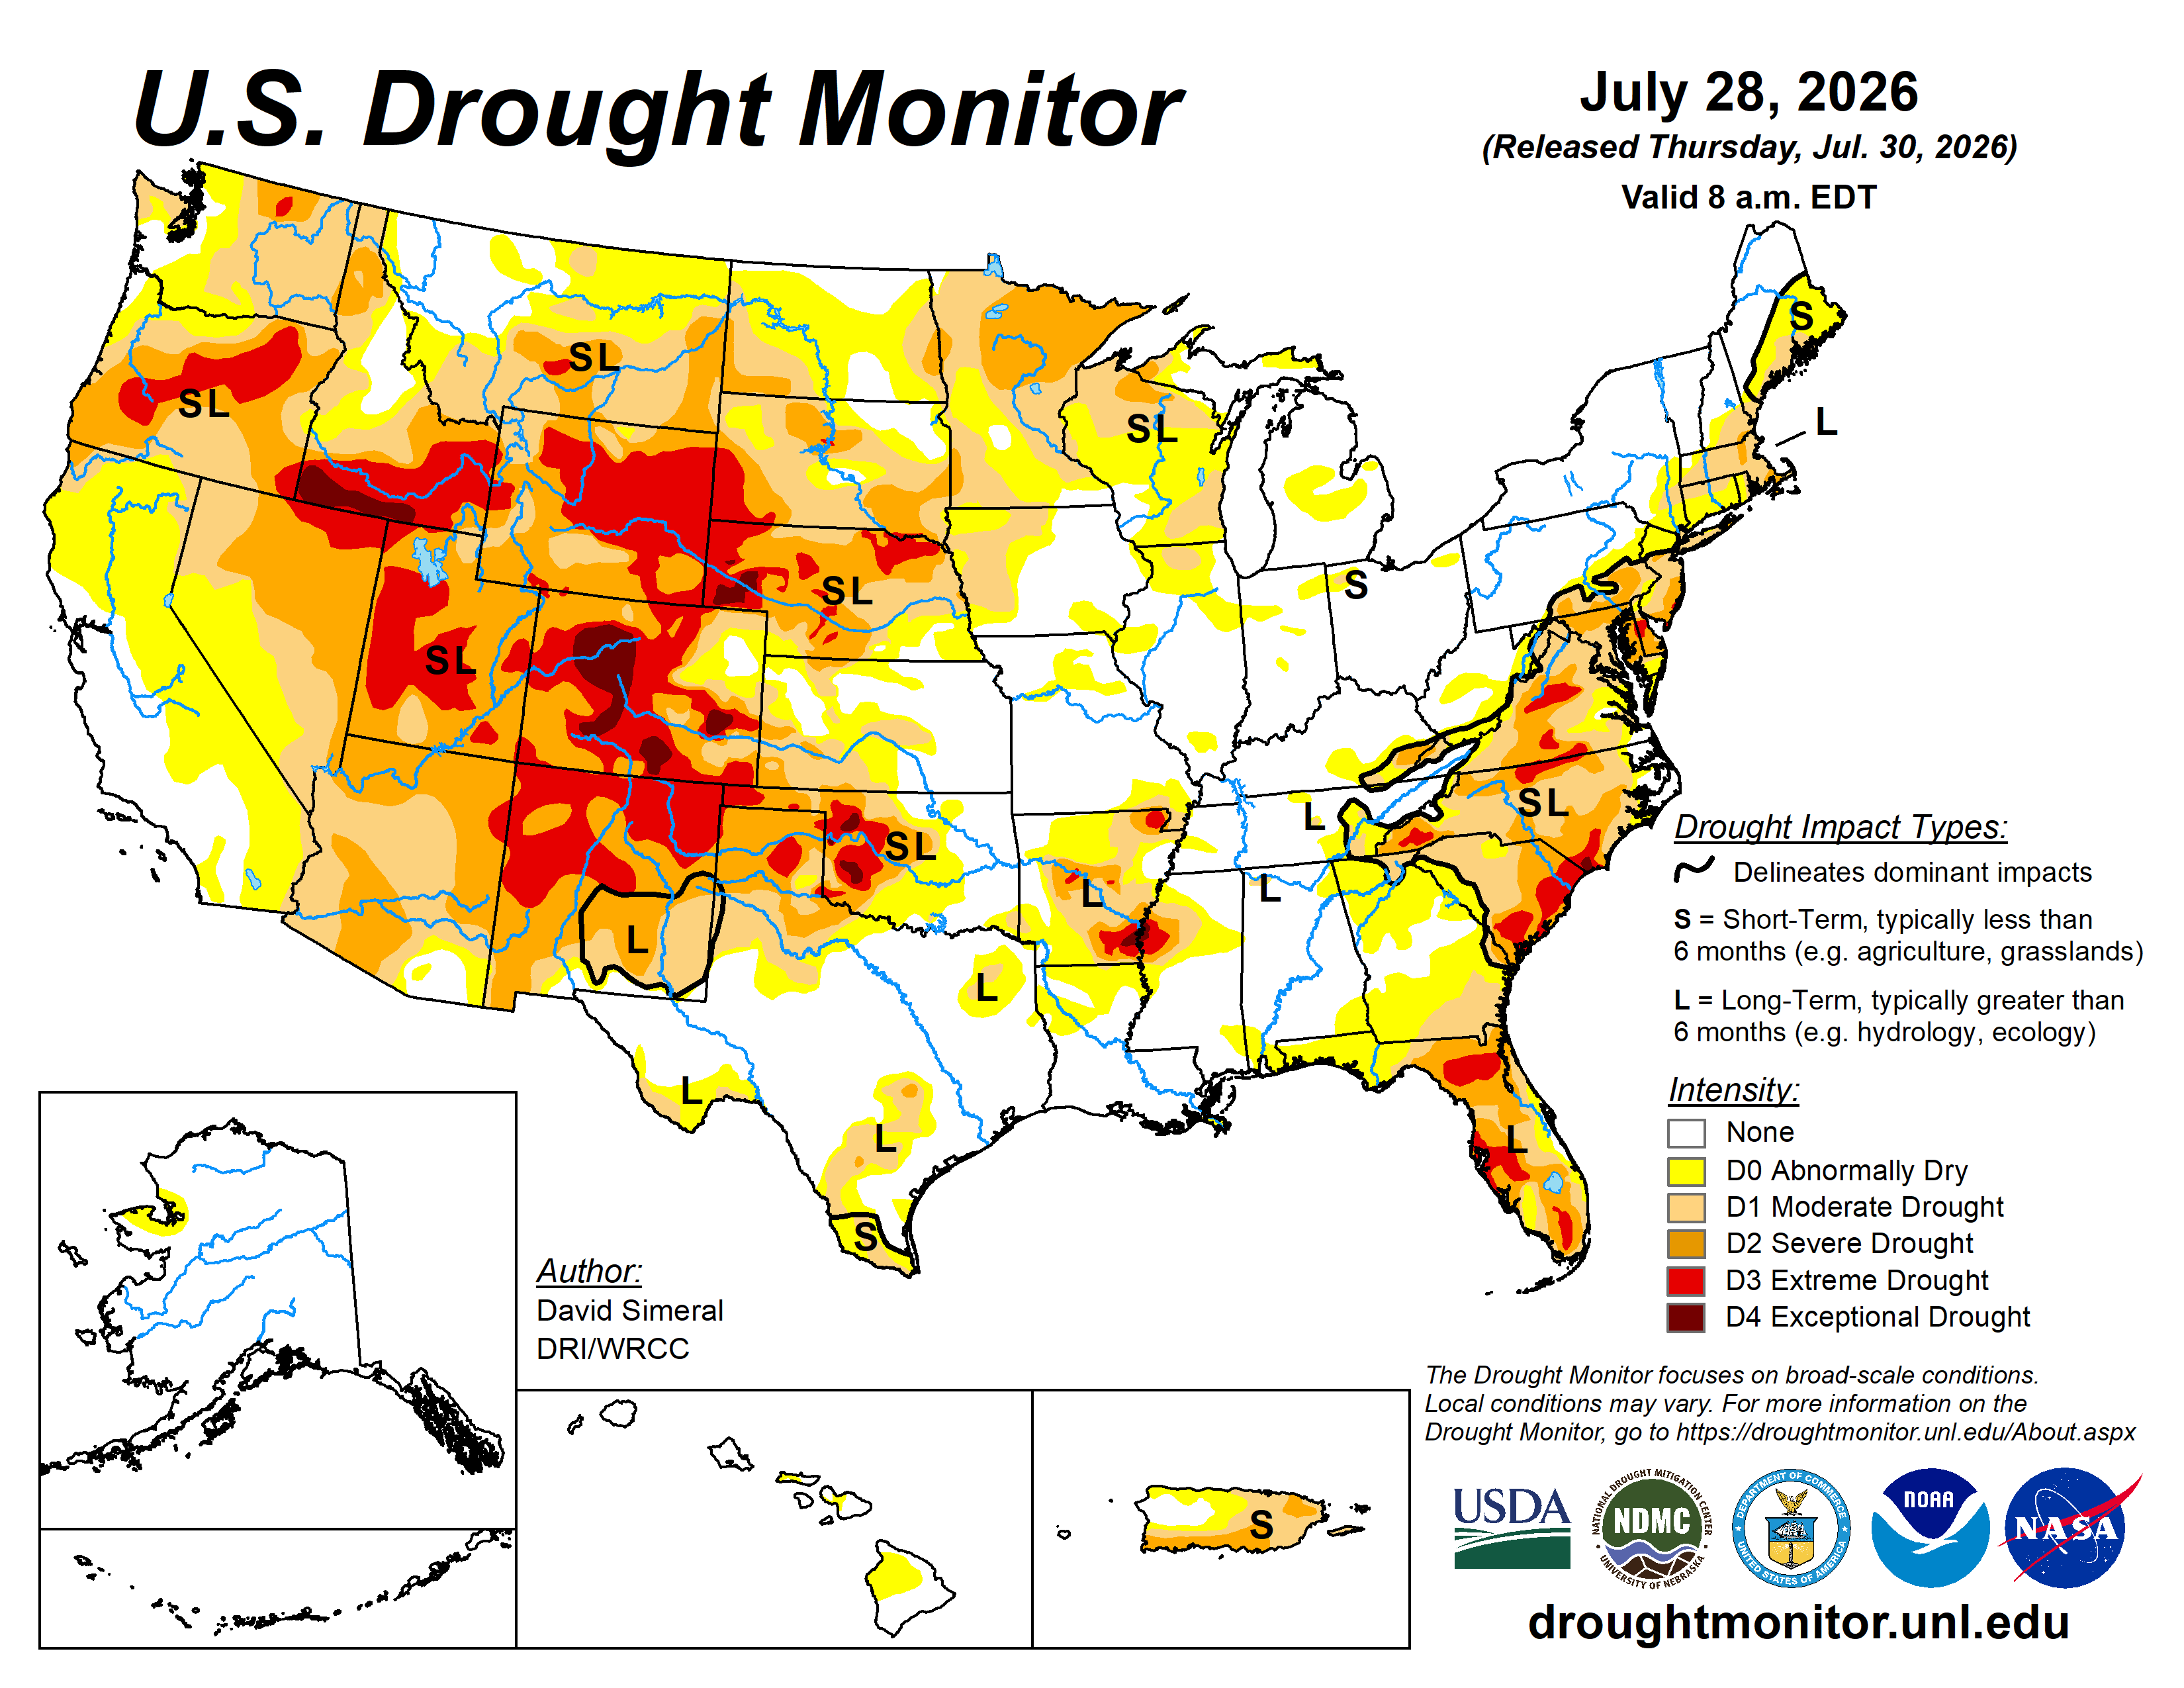

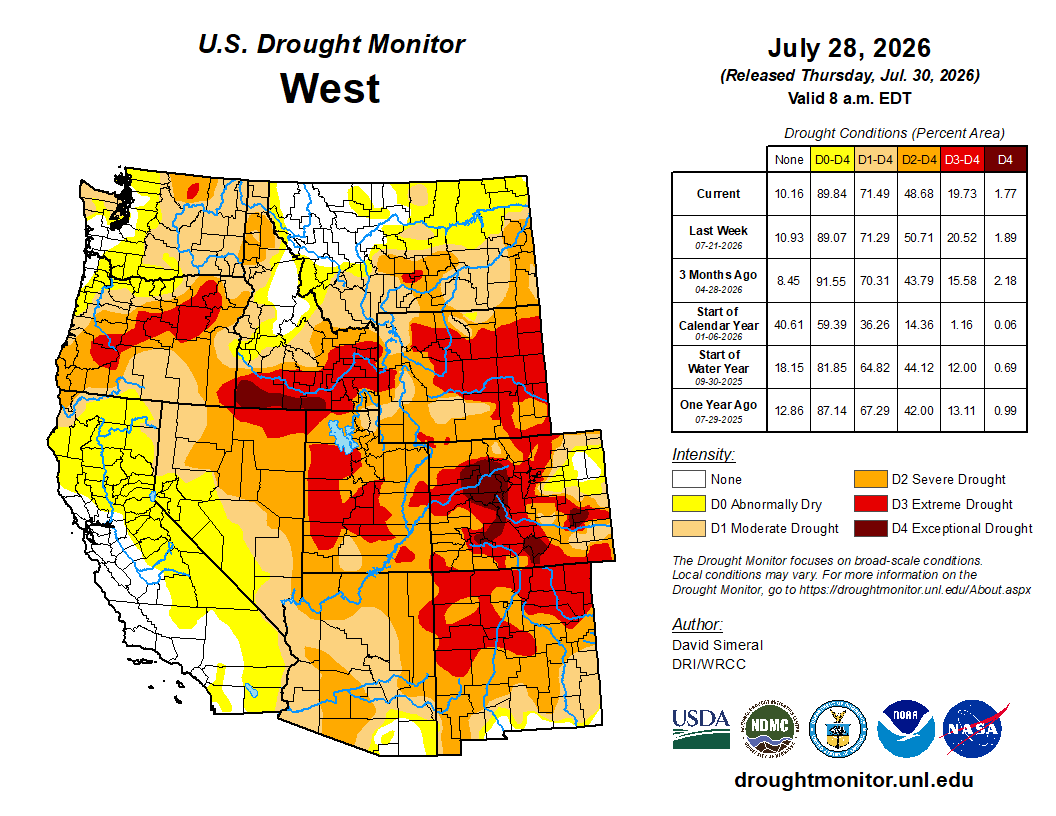
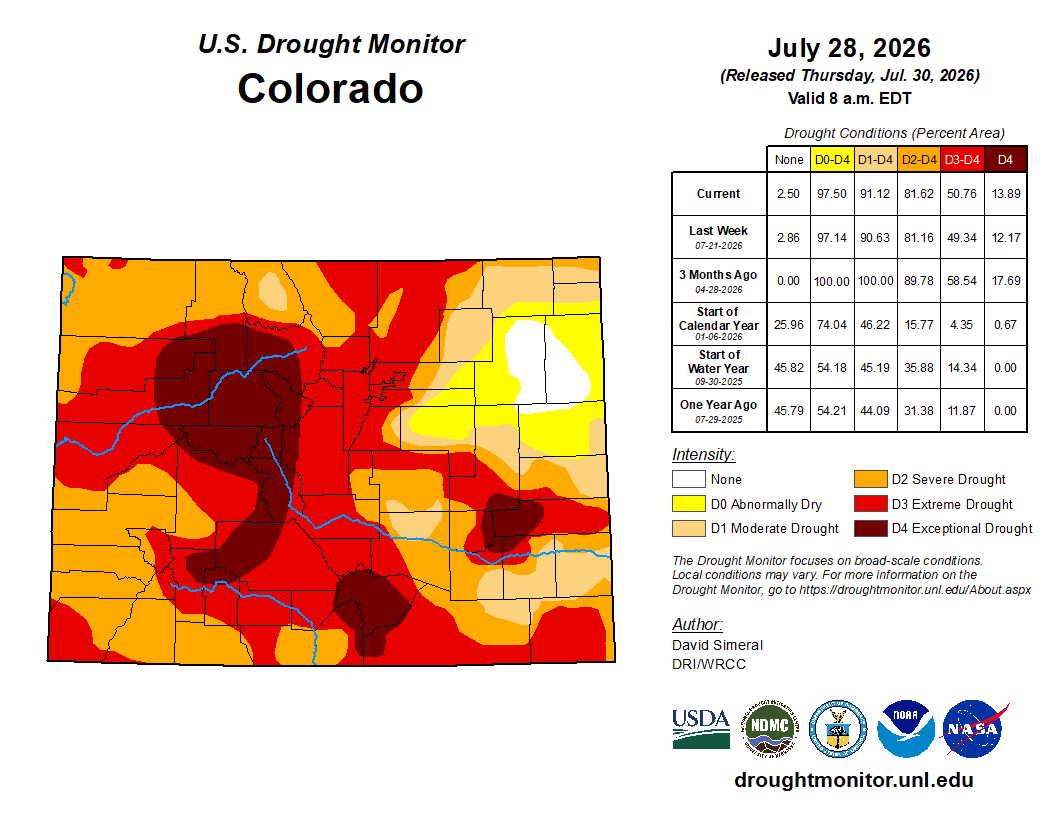


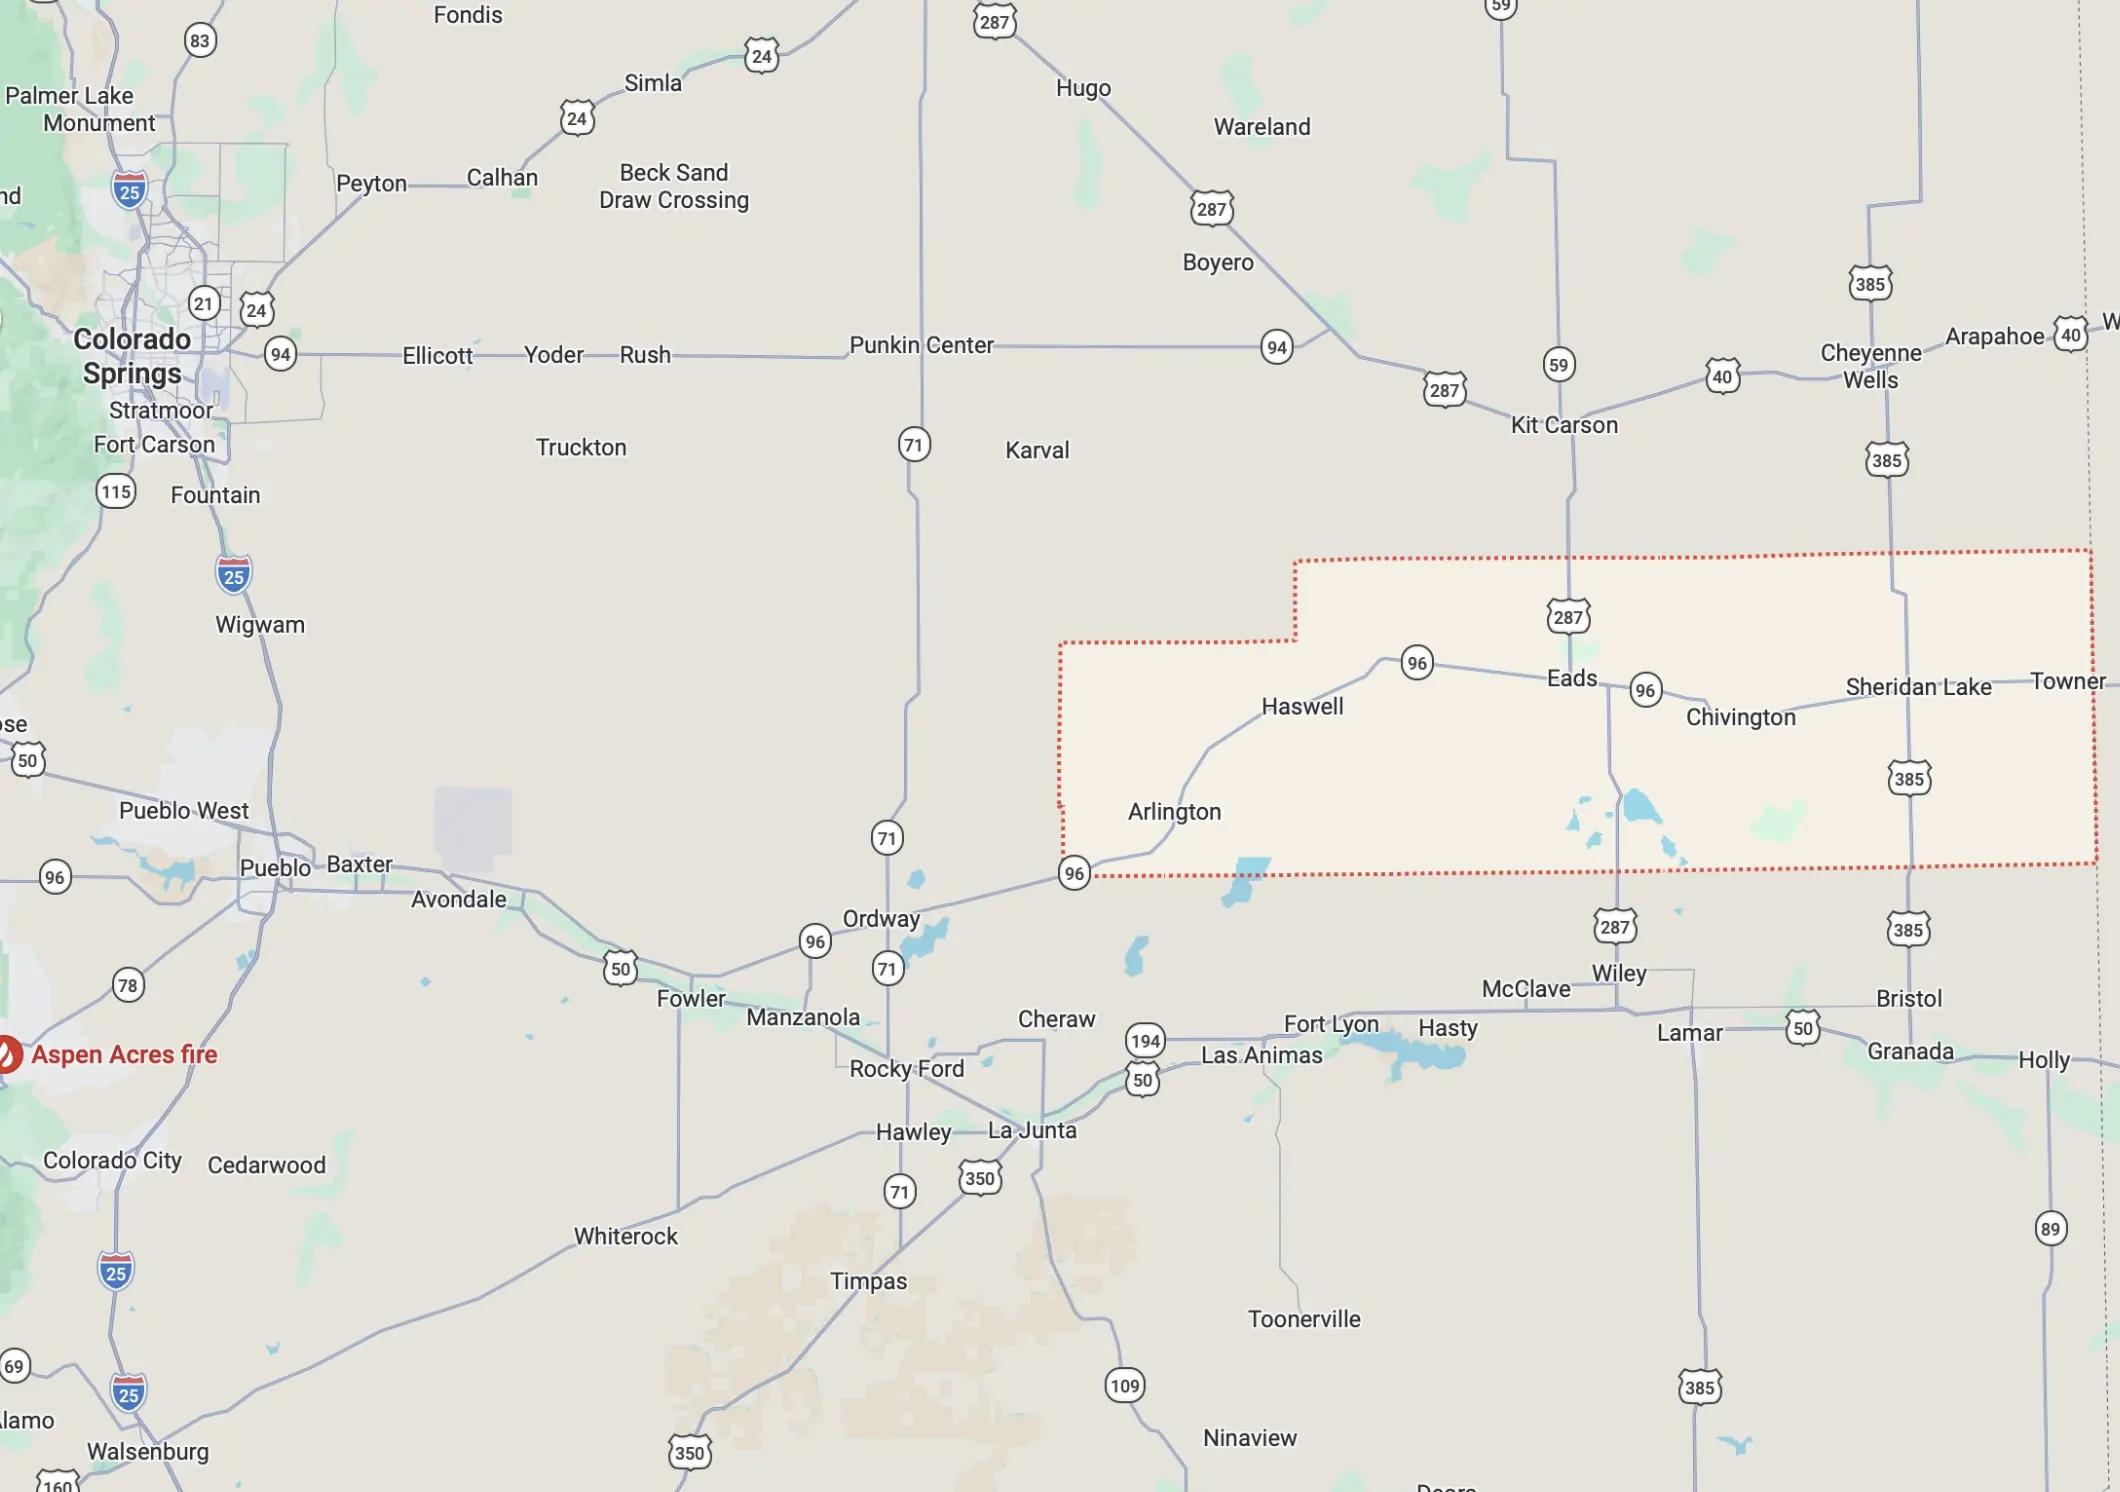

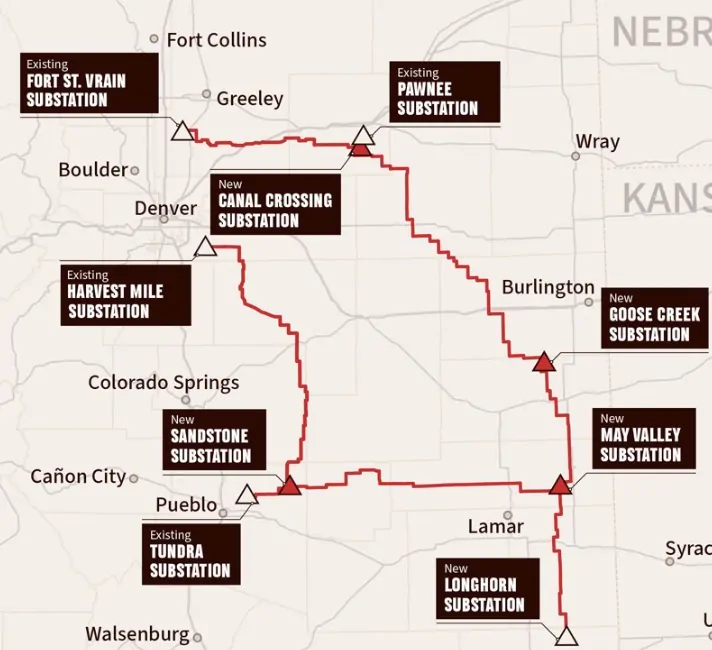
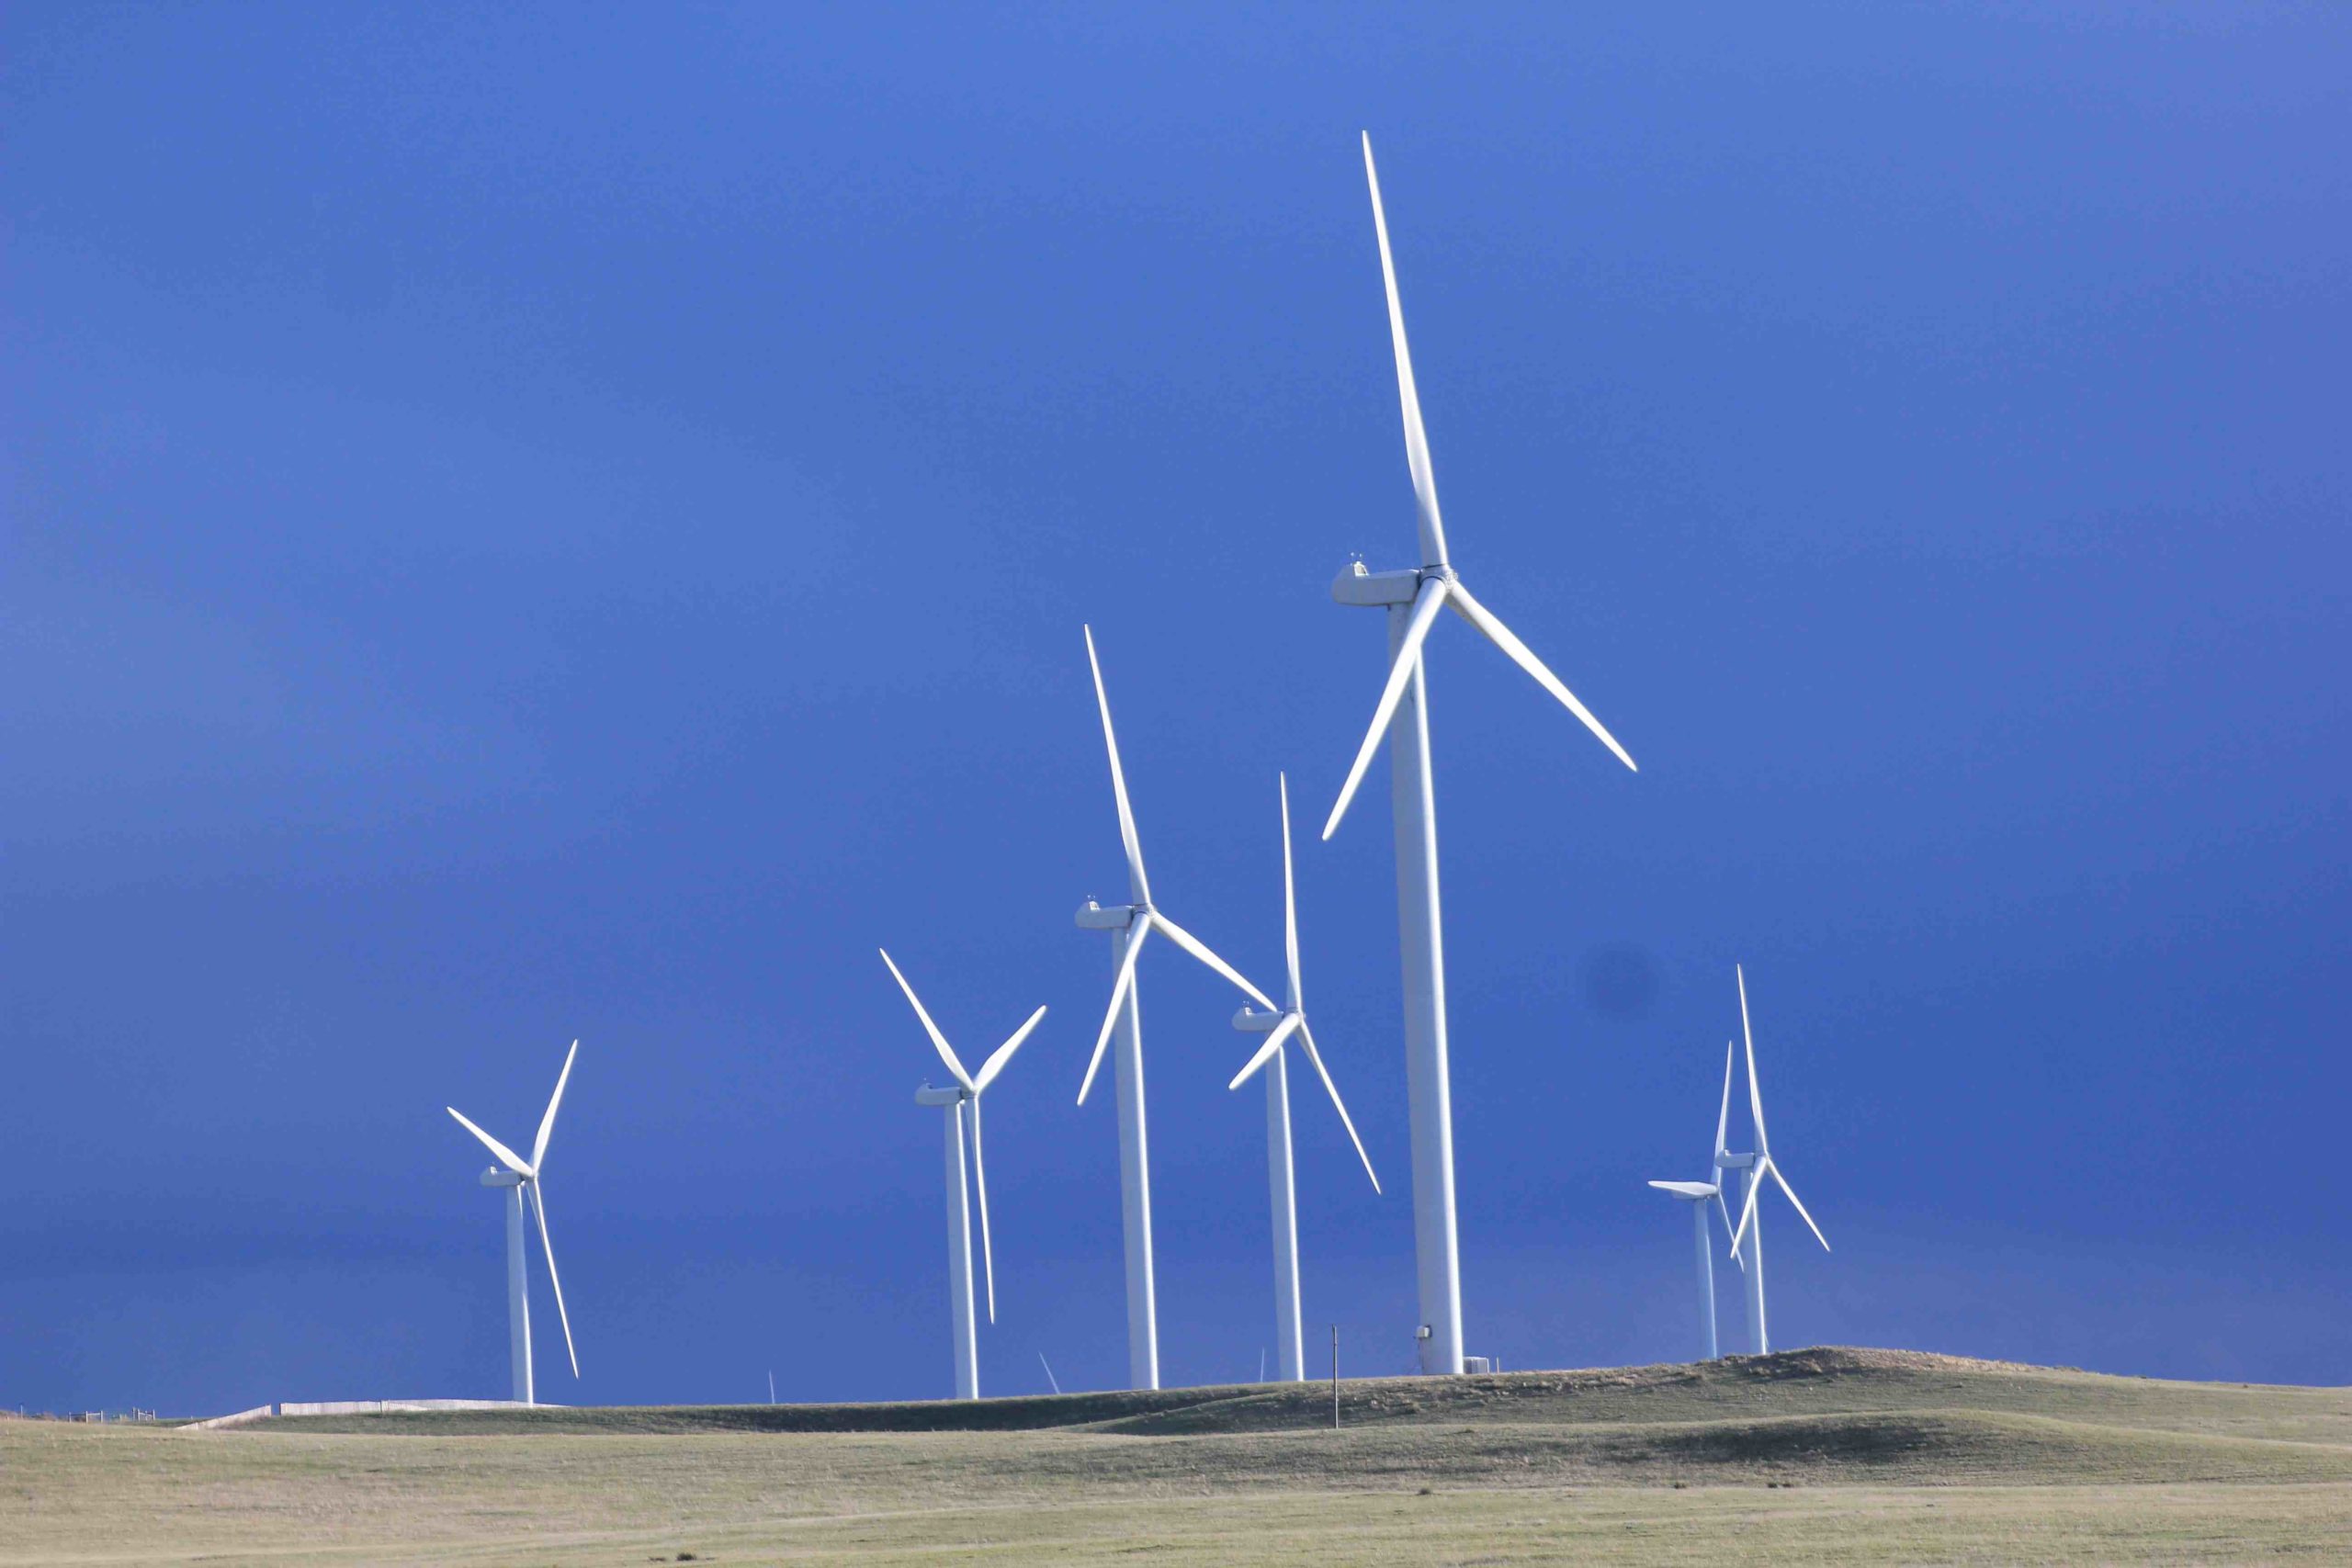
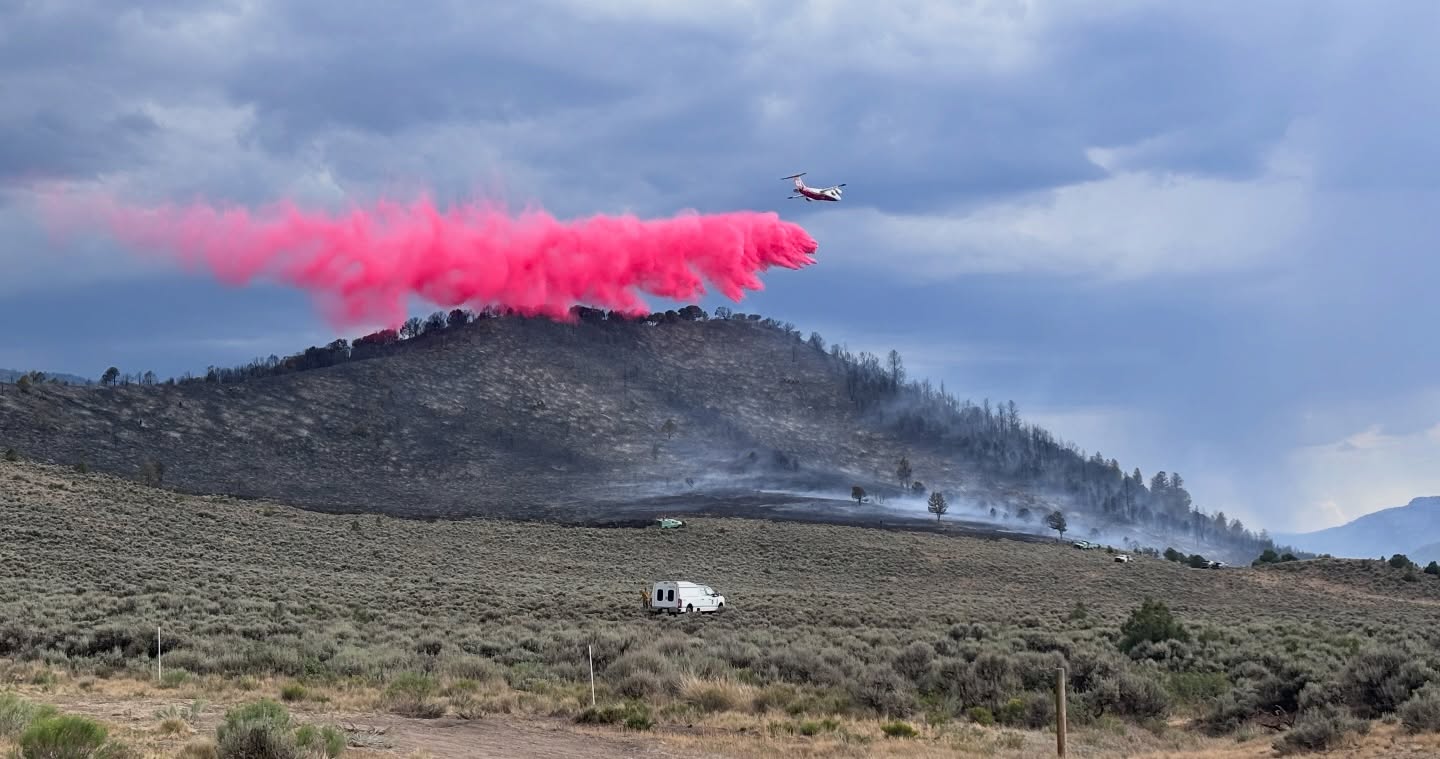
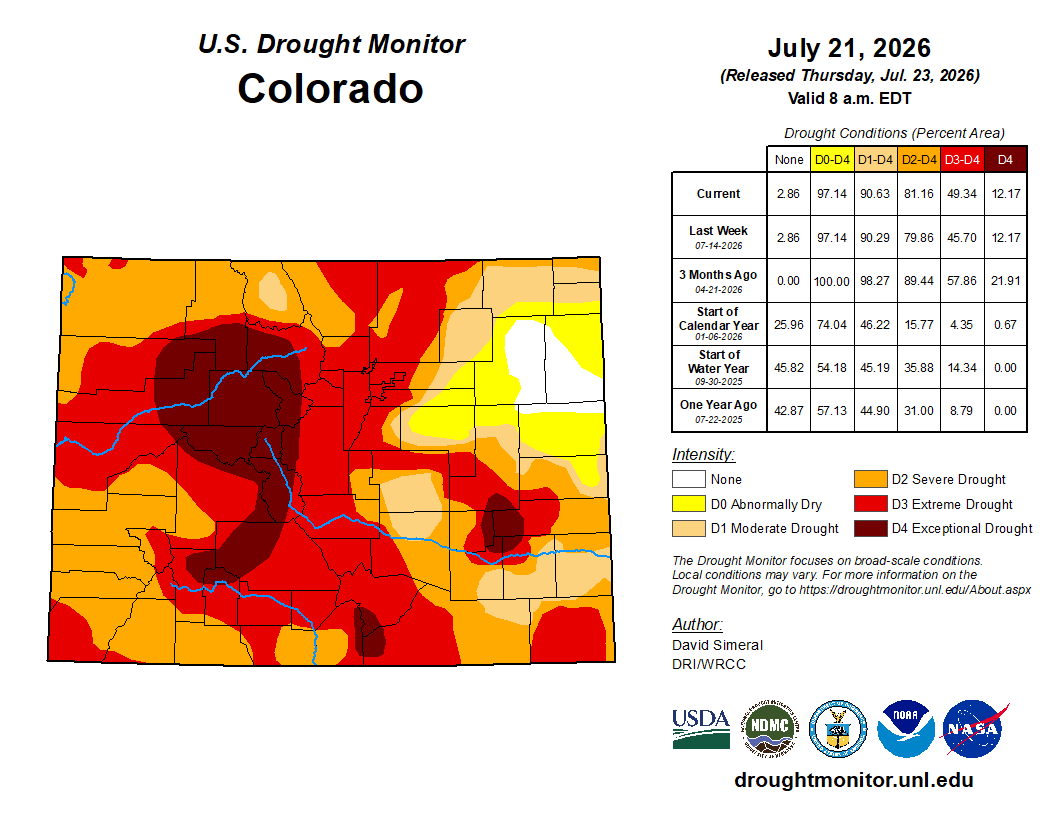

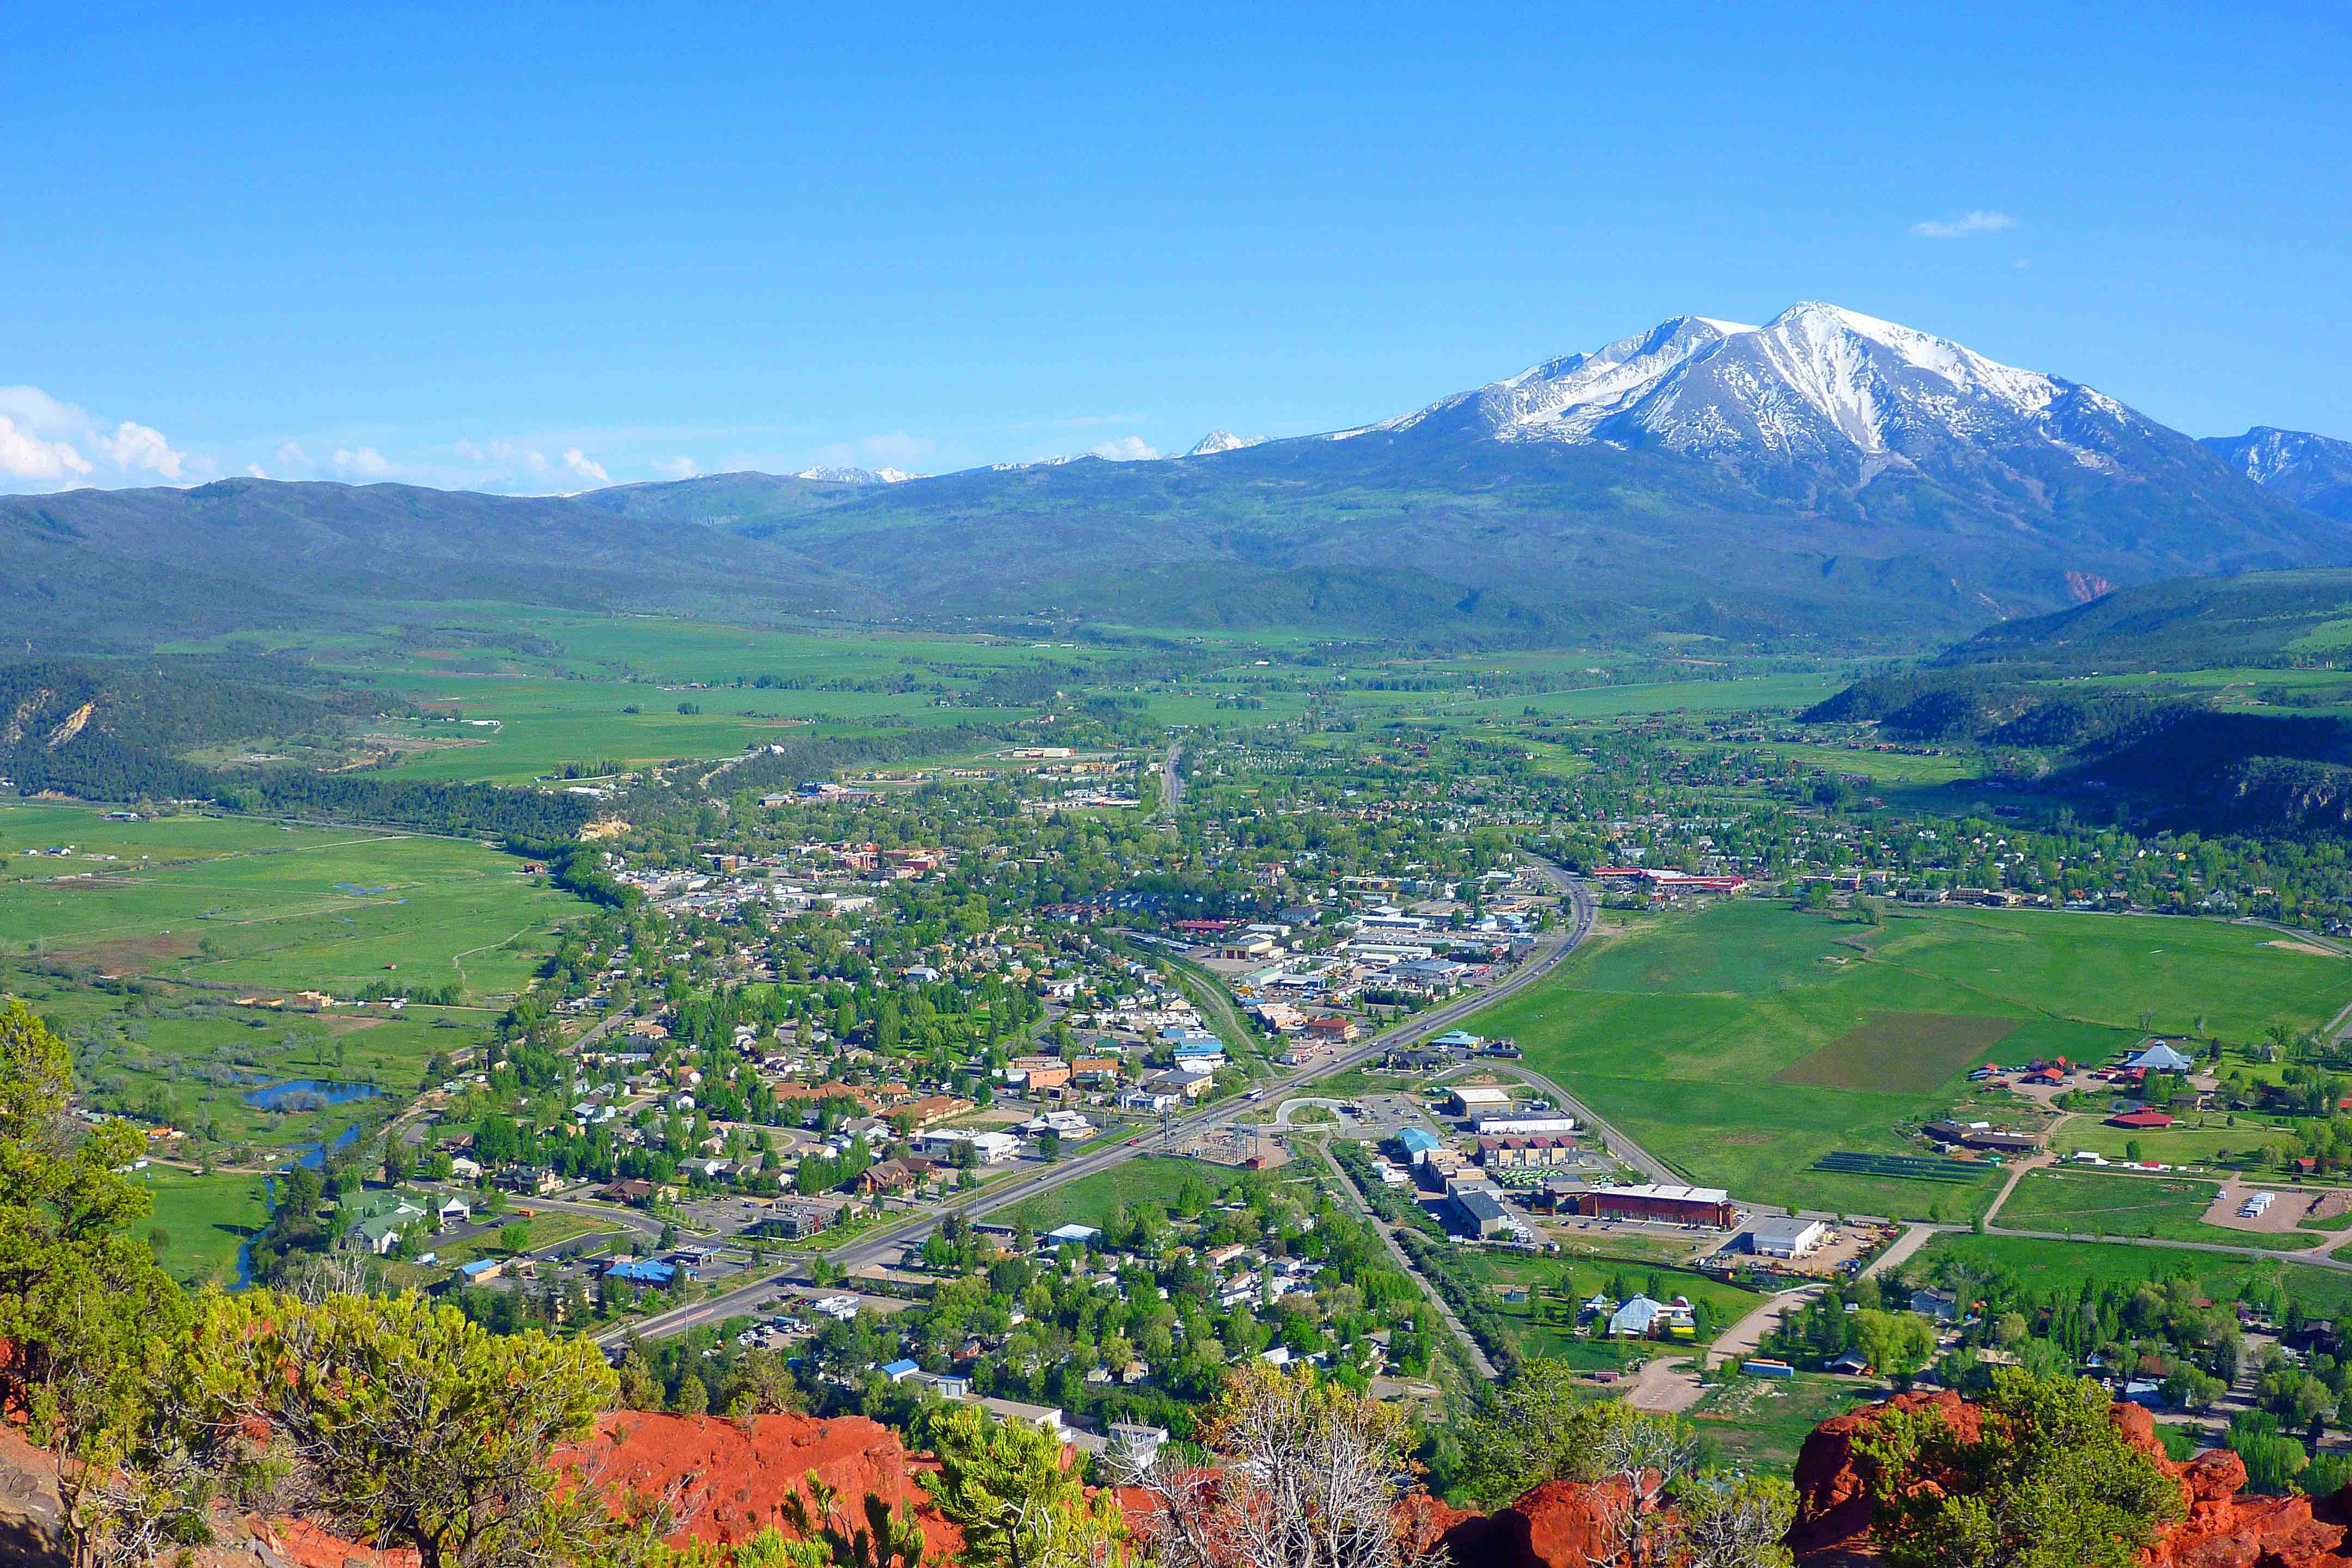
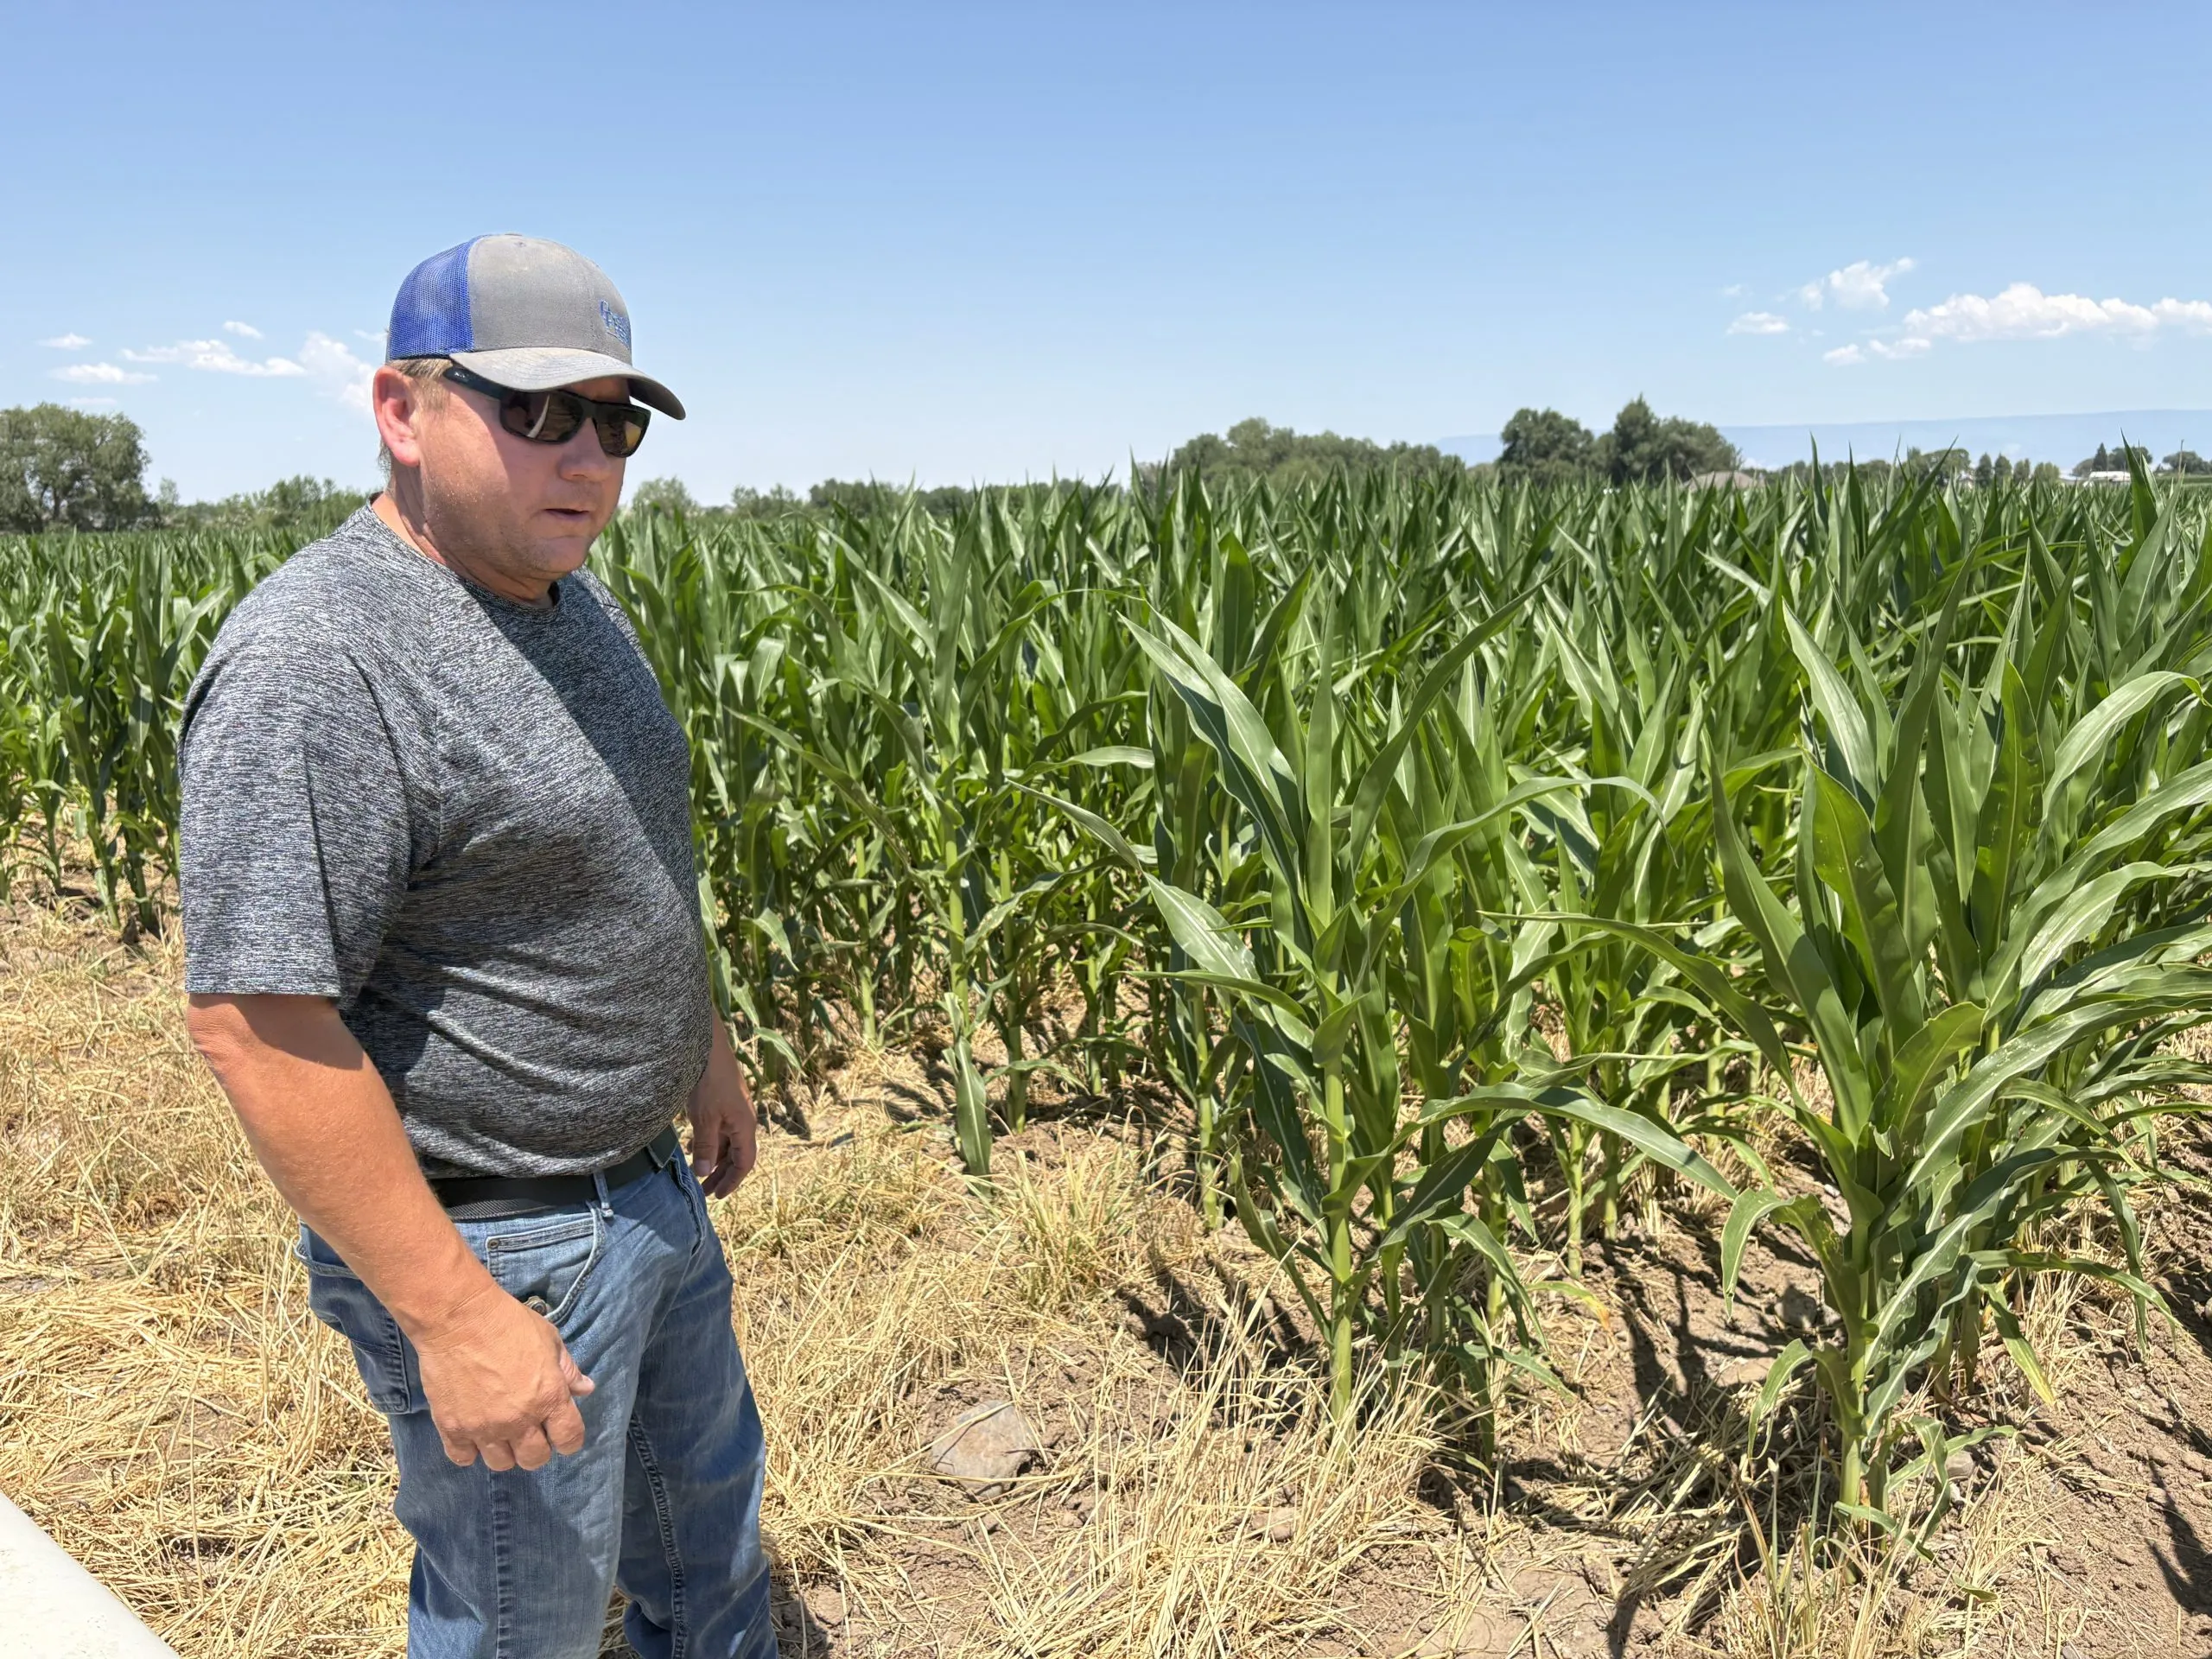
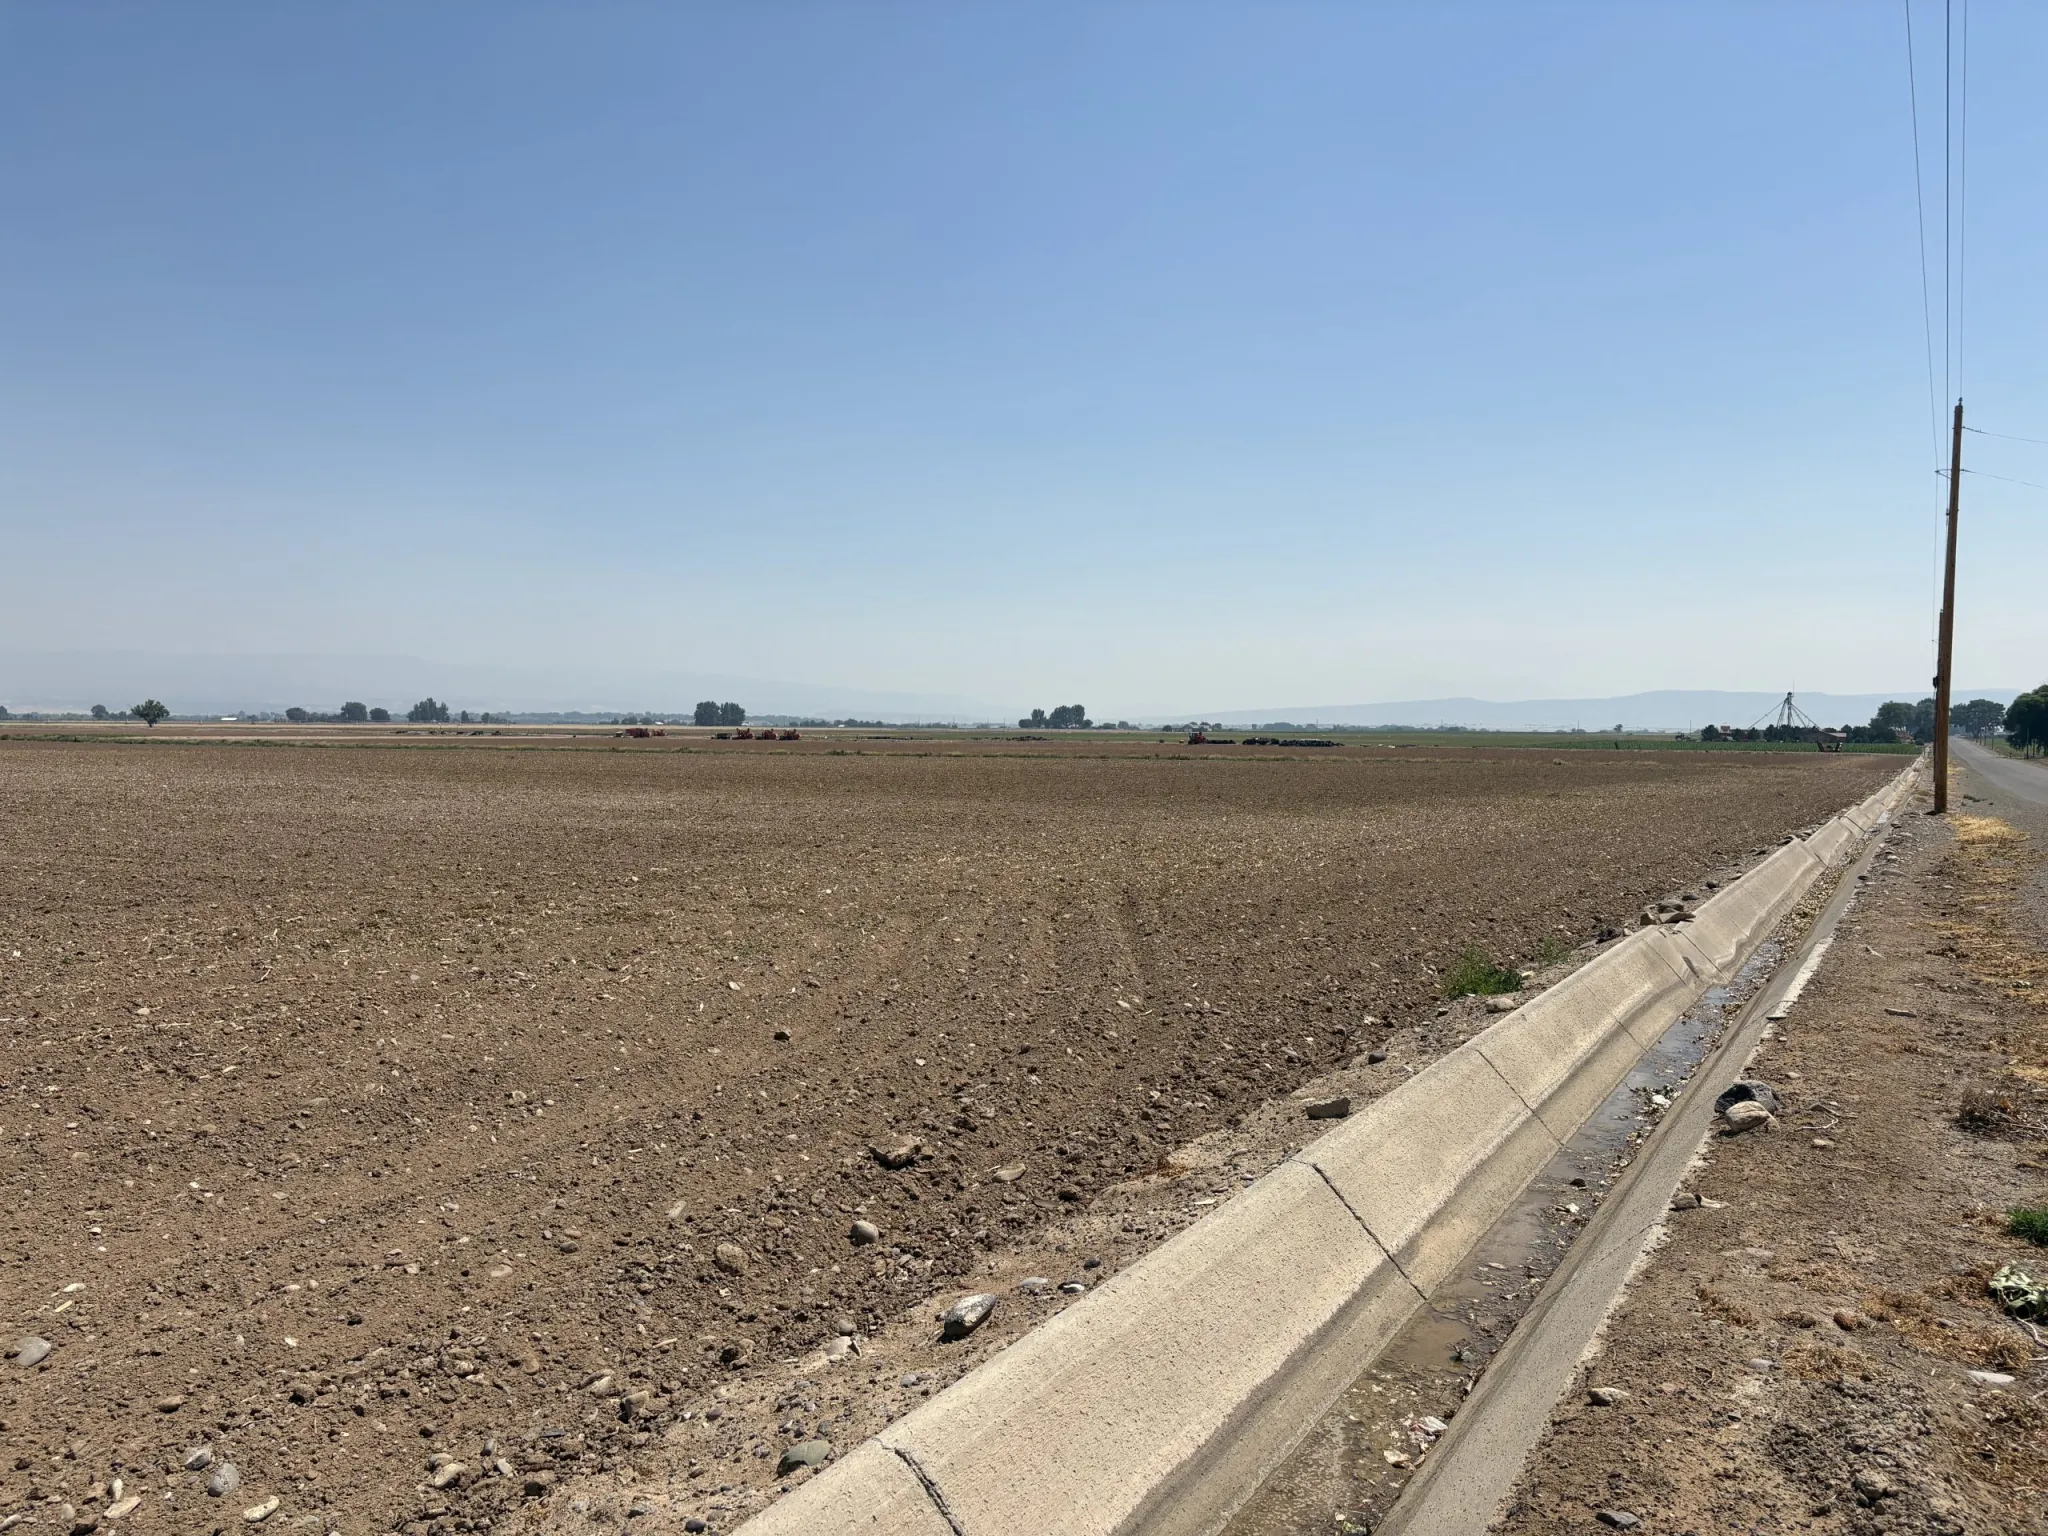
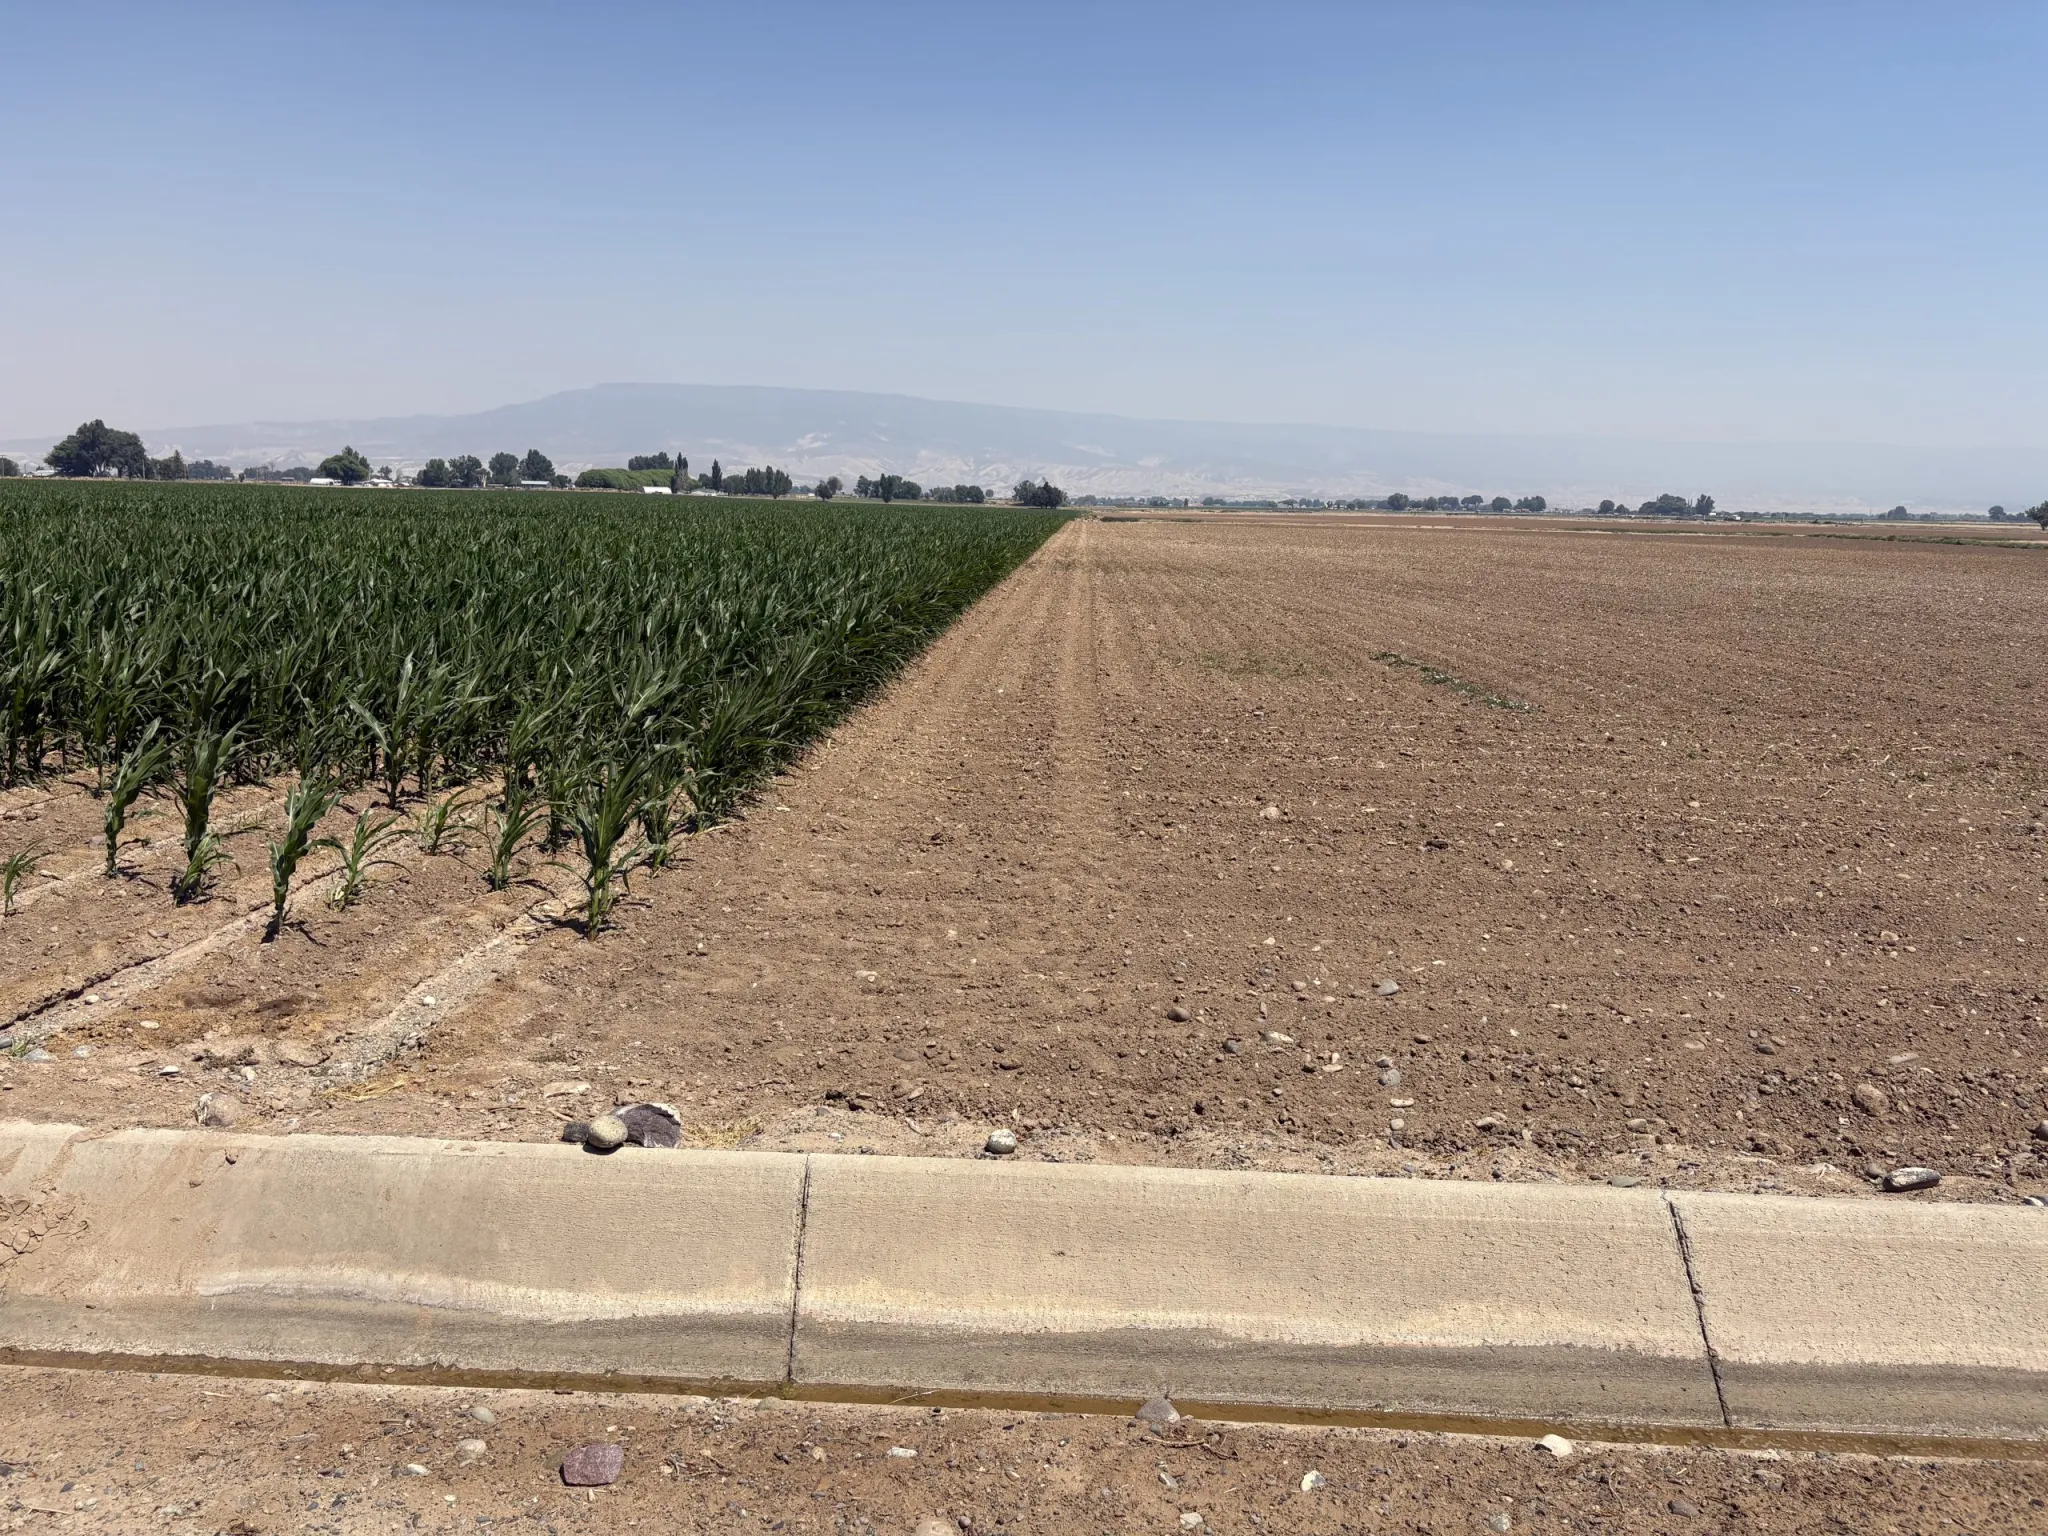
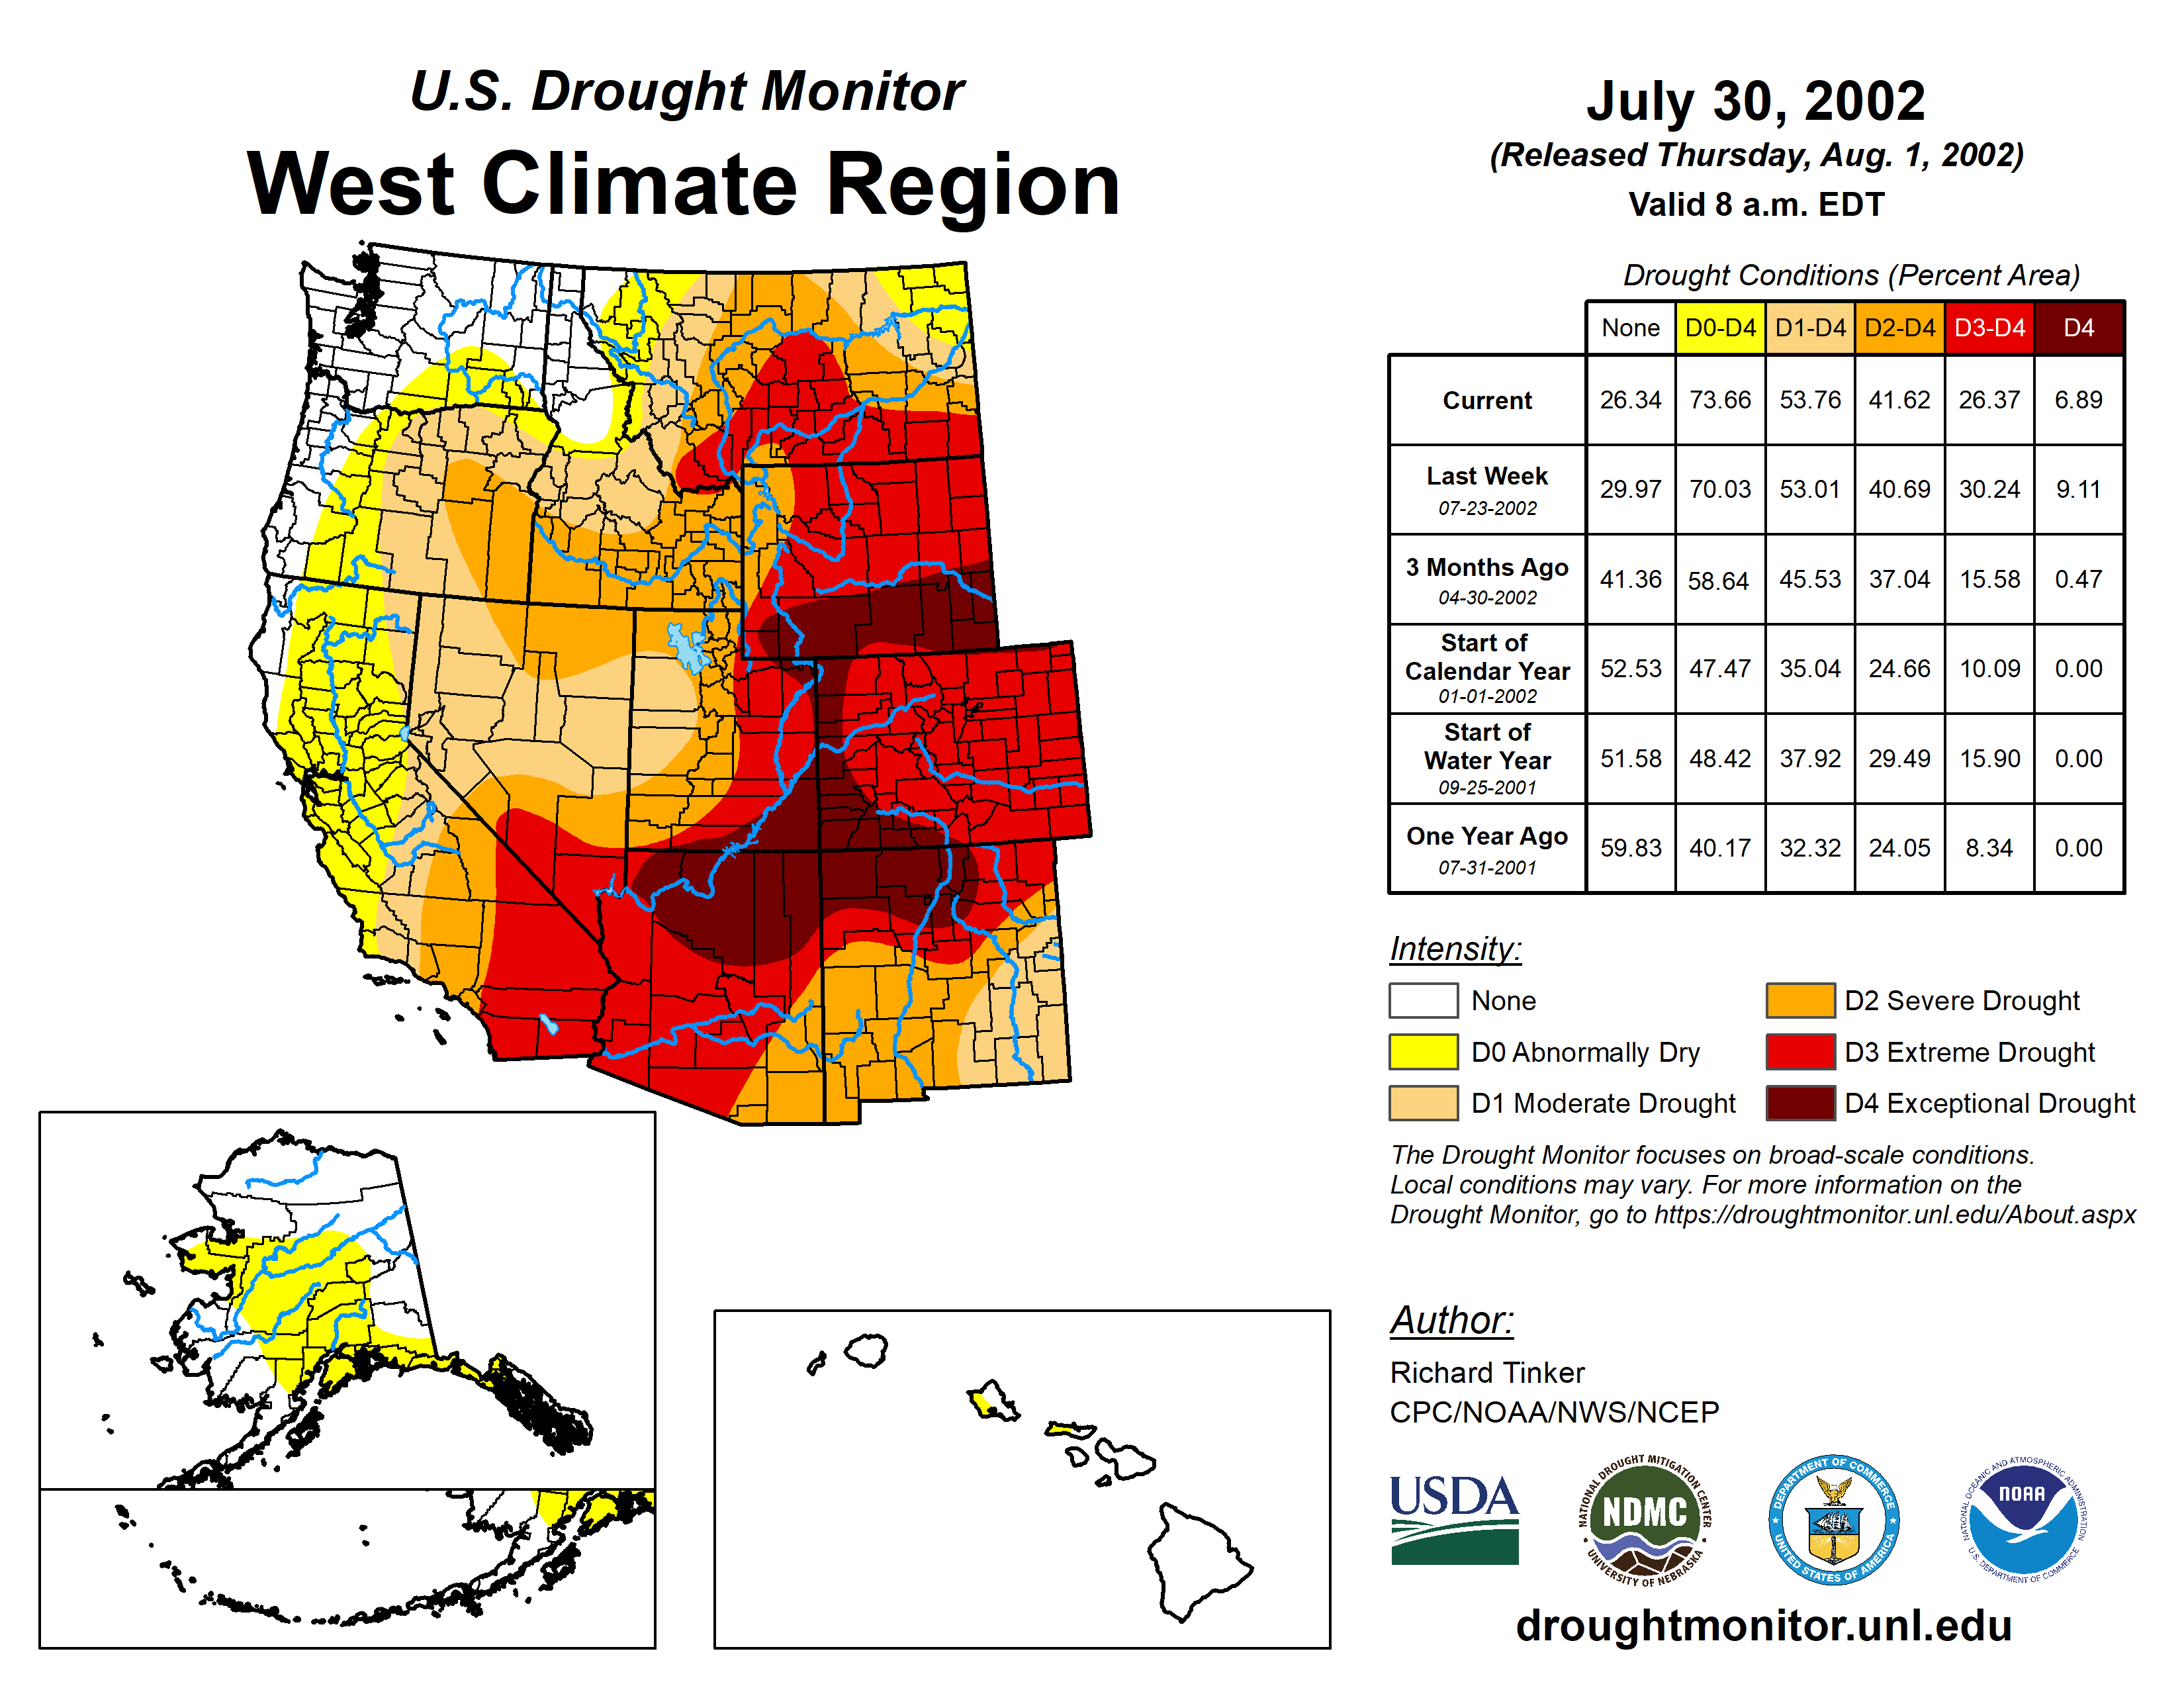
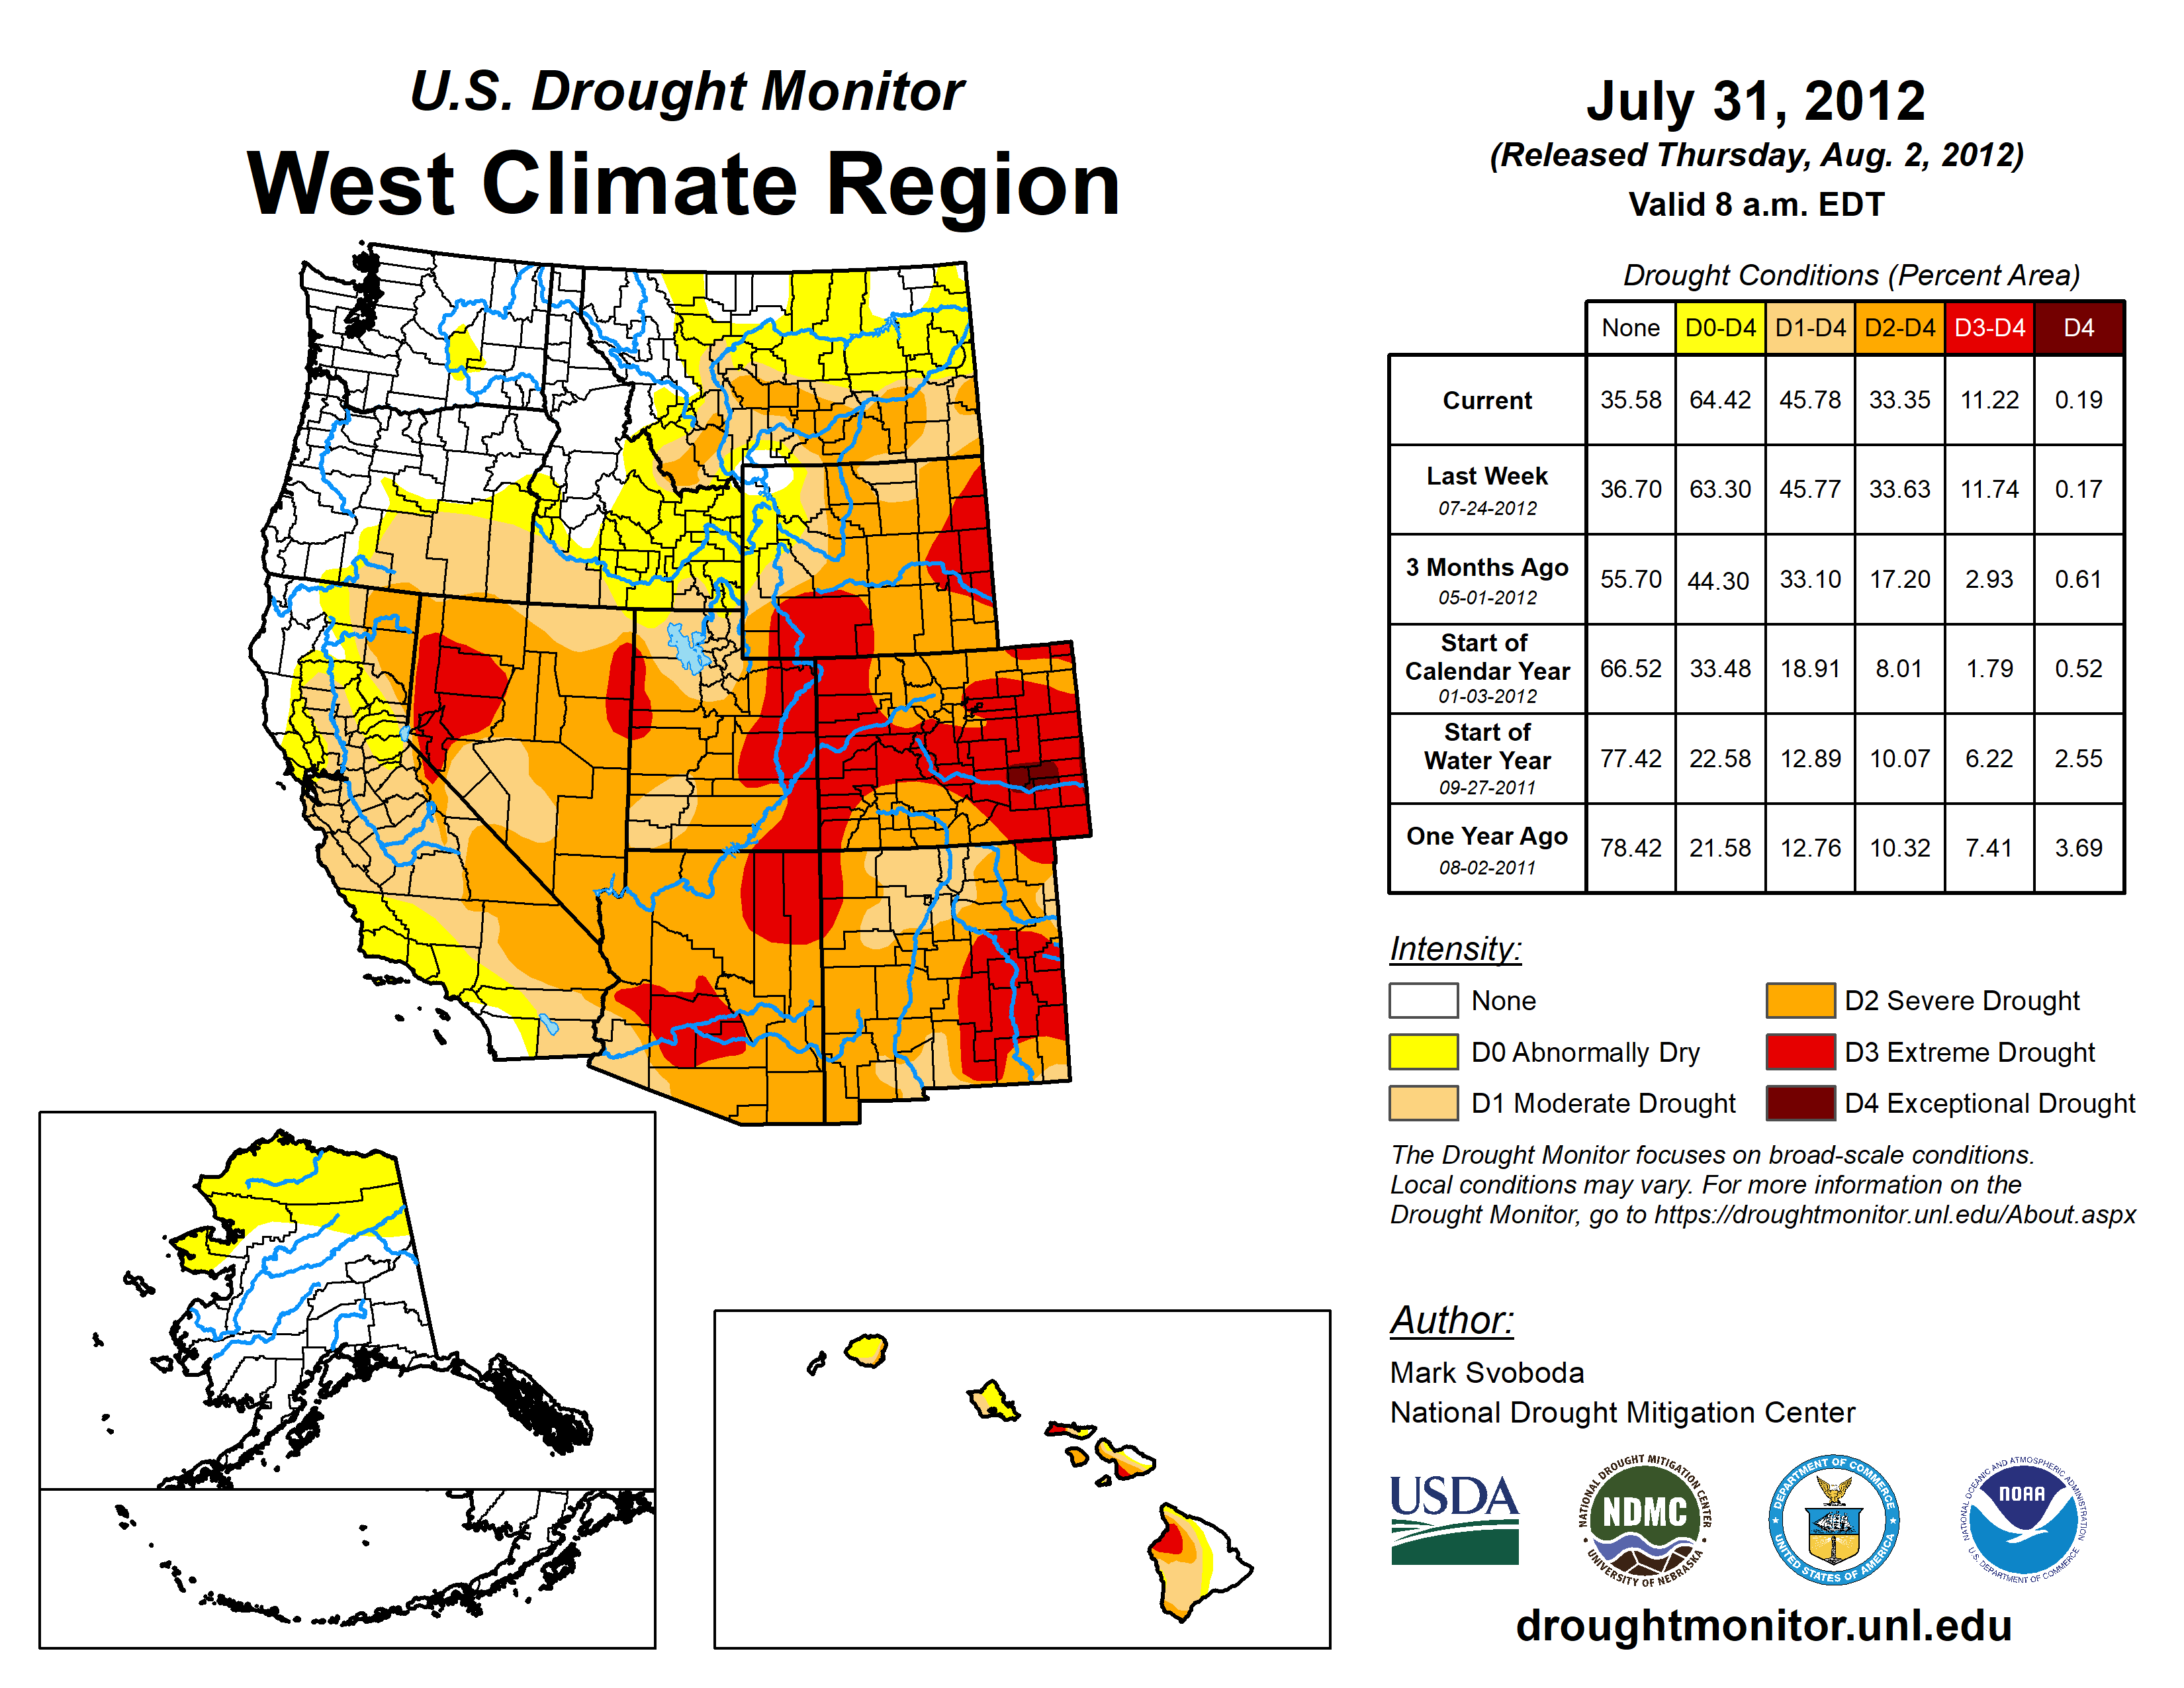
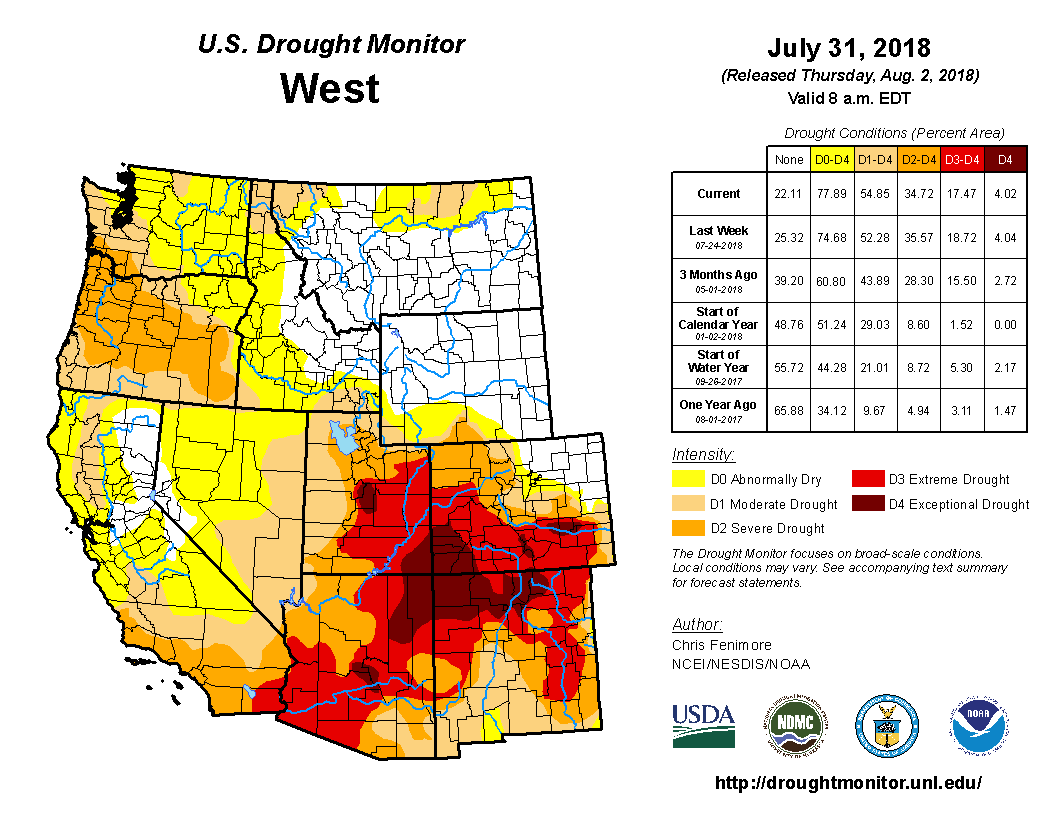

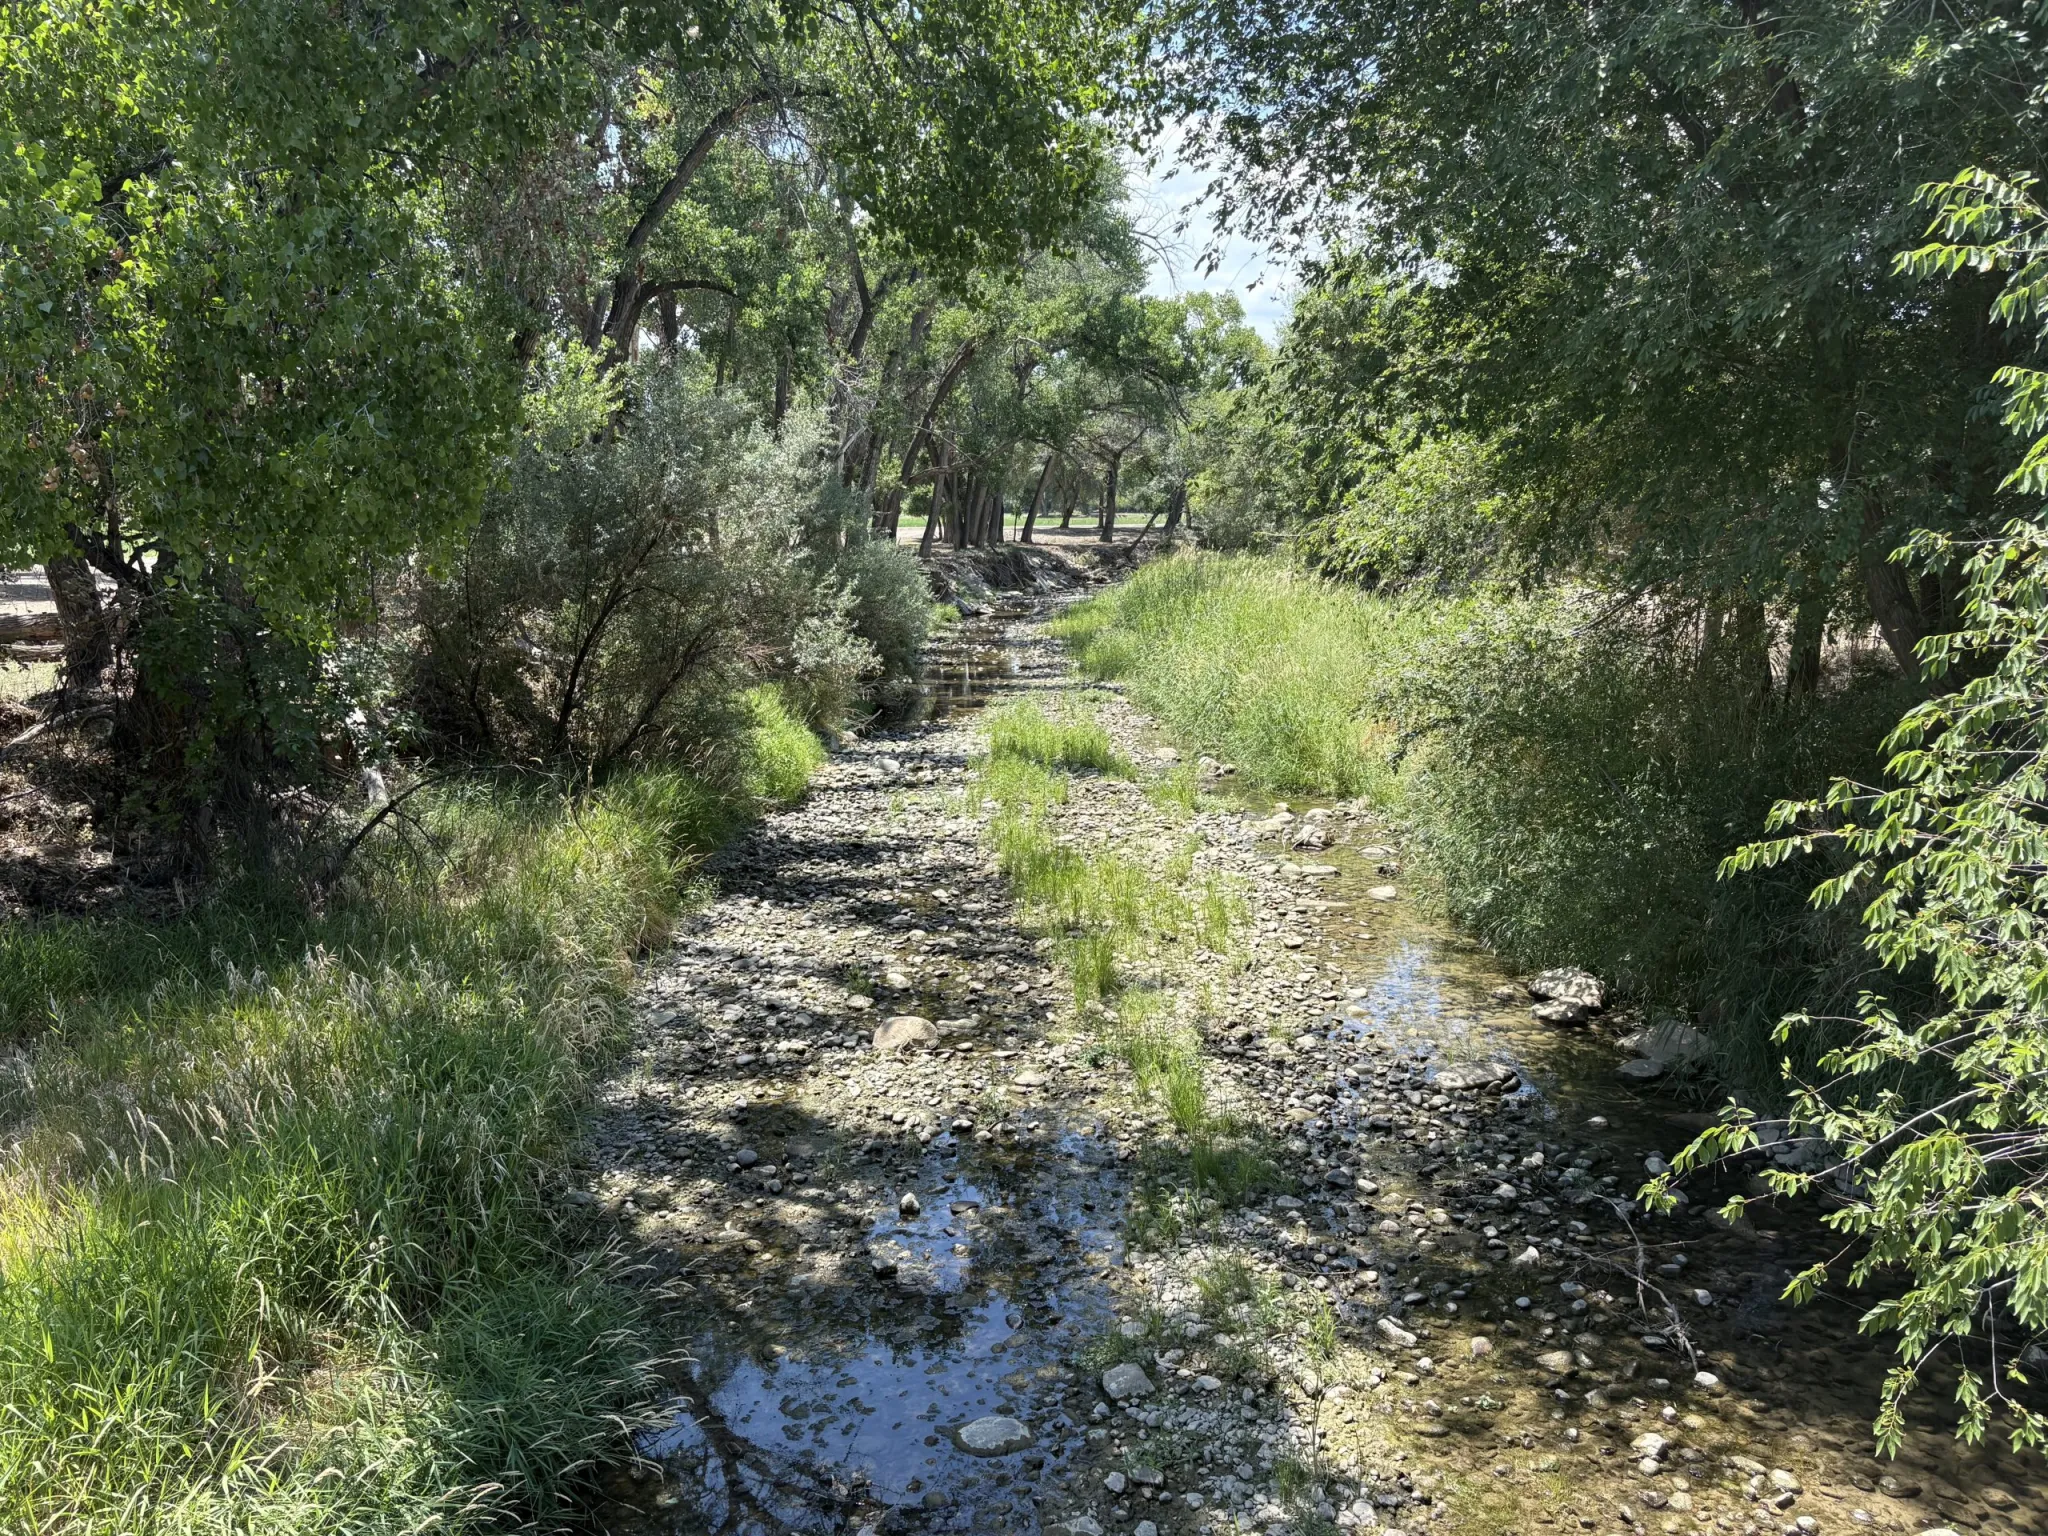
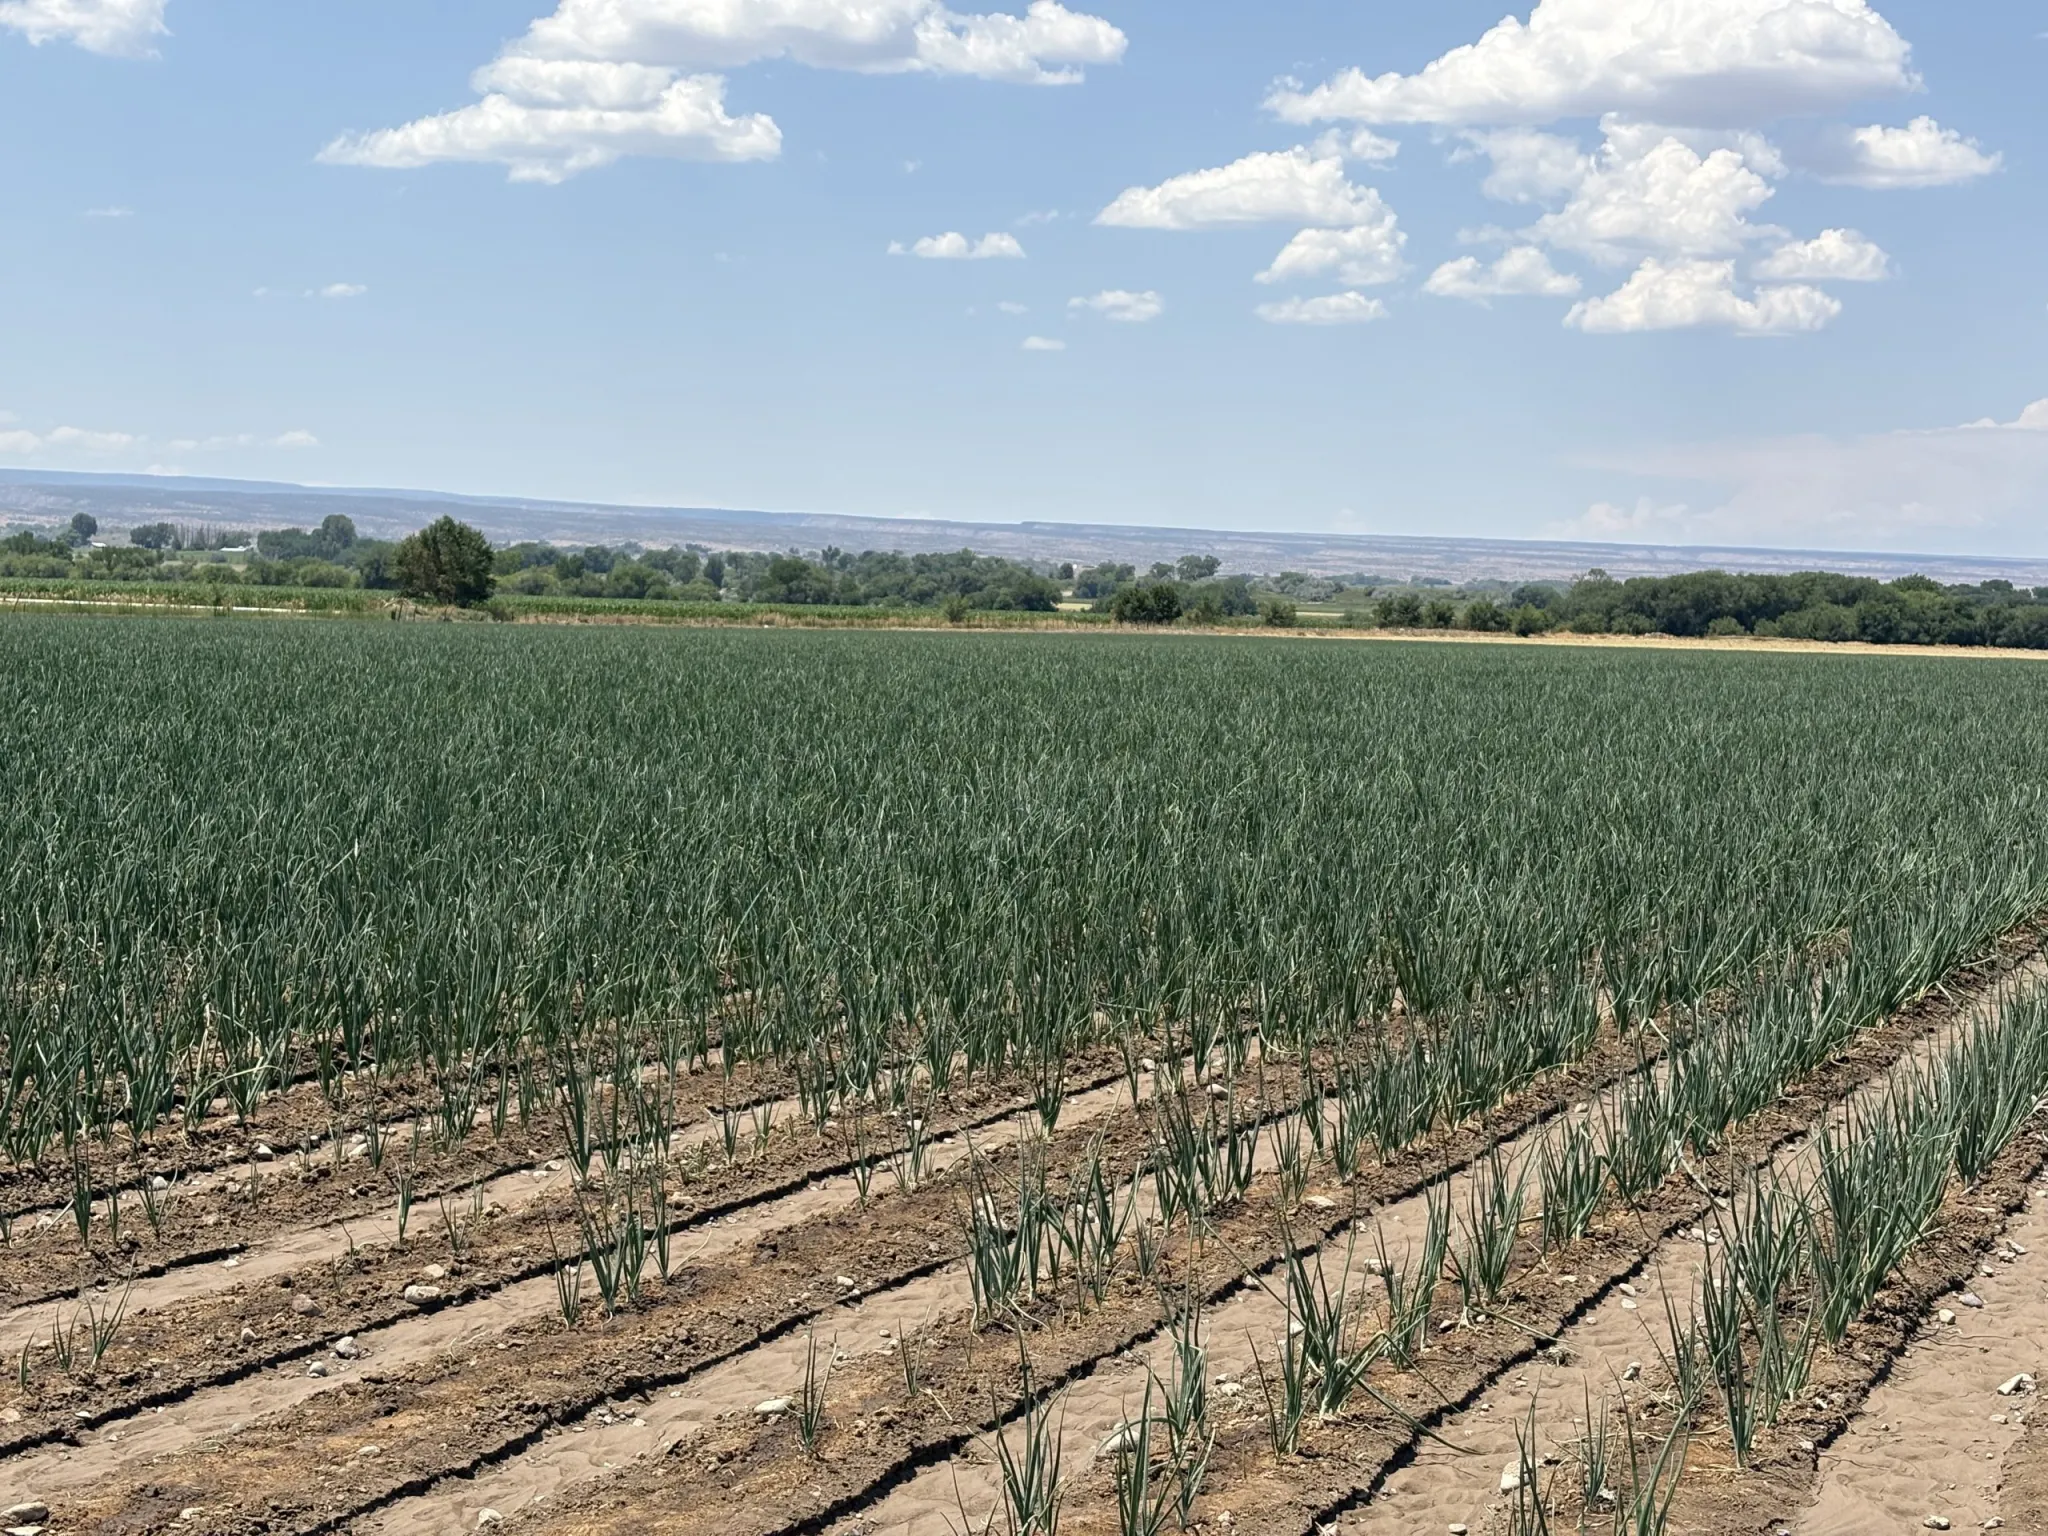
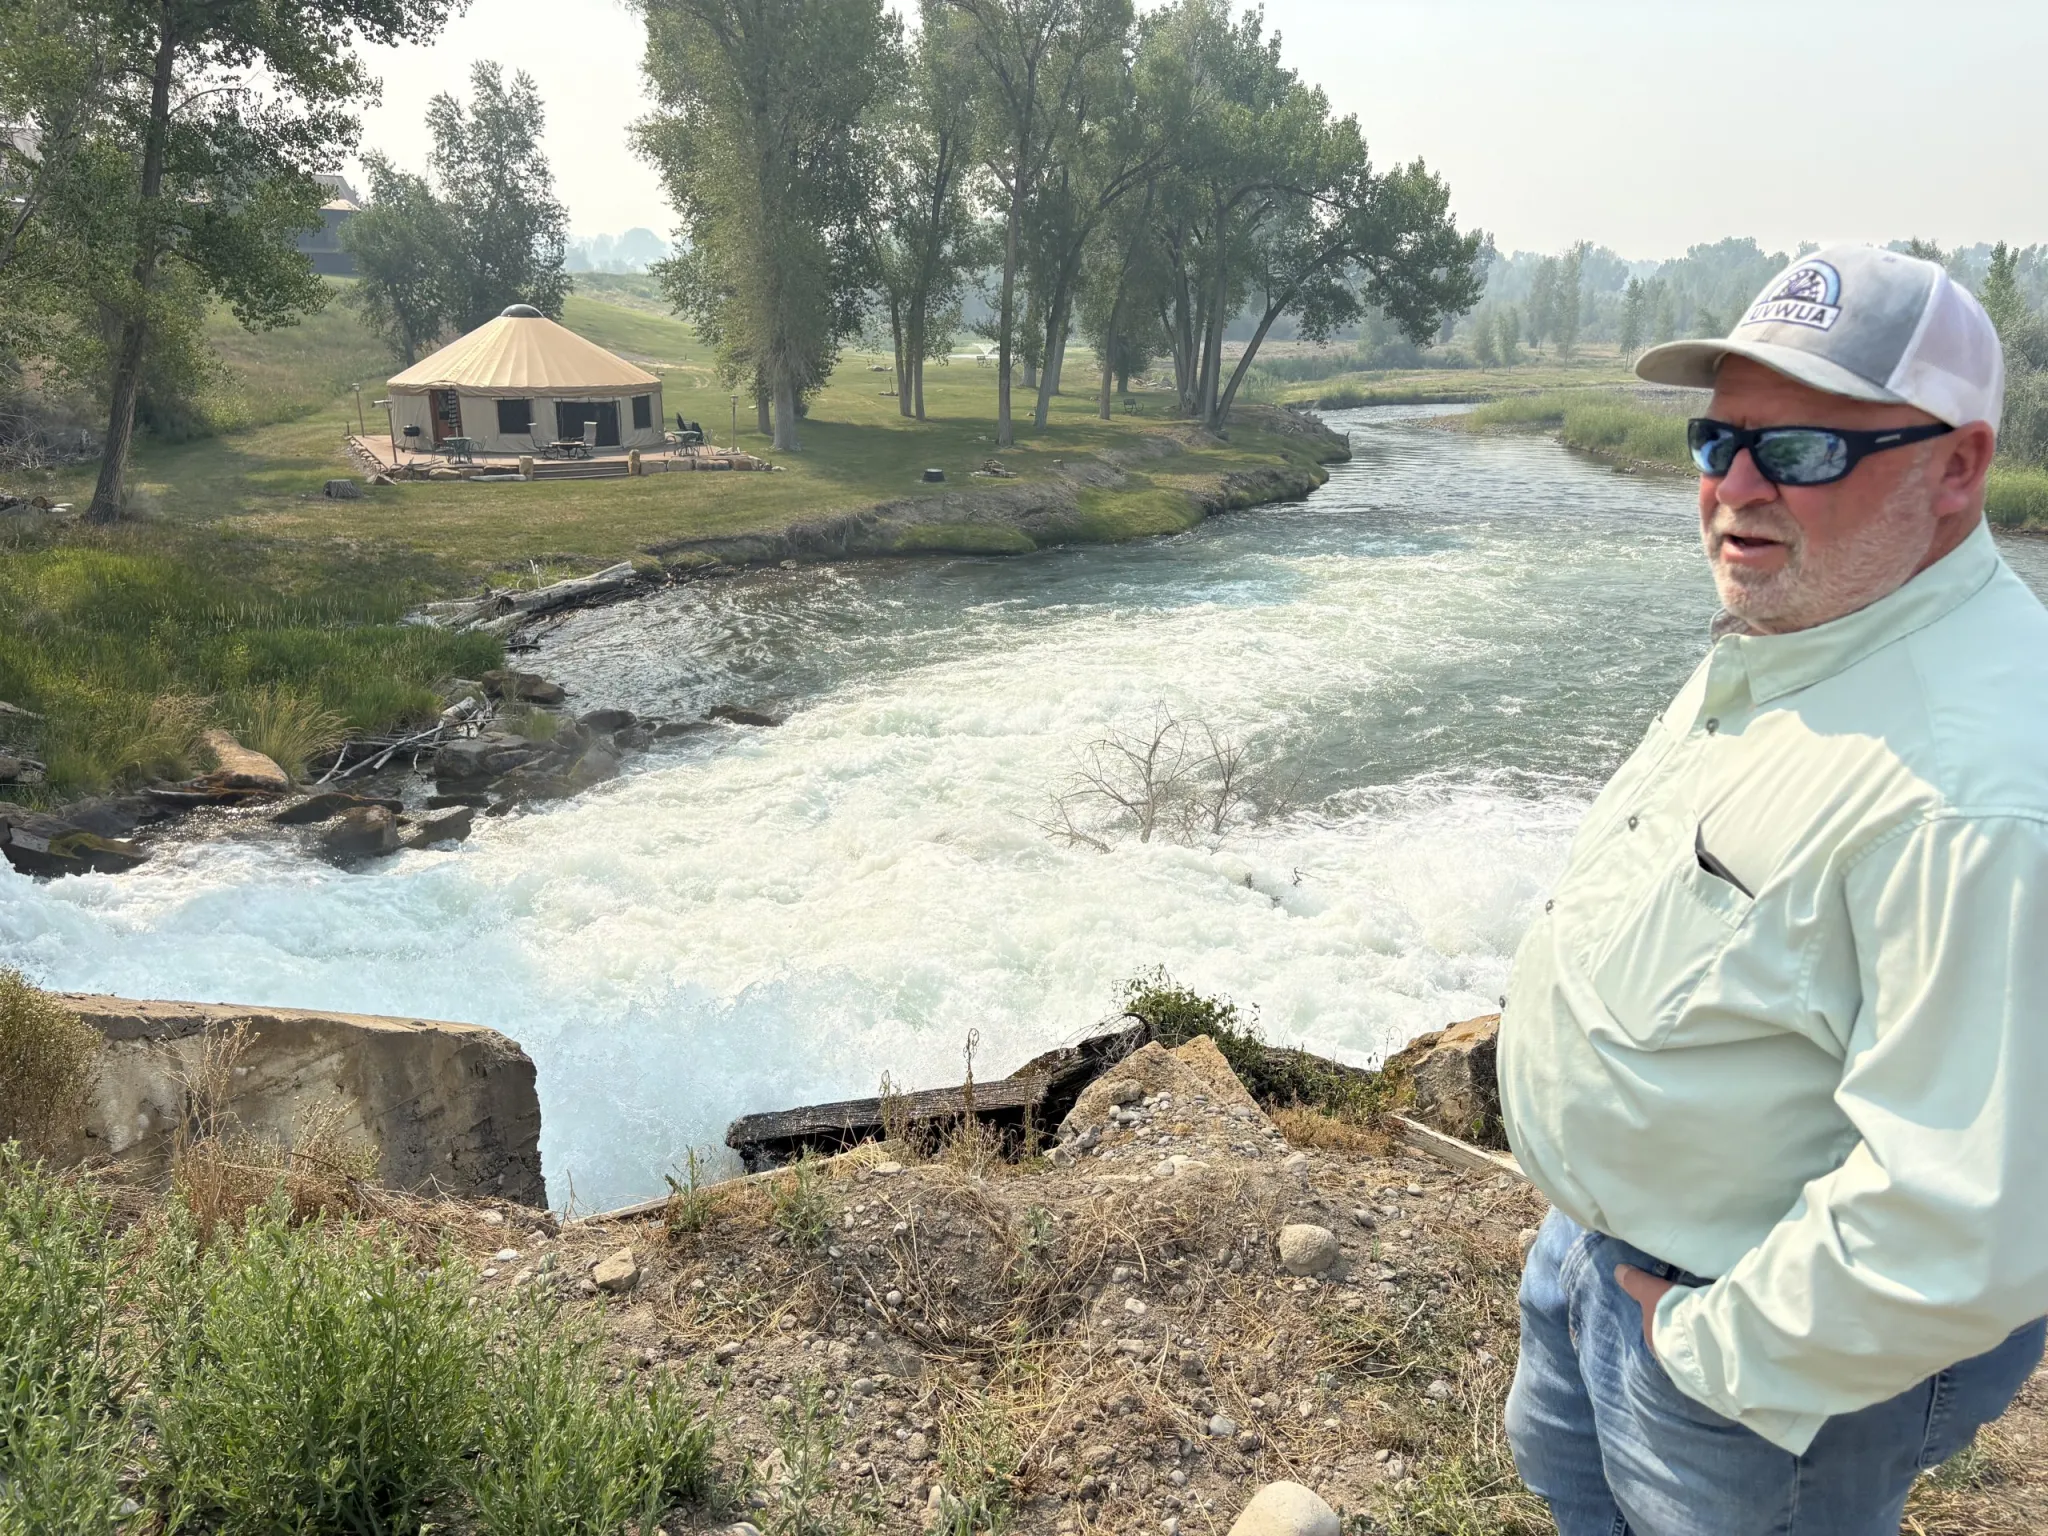
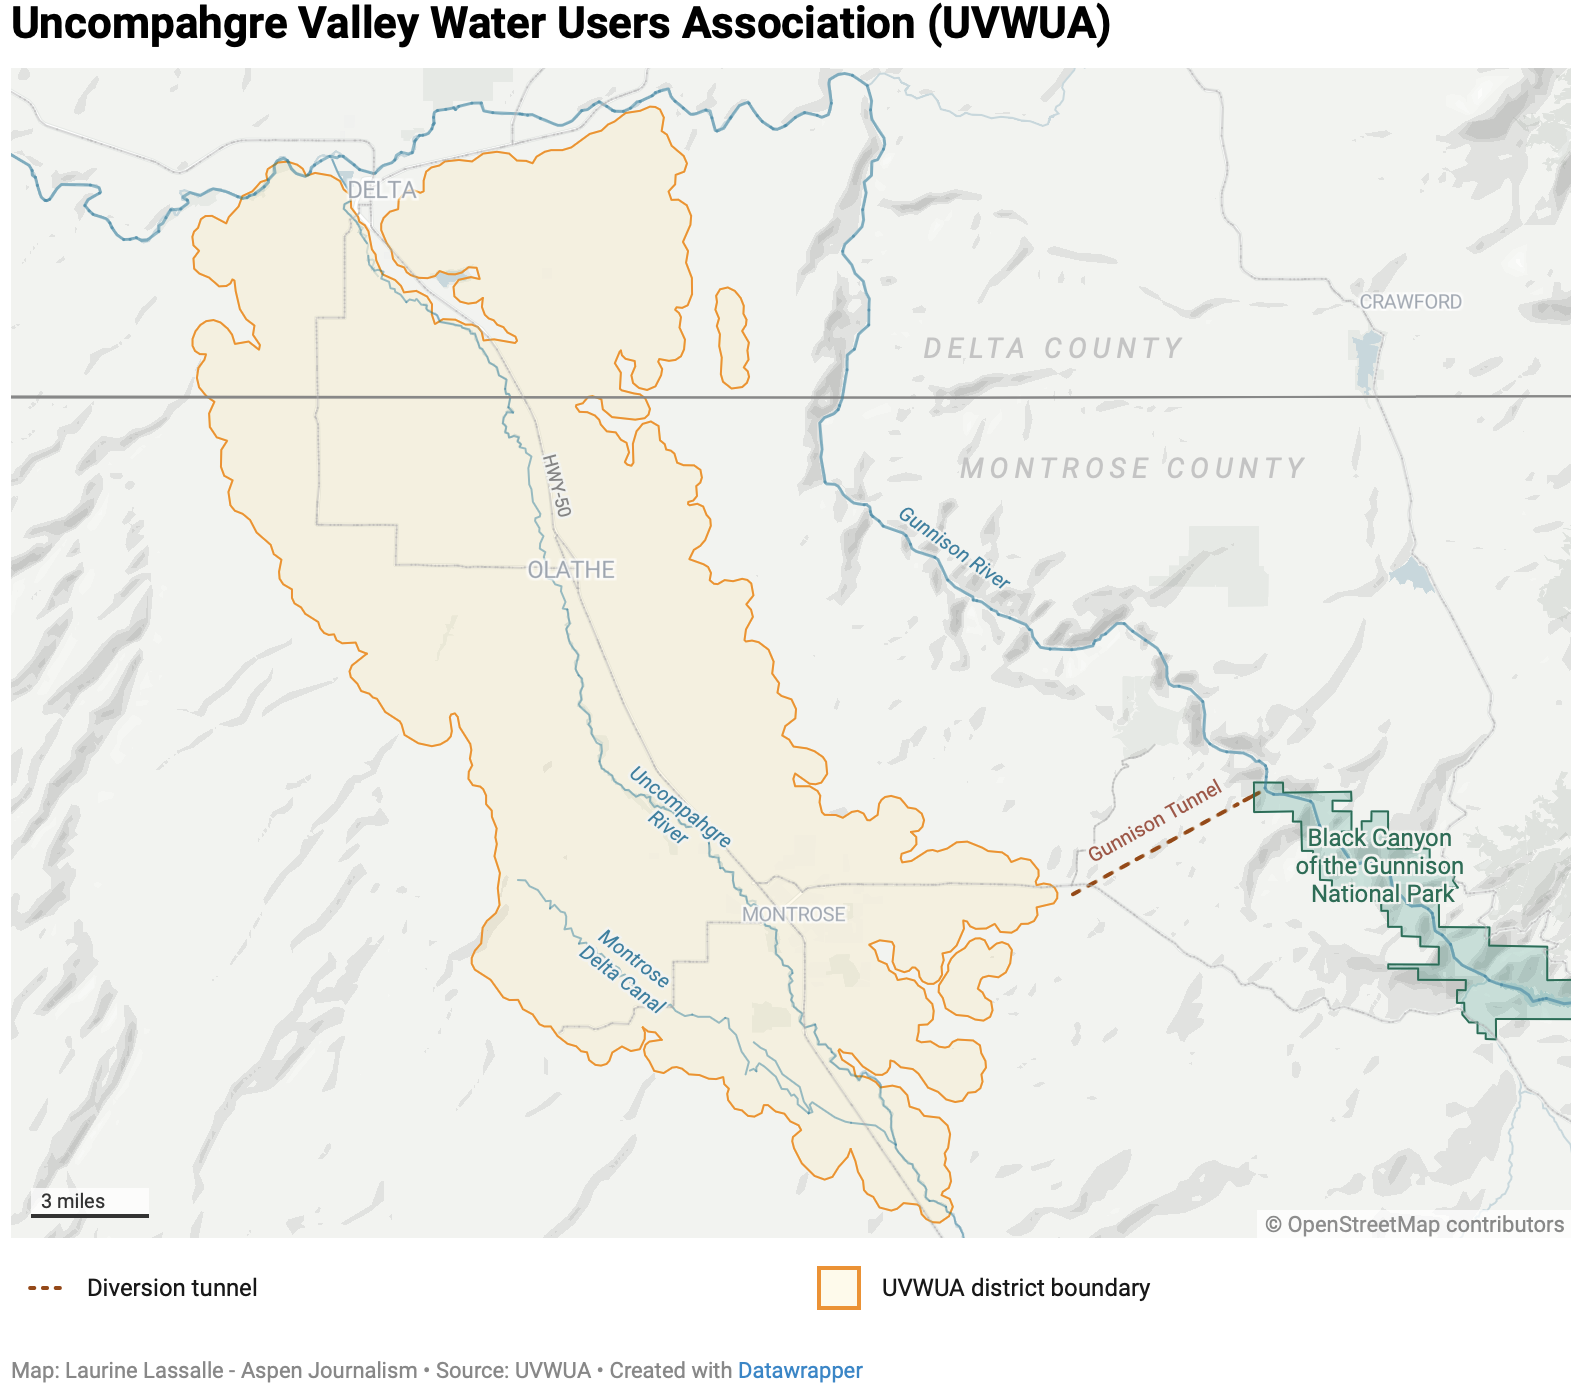

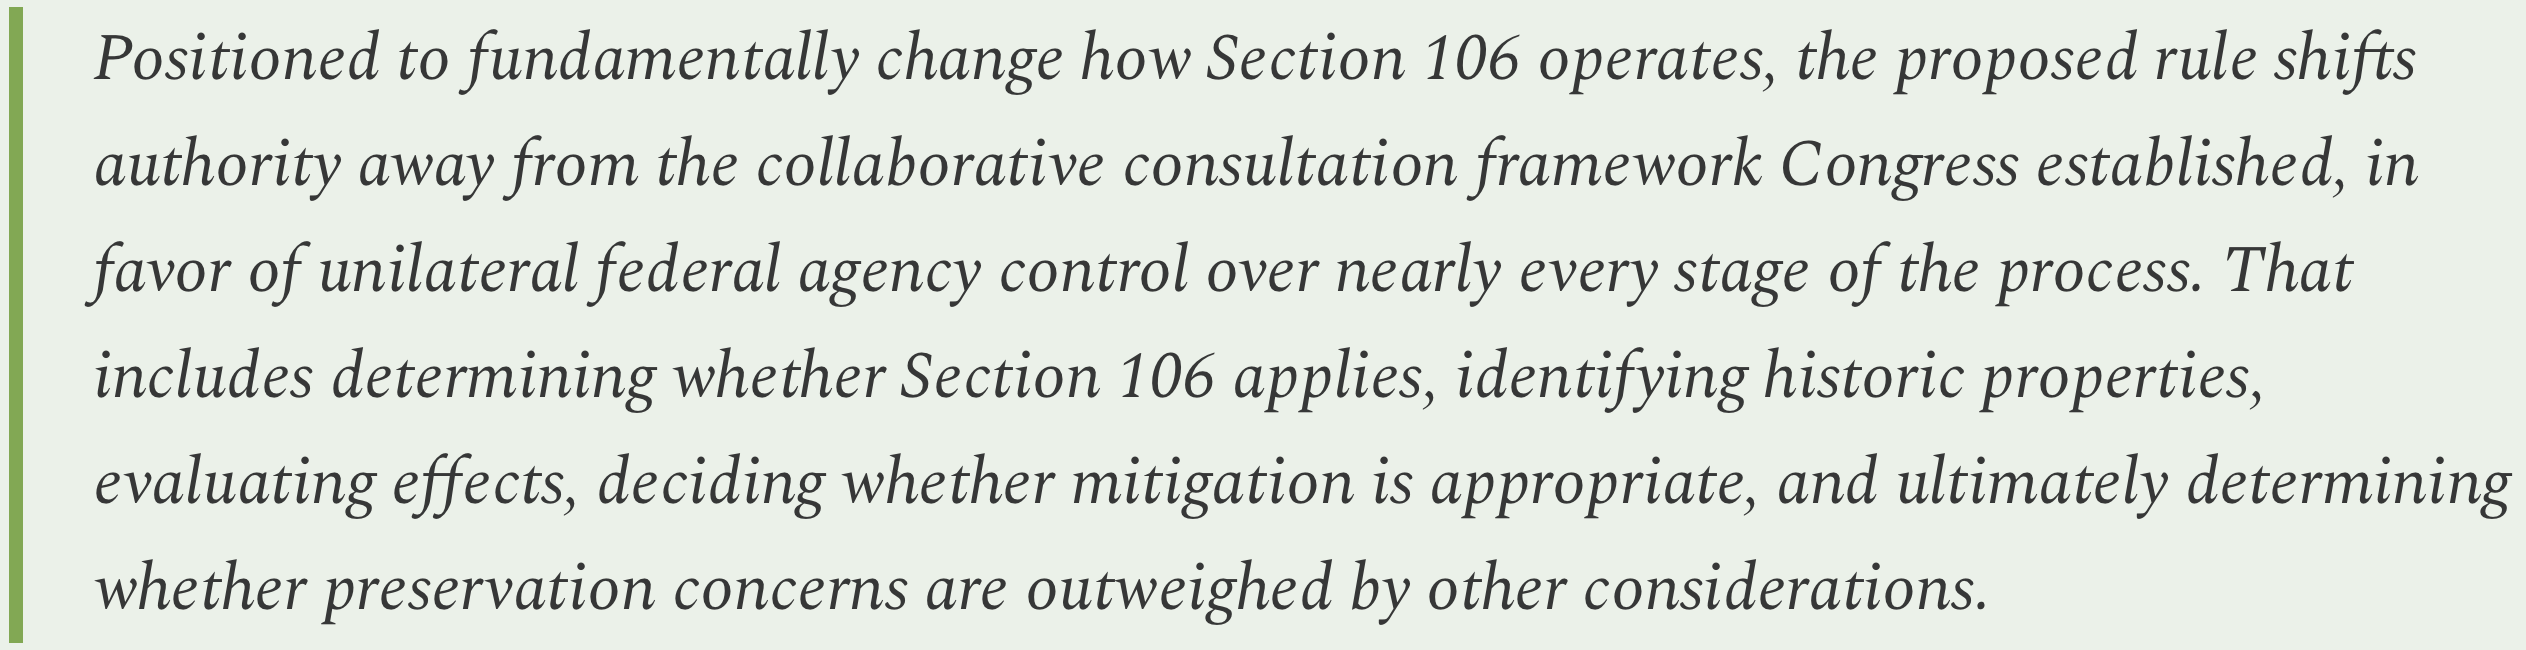
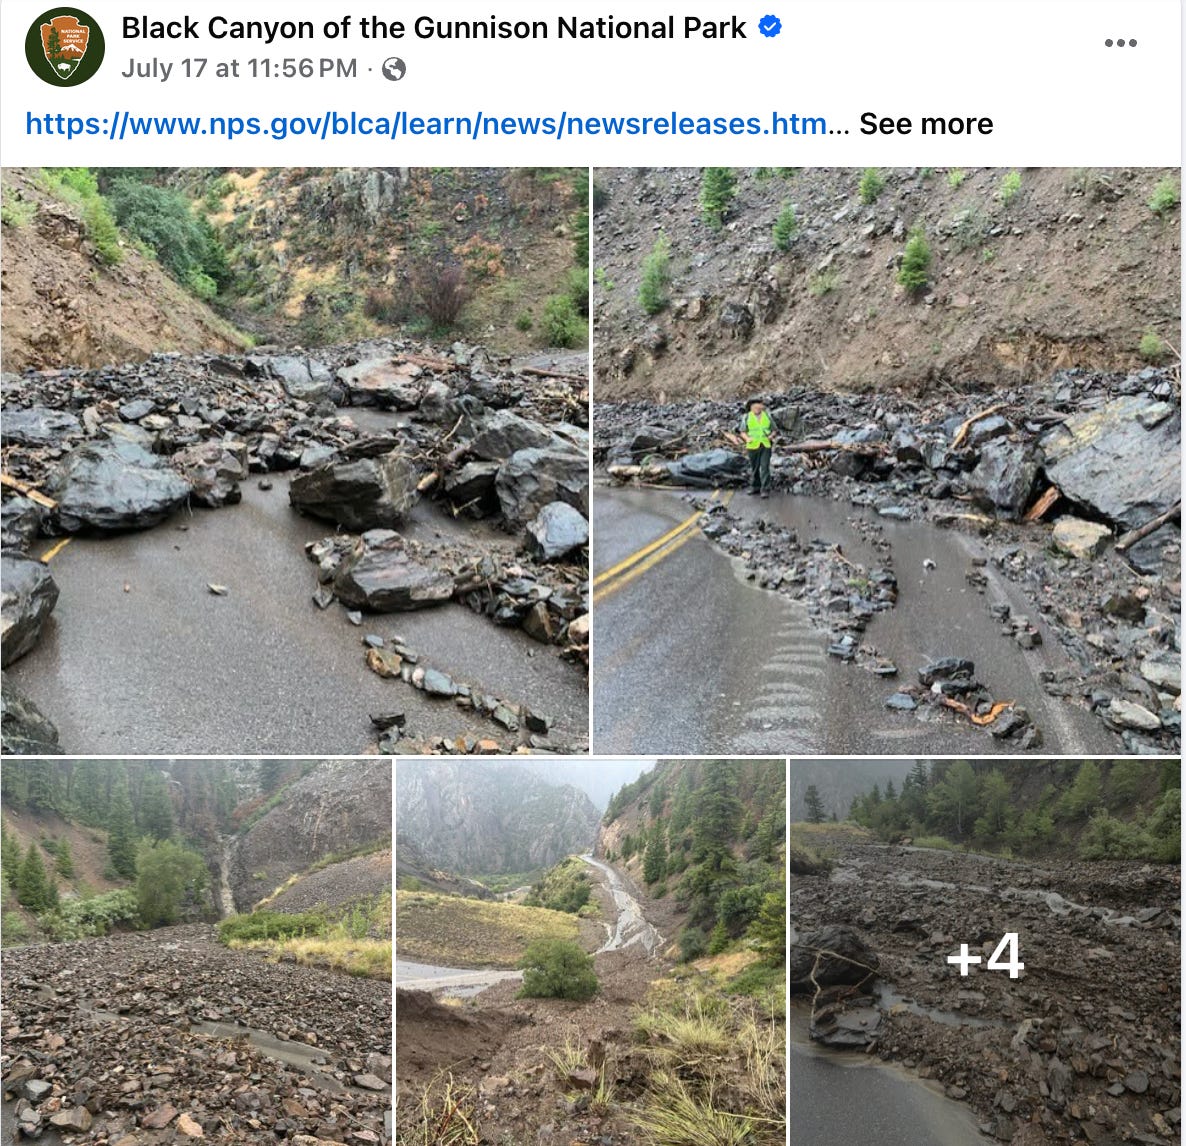


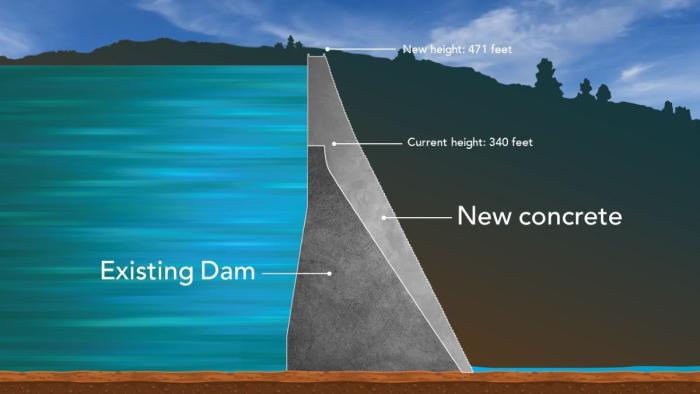
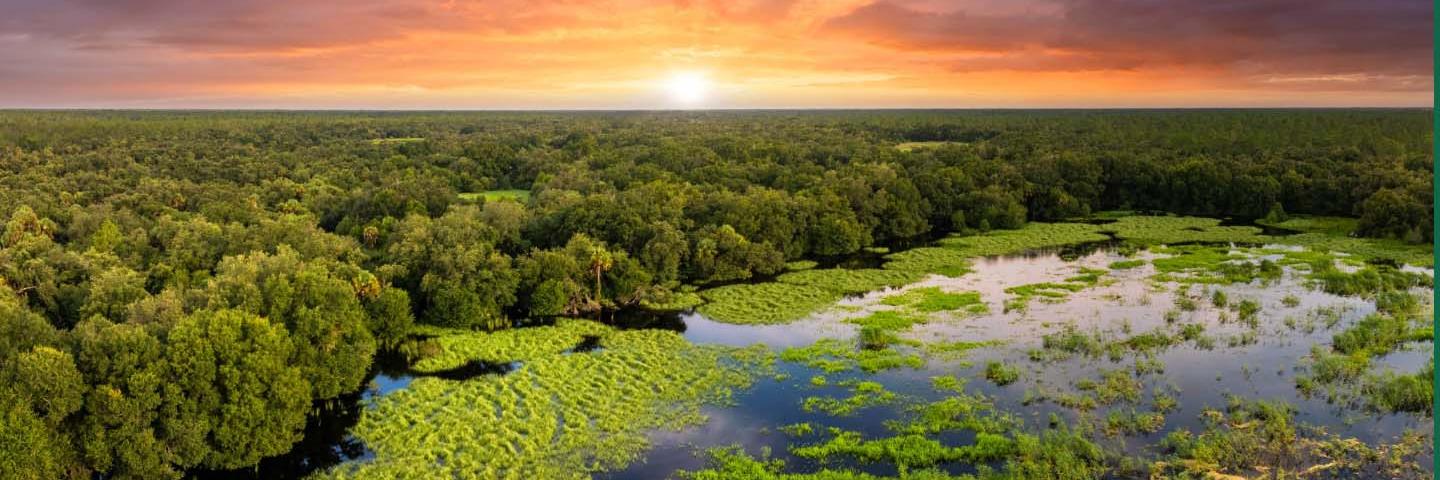
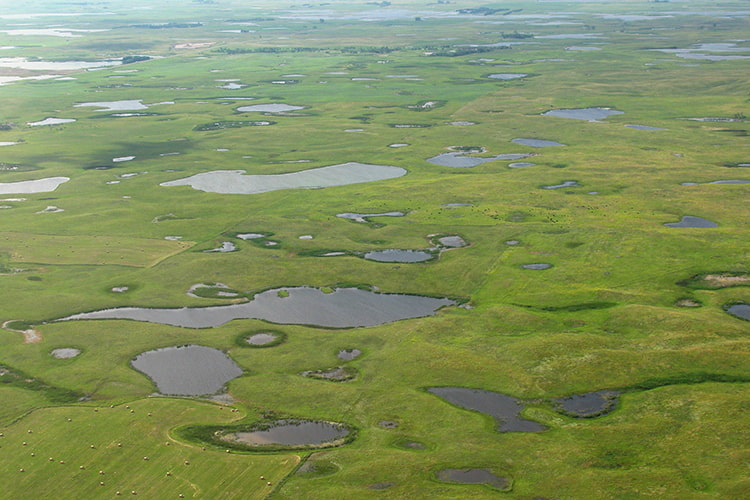


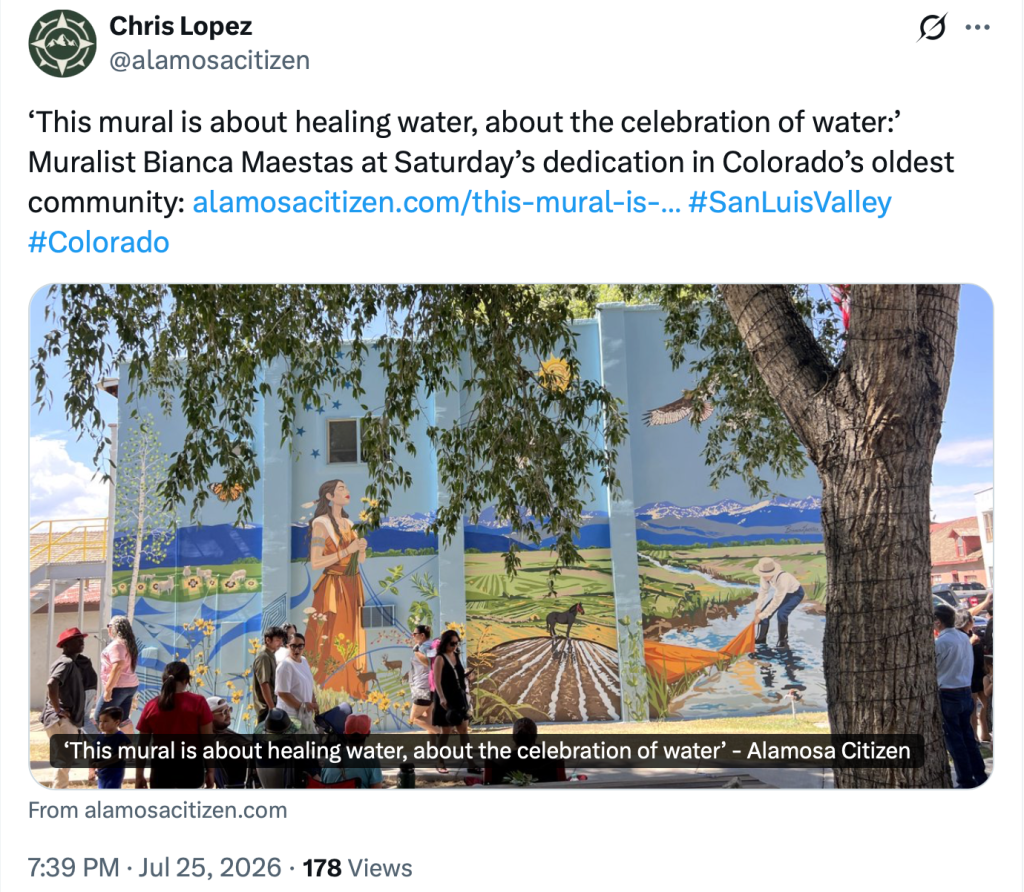
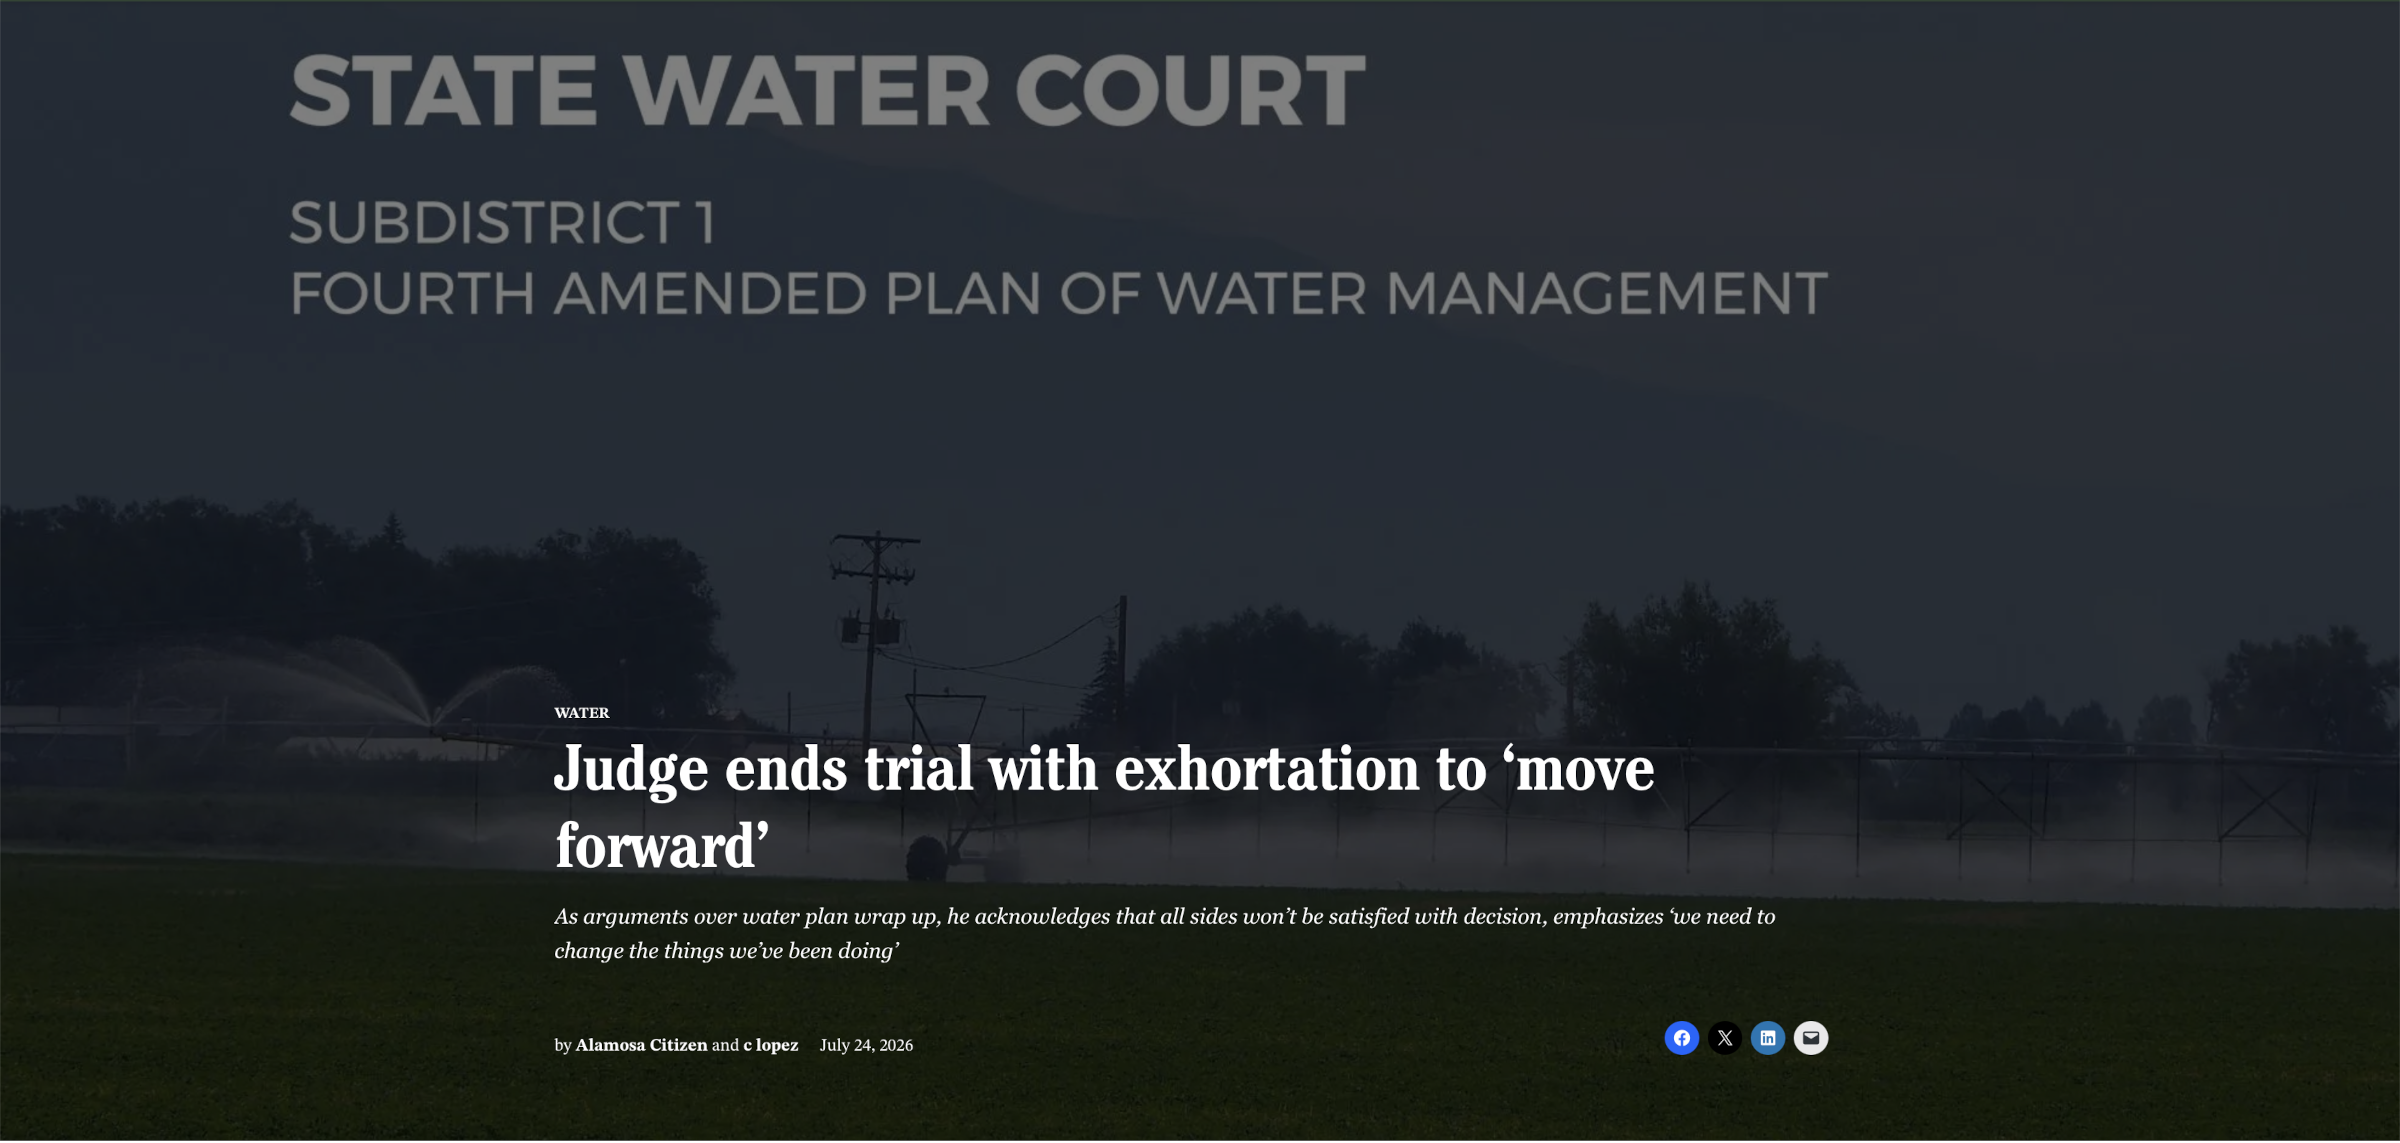


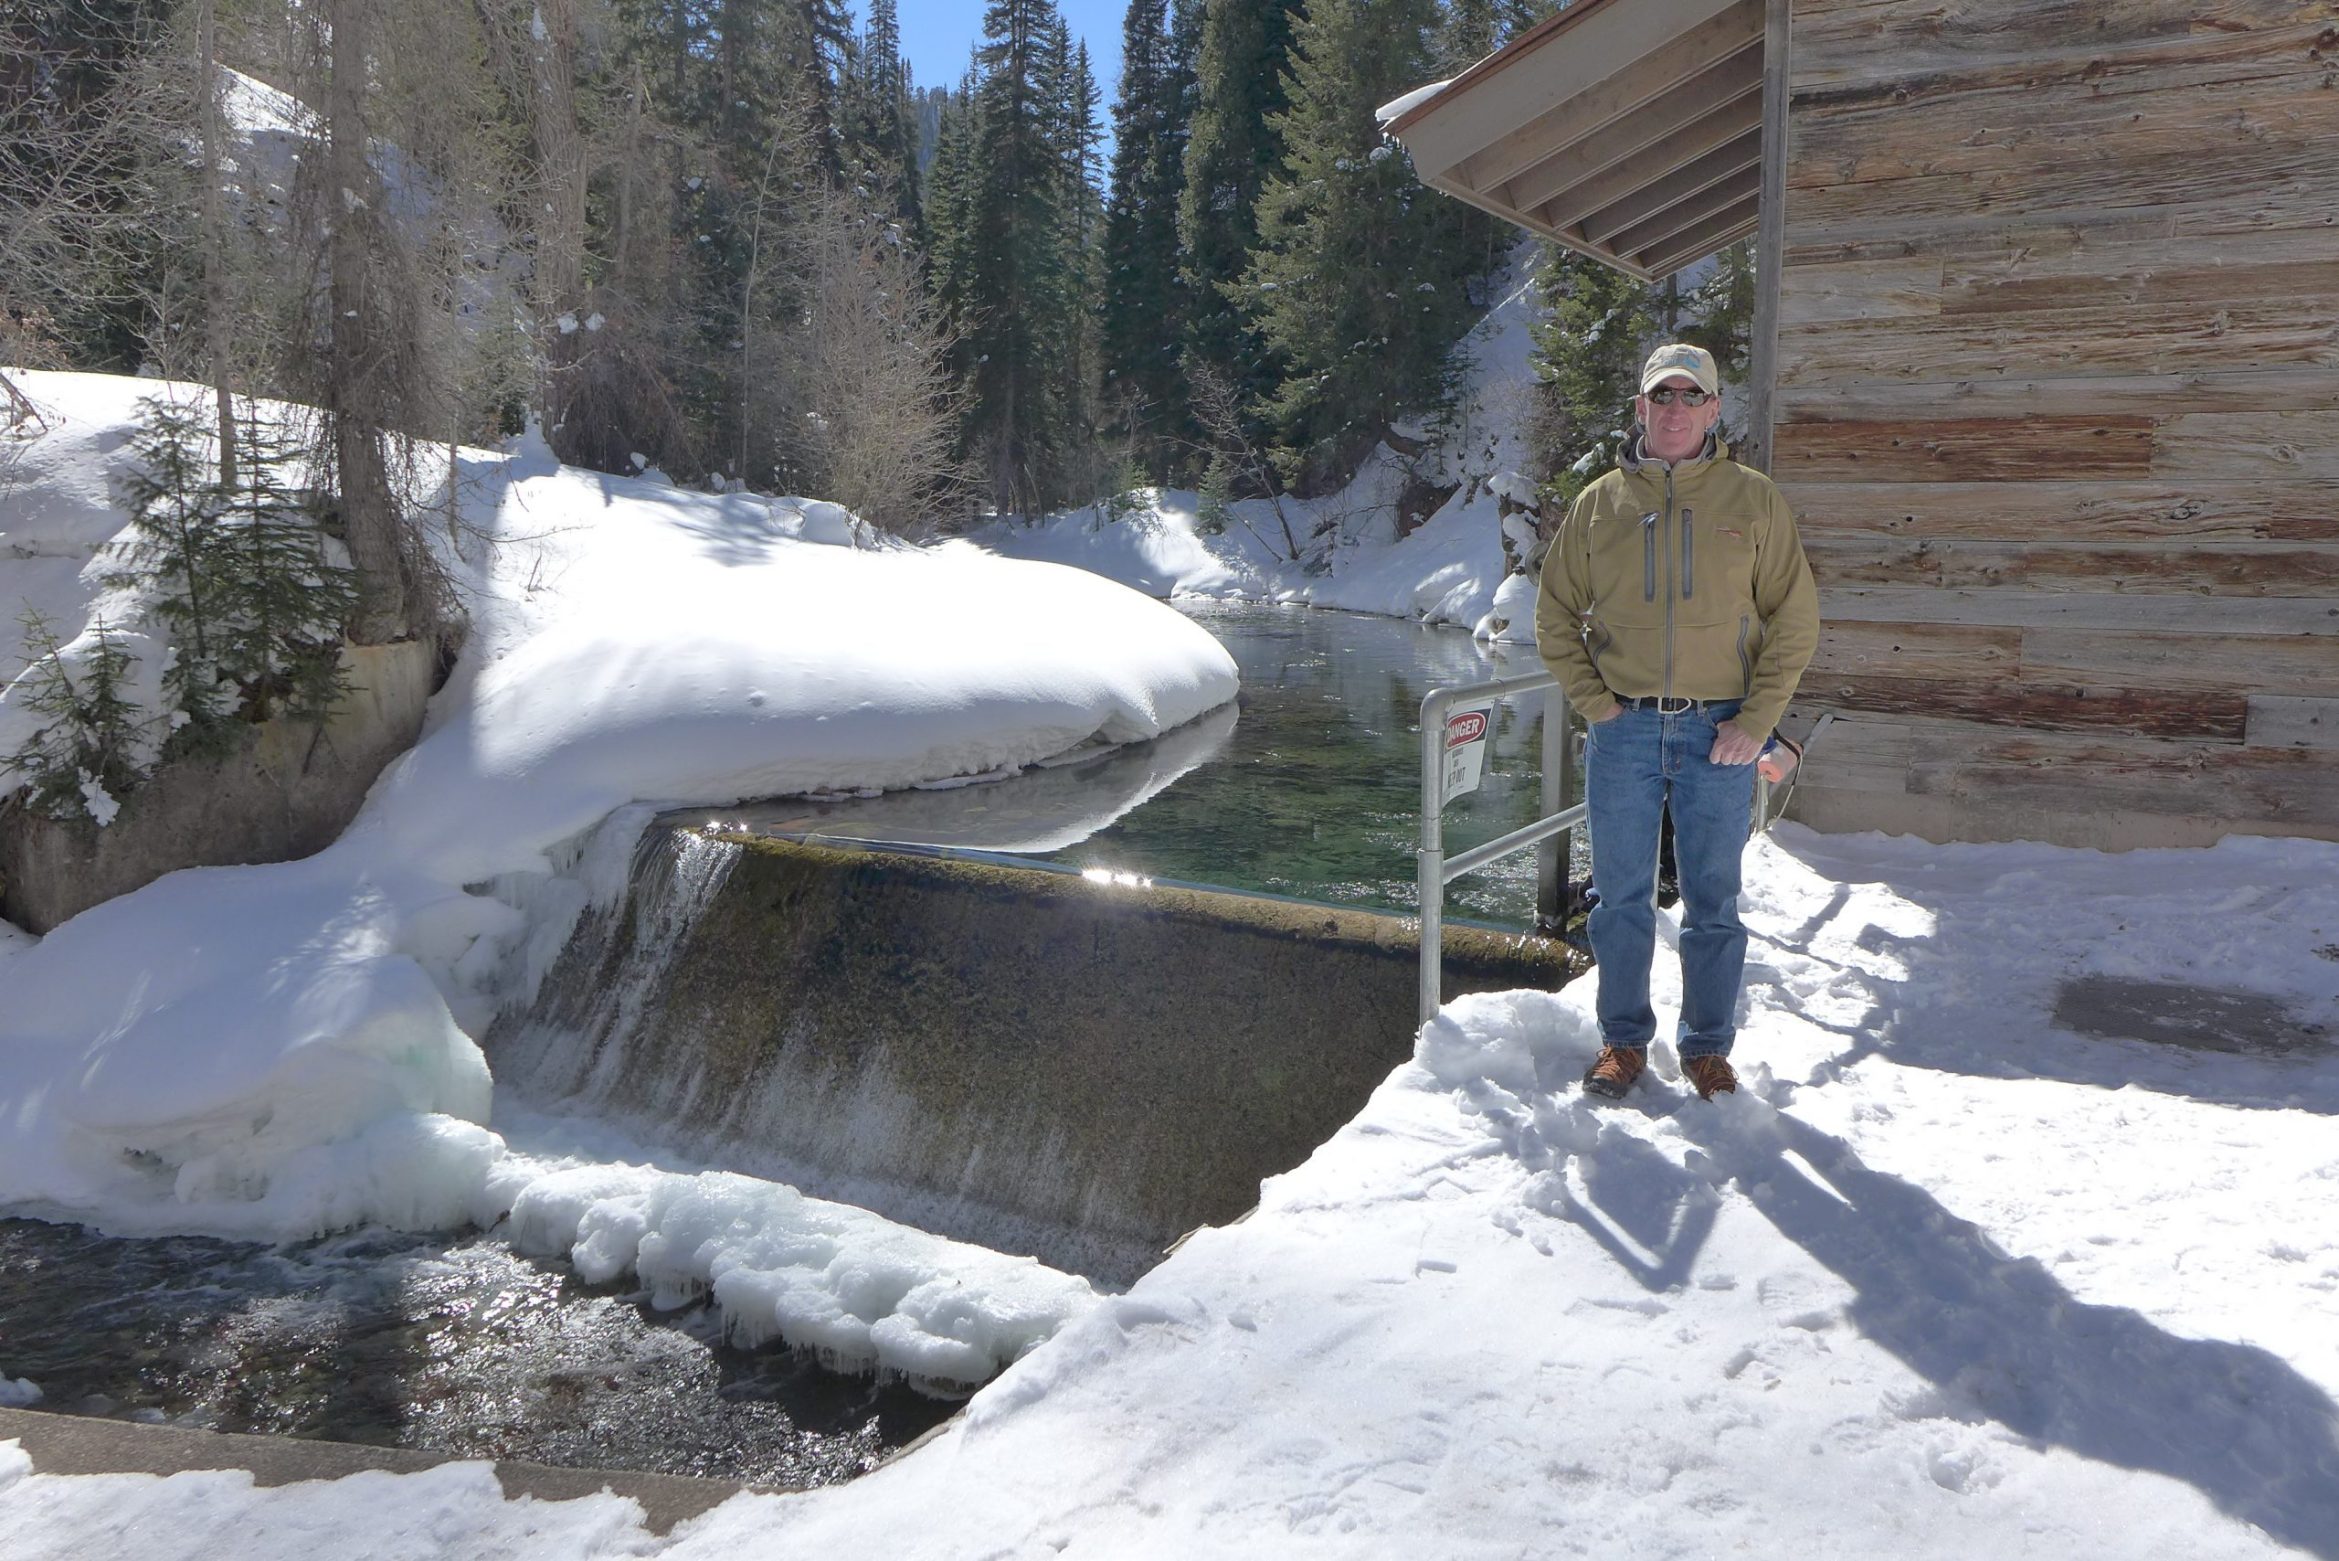
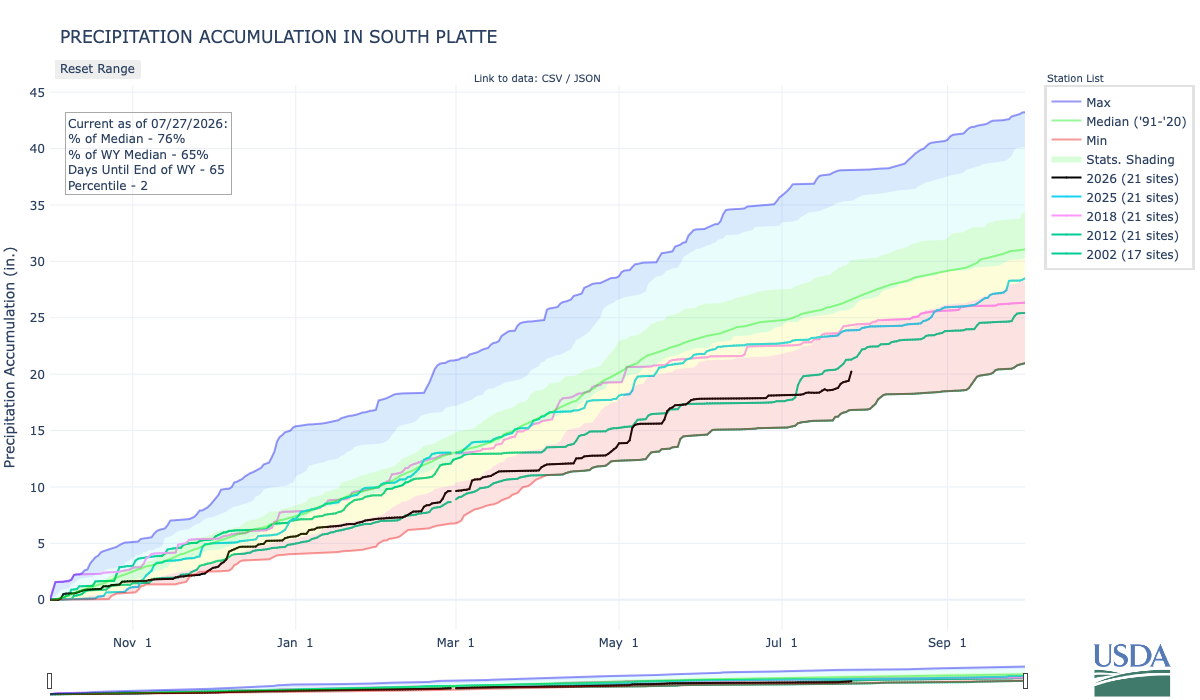
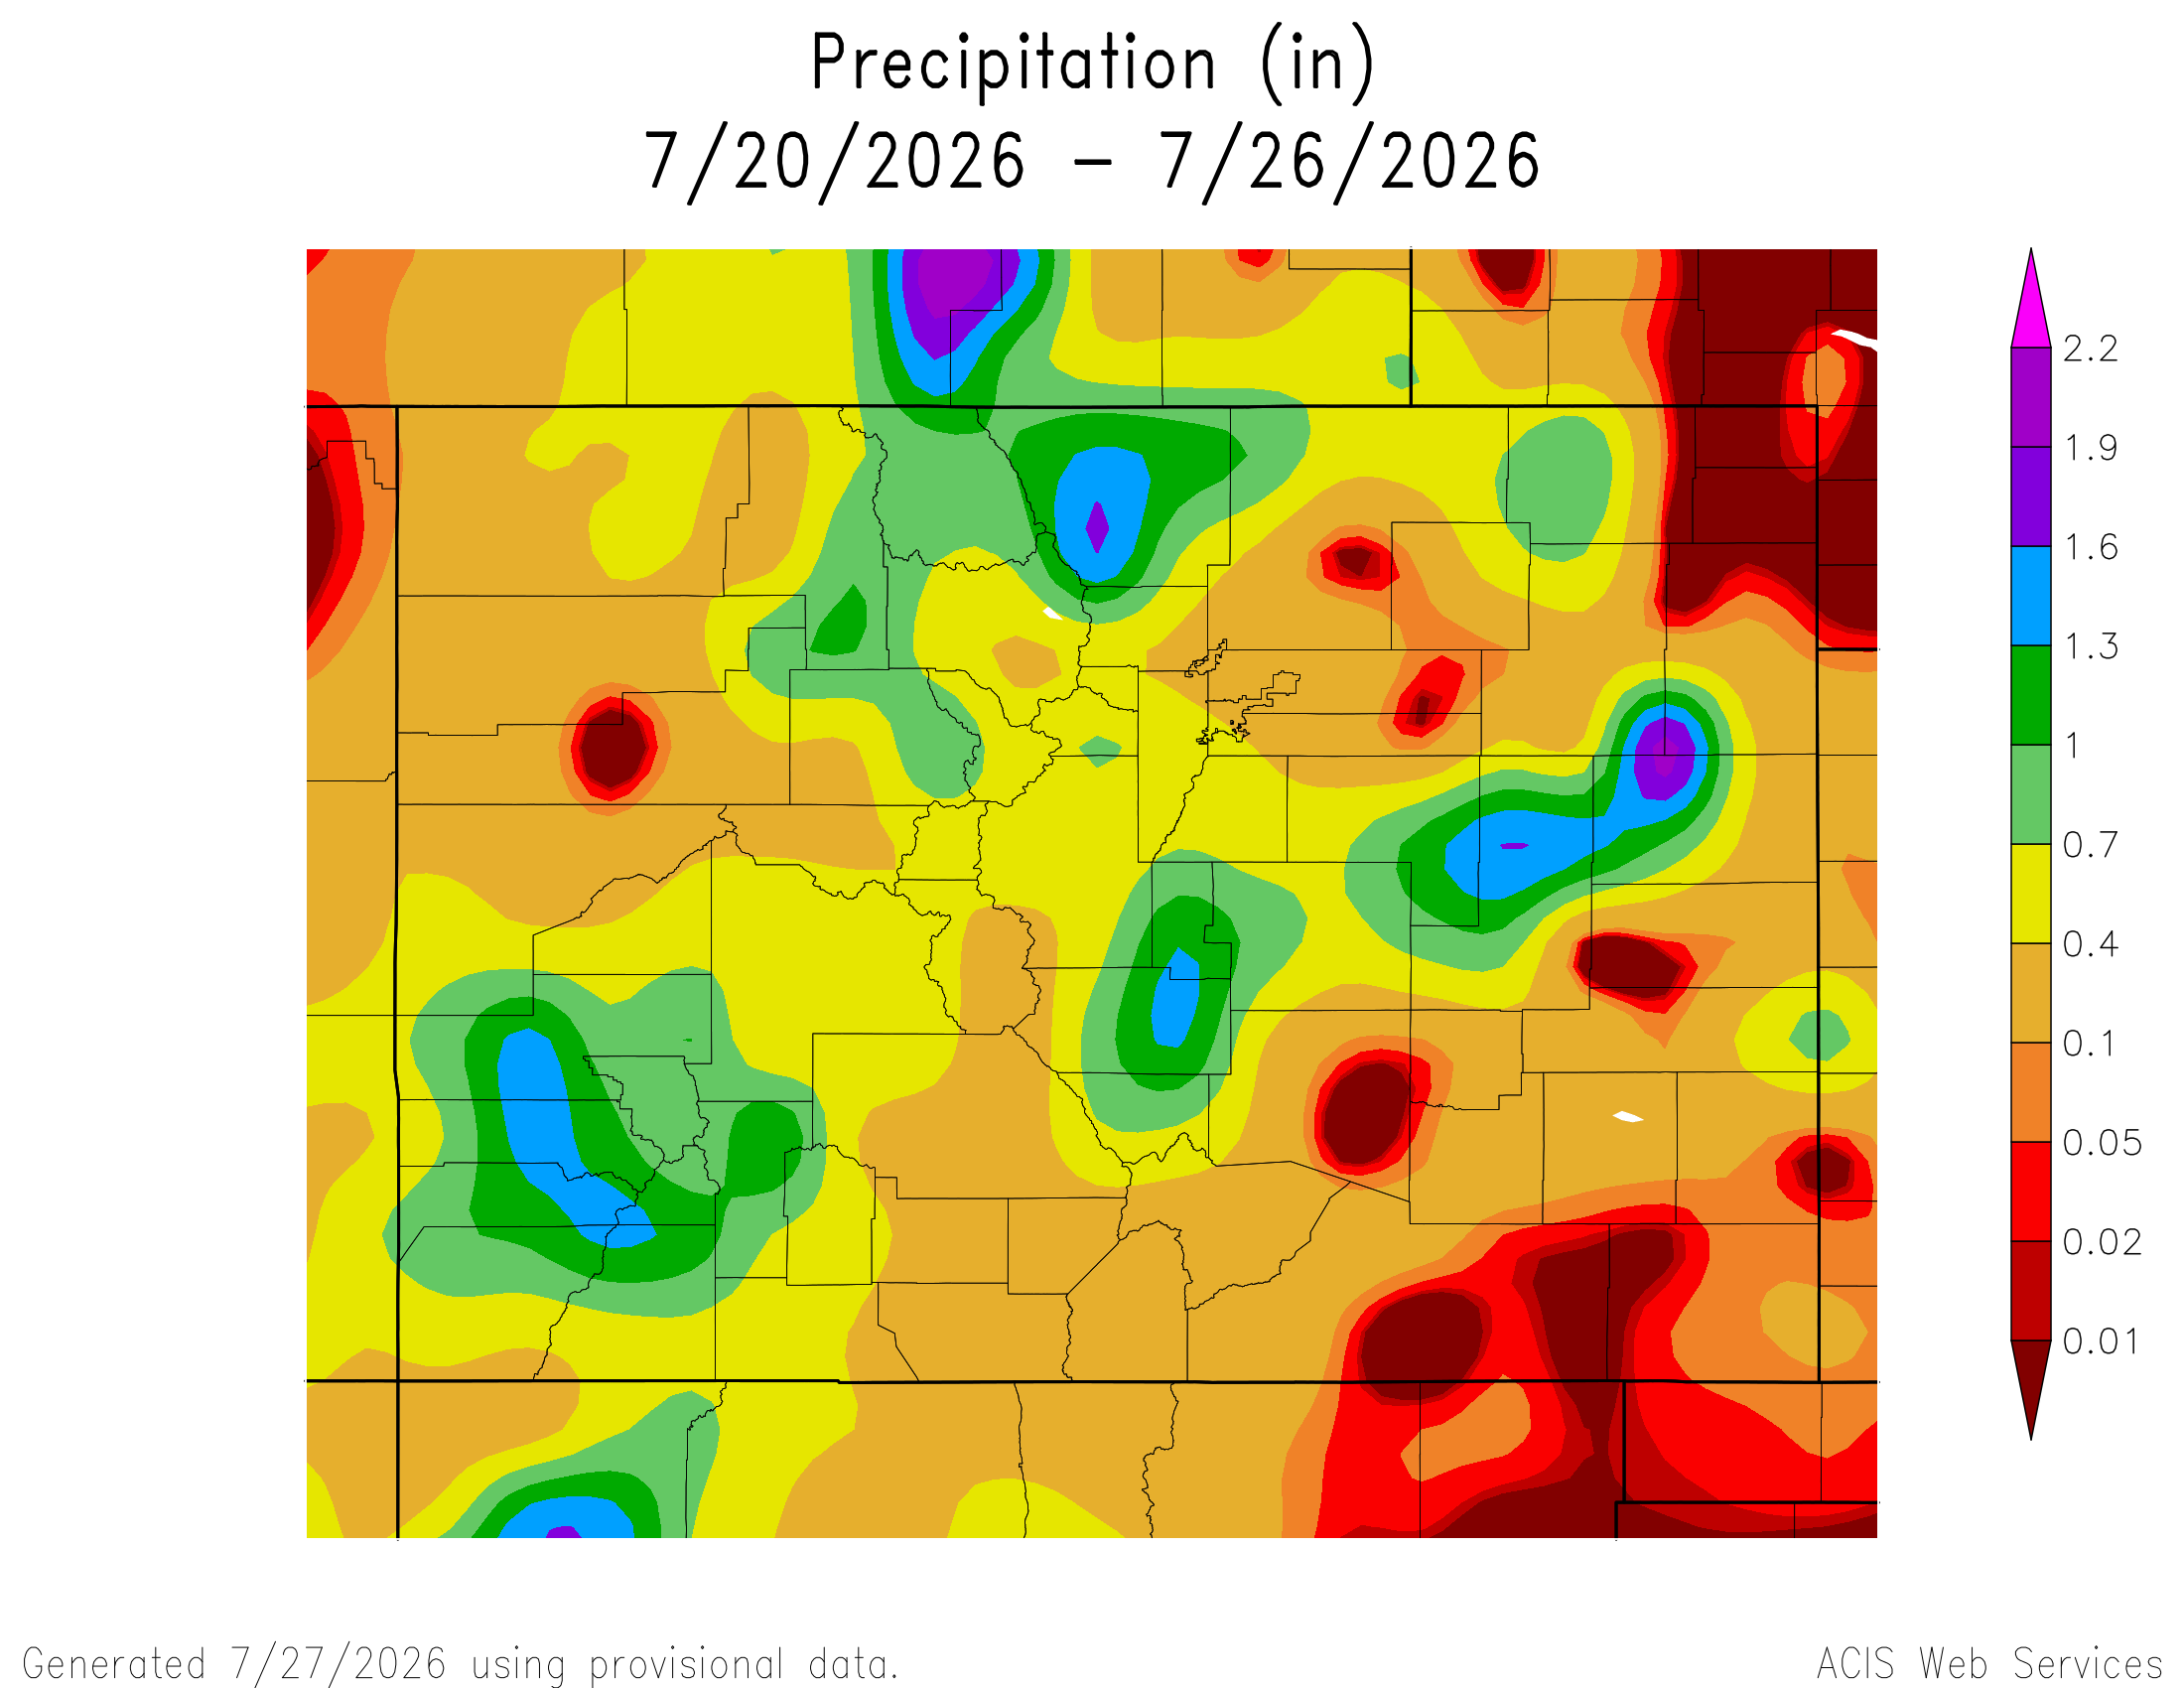
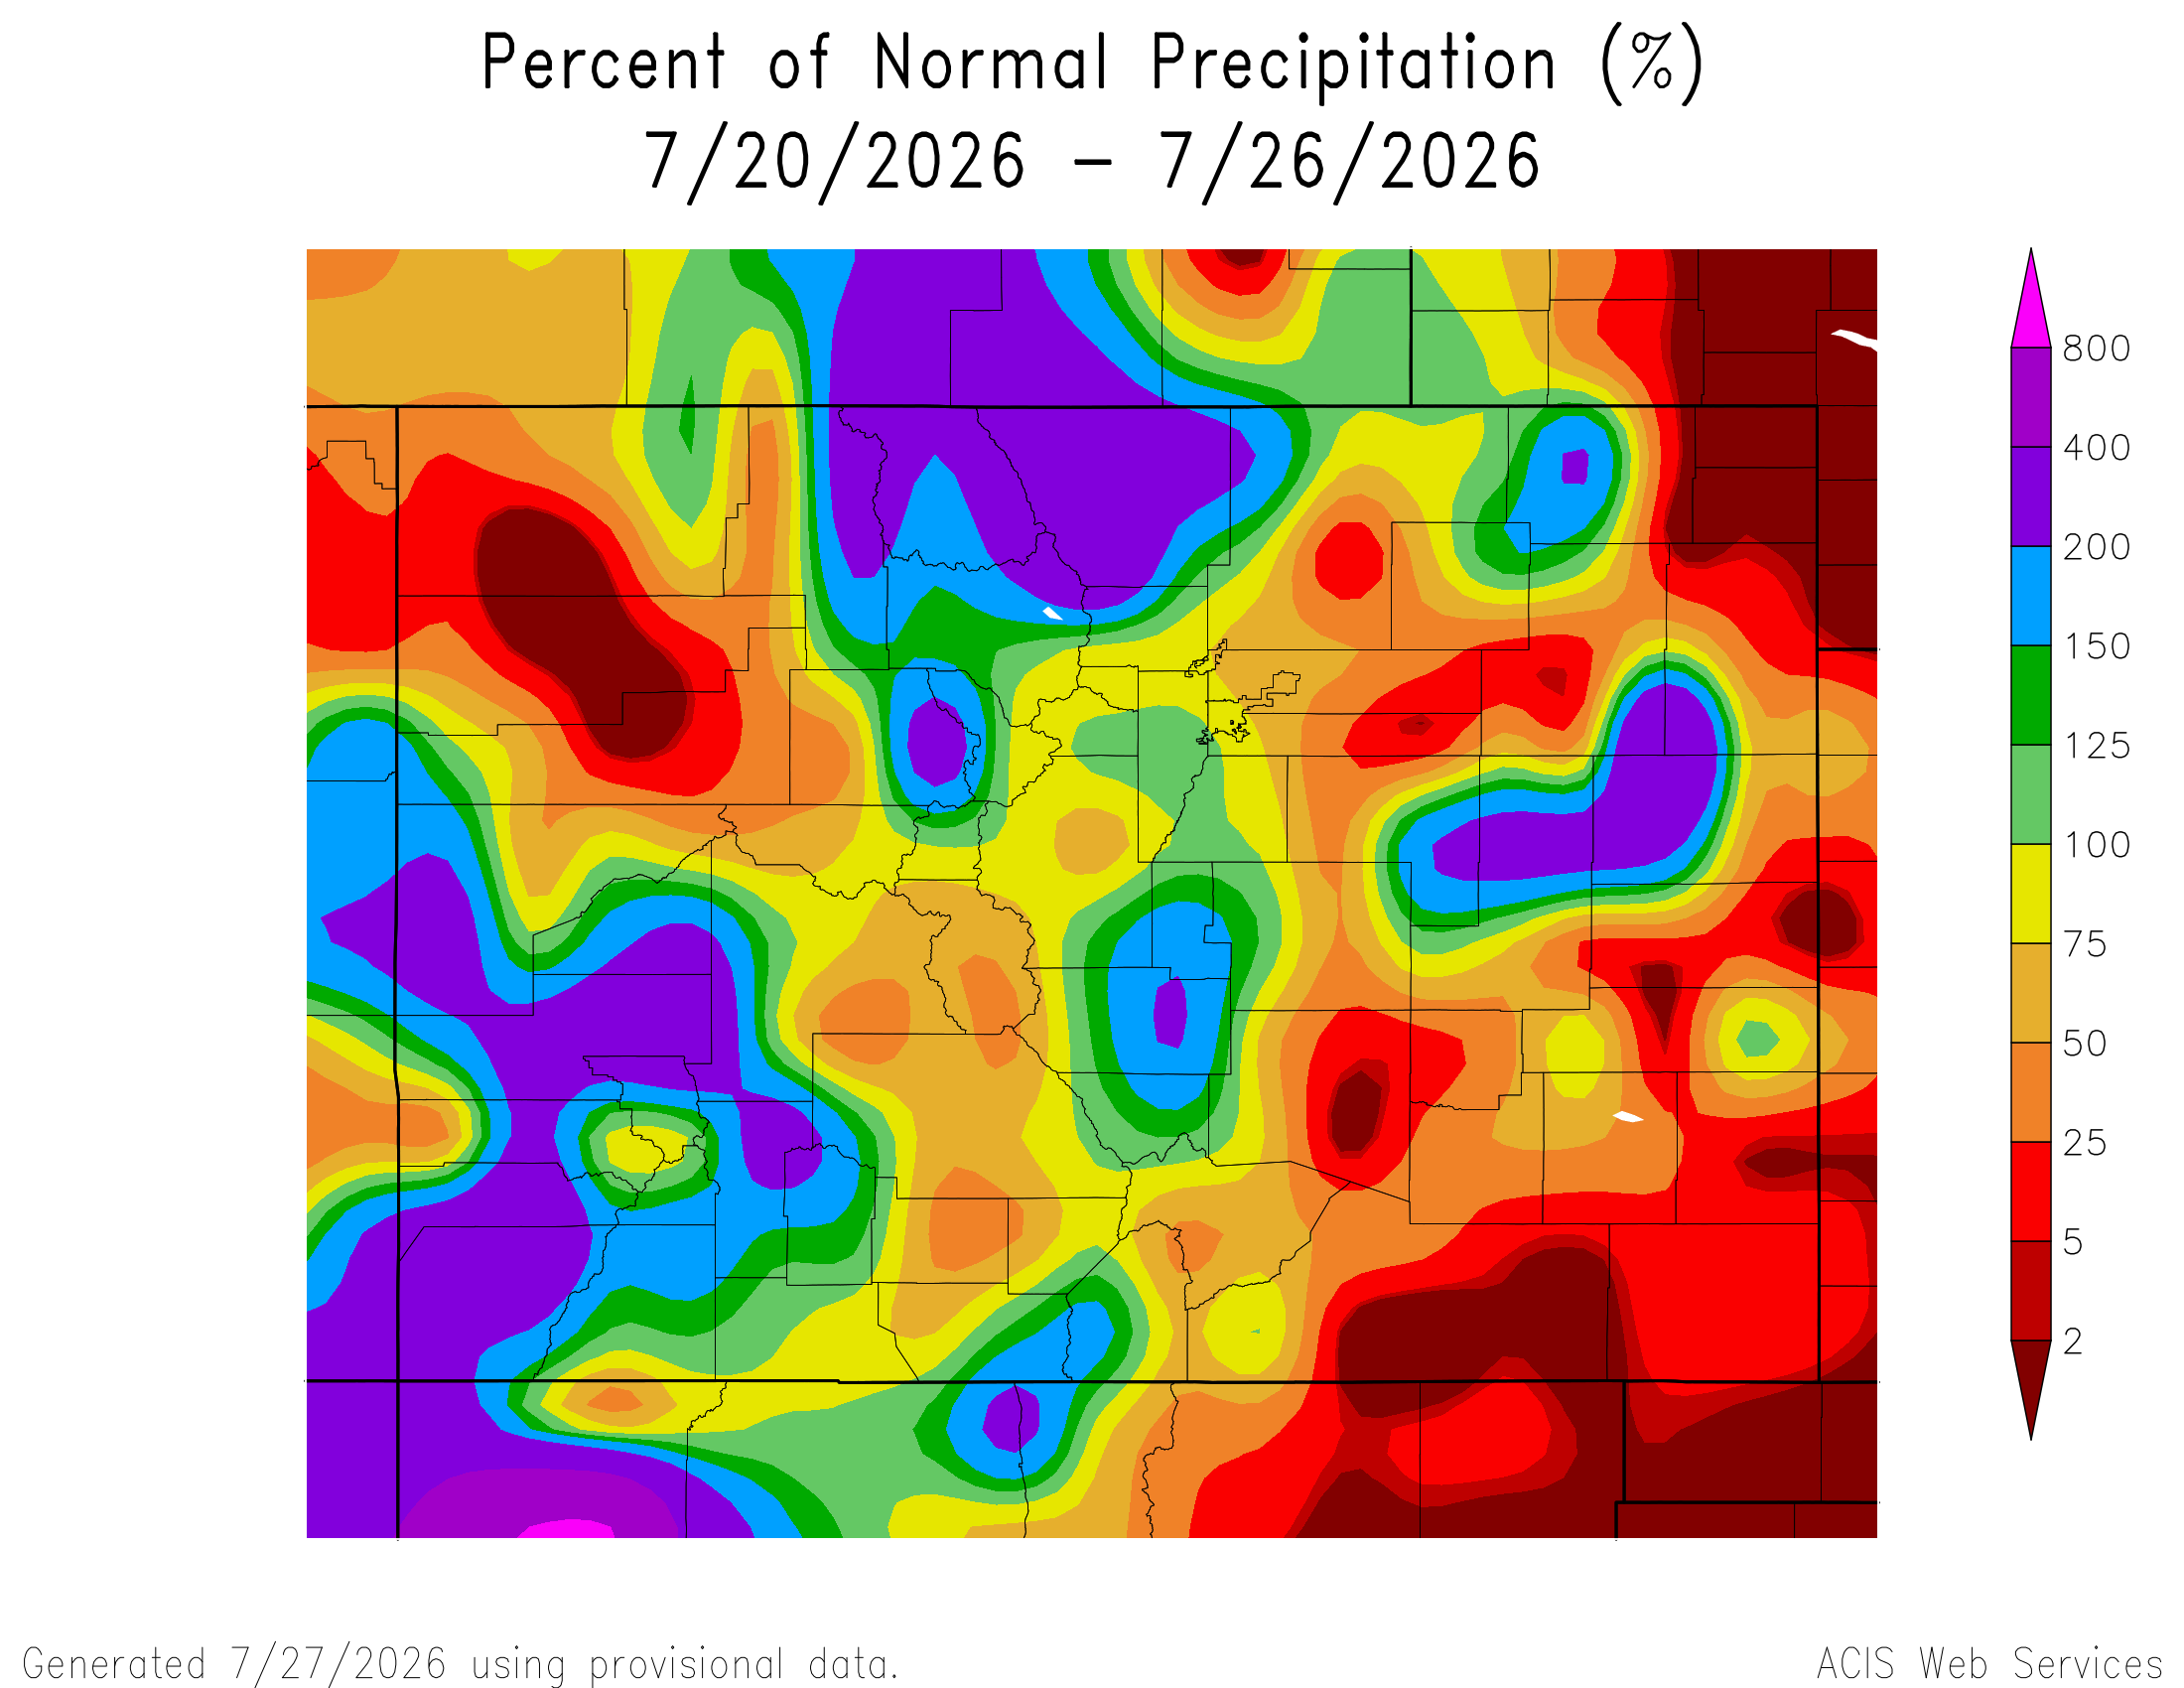

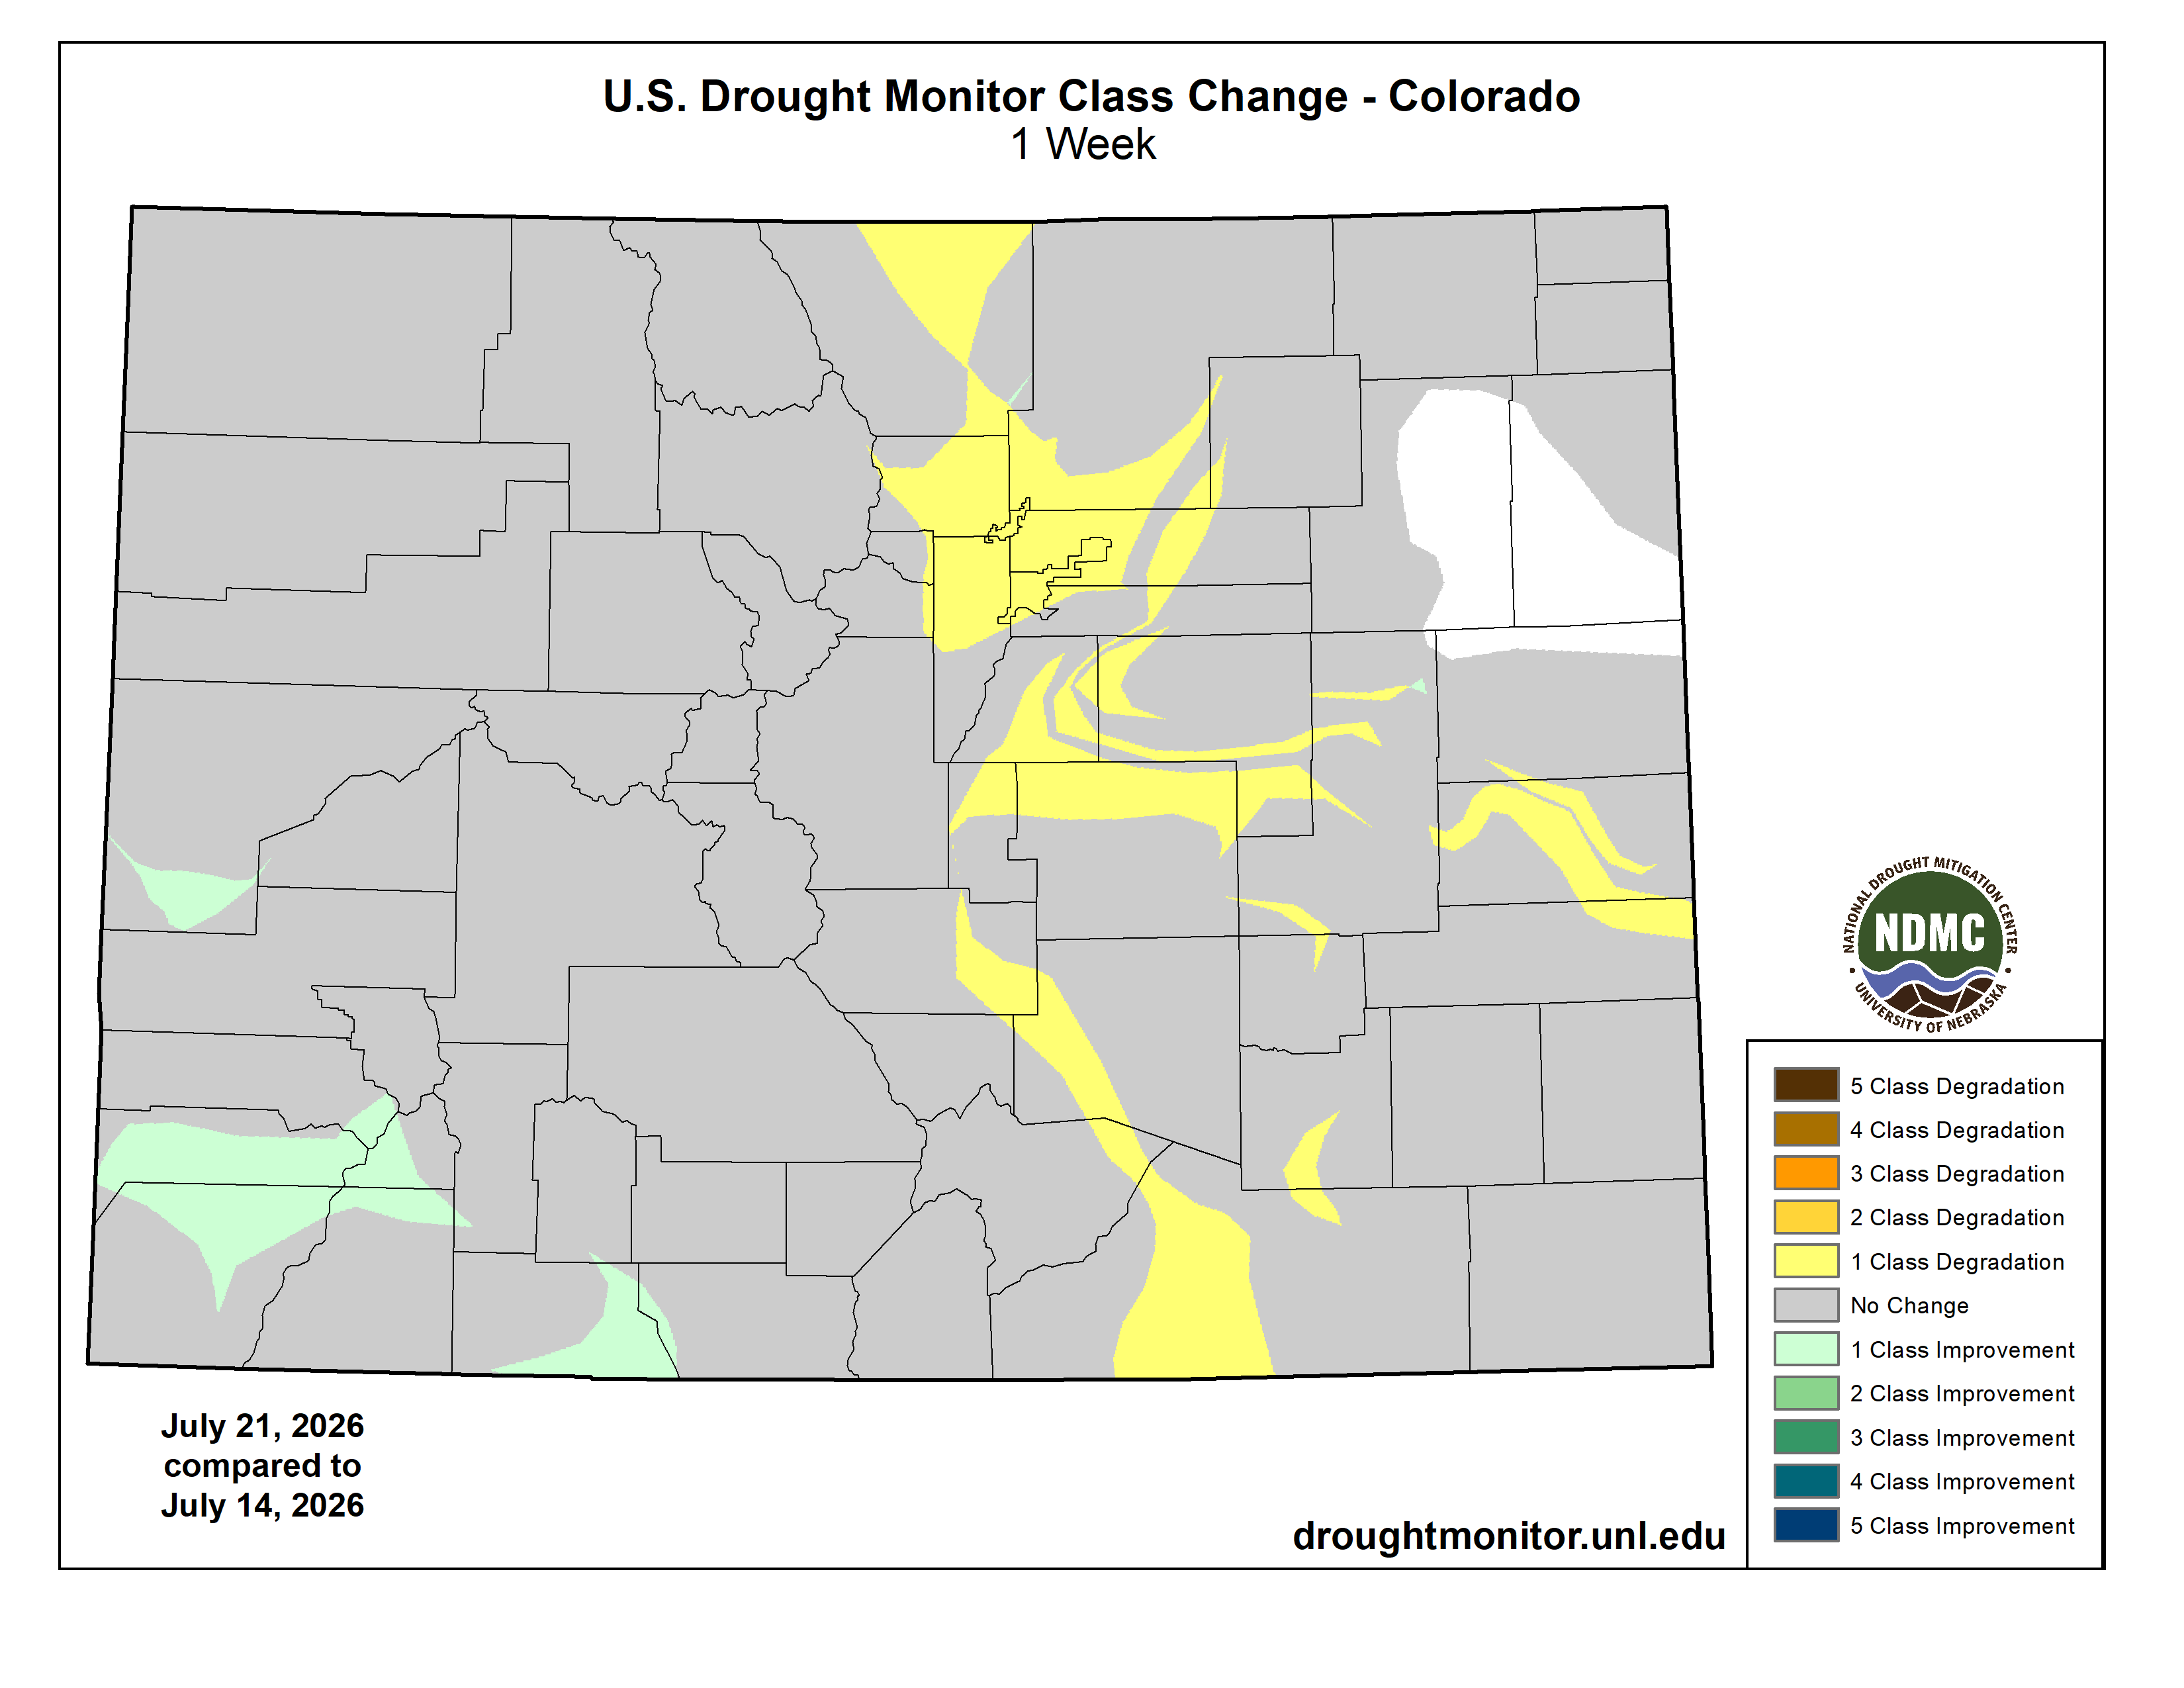
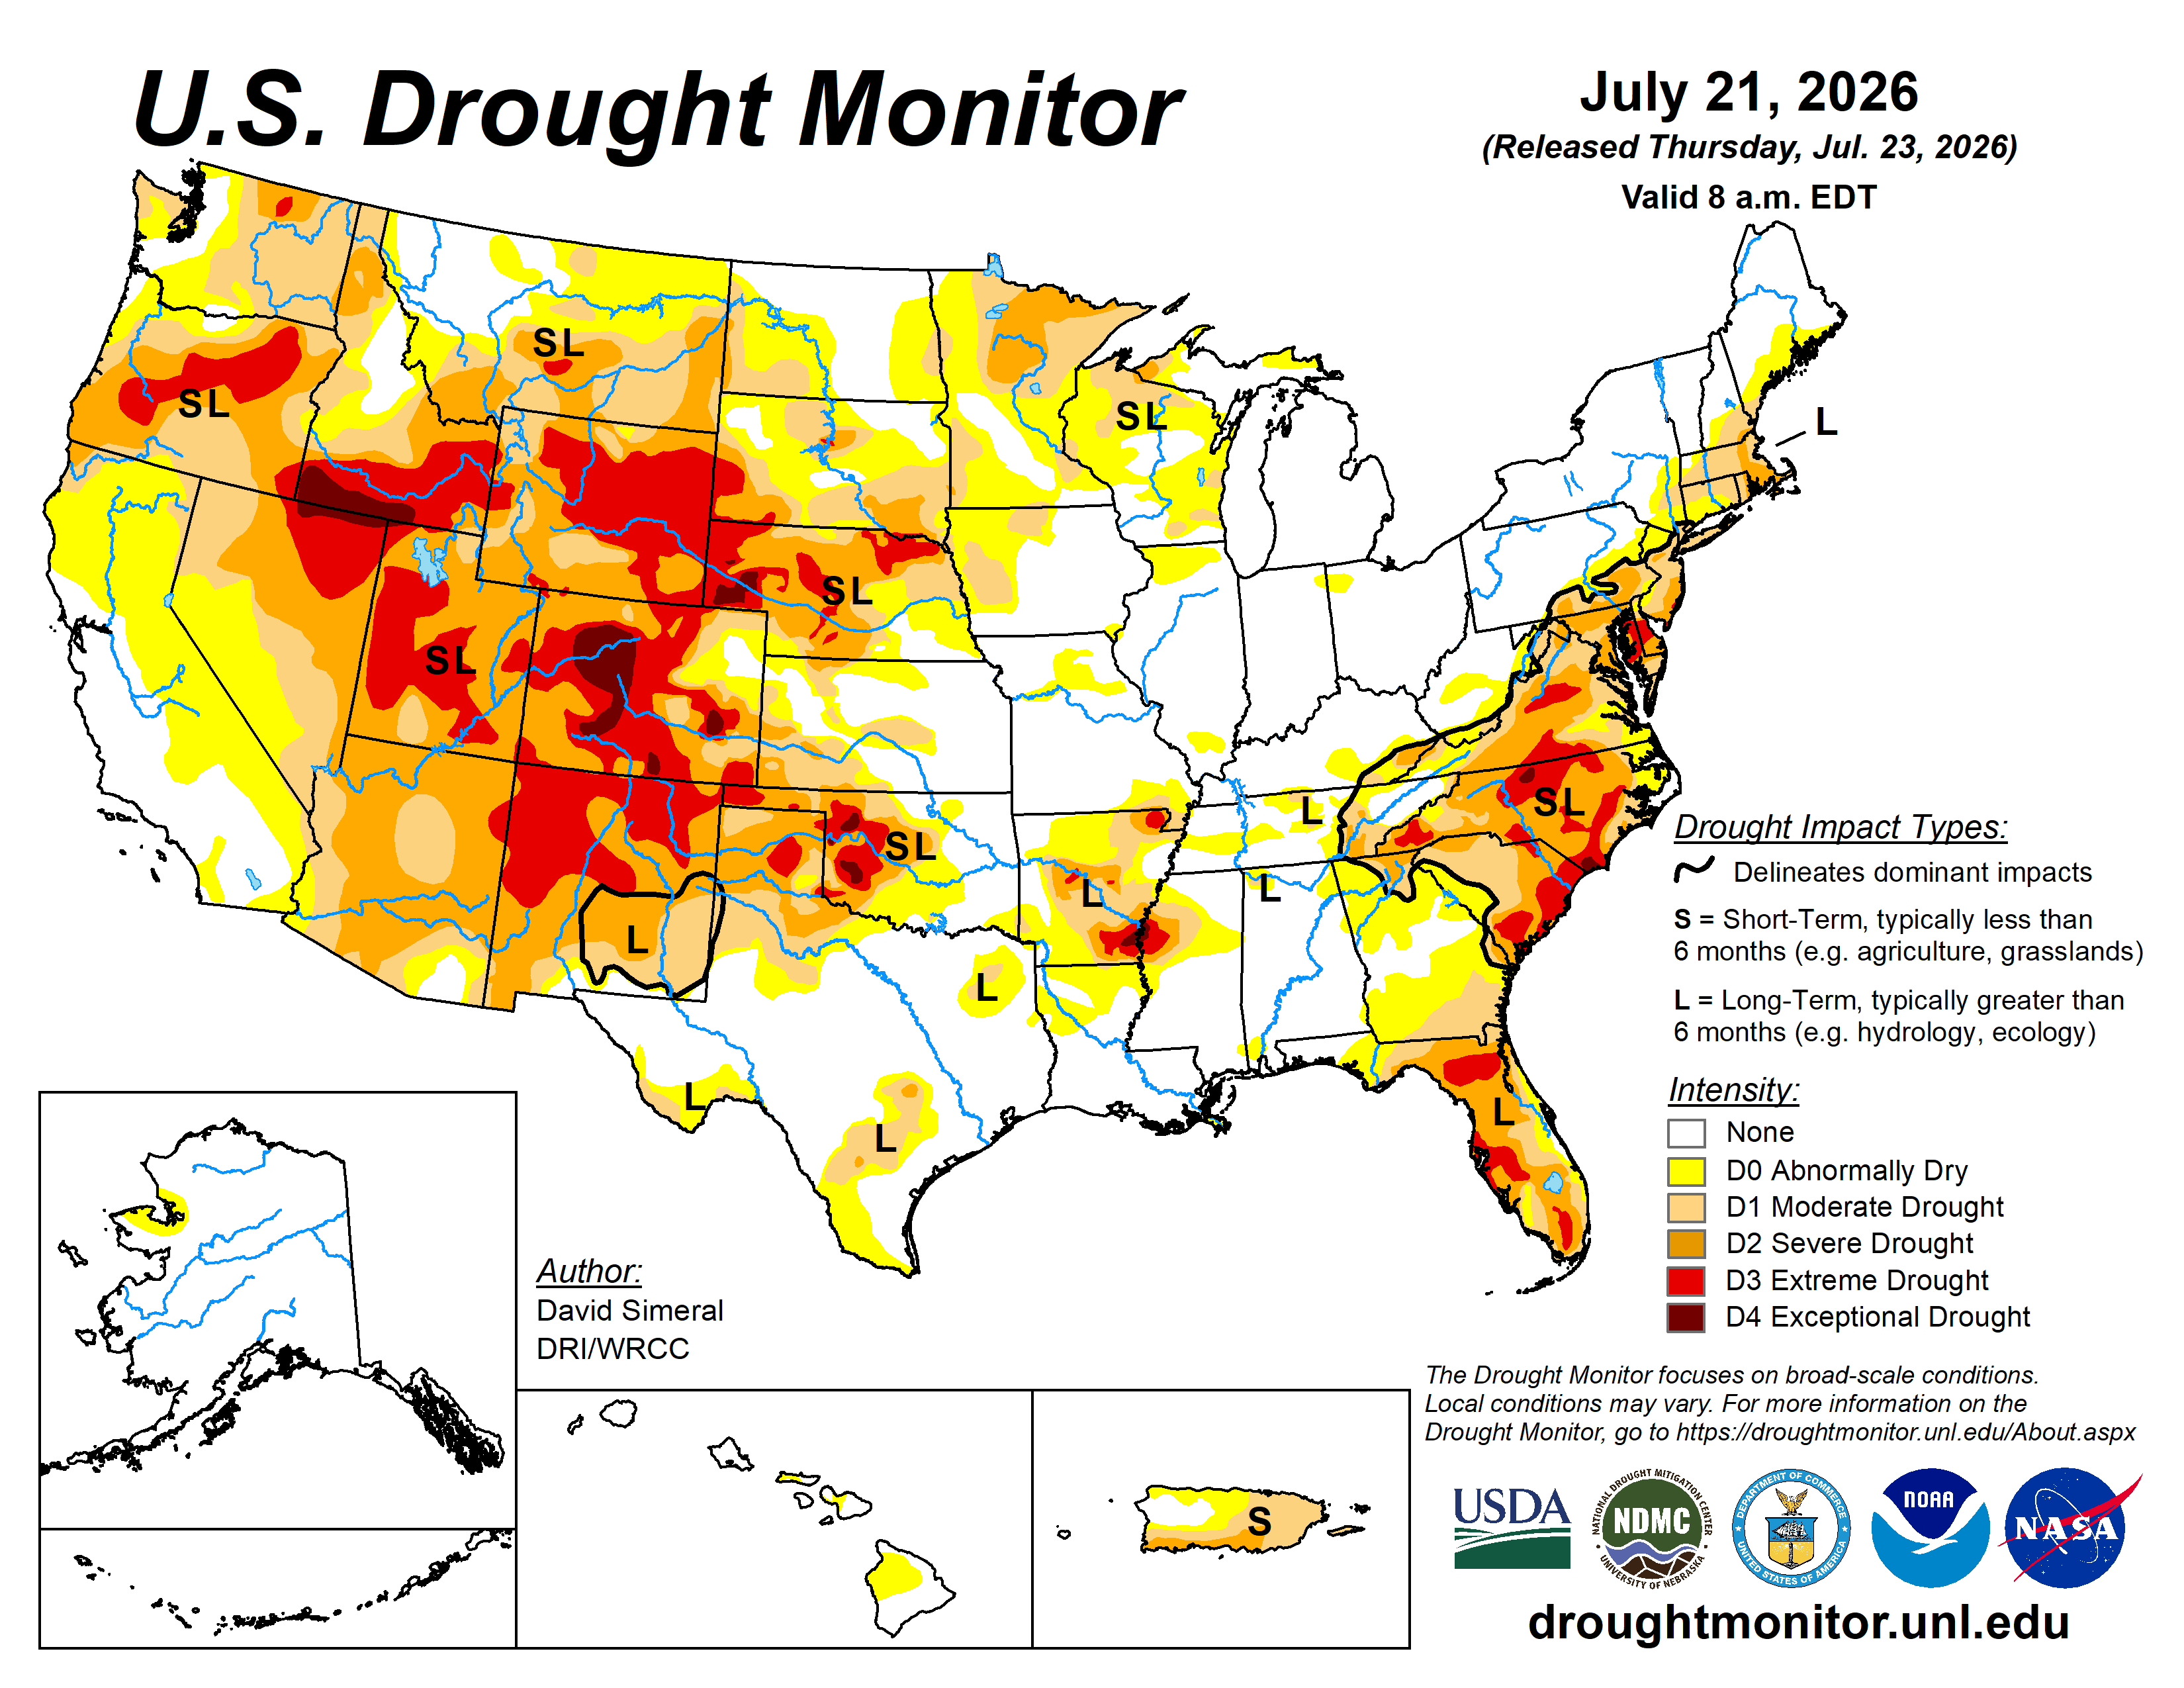
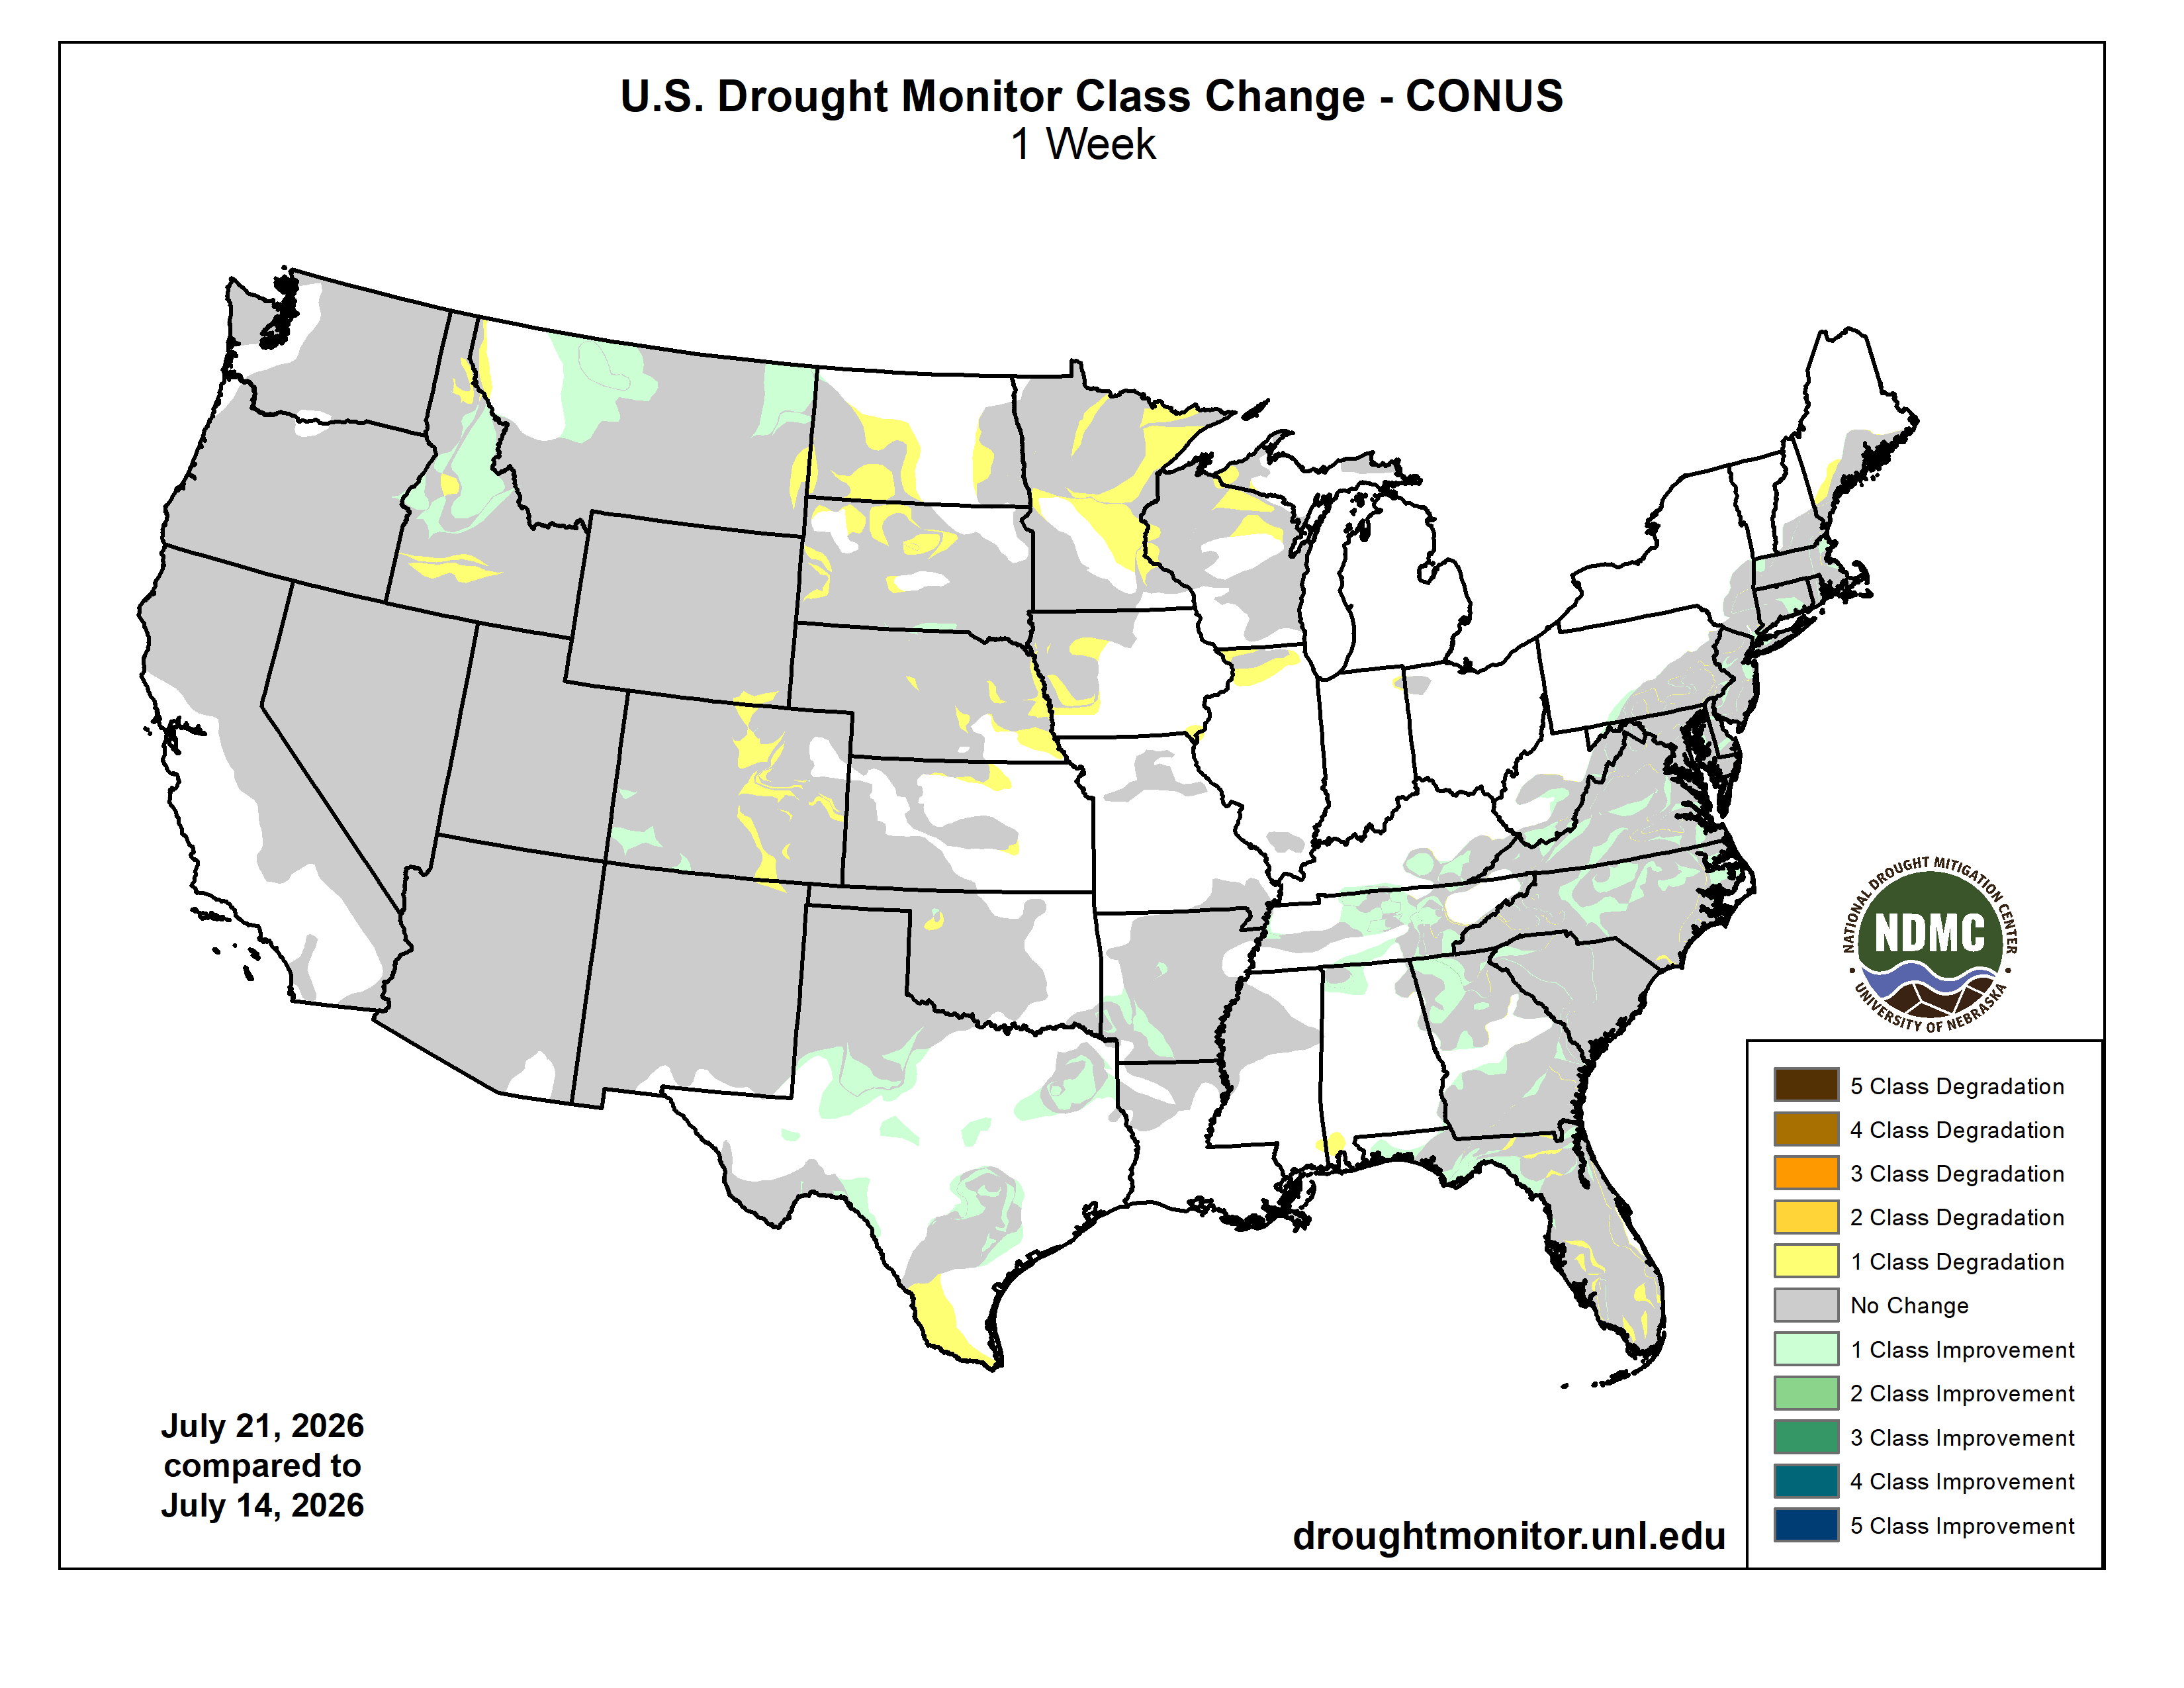
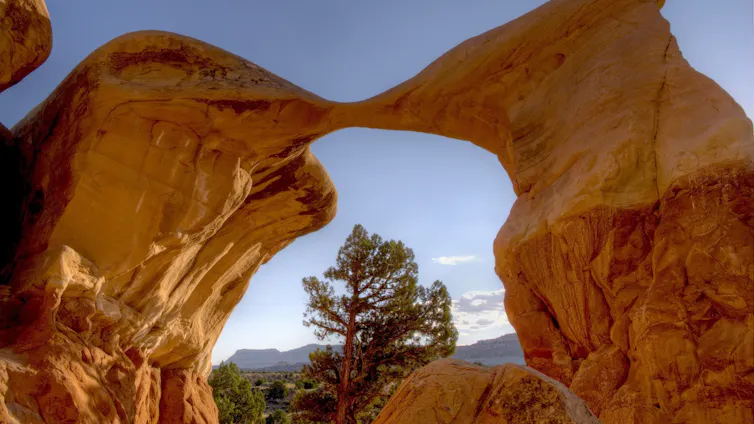


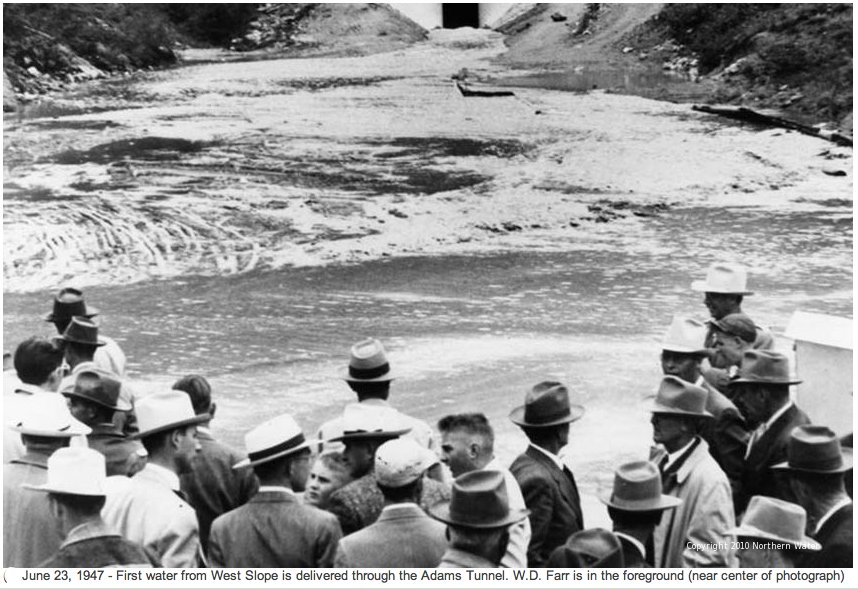
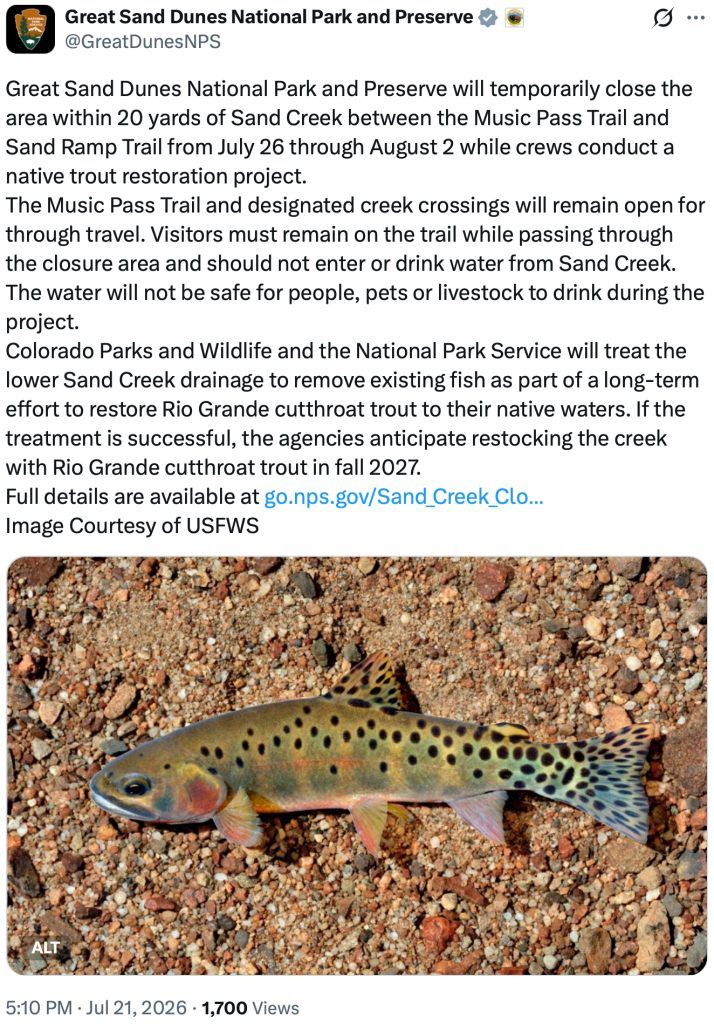


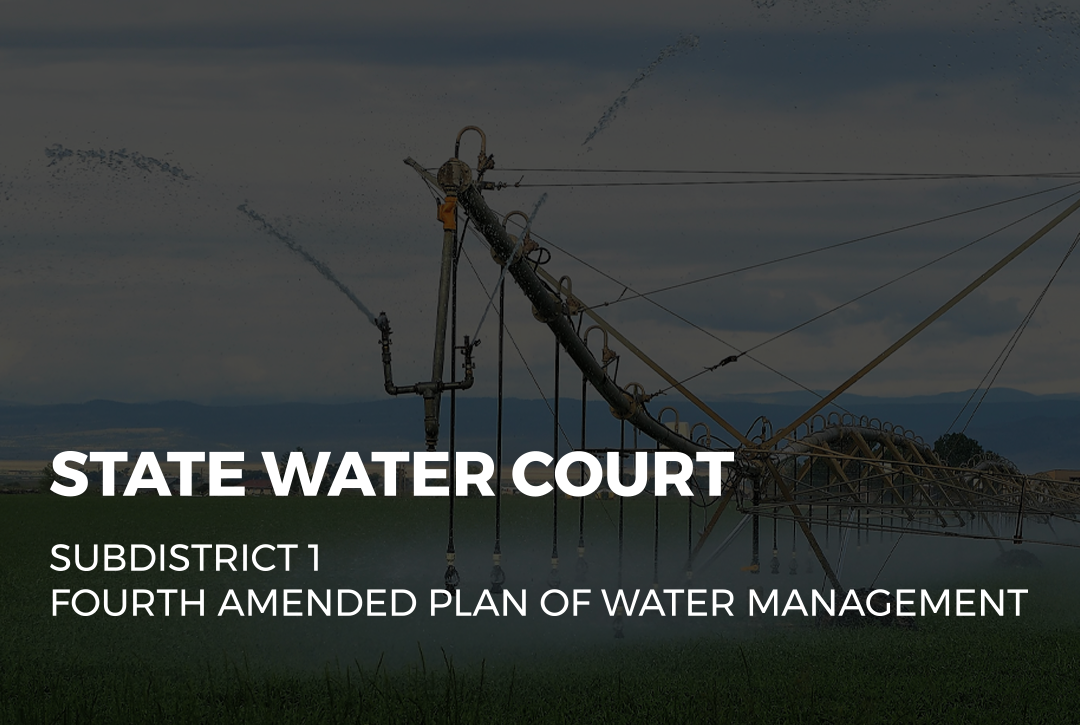


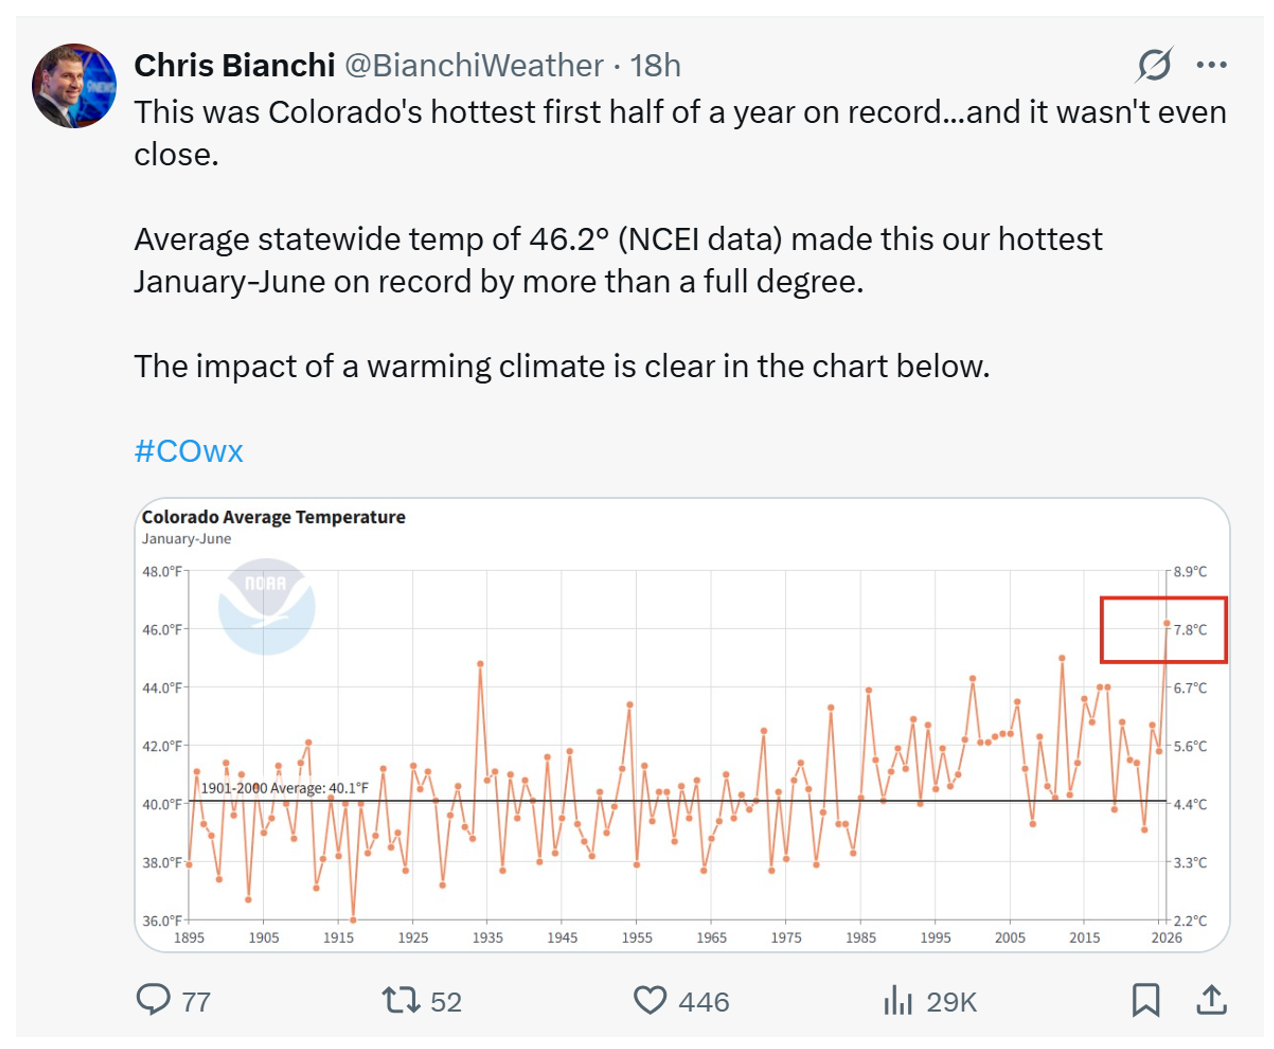
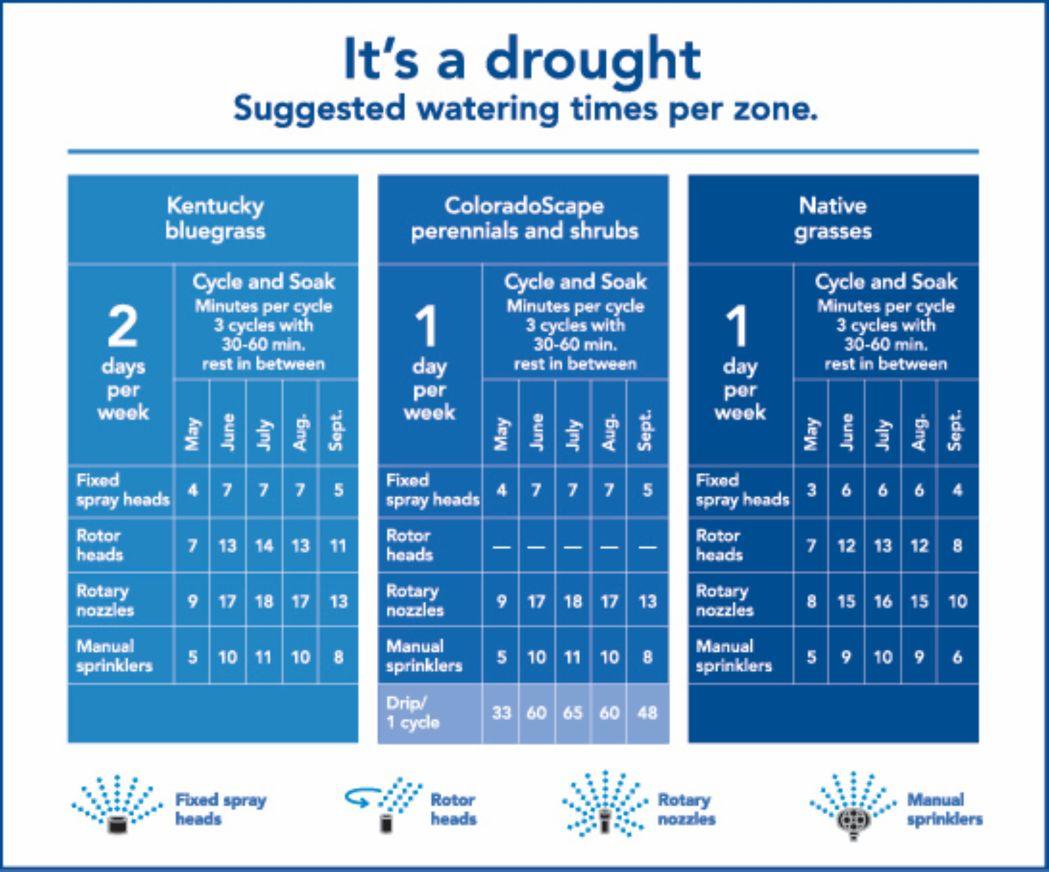

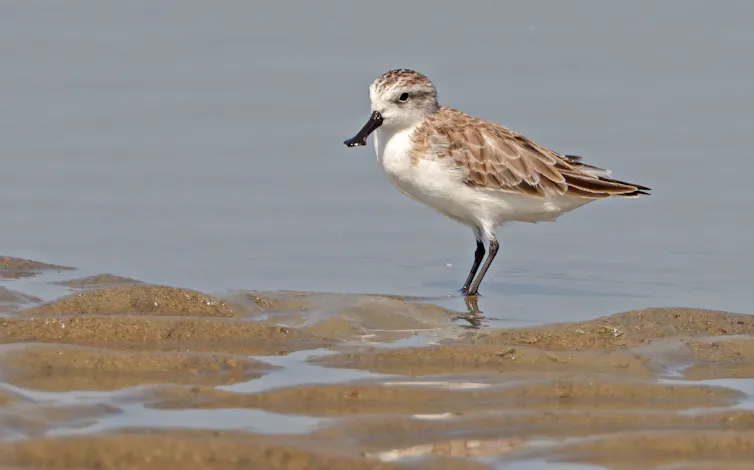


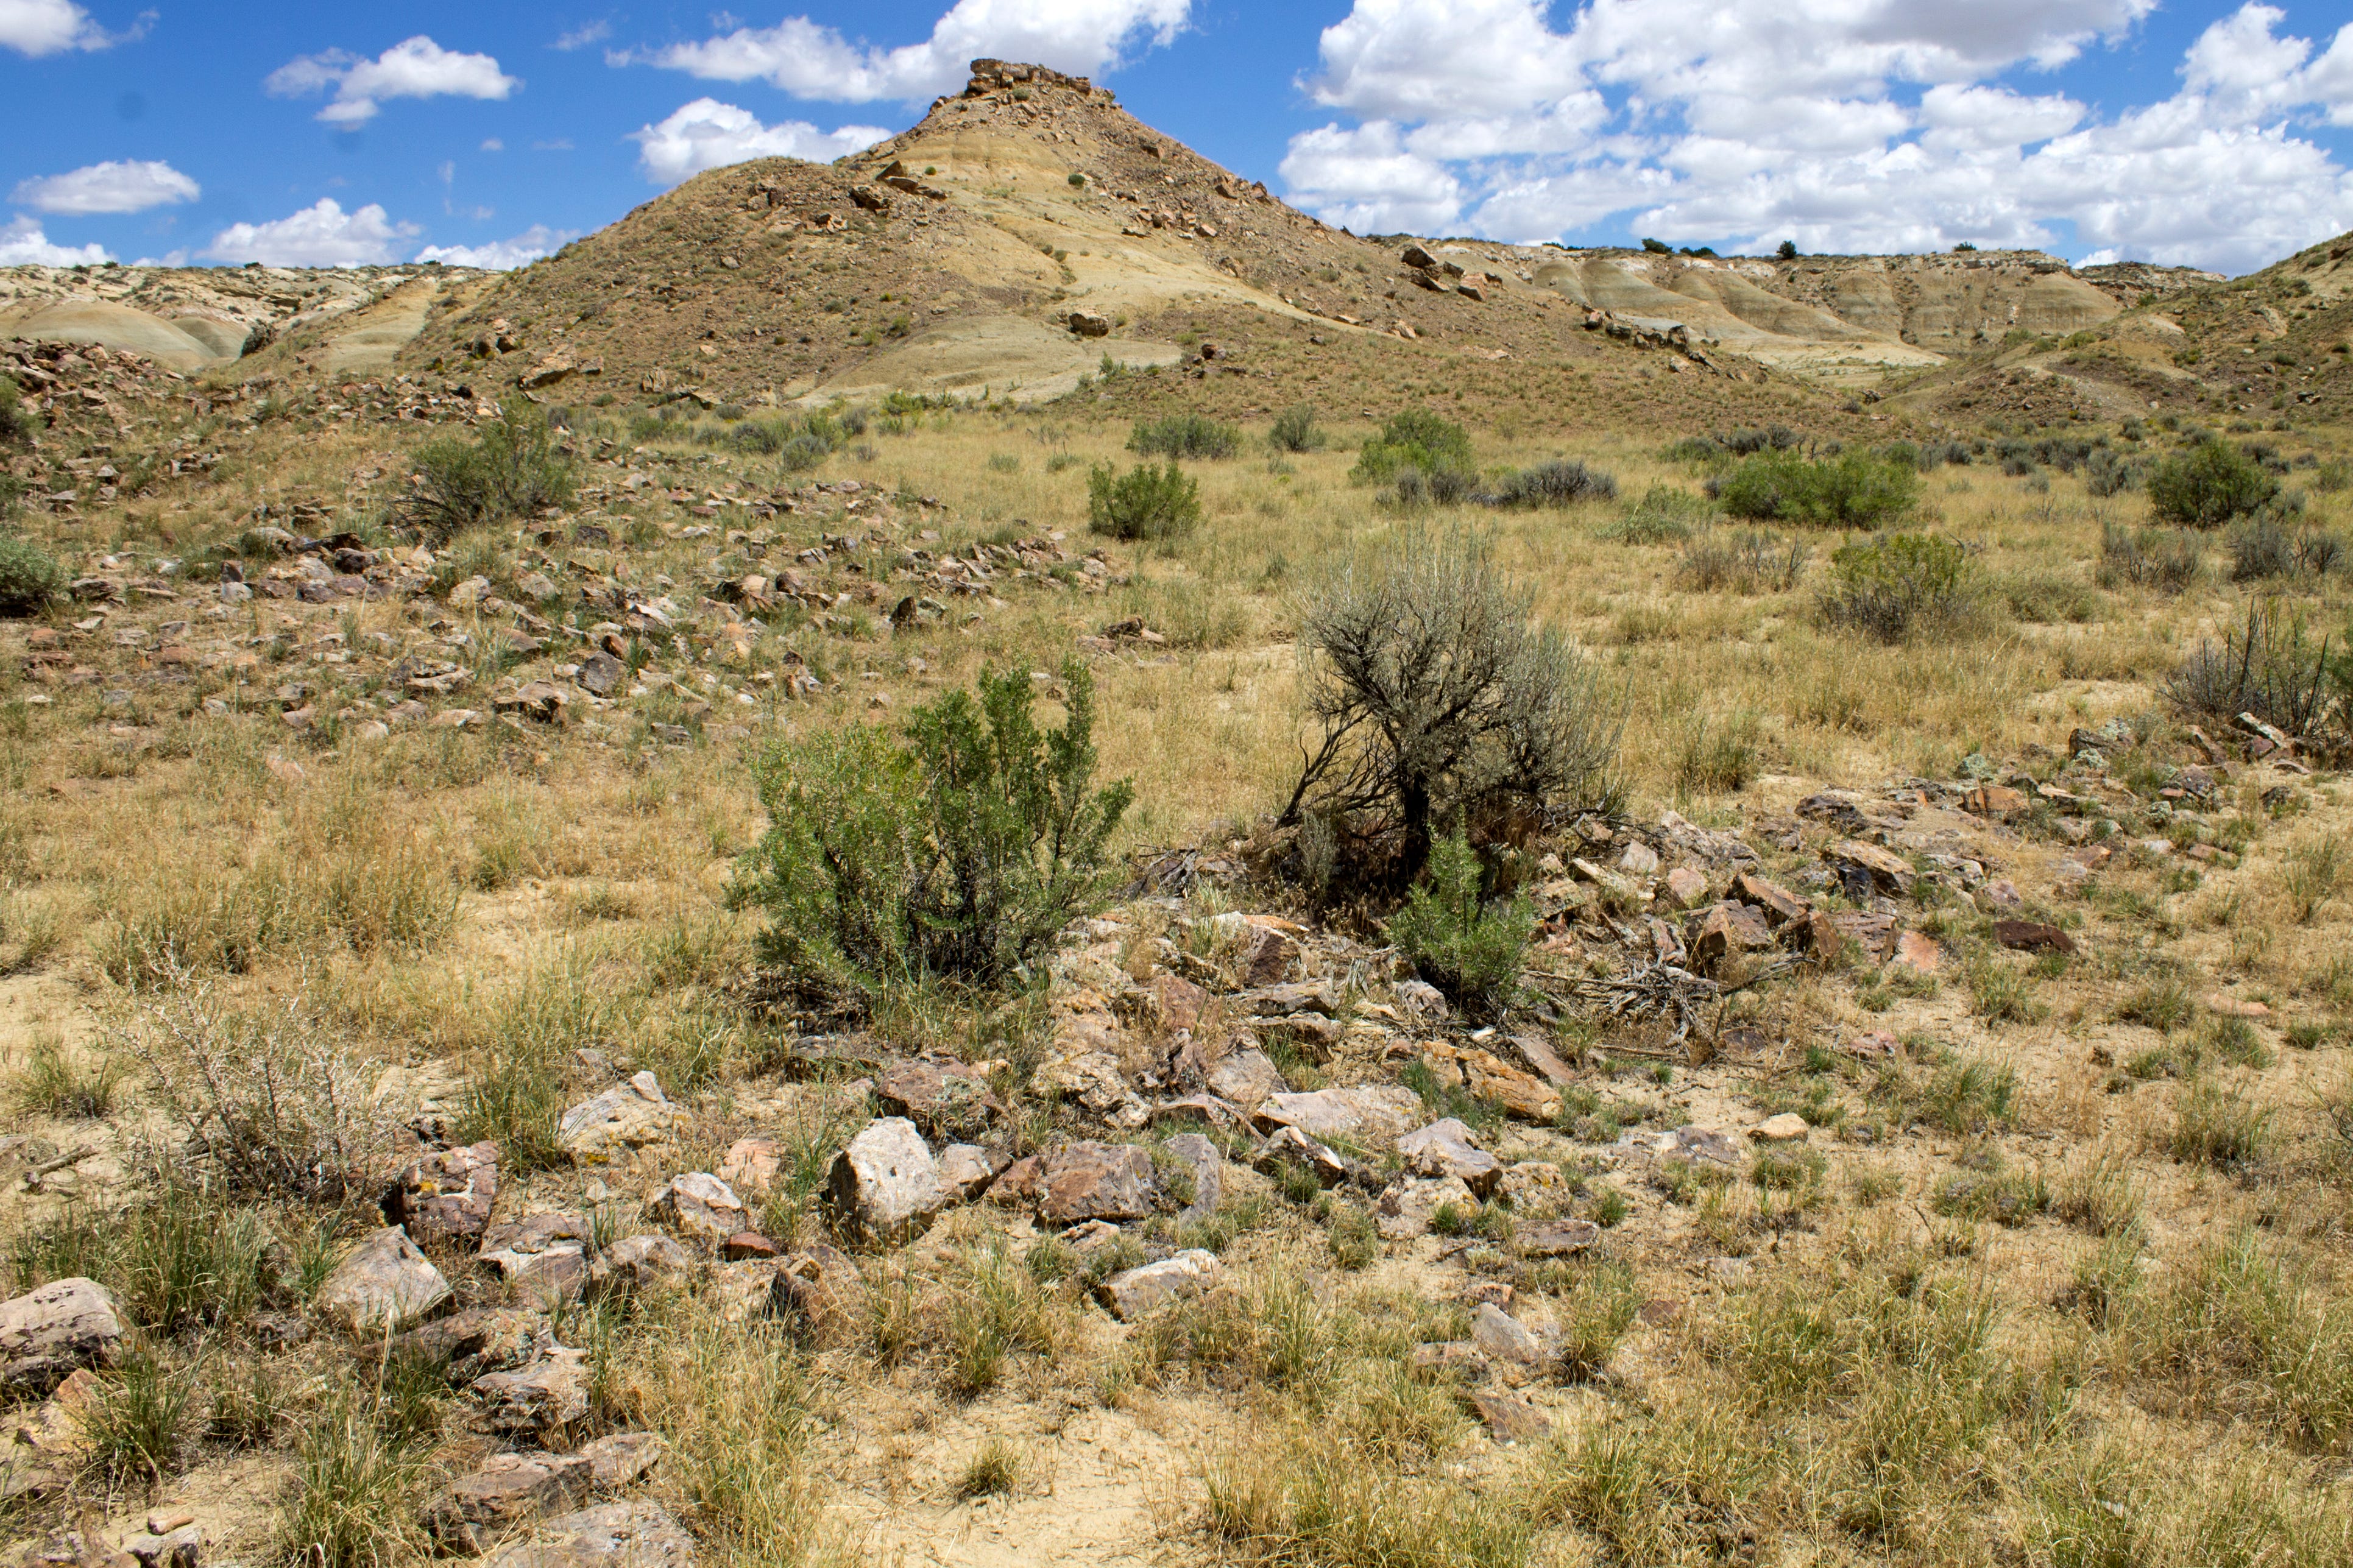
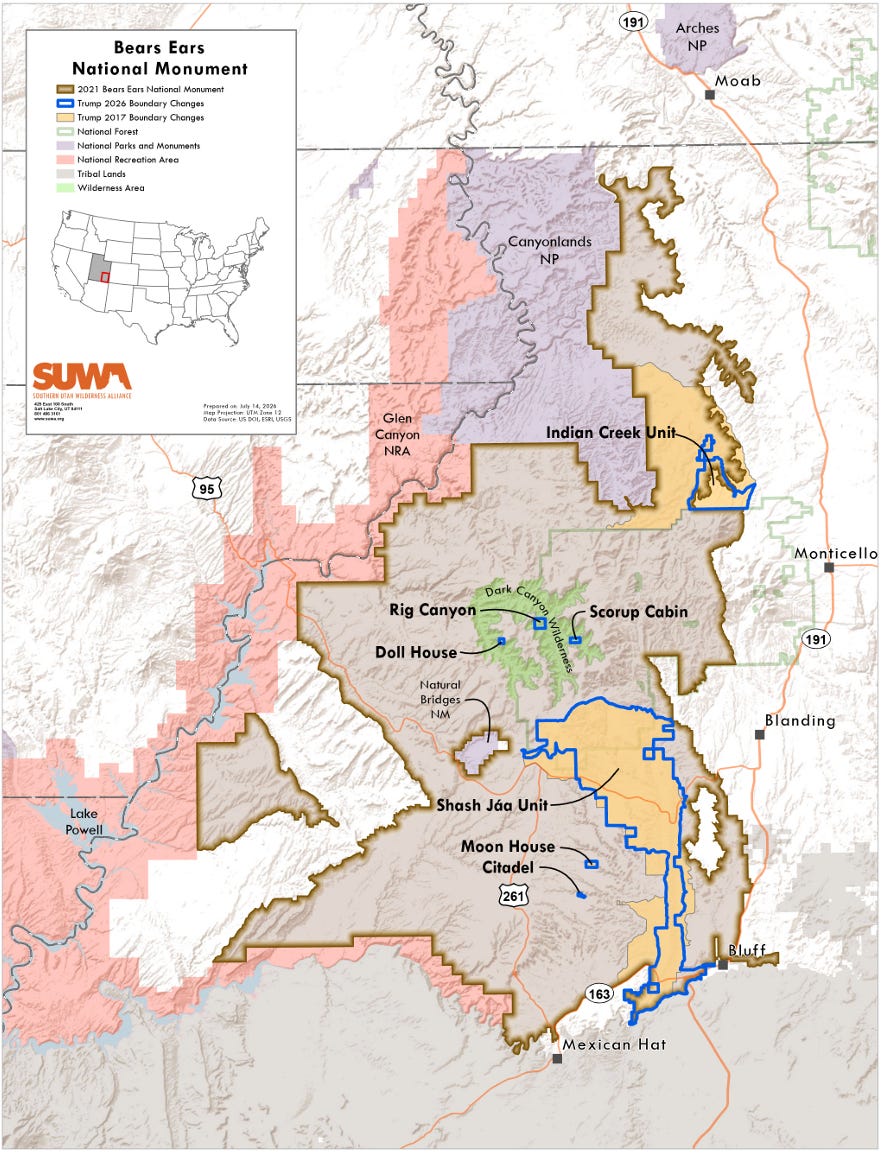
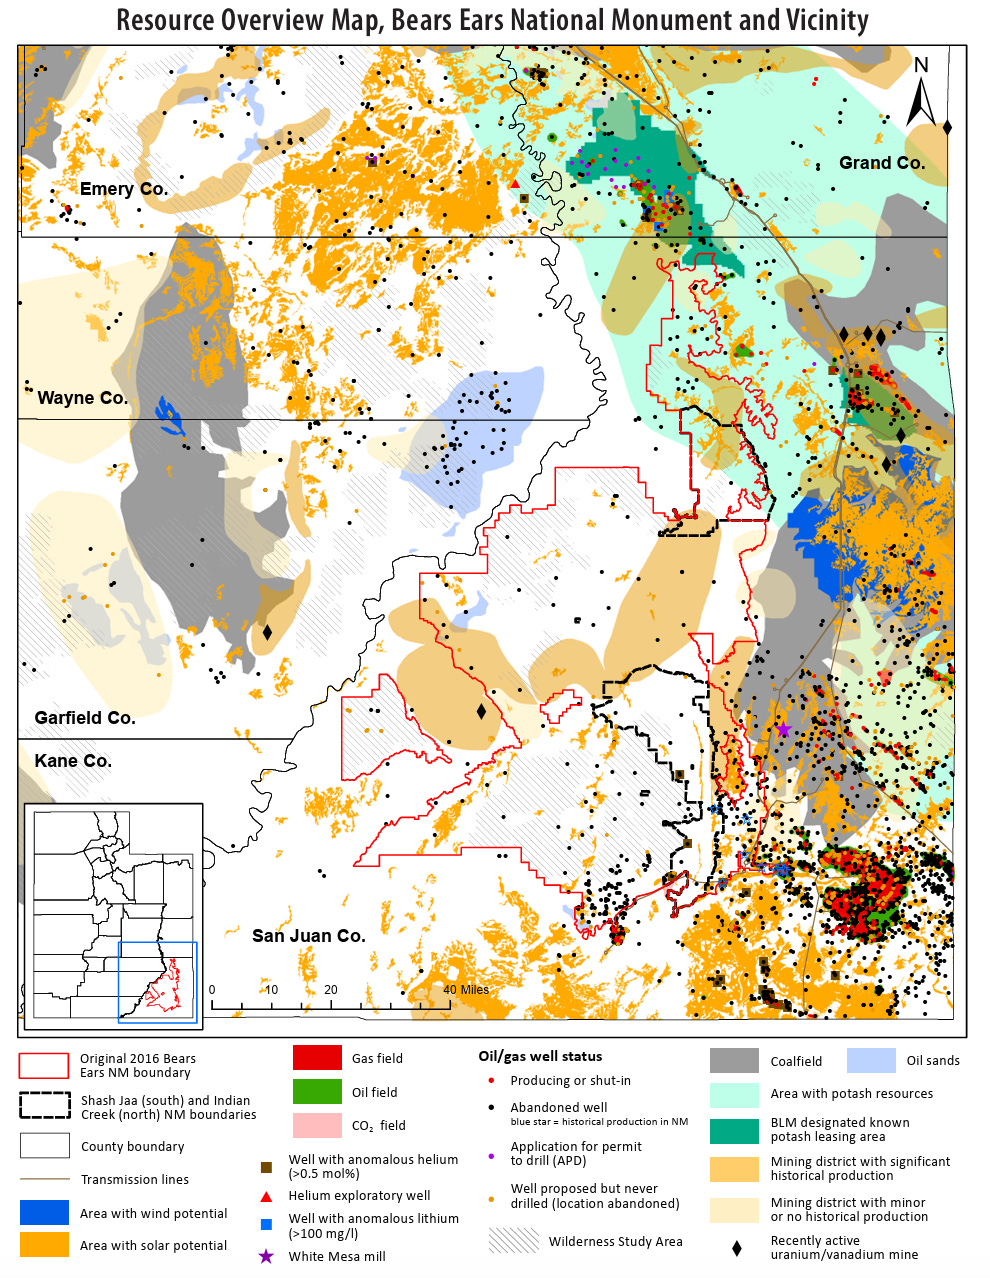
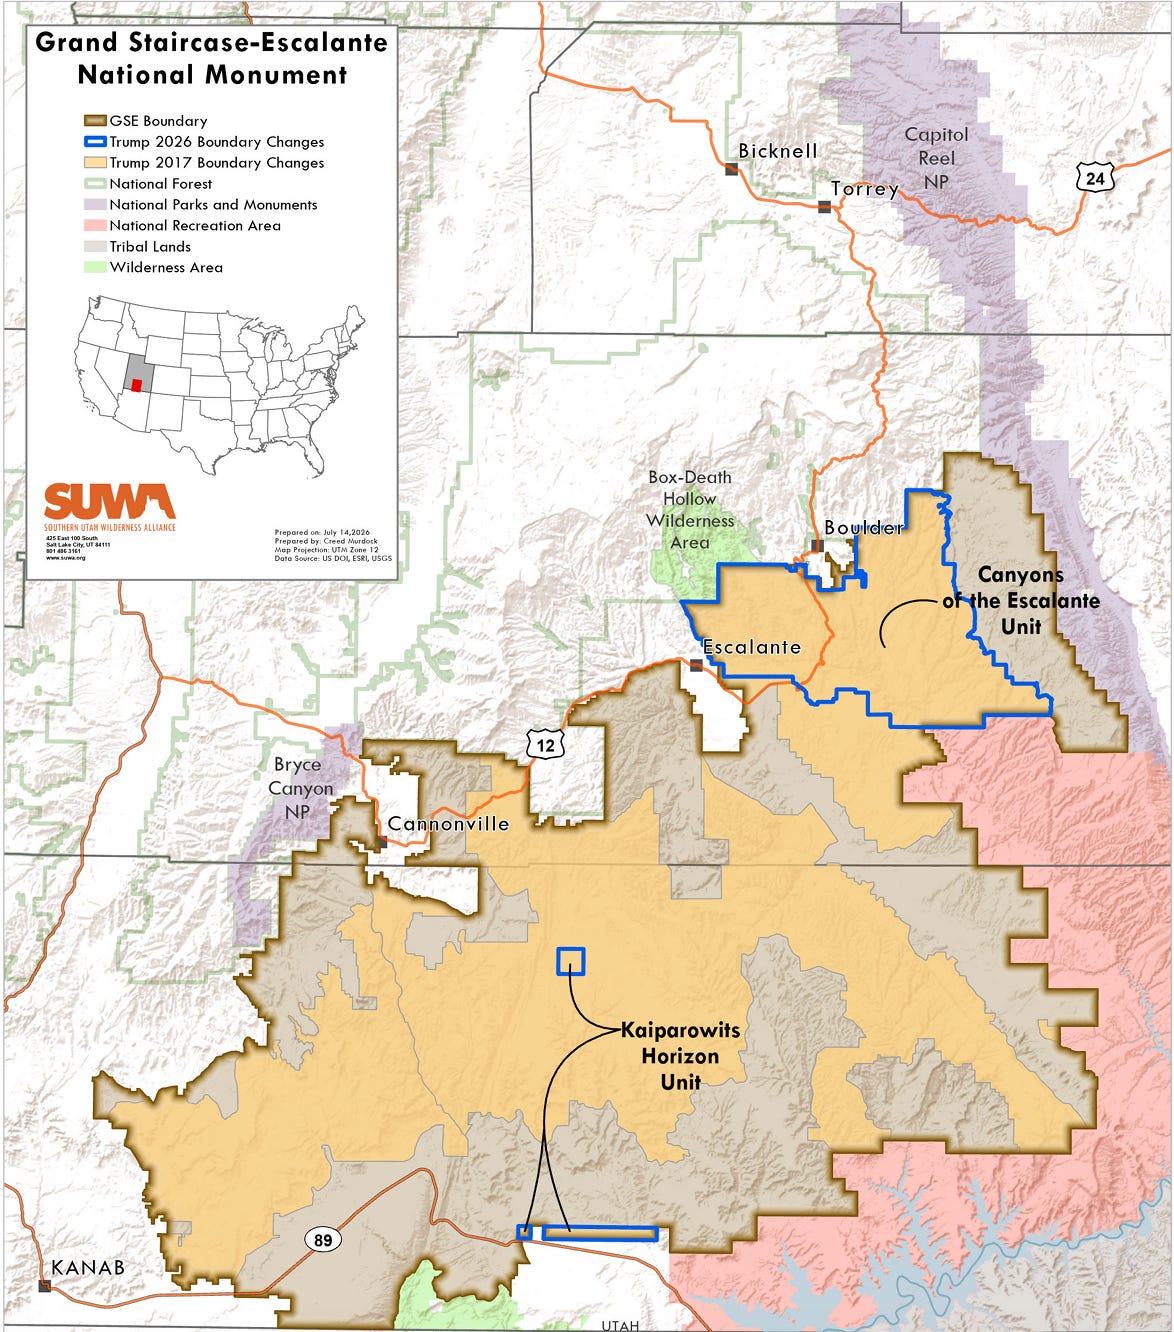
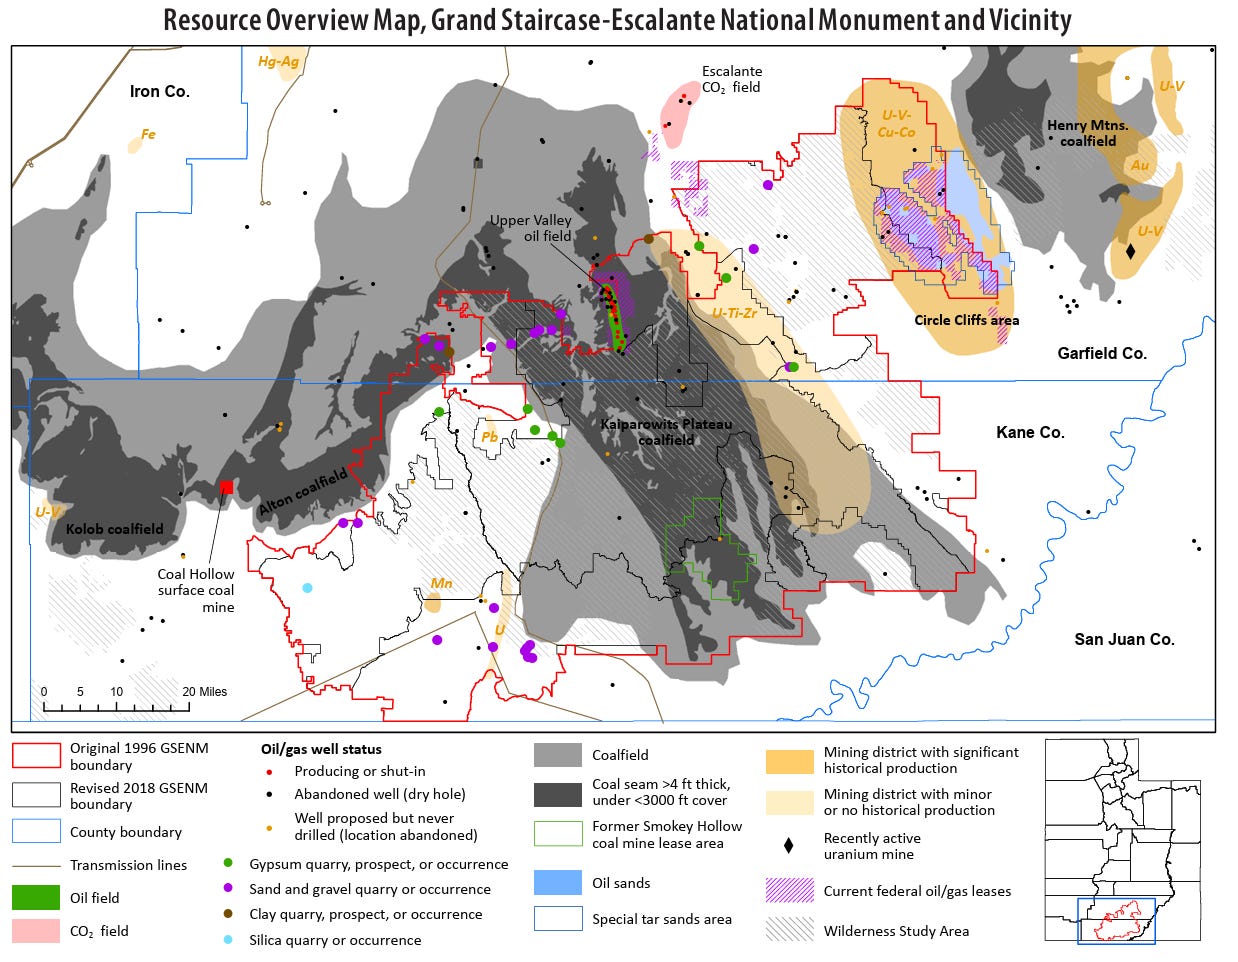
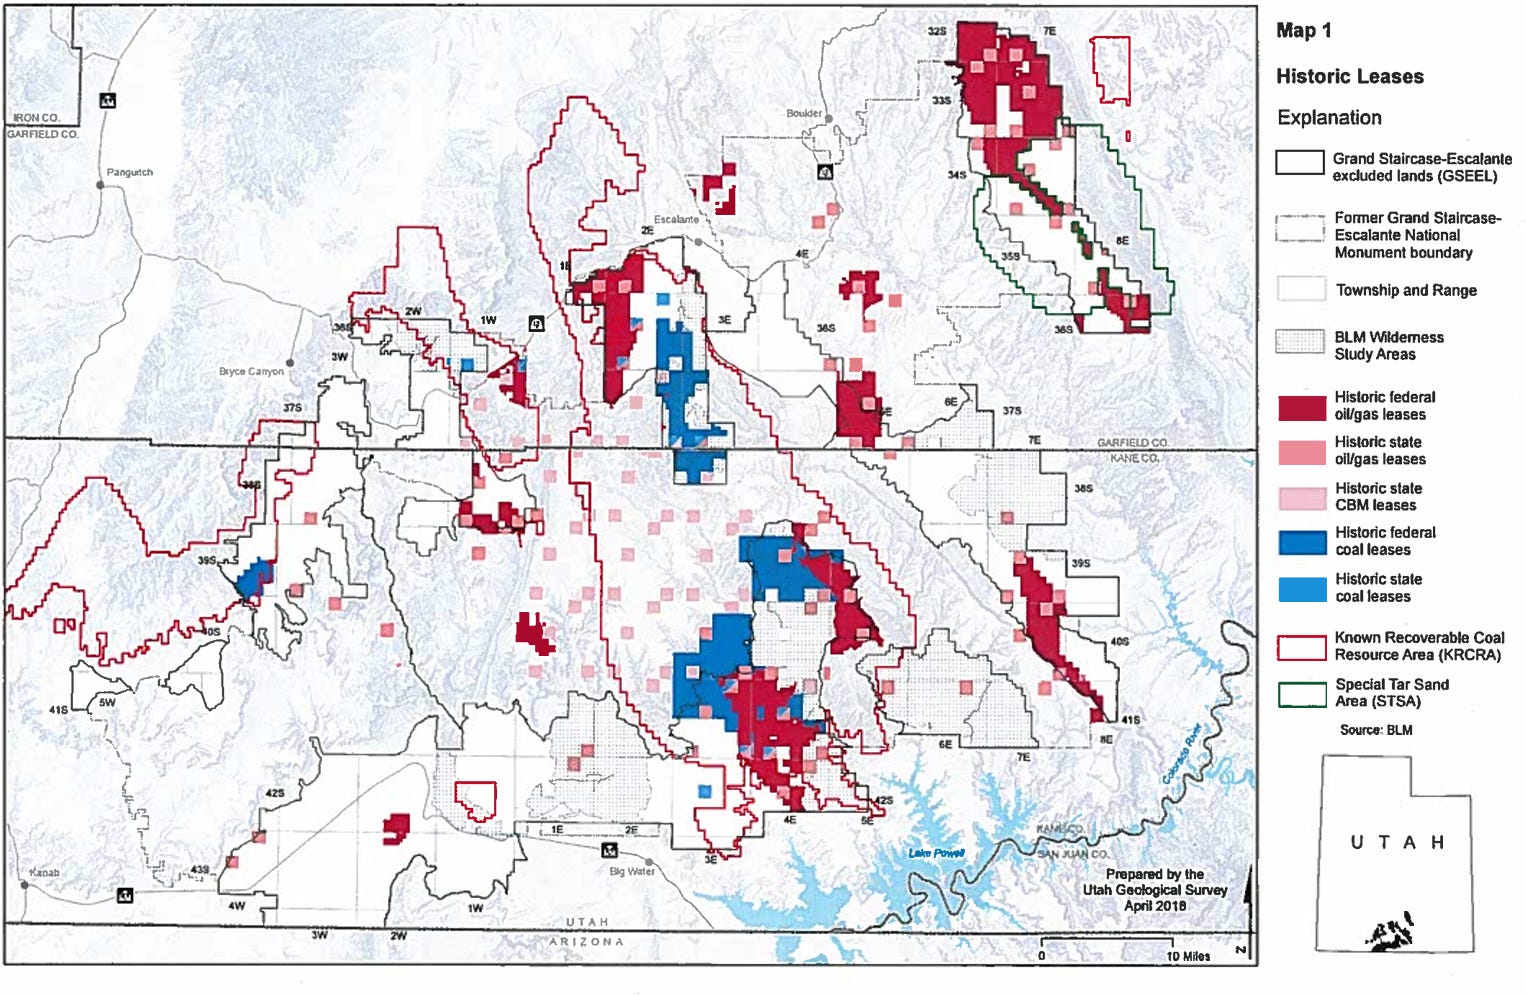


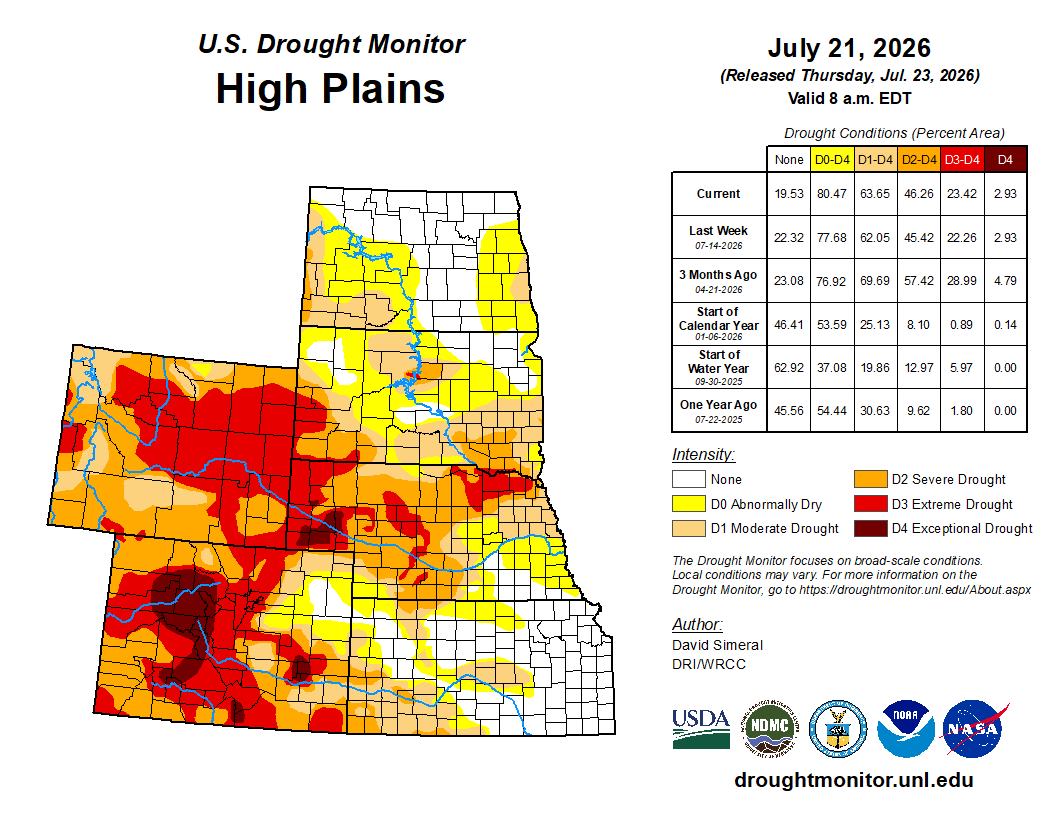

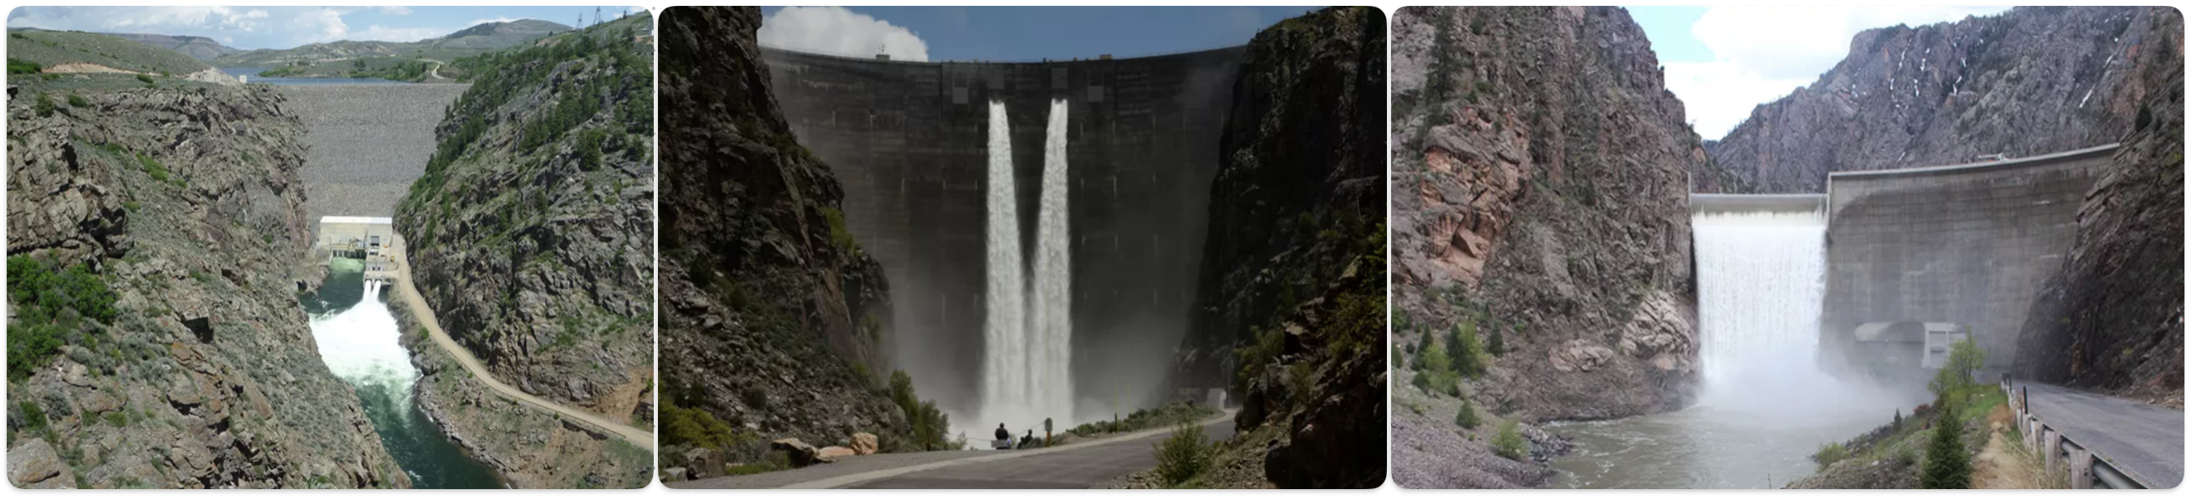

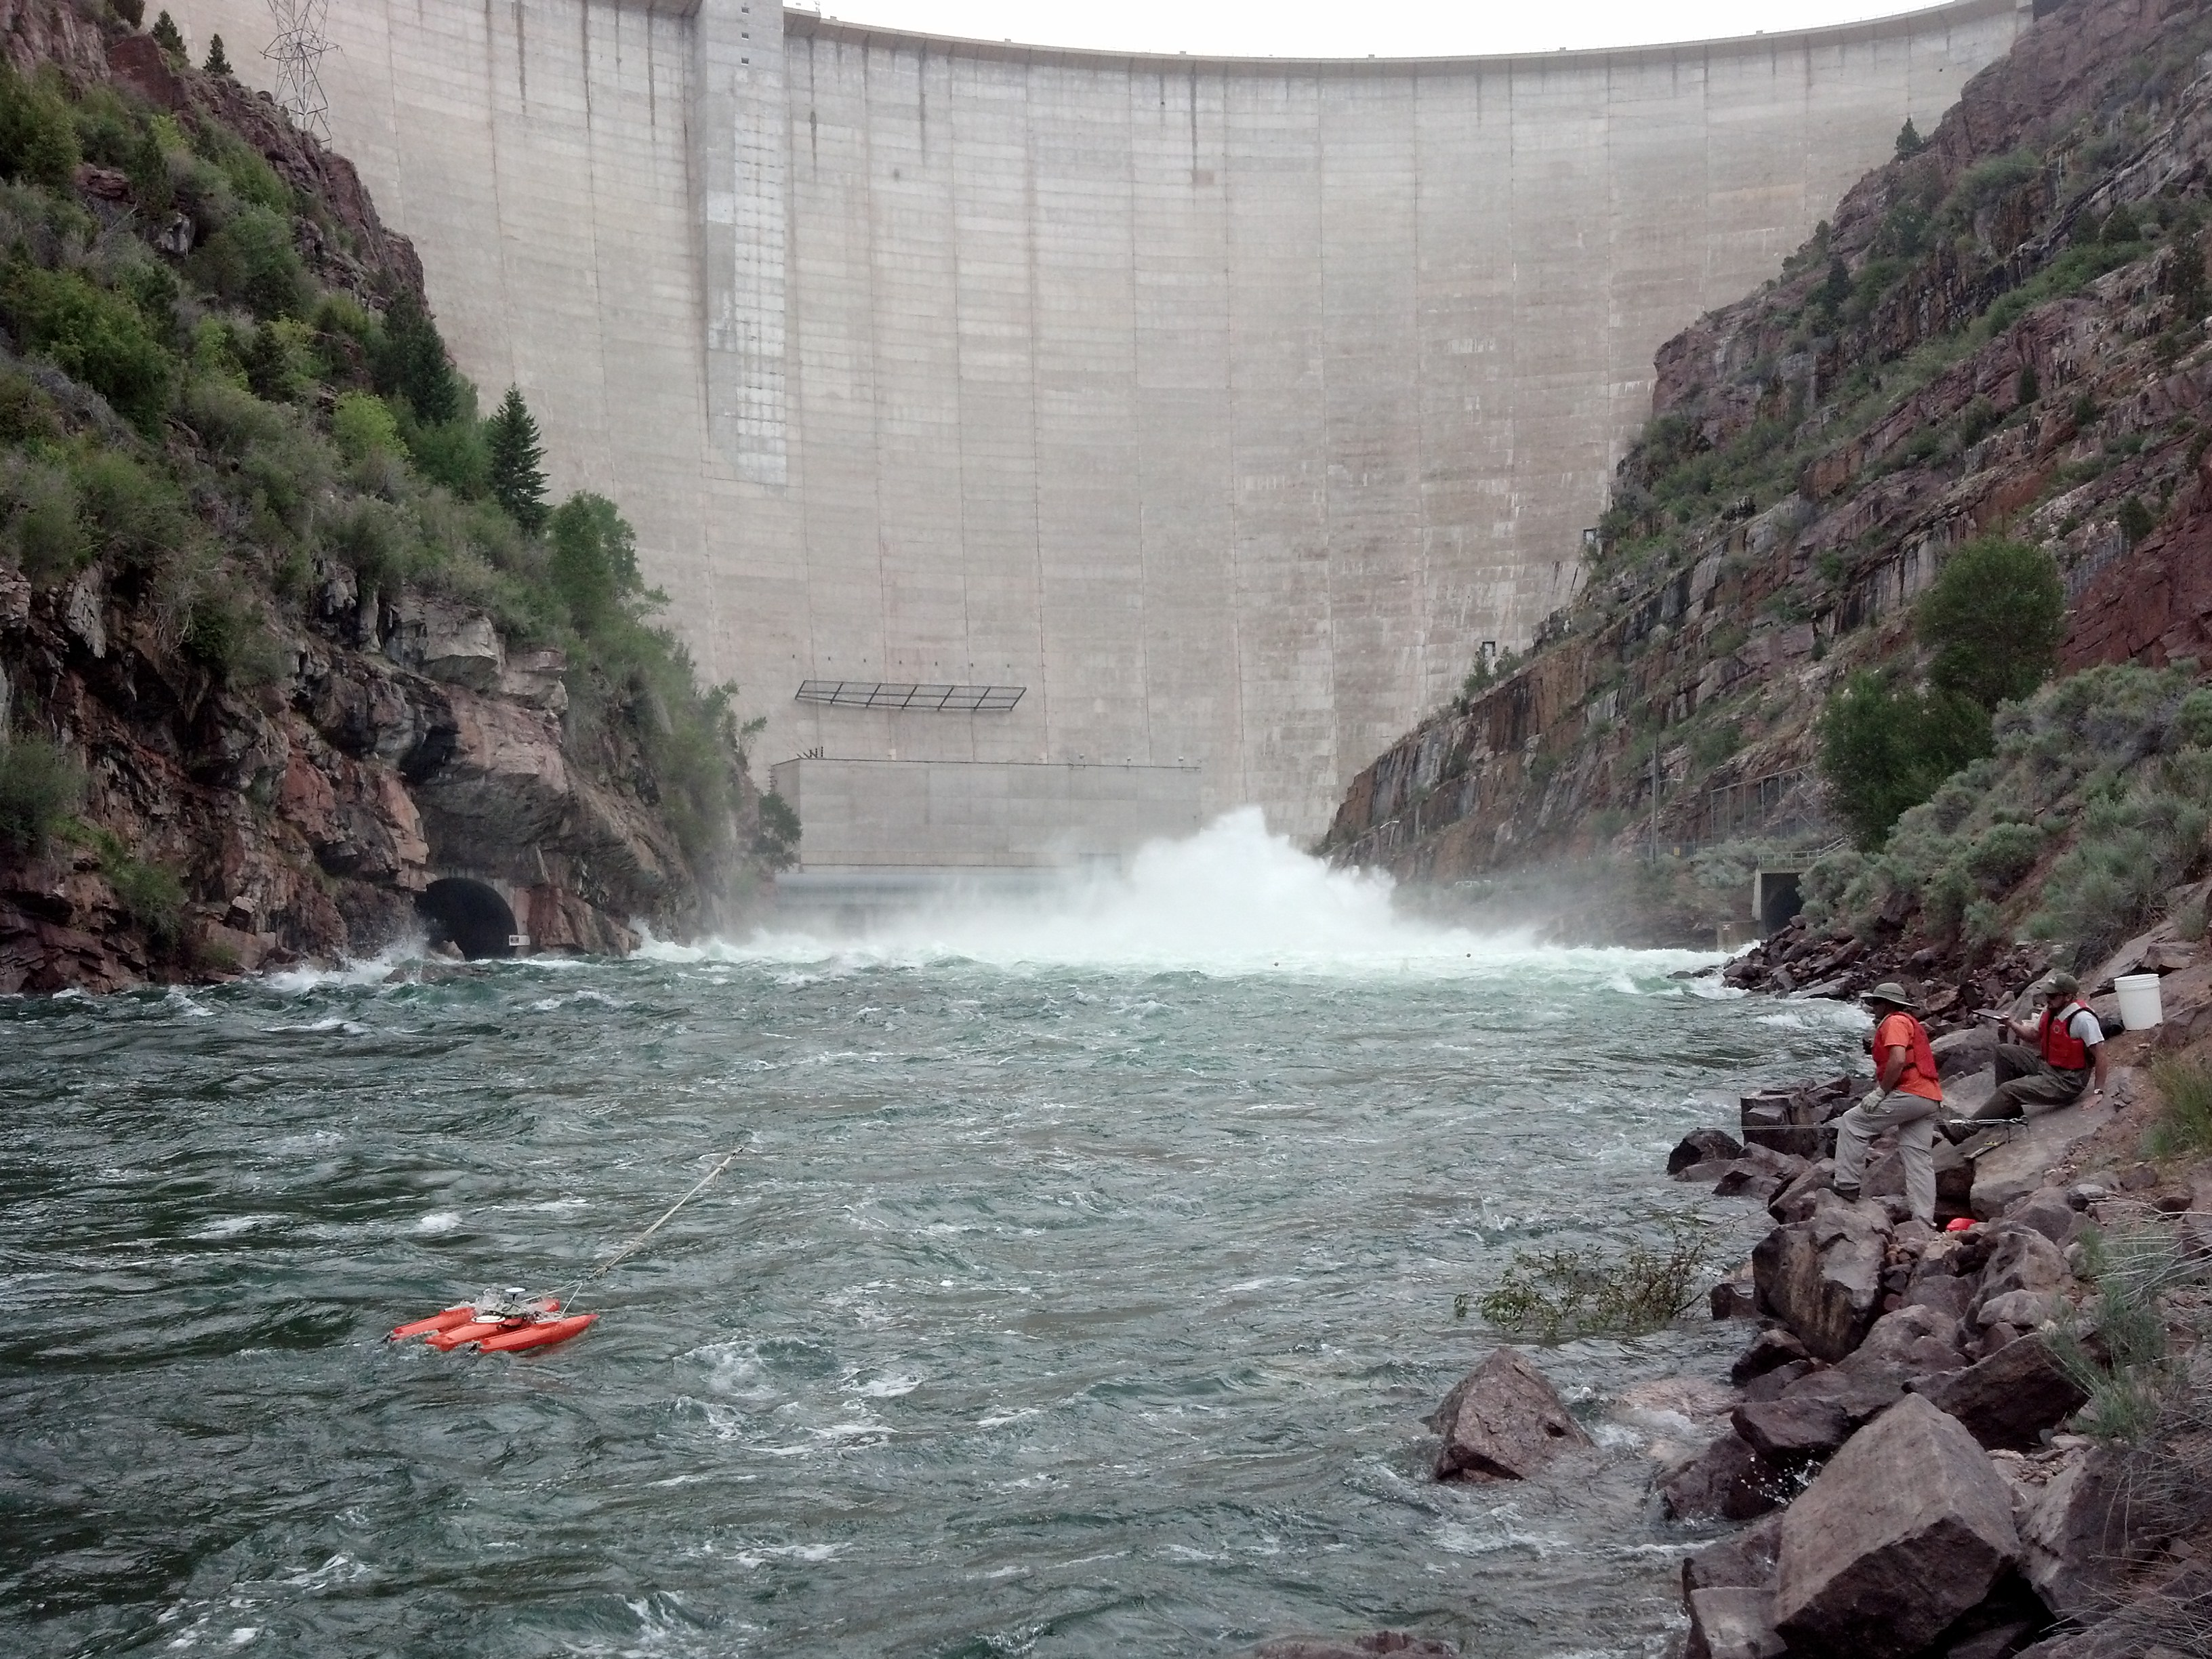
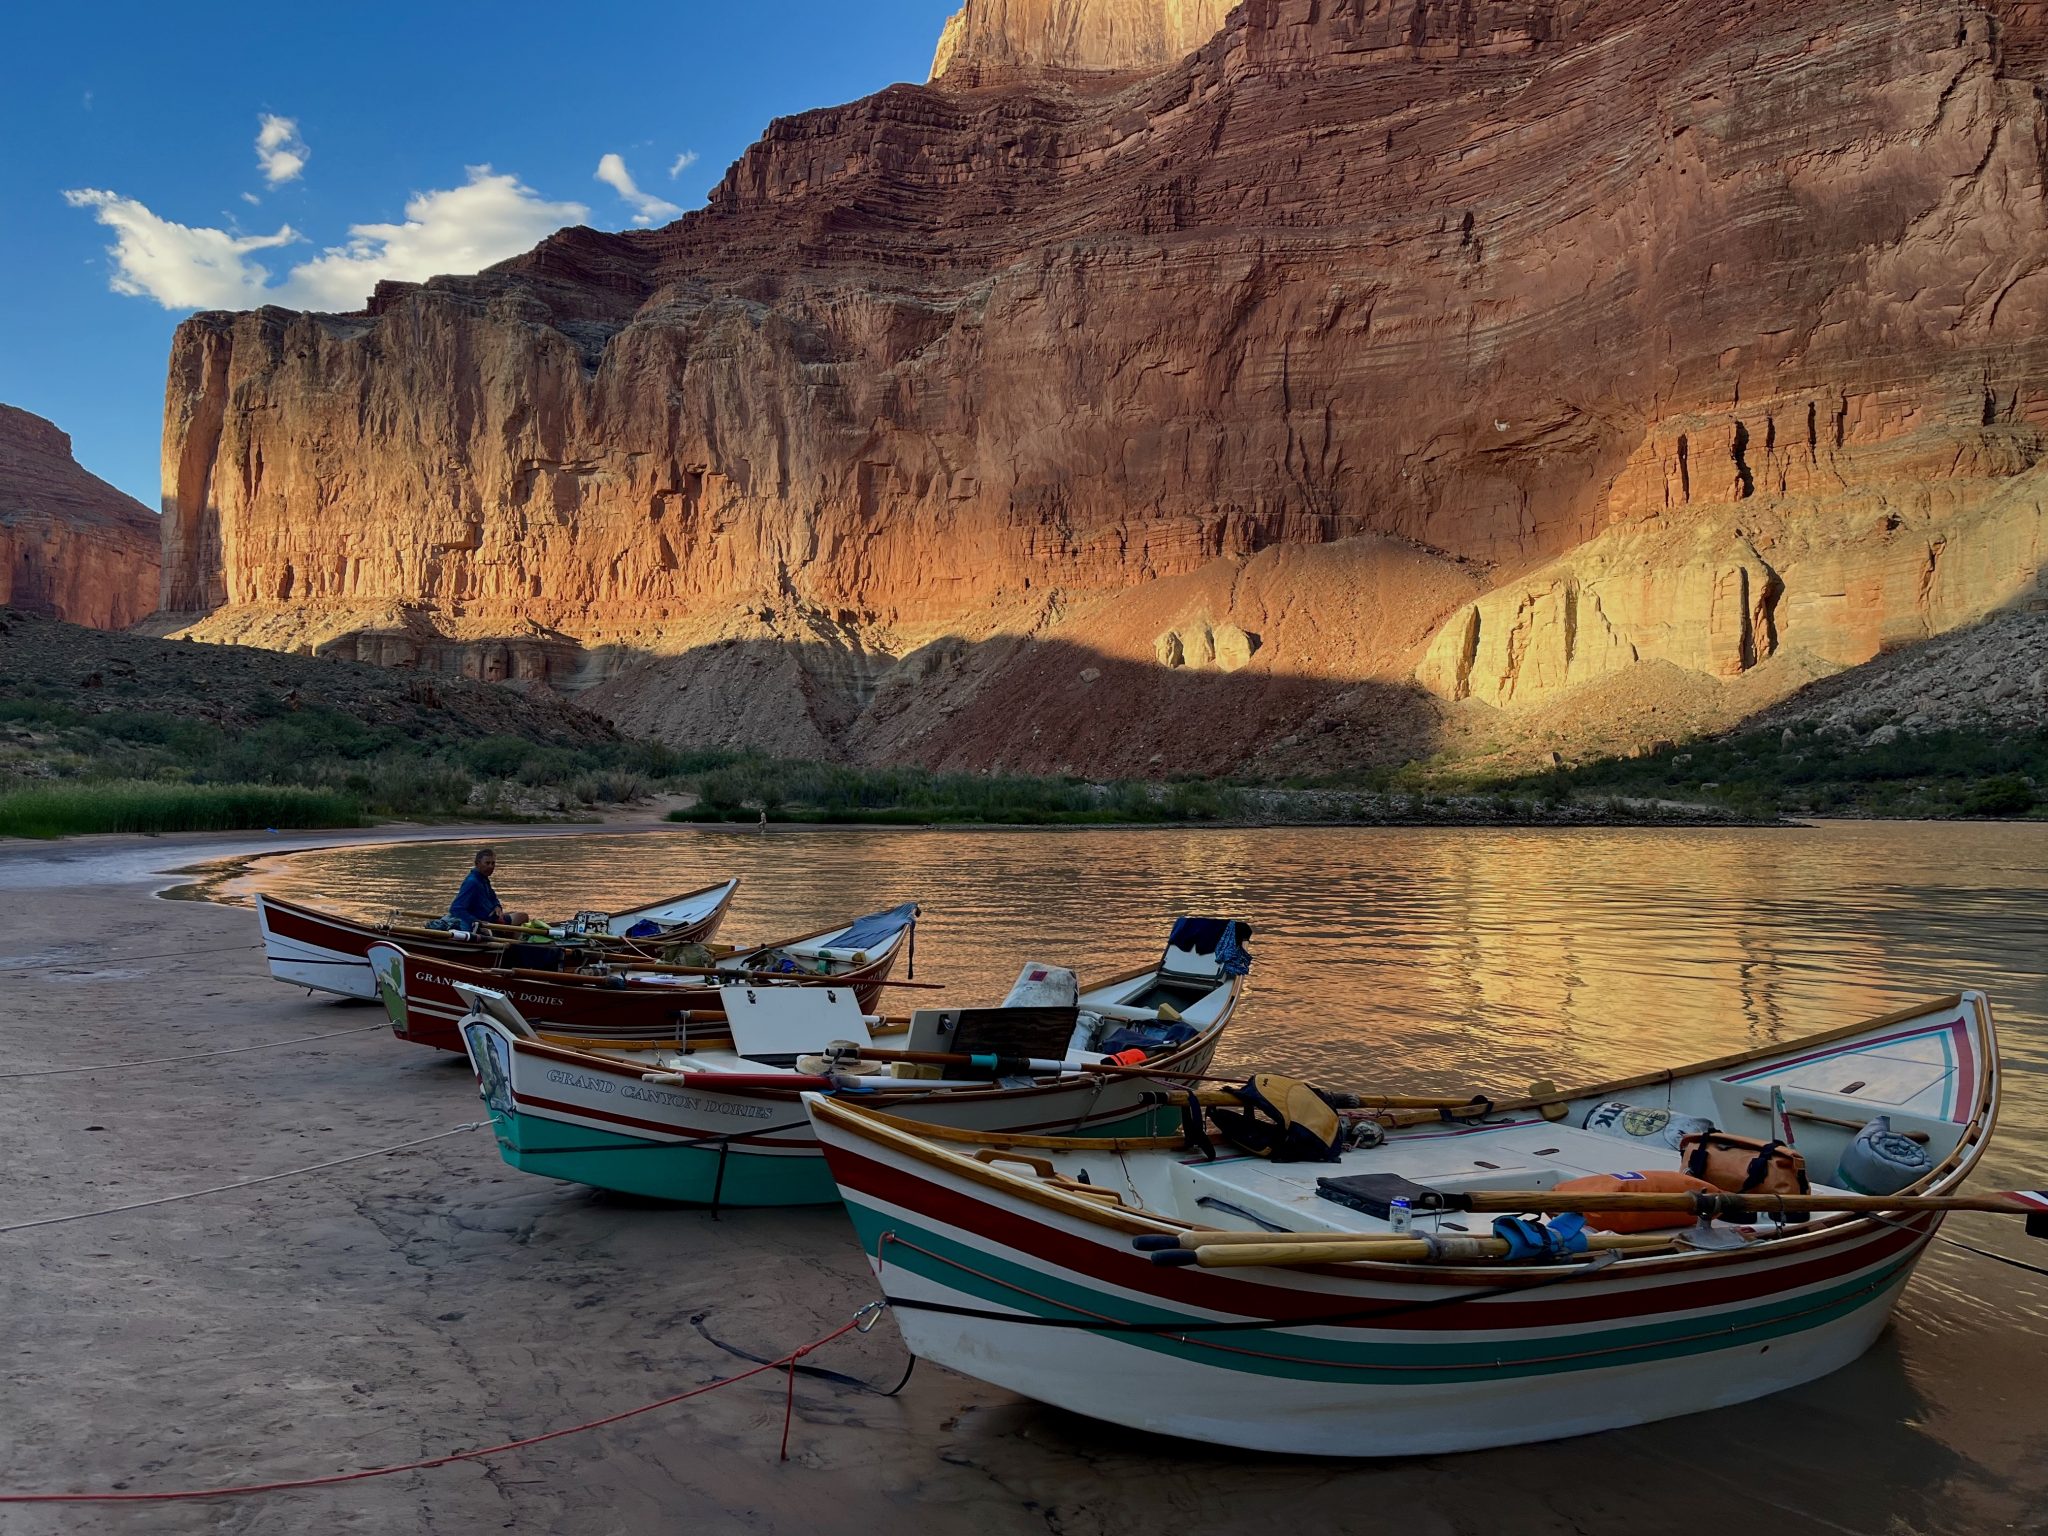

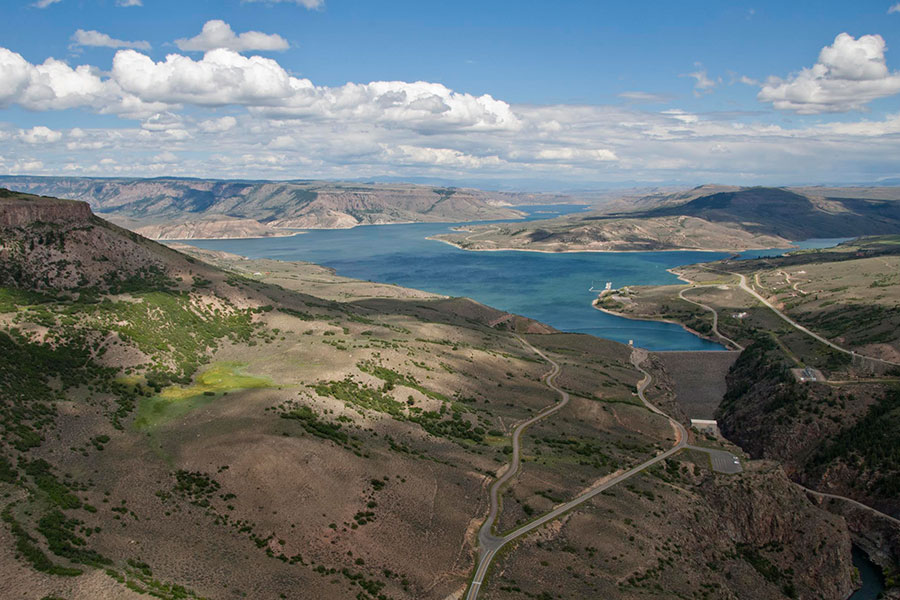
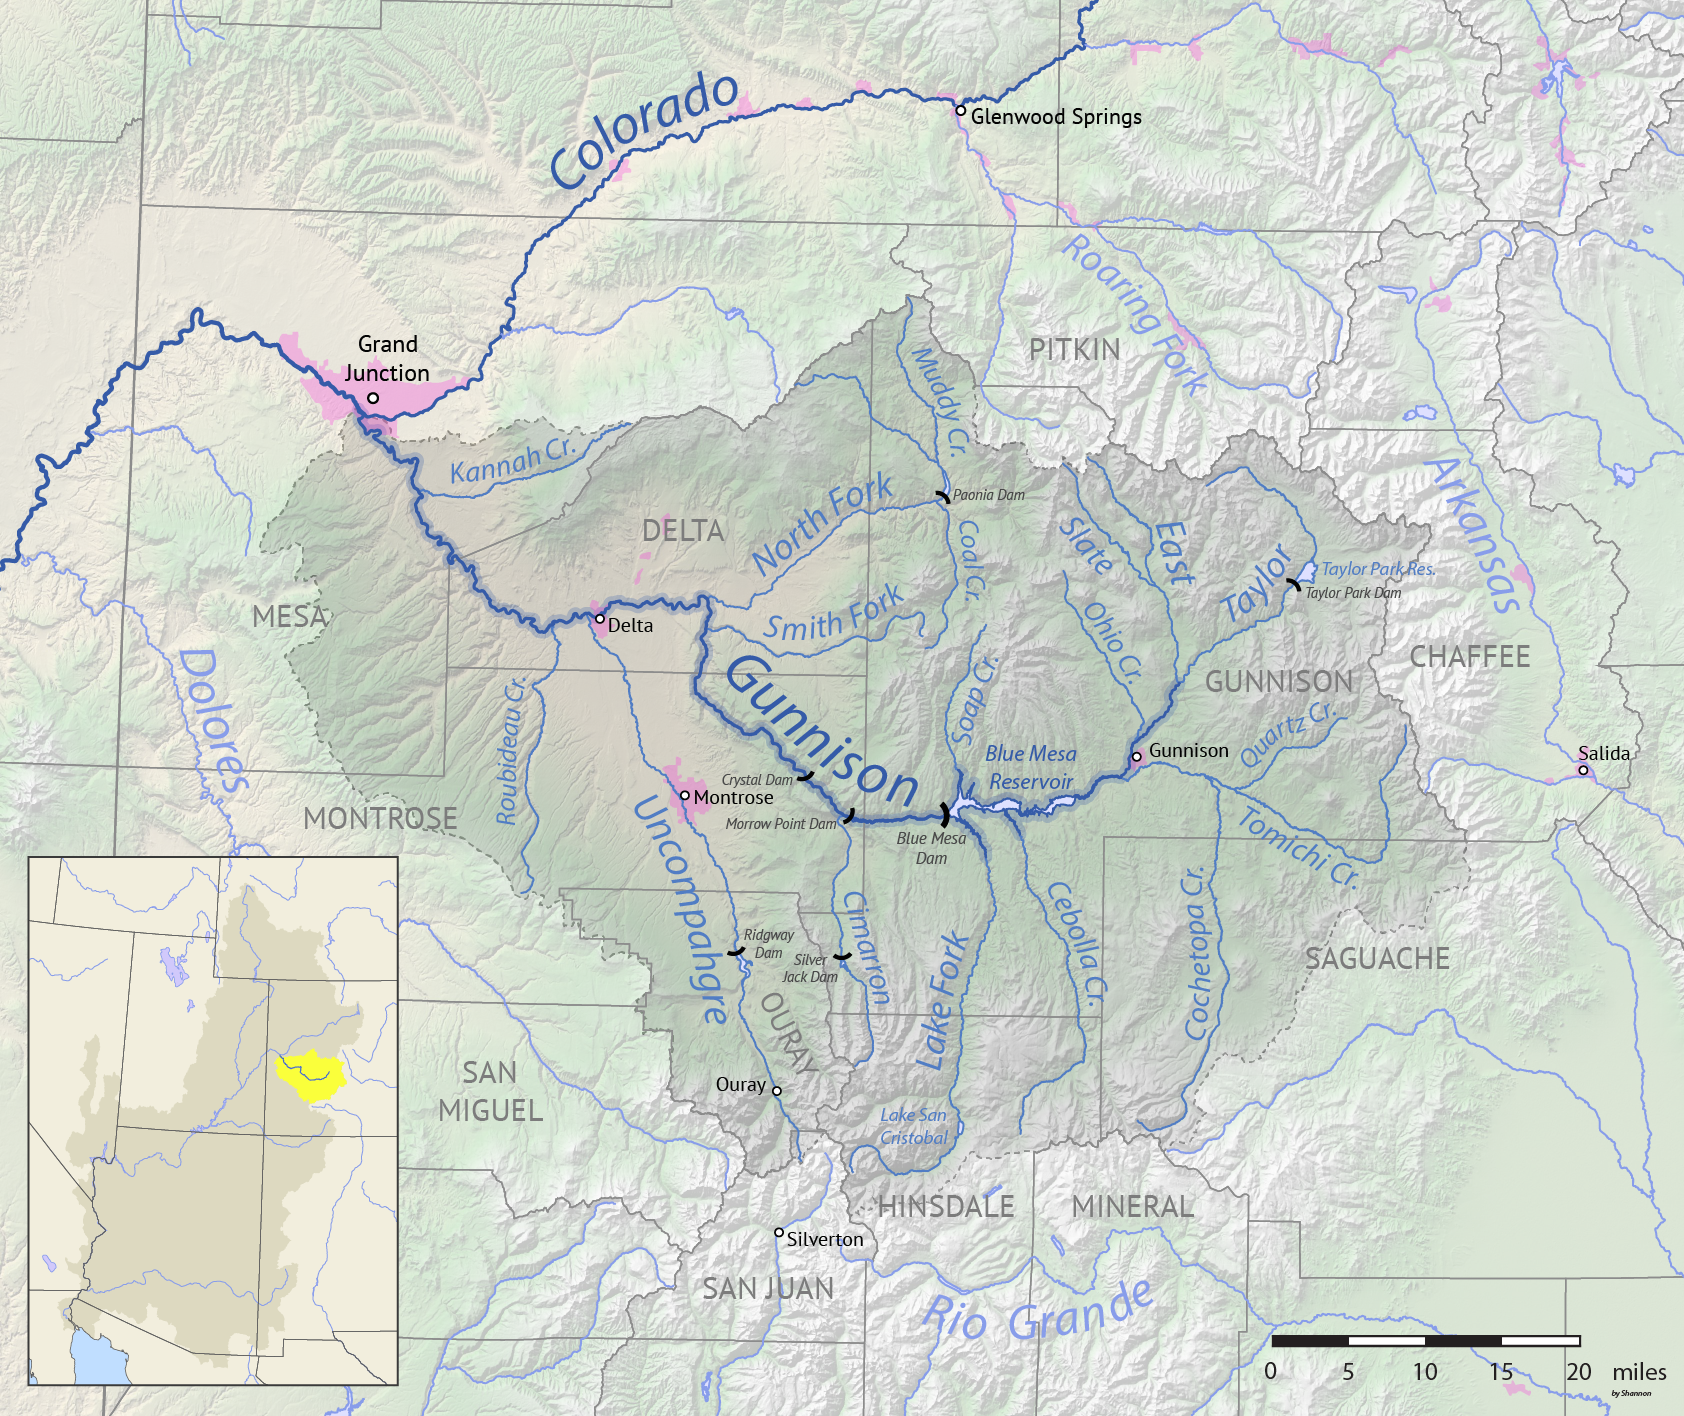

.jpg)