by Robert Marcos, photojournalist
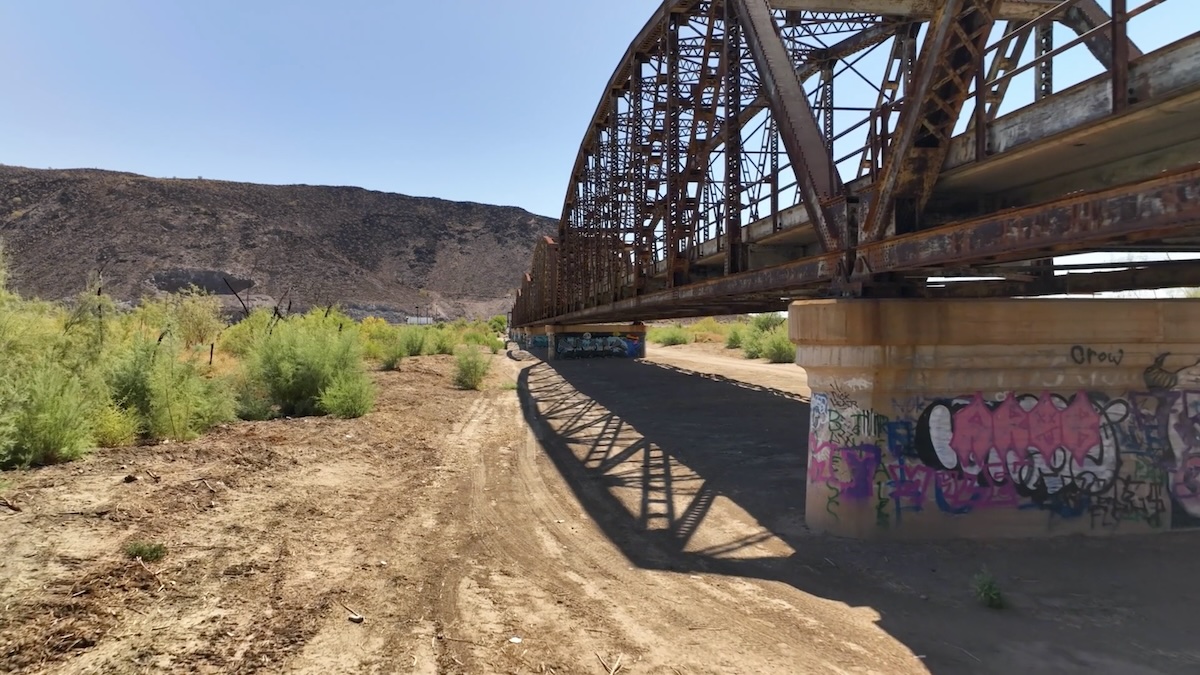
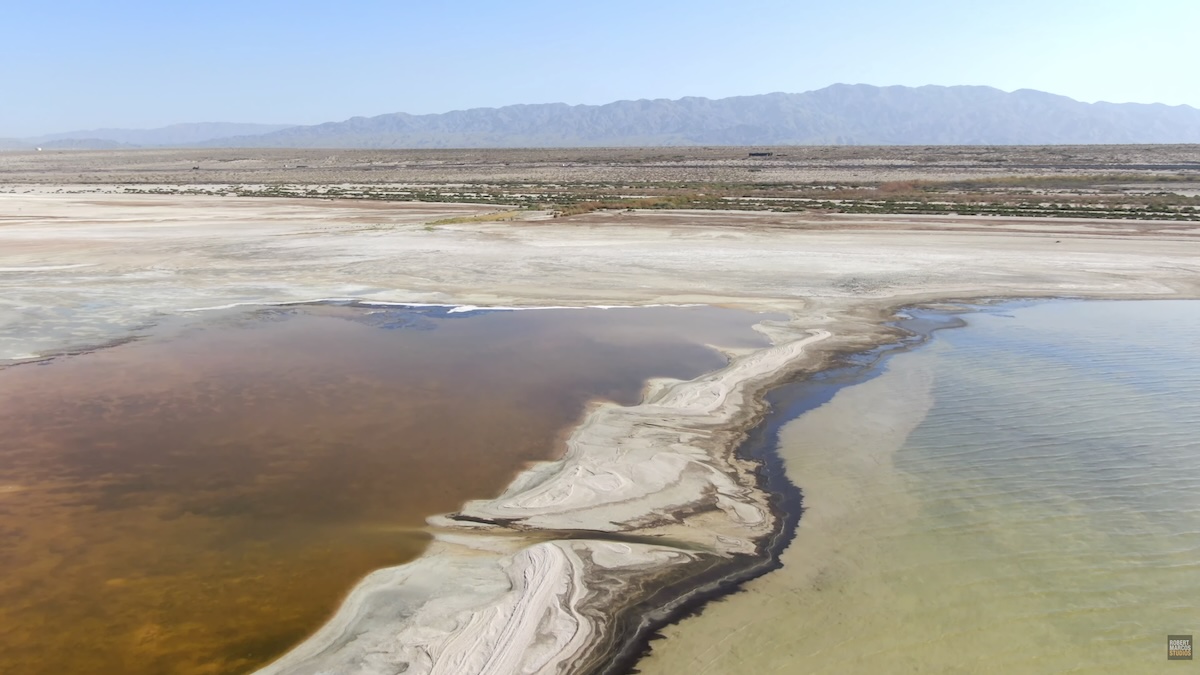
The half-million residents of Southern California’s Coachella Valley have a lot to worry about. Toxic dust storms sweeping up from the Salton Sea. Concerns about the Coachella Canal after the U.S. Geological Survey reported that sections of the canal cross over the San Andreas Fault that’s 150 years overdue for an major earthquake that the USGS says could cause surface displacement of up to eight meters. 1
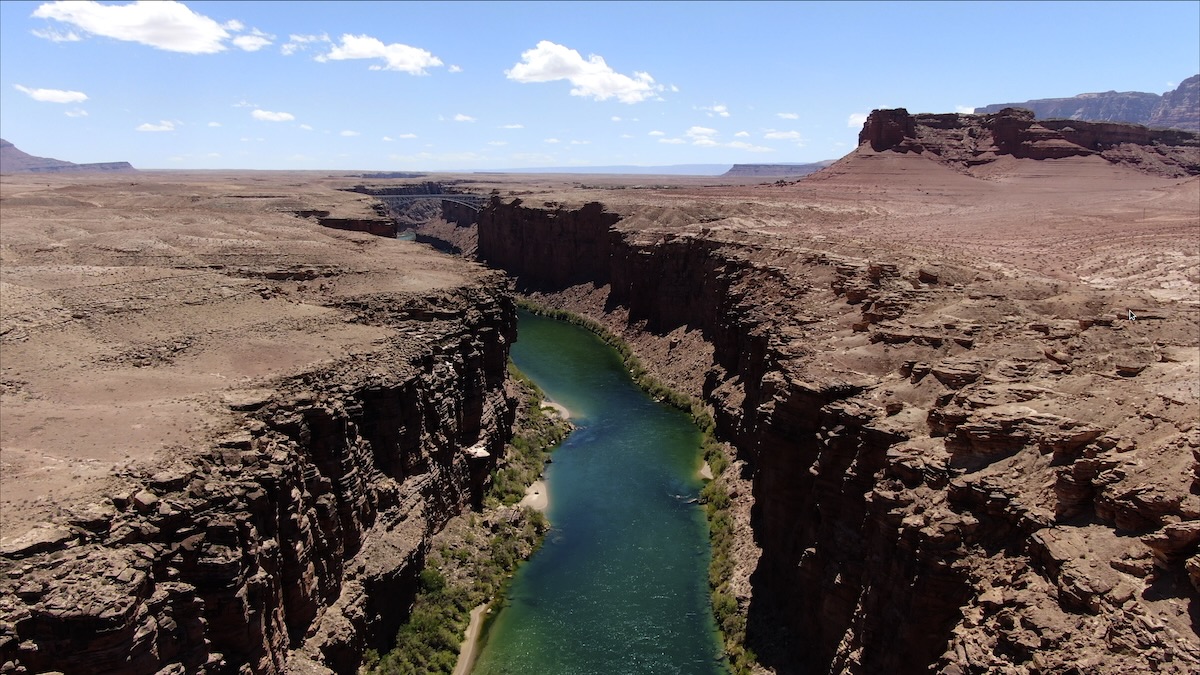
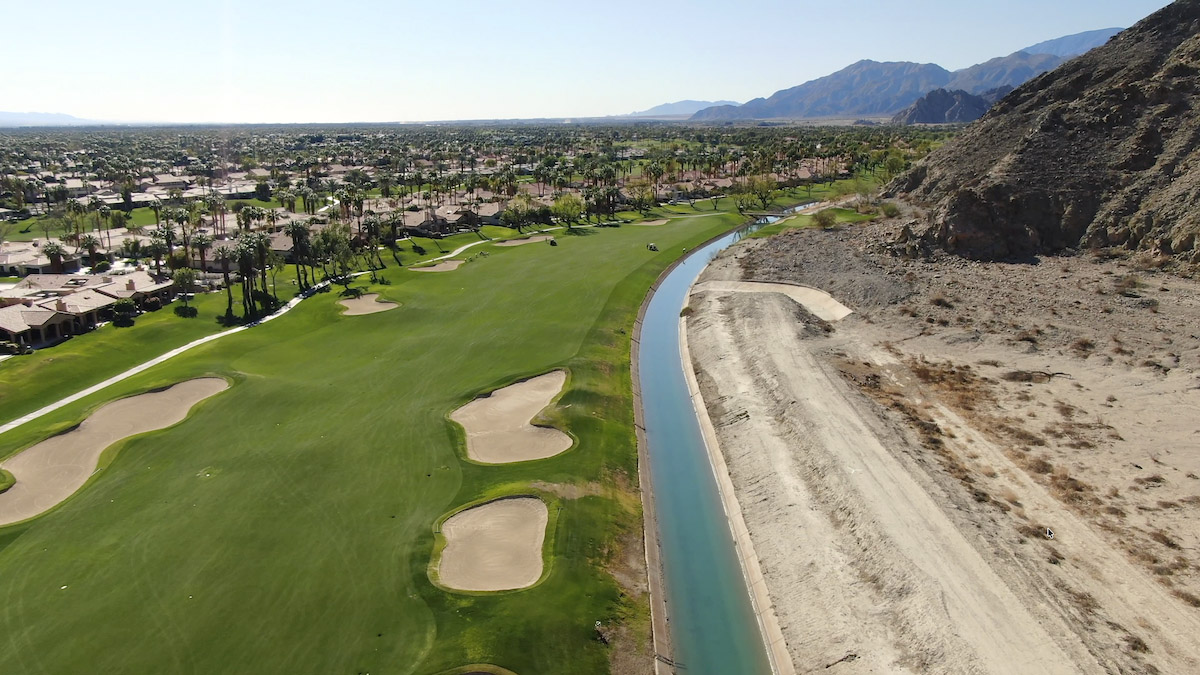
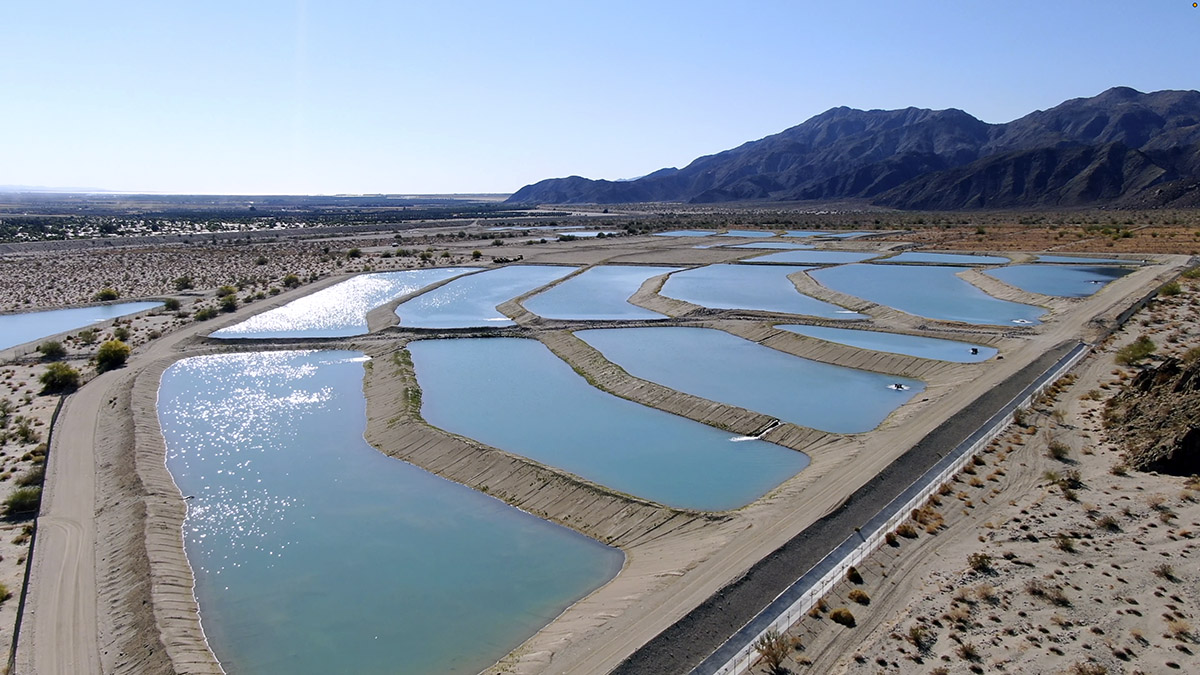
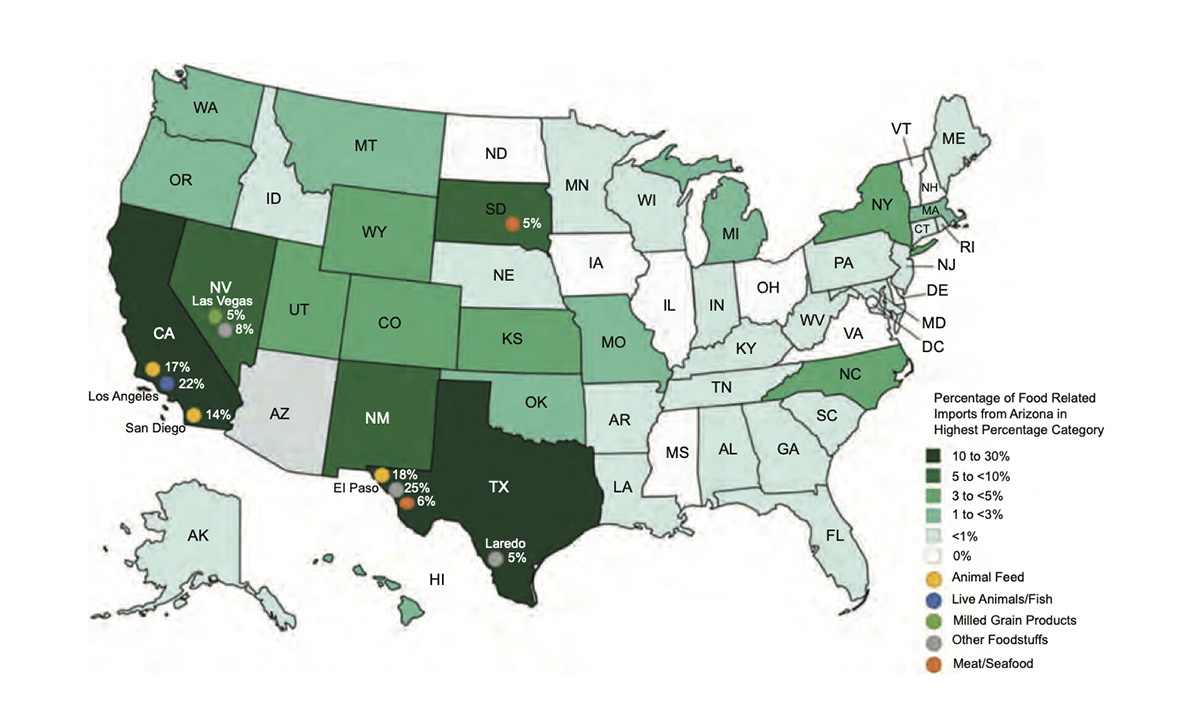
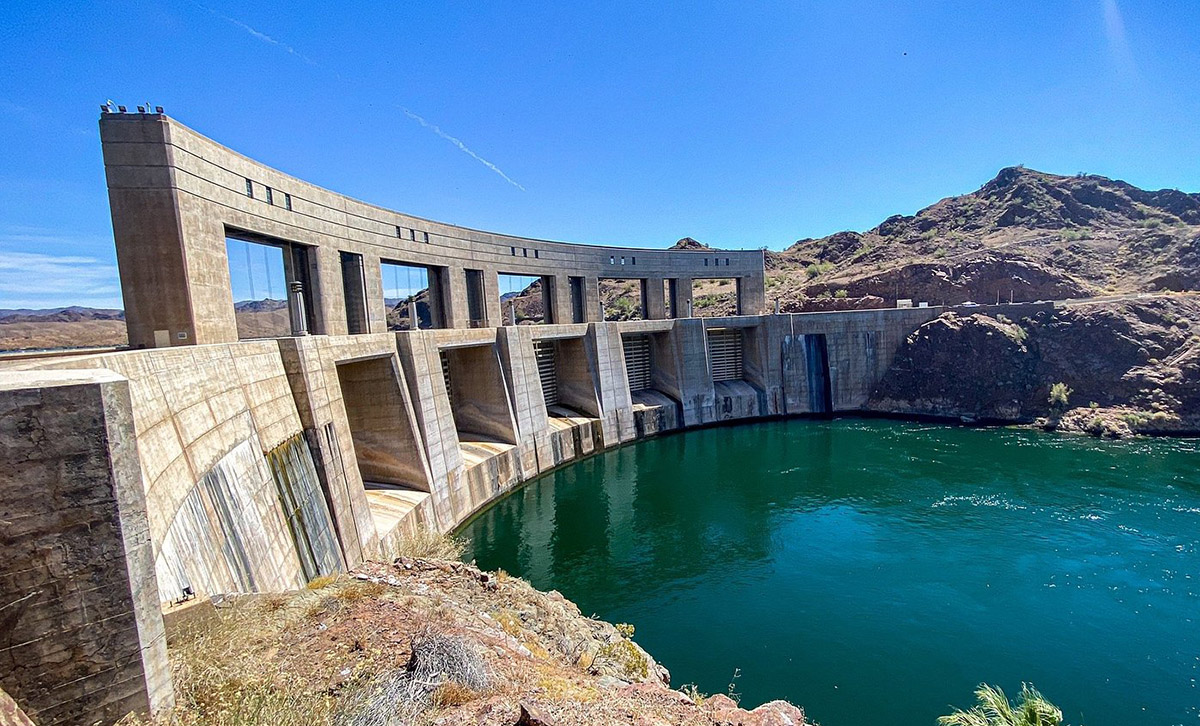
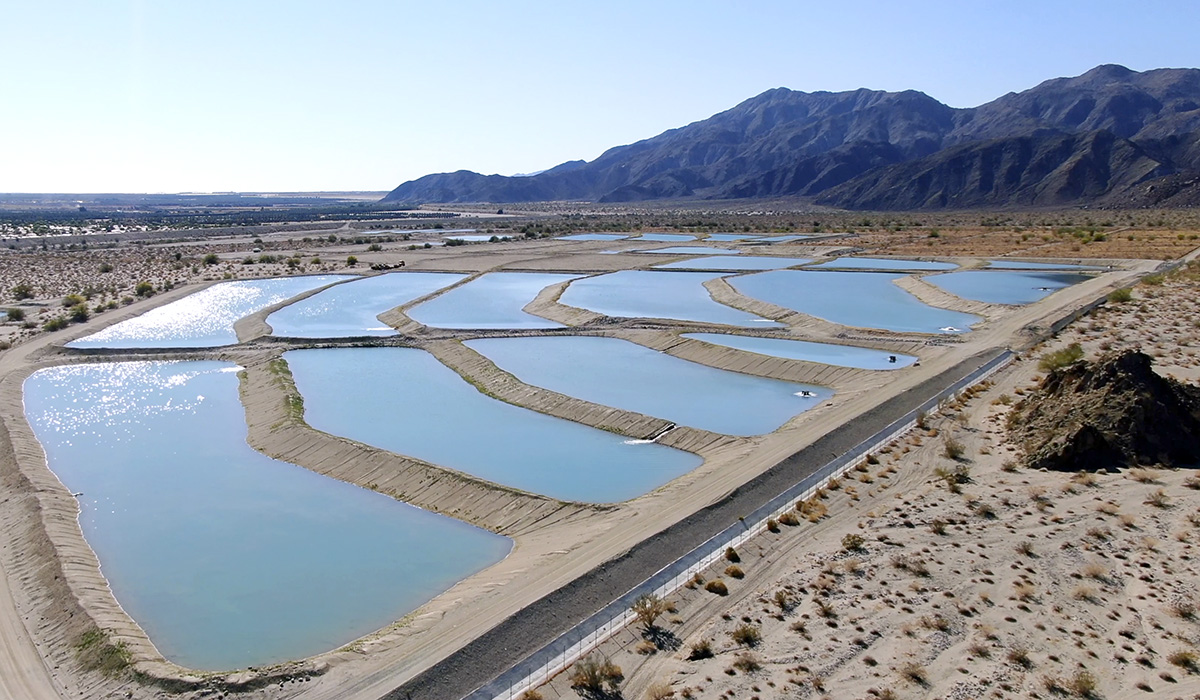
Residents also worry about the future viability of the Colorado River – which provides 430,000 acre feet of water that’s used to irrigate 76,000 acres of farmland, 120 golf courses, and to replenish the aquifer in an effort to prevent the serious subsidence issues which first appeared in 1948. And it’s this replenishing that’s causing new problems for the aquifer. 2
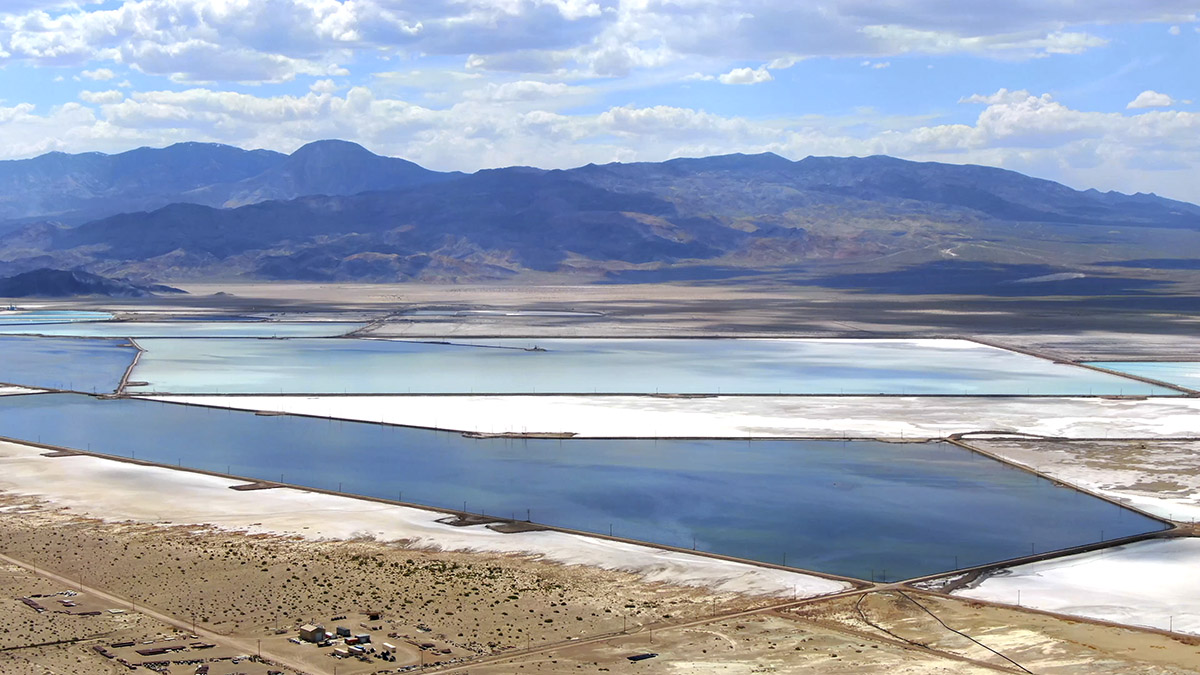
Colorado River water is both highly-oxygenated and has a high pH, (meaning it’s alkaline). When raw Colorado River water is injected into the northwestern part of the Coachella Valley’s aquifer, its oxygen chemically reacts with (naturally occurring) chromium-3 that’s bound up in the sediment. The oxygen oxidizes the chromium-3 and converts it into soluble, toxic, chromium-6. Chromium-6 has been measured at levels which exceed the maximum allowed by the State of California, at 33 of the Coachella Valley Water District’s 92 wells. 3
Meanwhile Arsenic is the problem 42 miles away on the eastern side of the aquifer. Colorado River water has a relatively high pH, due to its heavy load of dissolved carbonate minerals. When the Coachella Valley Water District uses that water to replenish the aquifer on its eastern side, the alkaline Colorado River water alters the geochemistry which triggers a chemical reaction that releases naturally occurring arsenic from the soil, and into the groundwater. 4
Tougher standards: The State of California has established tough new standards for chromium-6 in drinking water. It was formerly 50 parts per billion but the new standard is 10 parts per billion. Whereas the maximum contaminant level for arsenic has remained unchanged since 2006 at the same 10 part per billion. 5
Mitigation Efforts
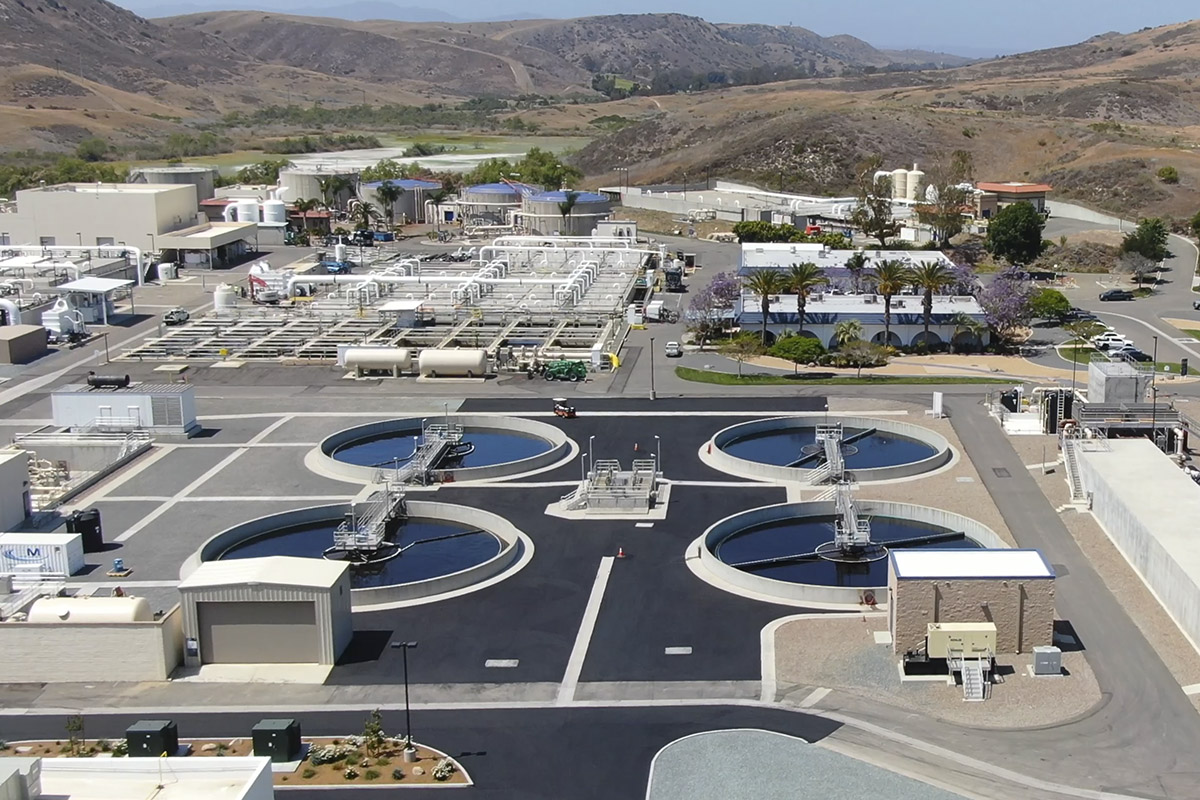
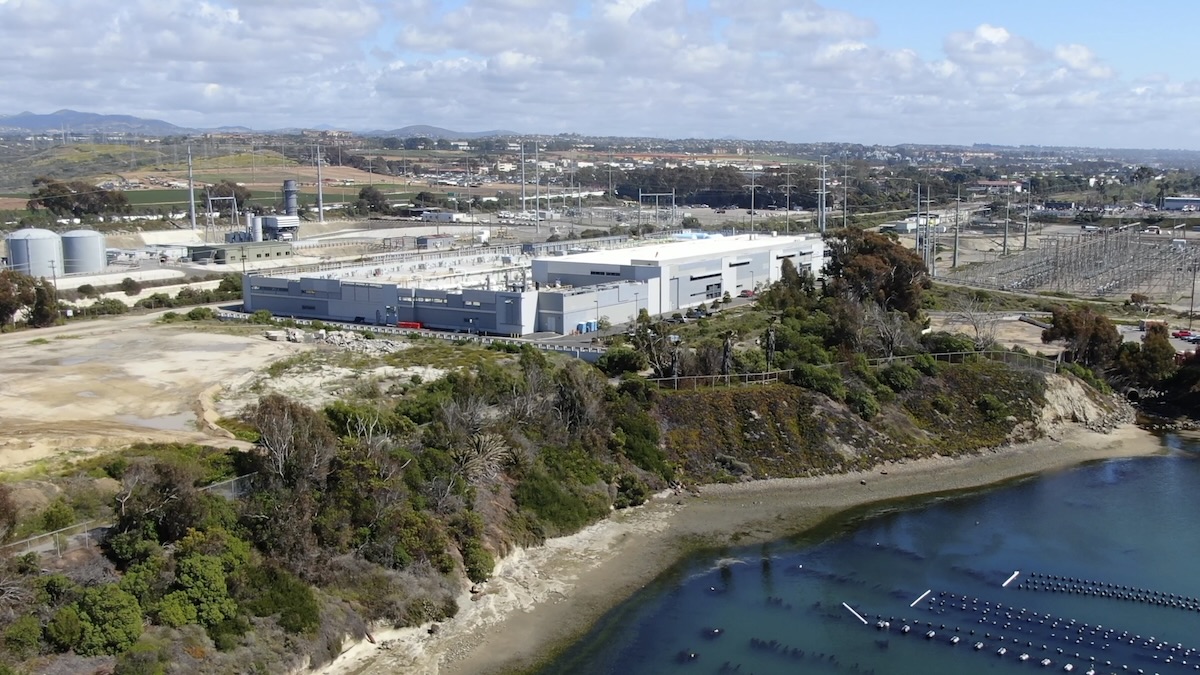
The four water agencies that manage the Coachella Valley’s groundwater – the Coachella Valley Water District, Desert Water Agency, Indio Water Authority, and Coachella Water Authority, have submitted structural compliance plans to the State Water Resources Control Board. They plan to mitigate naturally occurring chromium-6 to meet California’s strict limit through a mix of infrastructure overhauls, advanced filtration, and operational adjustments. Because California’s mandate depends on the size of the water system, these agencies are working against a rolling compliance deadline spanning from October 2026 through October 2027. 6
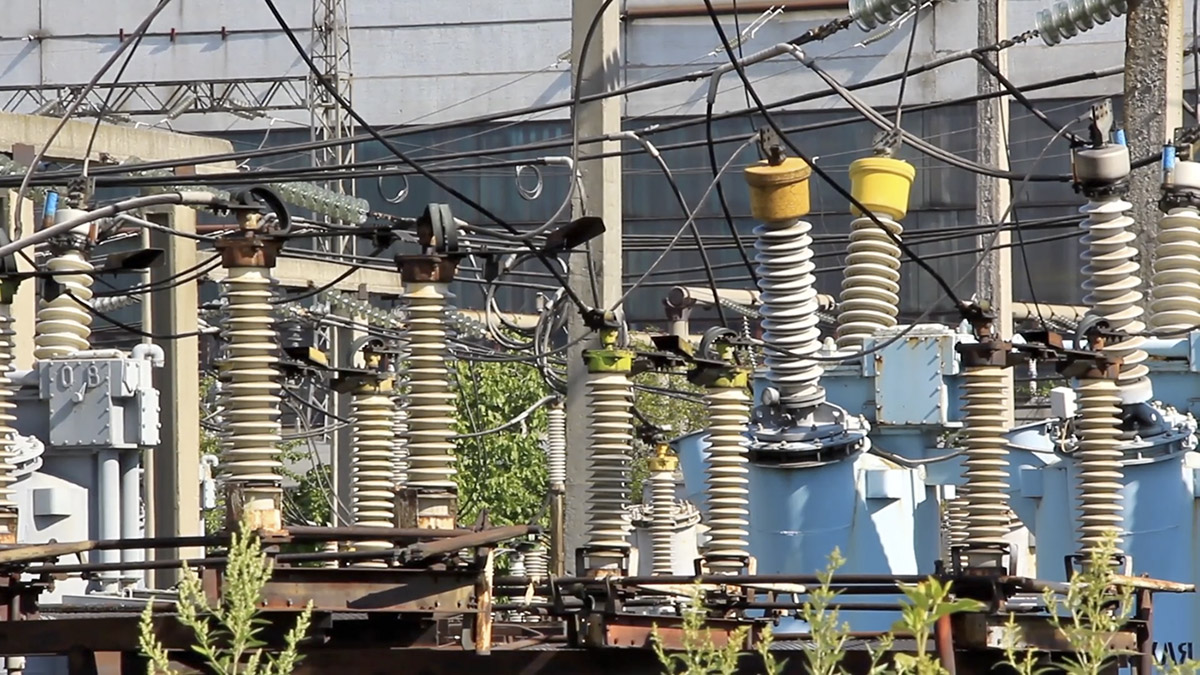
Advanced Water Treatment Infrastructure
- Ion-Exchange Technology: Agencies like the Indio Water Authority (IWA) are expanding the use of strong base anion exchange systems. These systems route groundwater through tanks filled with resin beads that magnetically trap and remove chromium-6 molecules.7
- Reduction Coagulation Filtration (RCF): The IWA has also piloted RCF treatment, which chemically alters the chromium-6 into a harmless, filterable solid form before water enters the distribution grid. 8
Well Offline Management and Decommissioning
• Taking Impacted Wells Offline: The largest provider, Coachella Valley Water District (CVWD), has identified 34 out of its 96 drinking water wells that exceed the 10 ppb threshold. Impacted wells across the valley are being selectively pulled from service or restricted during off-peak seasons to prevent contaminated groundwater from mixing into municipal supplies. 9
Drilling New Deep-Water Wells
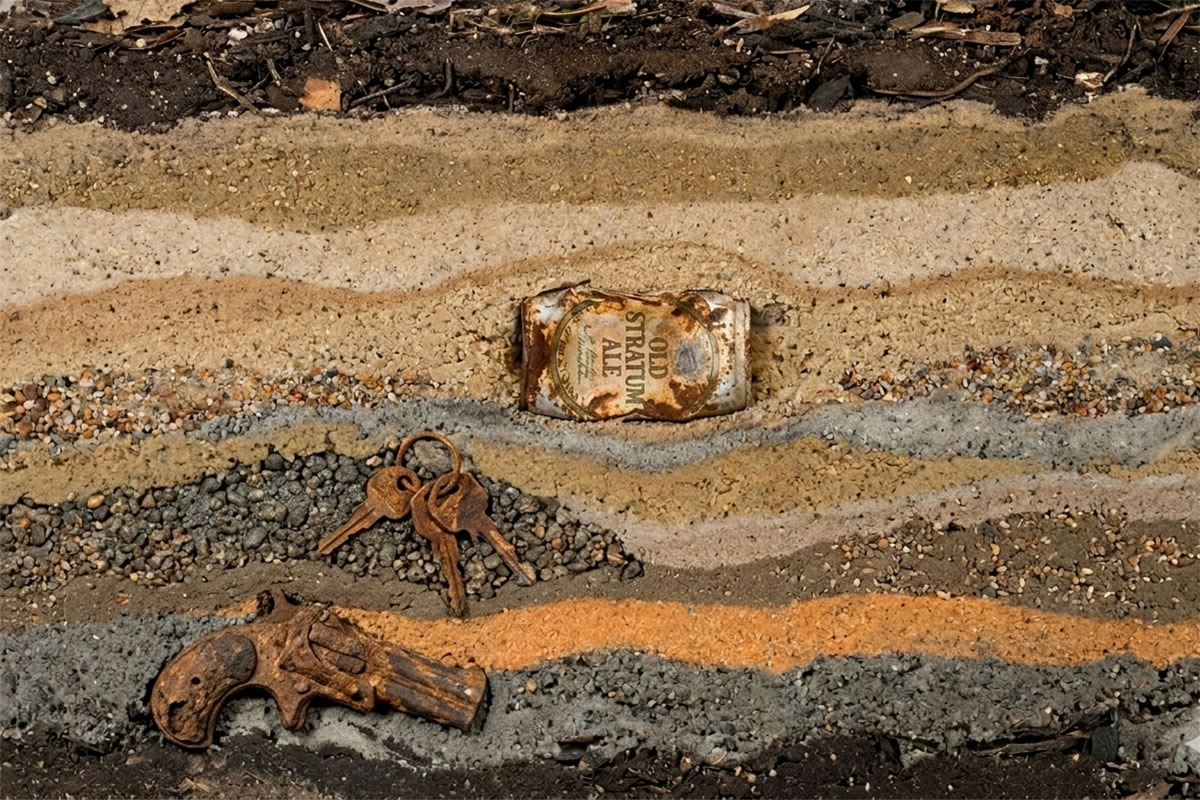
- Bypassing the Contaminated Strata: Chromium-6 in the Indio Subbasin is entirely naturally occurring, leaching out of specific geological rock layers and sediment over centuries. Water districts plan to construct new, deeper wells that tap into lower layers of the aquifer where chromium-6 levels are safely below the state limit. 10
Well Clustering and Pipeline Blending
- Dilution and Interconnection: Agencies are designing “well-clustering” projects. This technique involves building miles of new connecting pipelines to merge water from higher-chromium wells with water from pristine wells. Blending the water dilutes the total chromium-6 footprint down to legally compliant levels before it reaches household taps. 11