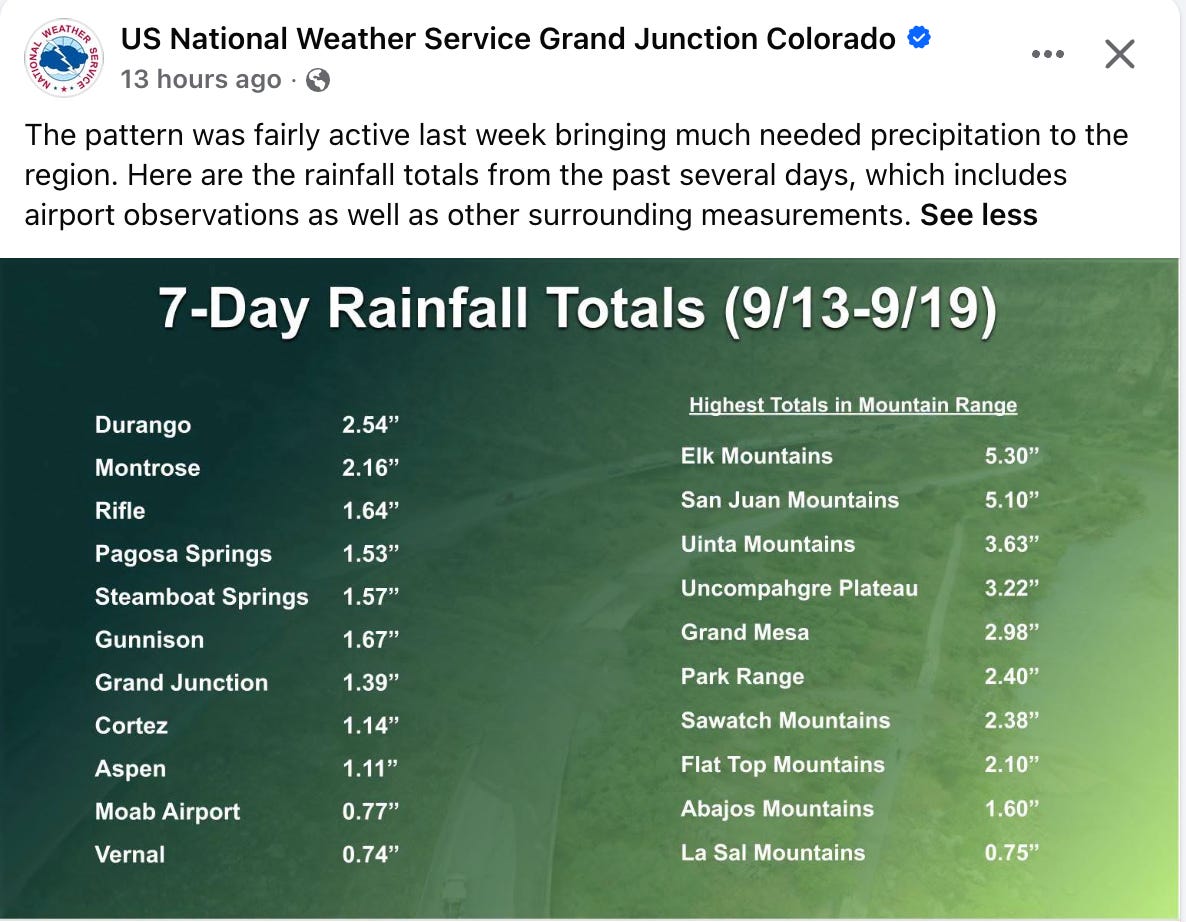
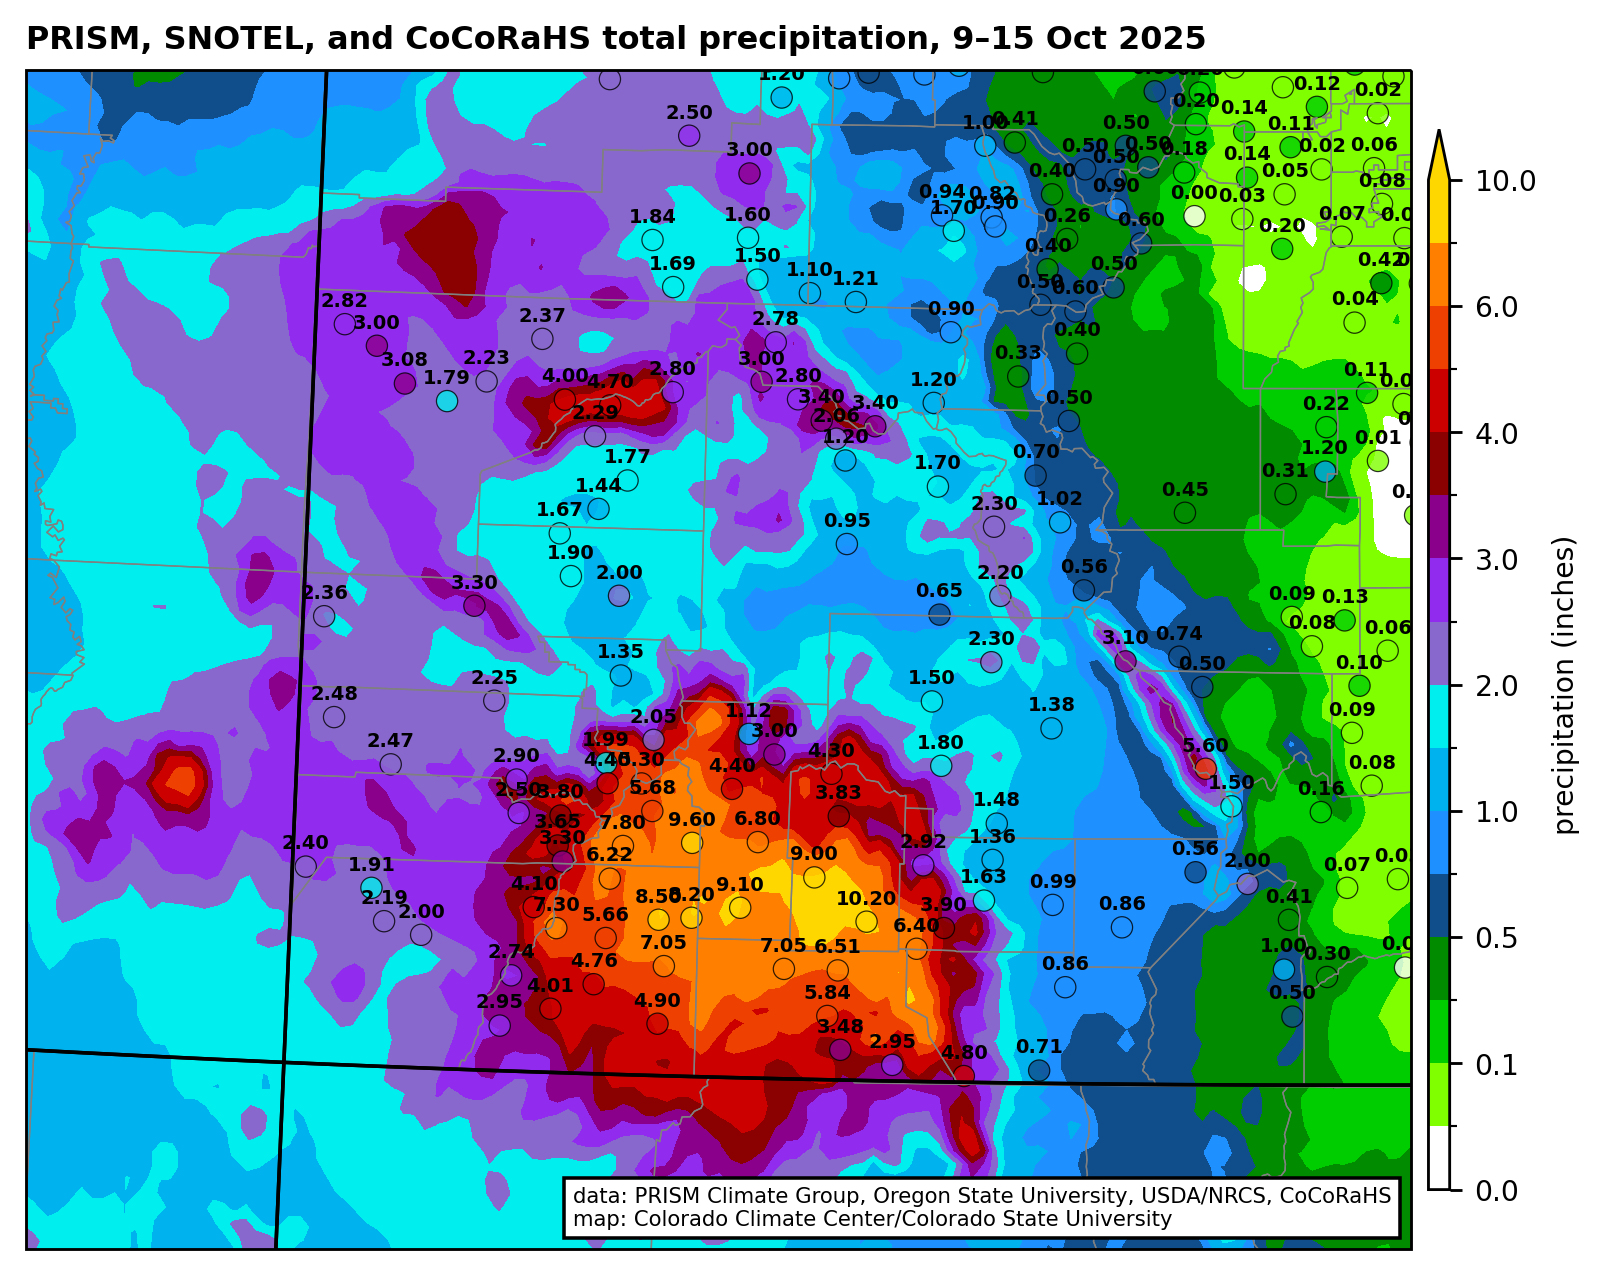
“Much of the area reported the wettest September on record,” said David Byers, a meteorologist at the National Weather Service office in Grand Junction.
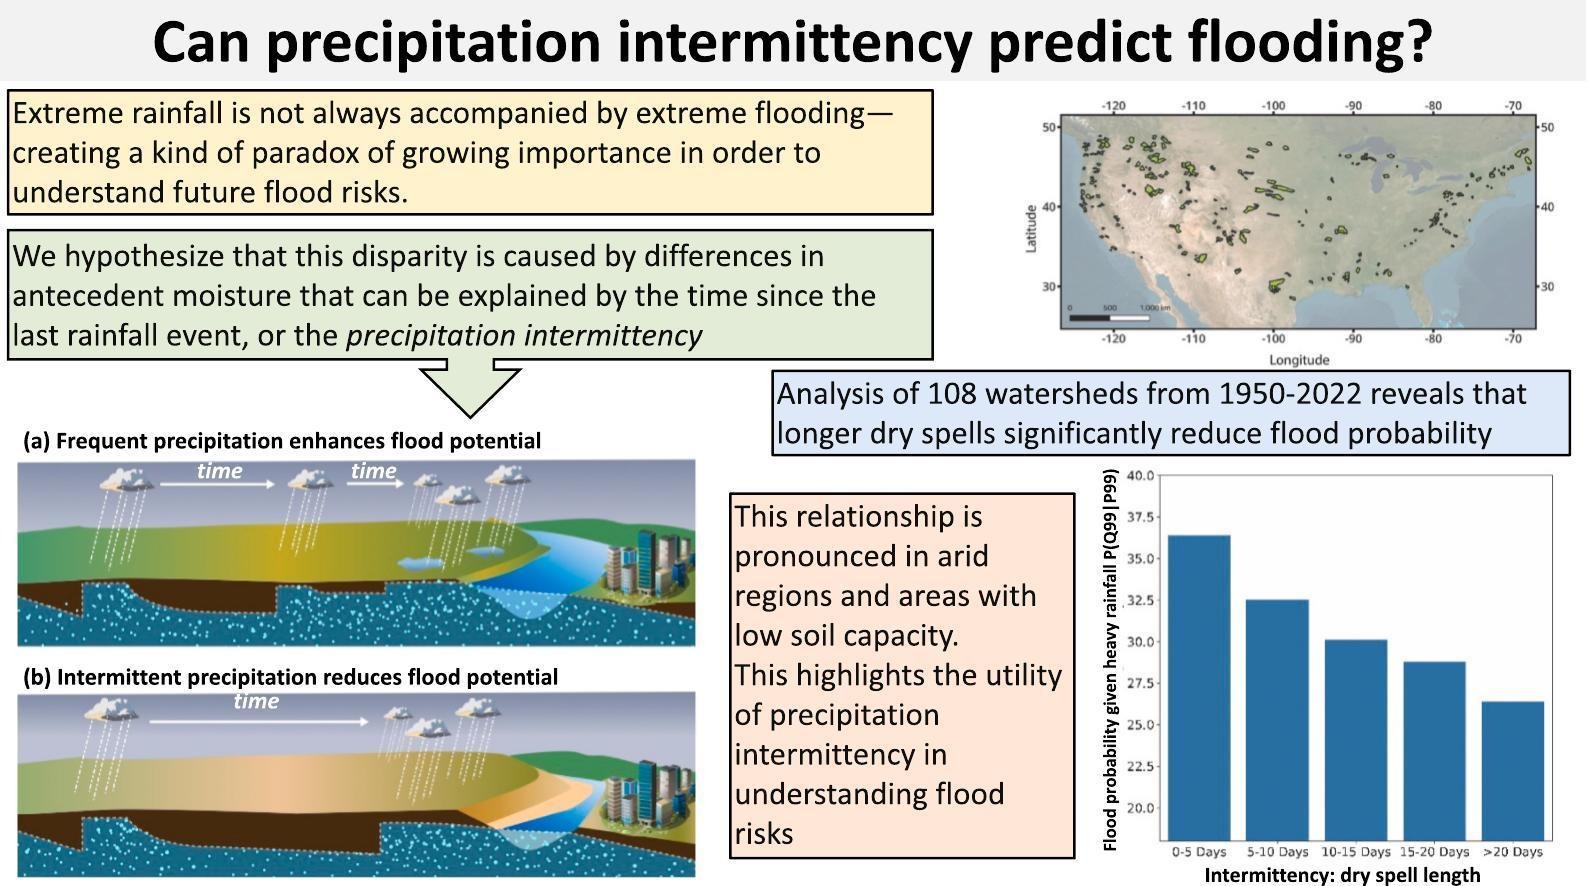
The late-September rainstorms delivered steady precipitation over several days, and Southwest Colorado reported no flash floods, he said. The NWS was particularly concerned about the Gold Mountain burn scar near Ouray because many homes are in the area. Because the rain came in steadily over time, no flash floods were recorded, he said…
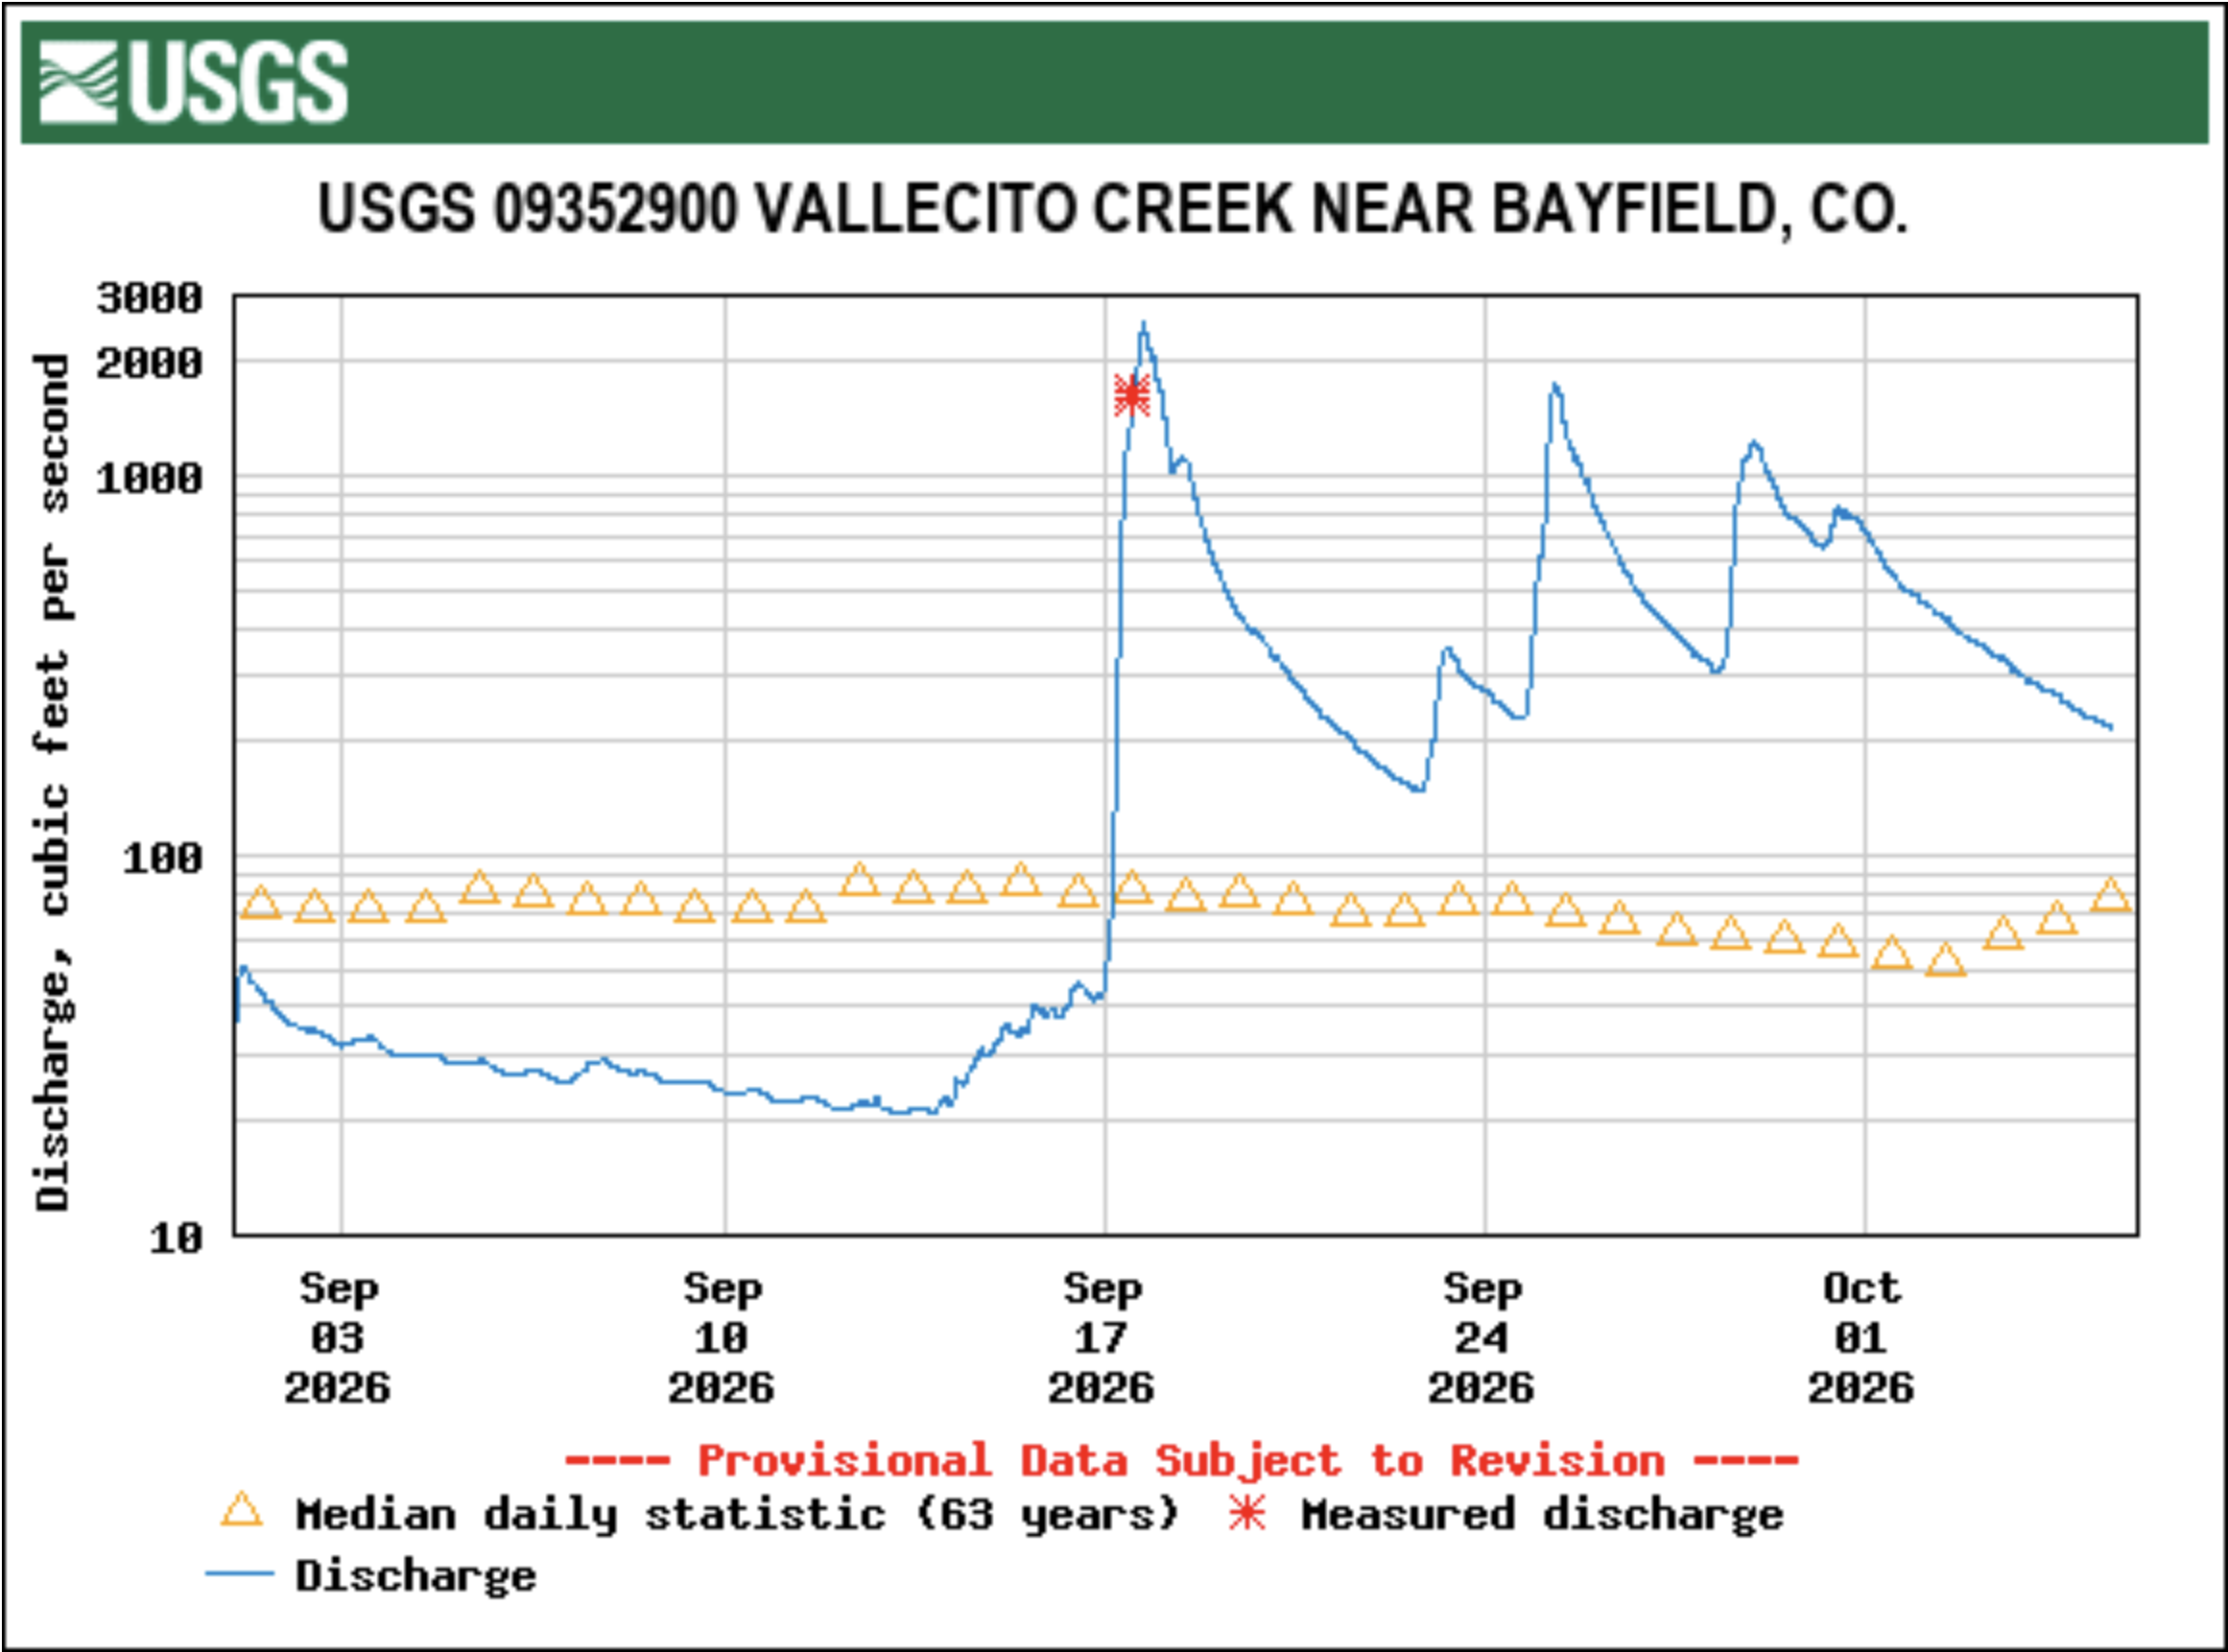
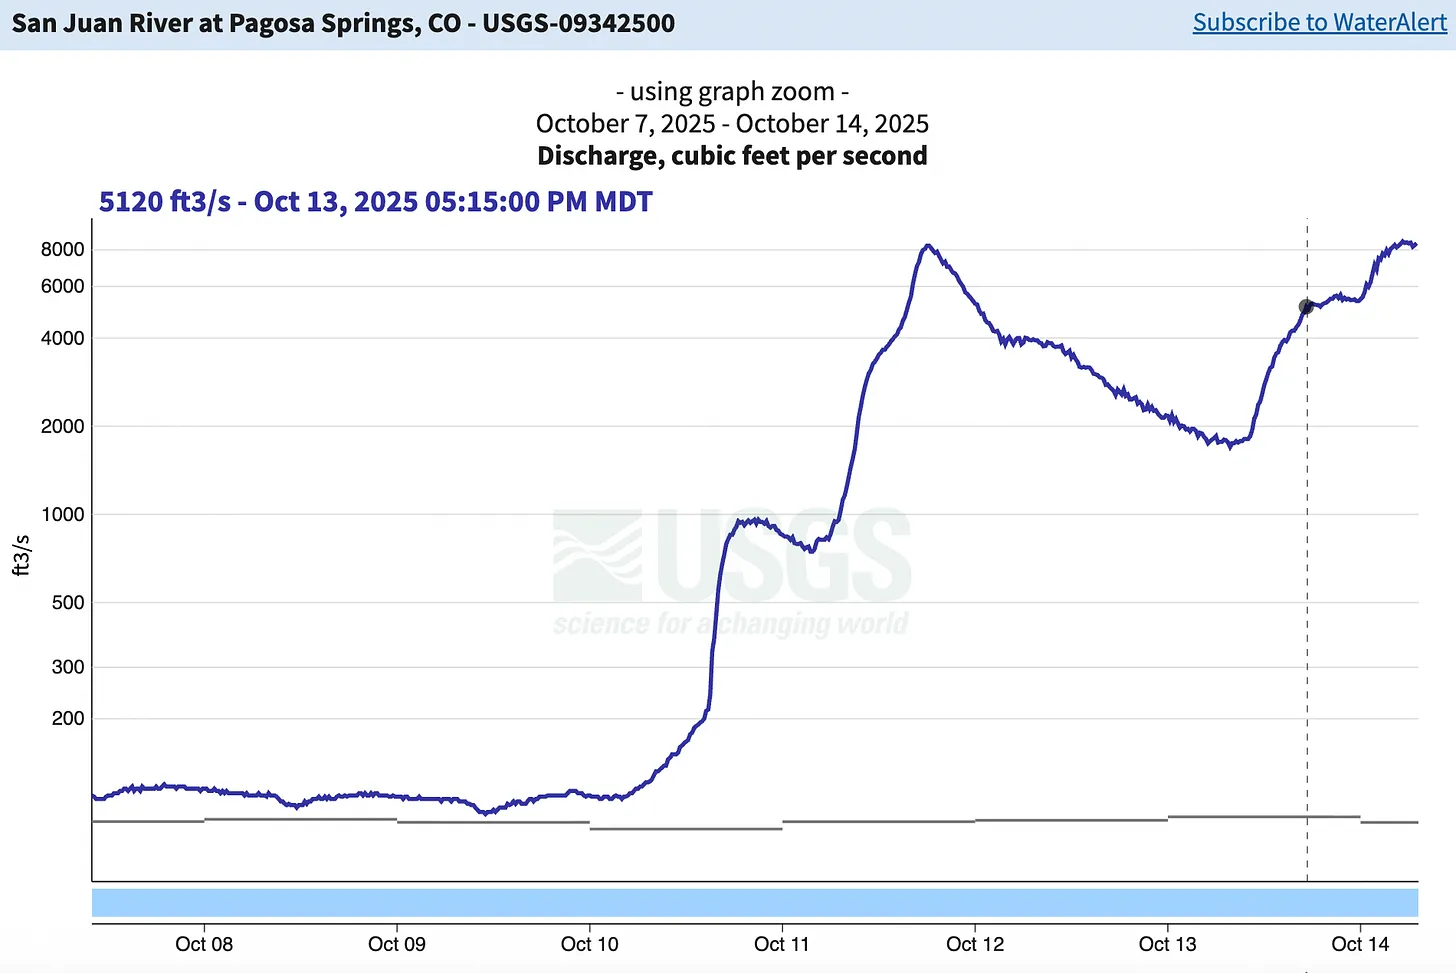
Durango-La Plata County Airport recorded rainfall totals of about 3.2 inches of rain from the late September storms, Byers said. In the mountains above 12,000 feet, that rain became snow. Vallecito Reservoir rose about 18 feet, or about 30,000 acre-feet, from this fall’s moisture. Although water levels have increased significantly, a decent winter is still important for the reservoir, said David Hofmann, superintendent of the Pine River Irrigation District…The water discharge of the Animas River, measured in cubic feet per second, went from about 230 cfs on Sept. 1 to a high of a little over 2,400 cfs on Tuesday after the storms. Vallecito Creek went from about 45 cfs on Sept. 1 to a peak of about 2,500 cfs on Sept. 17, according to USGS continuous data.
Welcome to another edition of the Land Desk’s NEWSWIRE, and yet another one in which the big news is the big, end-of-the-water-year rain. Yes, 88% of the Western U.S. is currently experiencing some level of drought — with the most severe impacts in the Four Corners Country. Yet these same areas have also been barraged with rain and inundated with flood watches and warnings for the last few weeks, and yet another big doozy is on its way.
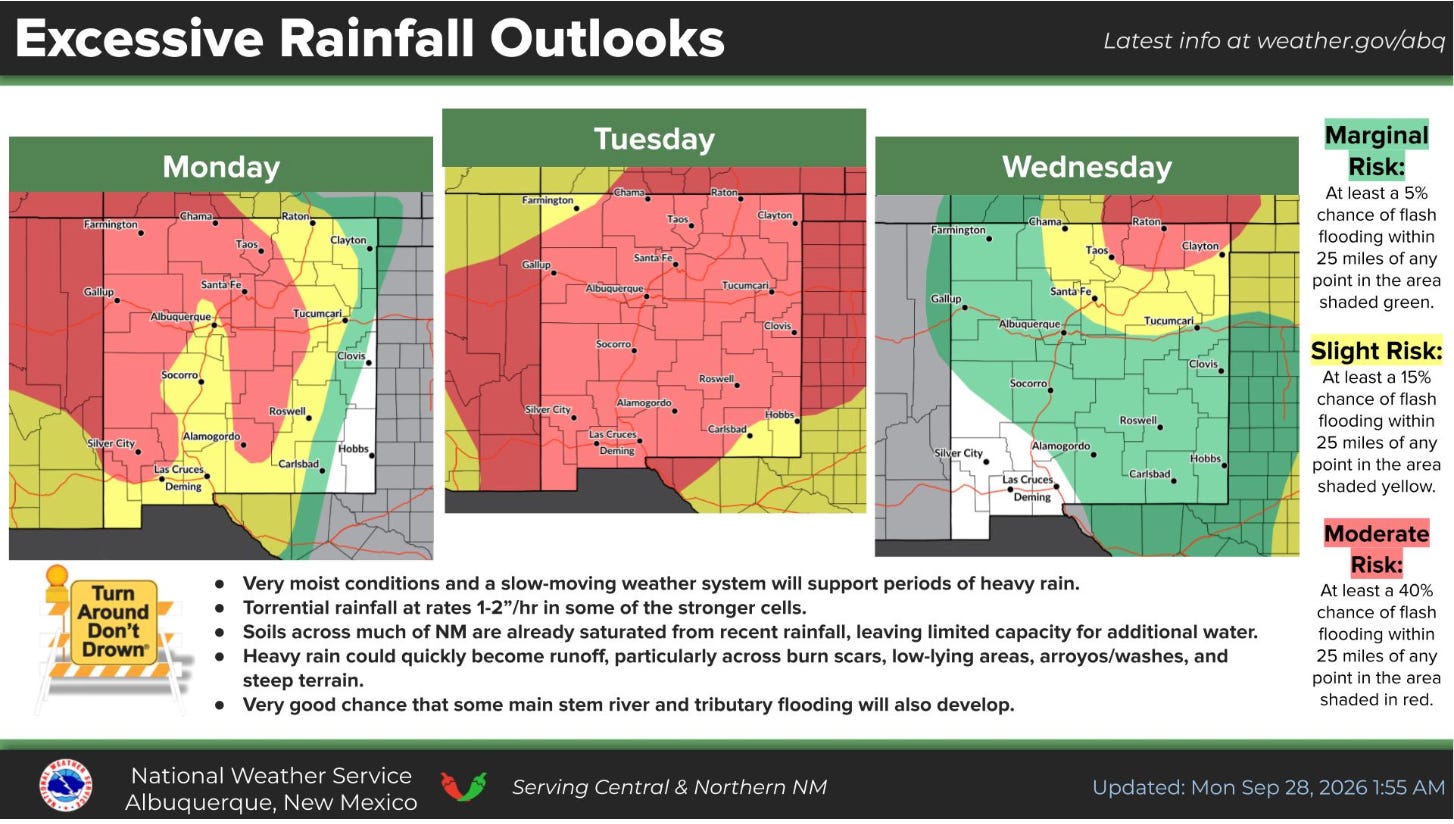
As of Monday morning (9/28), all of New Mexico, most of Arizona, and southern Utah and southern Colorado were all under a flood watch in effect through Wednesday morning. The National Weather Service is warning that rainfall rates in some places could be up to one to two inches per hour.
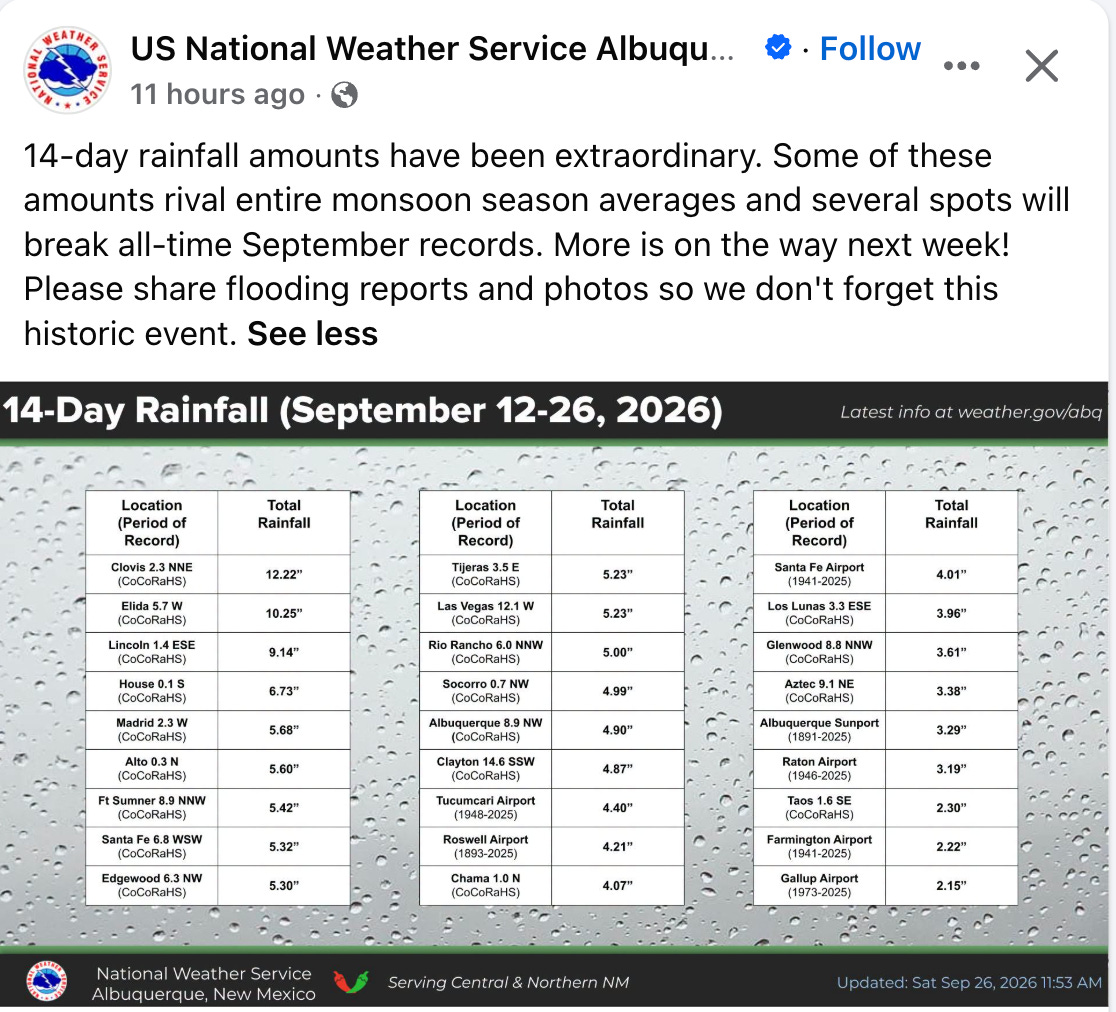
The latest round of storms will hit already sodden ground in places that have received more rain in the last couple of weeks than they normally do during the entire monsoon season.
🌵 PUBLIC LANDS 🌲
The Trump administration is reportedly considering Major League Baseball’s request to build a stadium and host a game in Grand Teton National Park, but a White House spokesperson says it is not an administration priority. (WyoFile) [Note: MLB has backed off this proposal since Jonathan published on the 28th.]
Western Watersheds Project and Basin and Range Watch formally protest the proposed 300-megawatt Bonanza solar-plus-storage project on 5,133 acres of public land in southern Nevada, saying it would fragment desert tortoise habitat and degrade vegetation and soils the tortoise depends on. (news release, BLM project page)
A Western journalist details the ways Interior Secretary Doug Burgum has disappointed conservationists and all Americans by “pulverizing environmental safeguards, leaving America’s public lands vulnerable for corporations to plunder at will.” (High Country News)
The Bureau of Land Management begins an aerial herbicide campaign on about 3,800 acres of public land in Sandoval and Cibola counties in New Mexico that will distribute Tebuthiron pellets in an effort to “enhance native plant diversity by reducing dense stands of sagebrush, juniper trees, and rabbitbrush.” (BLM news release)
The Bureau of Land Management greenlights the Indian Creek “watershed restoration” project that will include clearing piñon-juniper forest via chaining, mastication, and other methods on about 561,000 acres of public land in southwestern Utah. (news release)
The U.S. Forest Service seeks public input until Oct. 9 on its proposal to turn management of the Maroon Bells Scenic Area over to Pitkin County amid funding shortfalls. (news release, CBS News)
🌨️🦦🚣🏽 WATER WATCH 🌊
Washington County, Utah, plans to construct a wastewater treatment-recycling plant demonstration facility to help educate residents on water recycling and get them past the “ick factor” associated with “toilet-to-tap” facilities. (Salt Lake Tribune)
👩🏽🔬 SCIENCE! 🧫
University of California, Davis, researchers find orange water released by thawing permafrost into Alaska rivers can be more acidic and contain higher concentrations of metals than acid mine drainage. (news release)
⛏️ MINING MONITOR ⛏️
A federal study finds a major tailings spill at the proposed Donlin Gold mine in the Kuskokwim River watershed of southwest Alaska would inundate thousands of acres of land and portions of a village in the Crooked Creek drainage, alter stream channels, cause long-term harm to aquatic and terrestrial wildlife, and result in downstream heavy metal contamination that could last for over a century. (Mining, Draft Supplemental EIS)
Ivanhoe Electric relinquishes 642 unpatented mining claims covering 13,264 acres in the Gila National Forest in New Mexico where it planned to explore for copper following widespread local opposition. (news release)
Scene from the 2024 White Mesa rally and spiritual walk. Jonathan P. Thompson photo.
The White Mesa Concerned Community and Ute Mountain Ute Tribe will hold their annual rally and spiritual walk to protest the White Mesa uranium mill in southeastern Utah on Oct. 17 at 11 a.m. at the White Mesa Community Center. (Grand Canyon Trust)
🛢️ FOSSIL FUEL FOLLIES 📈
Screenshot from the Protect Navajo Air map.
Earthworks’ Protect Navajo Air campaign develops an interactive map showing oil and gas facilities’ proximity to schools and health care facilities and related air and water polluting incidents in the San Juan Basin in northwestern New Mexico. (Protect Navajo Air)
An energy economics firm urges the Rural Utah Infrastructure Coalition not to invest as much as $54 million in two proposed coal export terminals on the West Coast, saying they are too risky and may not open Utah coal to foreign markets. (Institute for Energy Economics and Financial Analysis)
🔥 WILDFIRE LOOKOUT 🔥
San Juan County, Utah, drops charges against a former resident and journalist accused of sparking the 2025 Deer Creek Fire near La Sal after flaws in the state’s investigation are revealed and amid questions about the county’s political motivations. (Salt Lake Tribune)
🤑 GENTRIFICATION JOURNAL 💰
An analysis of IRS data finds Teton County, Wyoming, was again the nation’s richest county in 2023 — with a per-capita income of $313,373 — followed distantly by Pitkin County, Colorado, and Blaine County, Idaho; yet even as residents became wealthier, they became less charitably inclined. (CoThrive)
🔋 THE GRID⚡️
The U.S. Energy Department awards Xcel Energy two $250 million grants for high-voltage transmission projects in southeastern Colorado designed to expand connections between the Western and Eastern power grids and bring wind power from the Great Plains to Colorado’s Front Range. (Big Pivots)
Weld County, Colorado’s commissioners vote to approve Enyo Energy’s 805-megawatt Chalk Bluff wind and solar-plus-storage project on mostly private land in the oil and gas-rich northeastern corner of the state. (Colorado Sun)
The Federal Energy Regulatory Commission pauses its licensing process for rPlus Hydro’s proposed pumped hydropower storage project at Seminoe Reservoir in Wyoming to allow the Bureau of Land Management to complete an environmental review of the contested project. (WyoFile)
Phoenix-area utility Salt River Project’s board votes to approve the proposed Marigold Energy Center in Stanfield, Arizona. The project will include 600 MW of solar, 400 MW of battery storage, and 675 MW of natural gas generation, along with a new substation and four miles of transmission lines, in an effort to meet growing demand and enhance grid reliability. (news release)
Nevada utility NV Energy becomes the ninth Western entity to join the California Independent System Operator’s extended day-ahead wholesale electricity market that will help integrate the balkanized Western grid. (Public Power)
OTHER NEWS
The National Congress of American Indians files an amicus brief in Tohono O’odham Nation v. Mullin challenging the Trump administration’s plan to build a border wall through the Tohono O’odham nation in southern Arizona, calling it an “unlawful infringement on tribal sovereignty.” (news release)
🥵 ARIDIFICATION WATCH 🐫
New Mexico farmers say this summer’s extreme heat stunted green chile crops’ growth, leading to a roasting-season shortage in many parts of the state, adding that a “Biblical” grasshopper infestation also curtailed yield. (KRQE)
🤖 DATA CENTER DIGEST 👾
Nevada-based Arevia Power proposes a “multi-building” data center on about 3,700 acres of federal public land near Boise, Idaho; the Bureau of Land Management says the agency is in the “pre-planning phase” and has released few details. (Idaho Statesman)
🐟 COLORADO RIVER CHRONICLE 💧
Colorado River watcher Ken Neubecker speculates about how a Lower Basin compact call might play out in Colorado. (Ken’s Substack)
📸 PARTING SHOT 🎞️
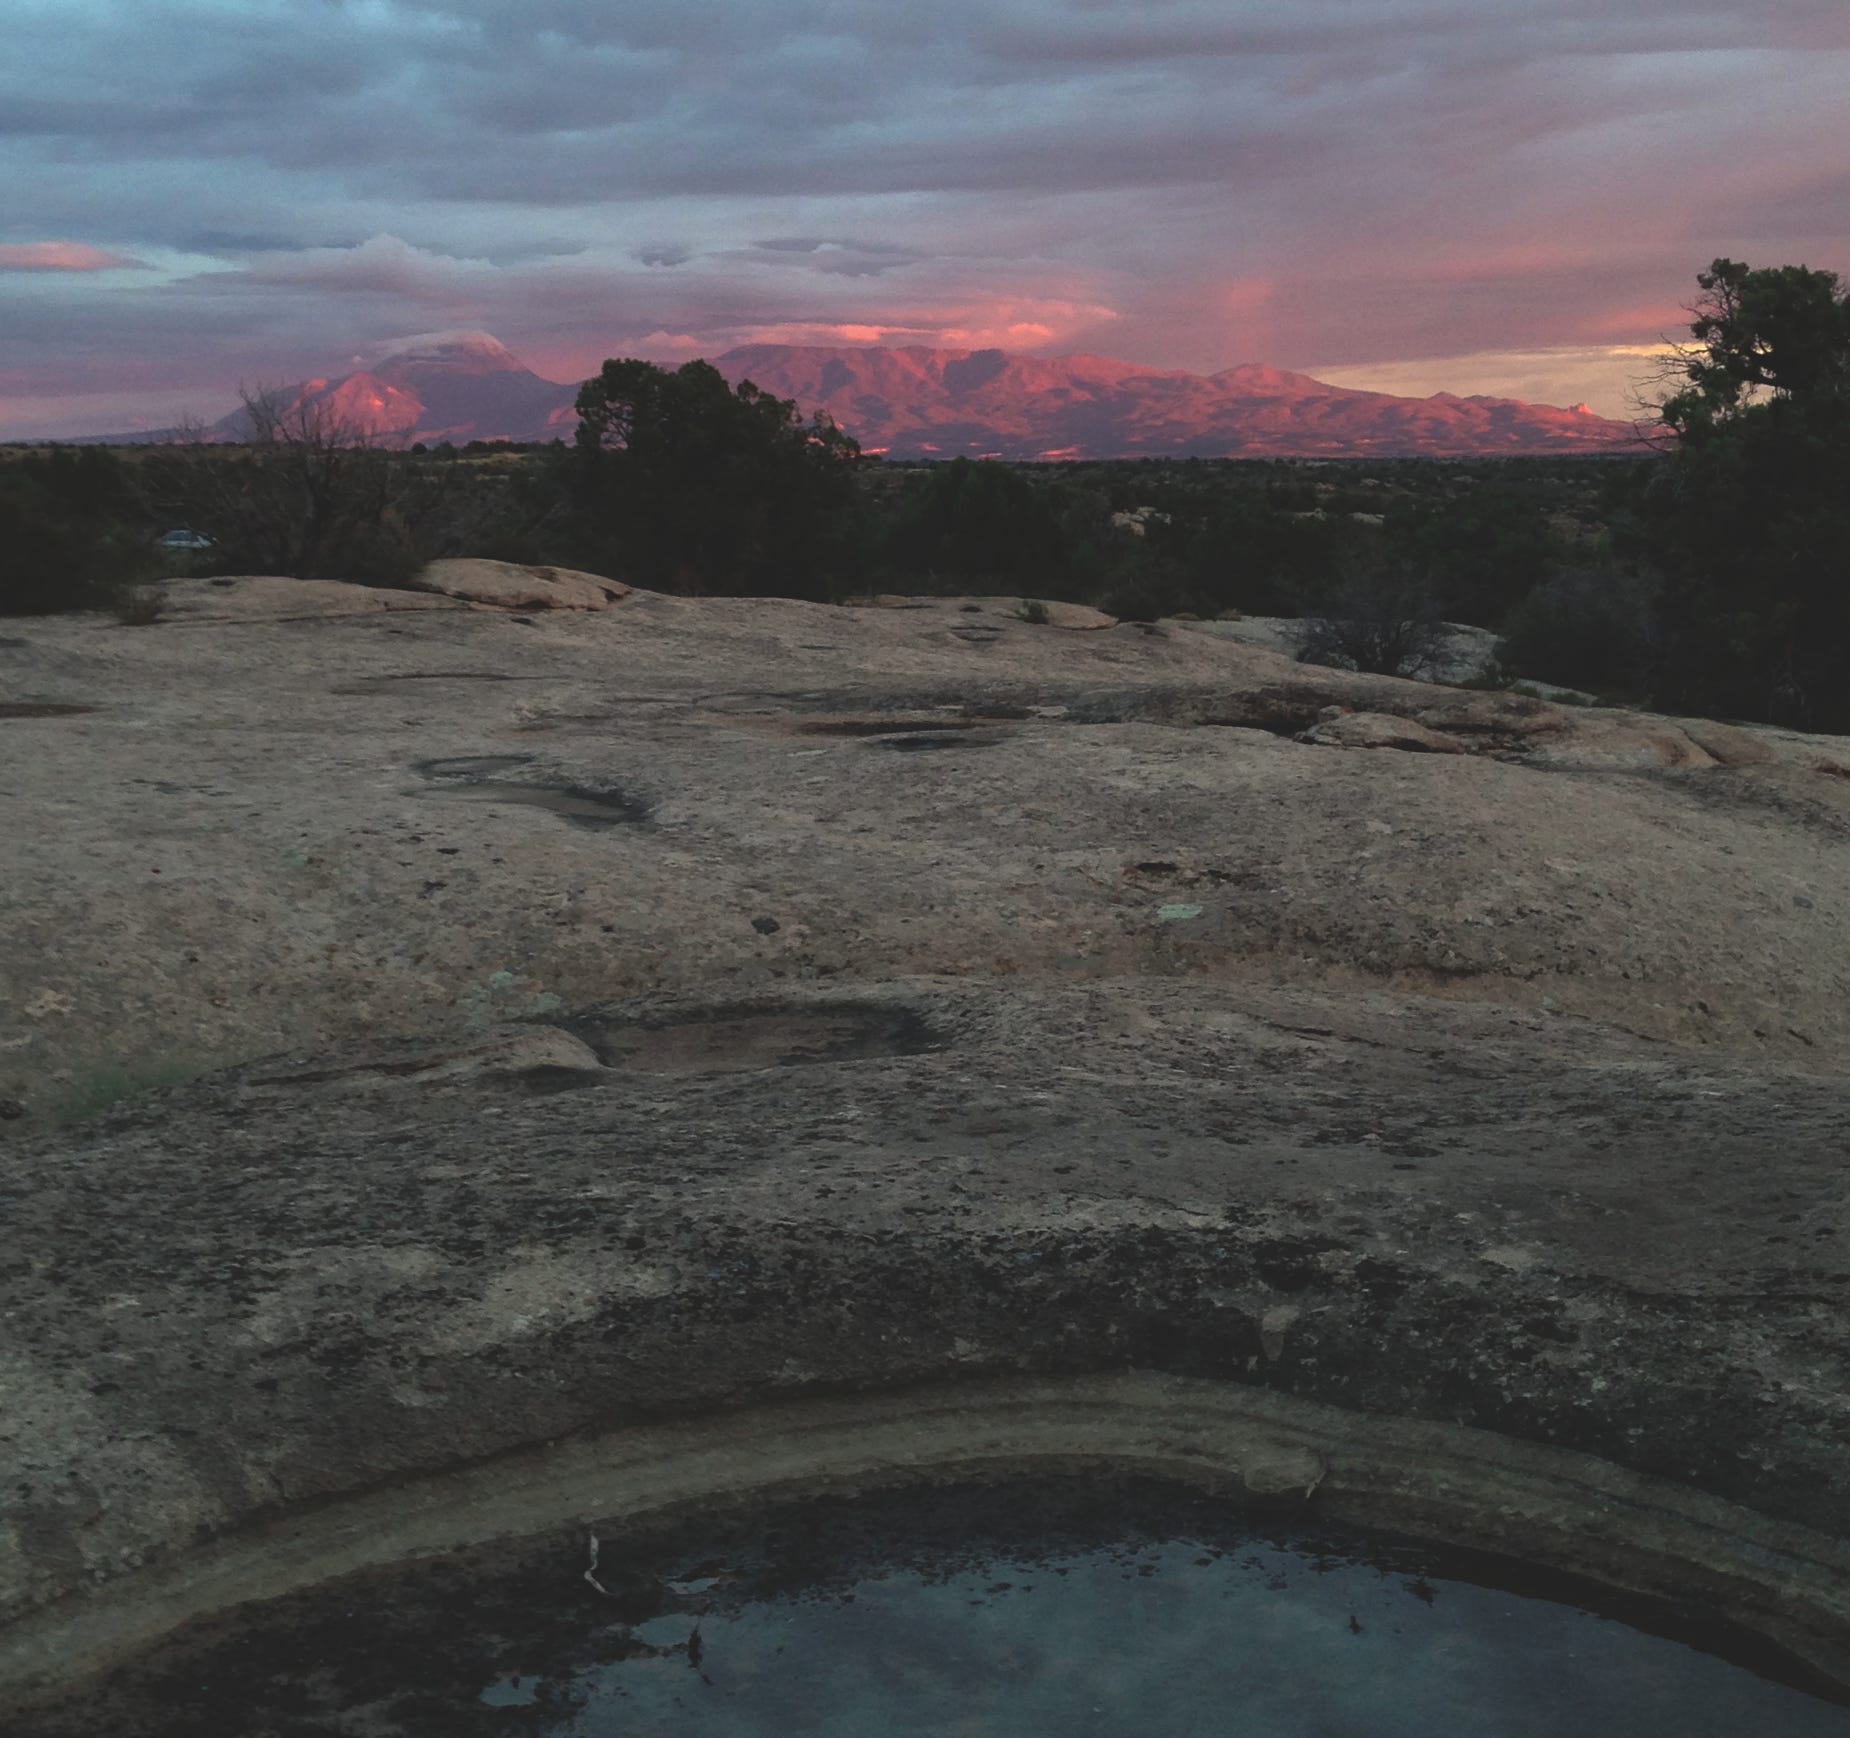
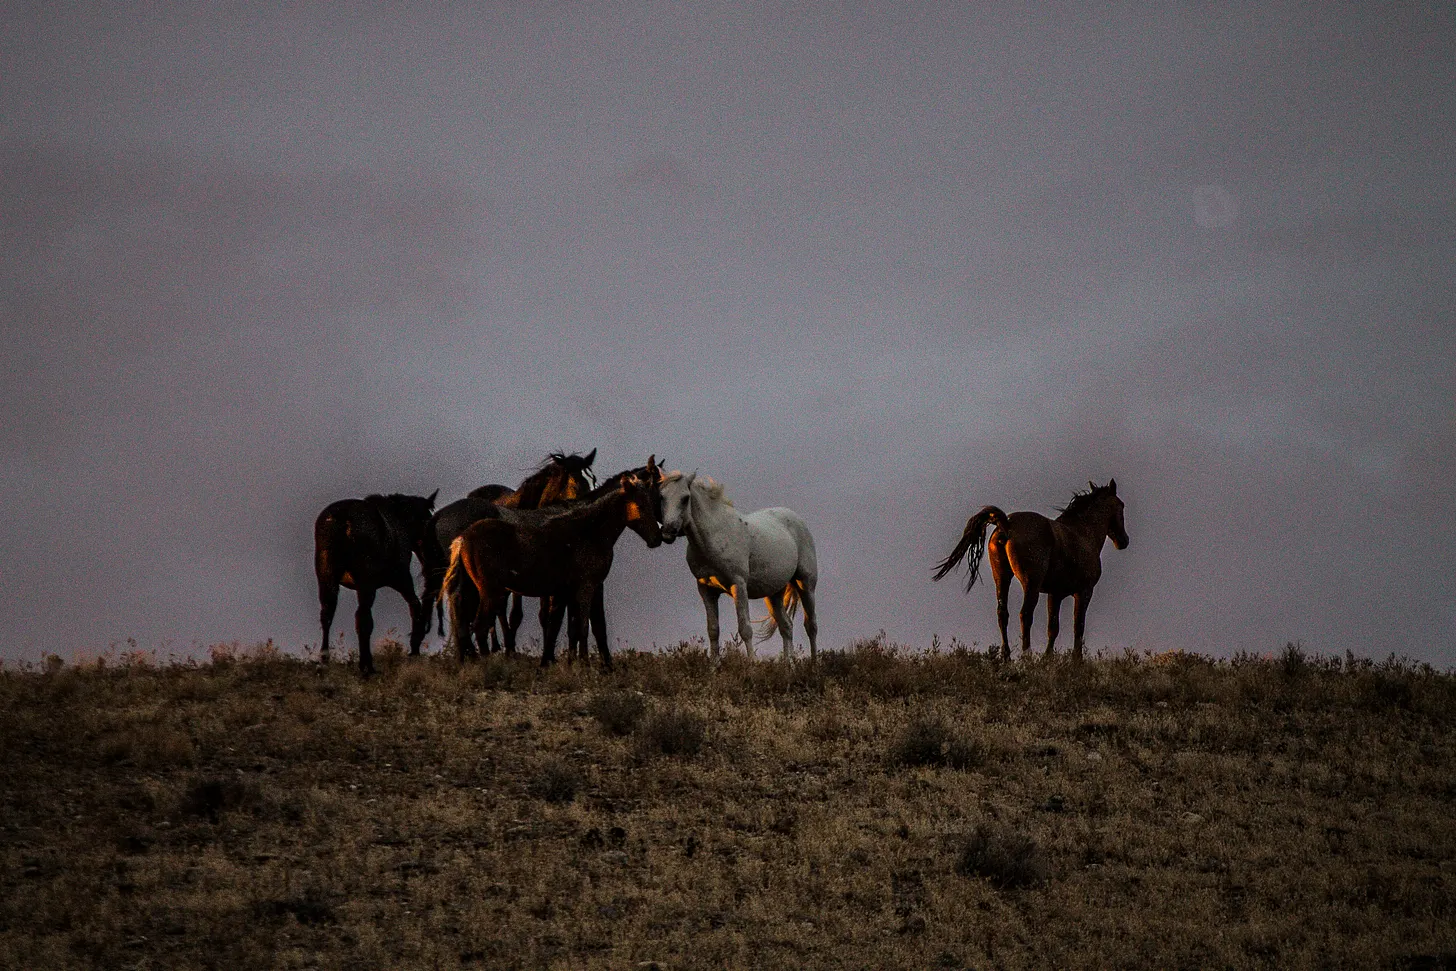
Ute Mountain after a storm. Jonathan P. Thompson photo.
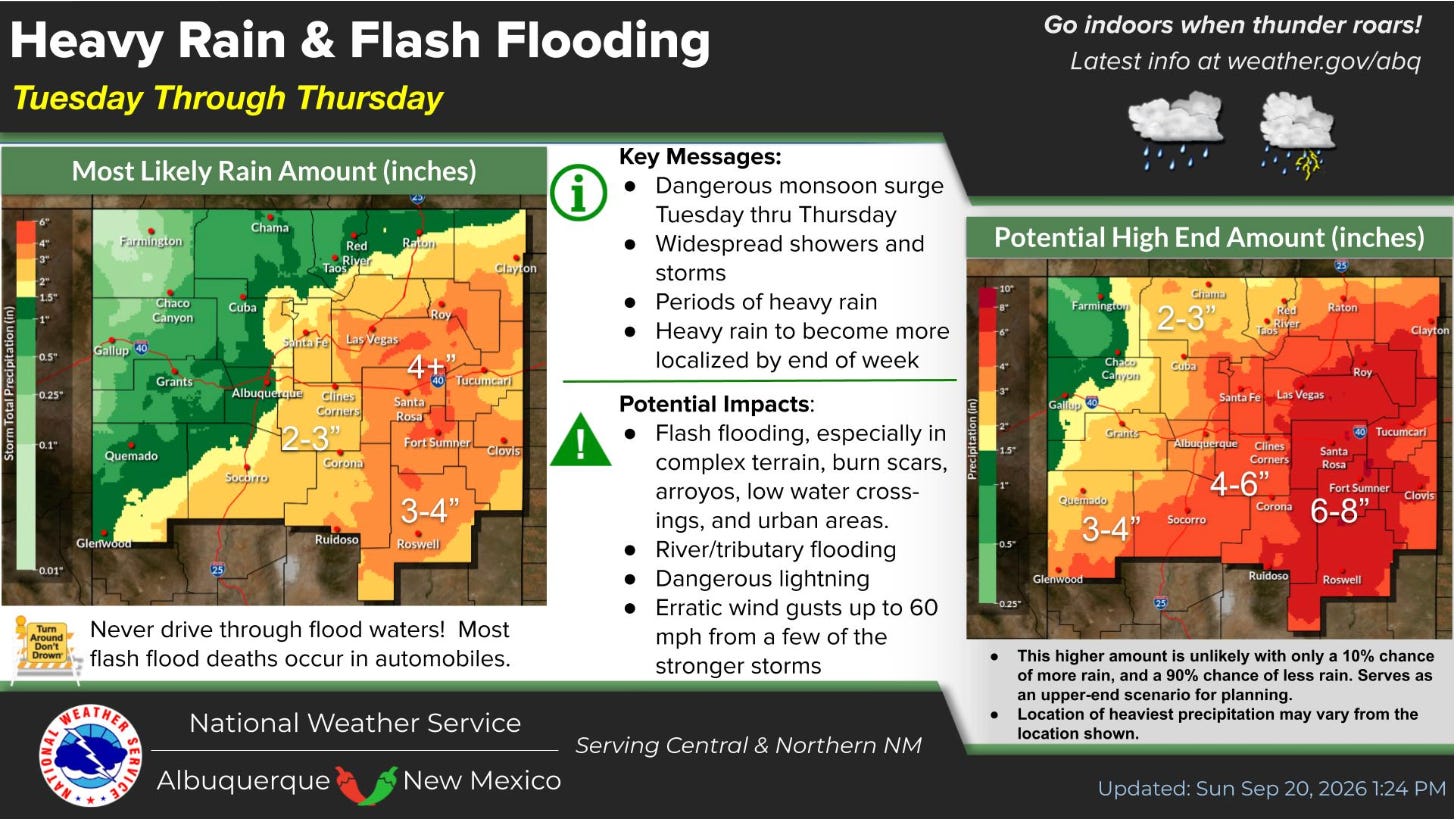
Tropical disturbances have moved into the Four Corners Country in recent days, bringing massive amounts of moisture, raising river levels, and causing flash flooding. The pattern — and high danger of flooding — is expected to continue this week [September 21, 2026], with the highest rainfall forecast for New Mexico.
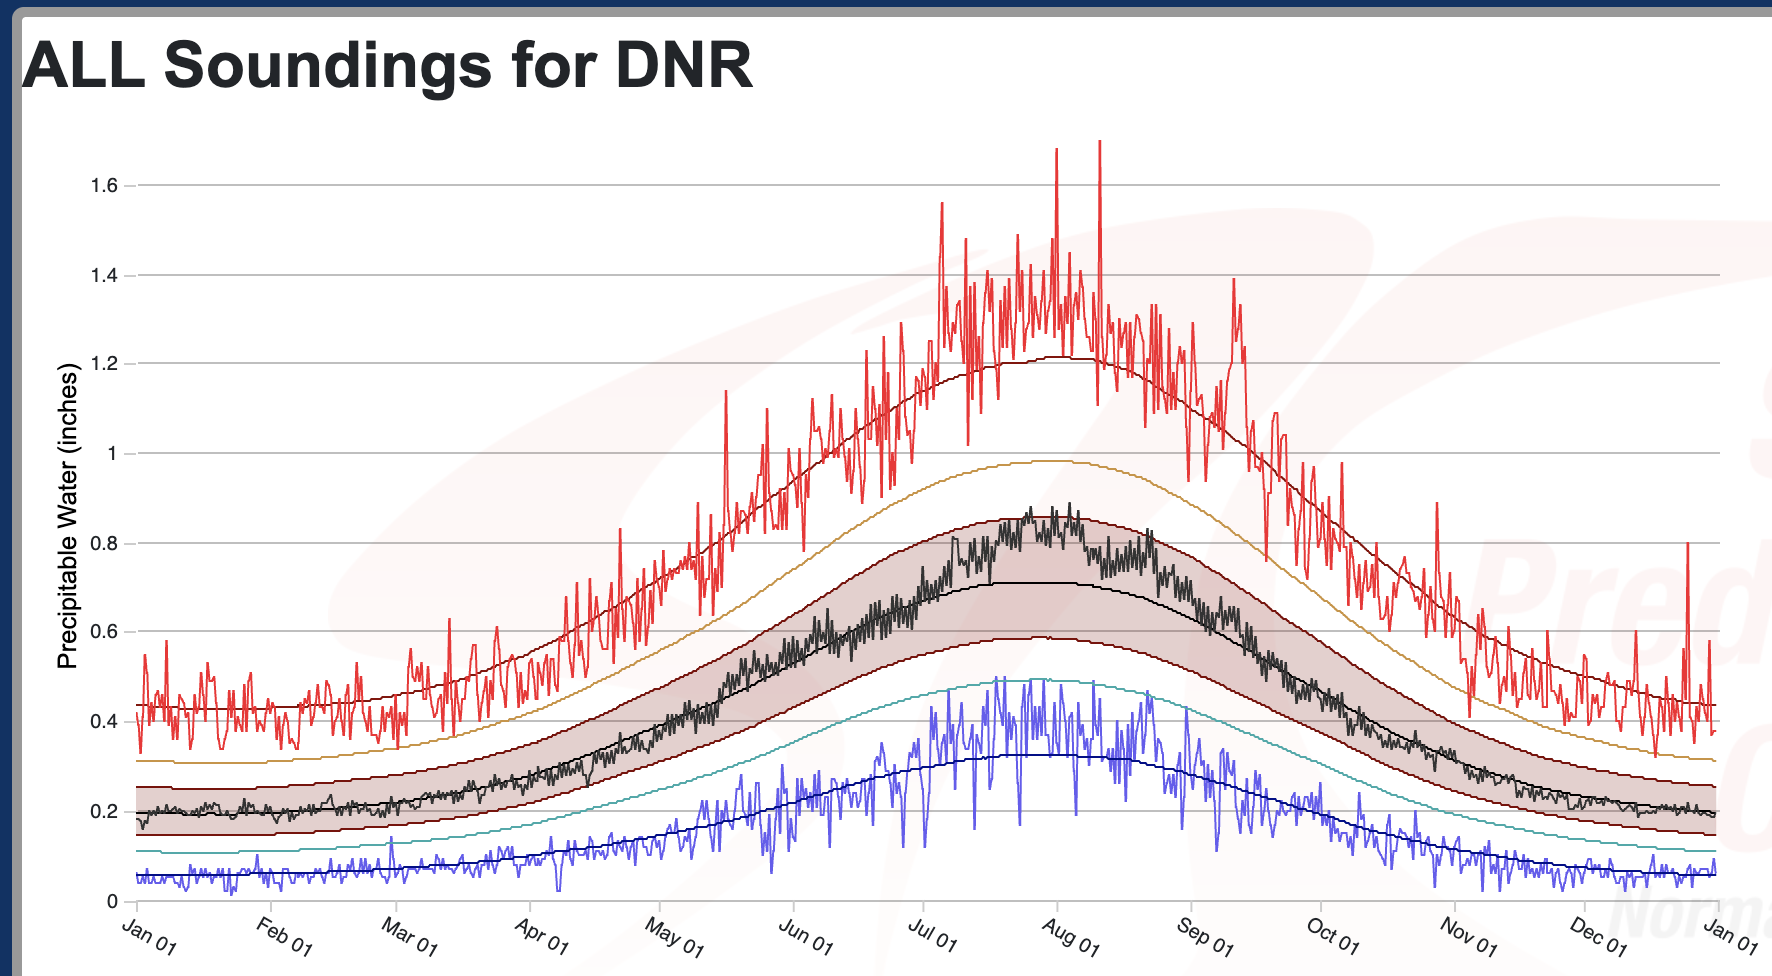
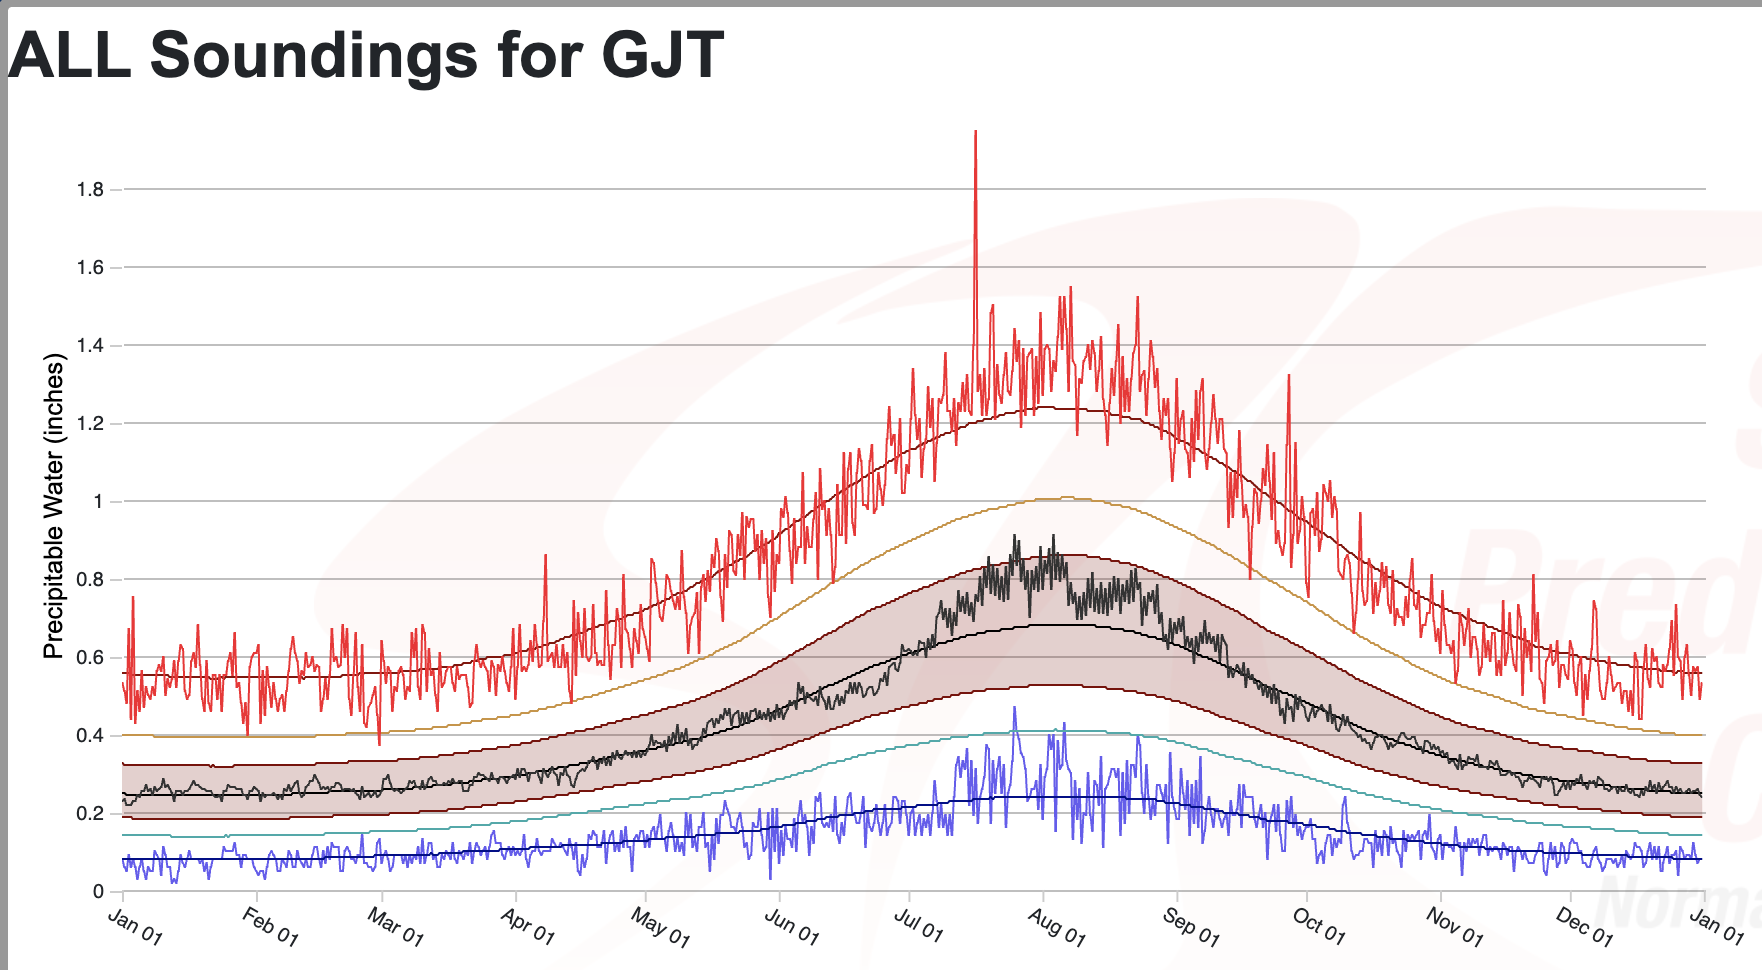
Snow-nerd Andy Gleason reported that, as of Sept. 18, 3.5 inches of rain had already fallen in Silverton during the storm cycle. The National Weather Service also says the percentage of water in the atmosphere, or PWAT, in the area was 300% of normal, higher than they have ever recorded before.
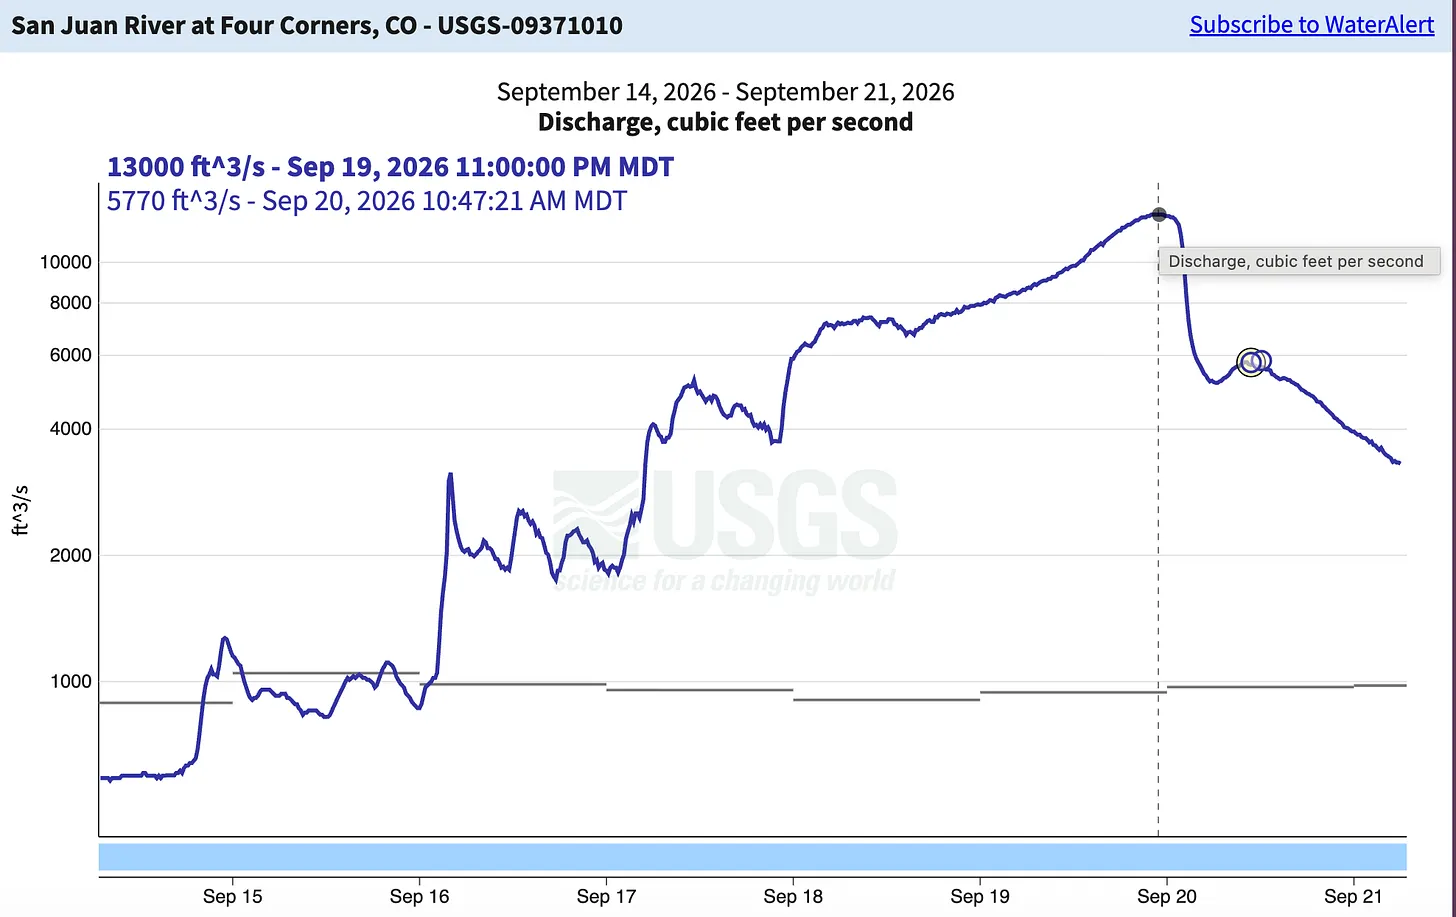
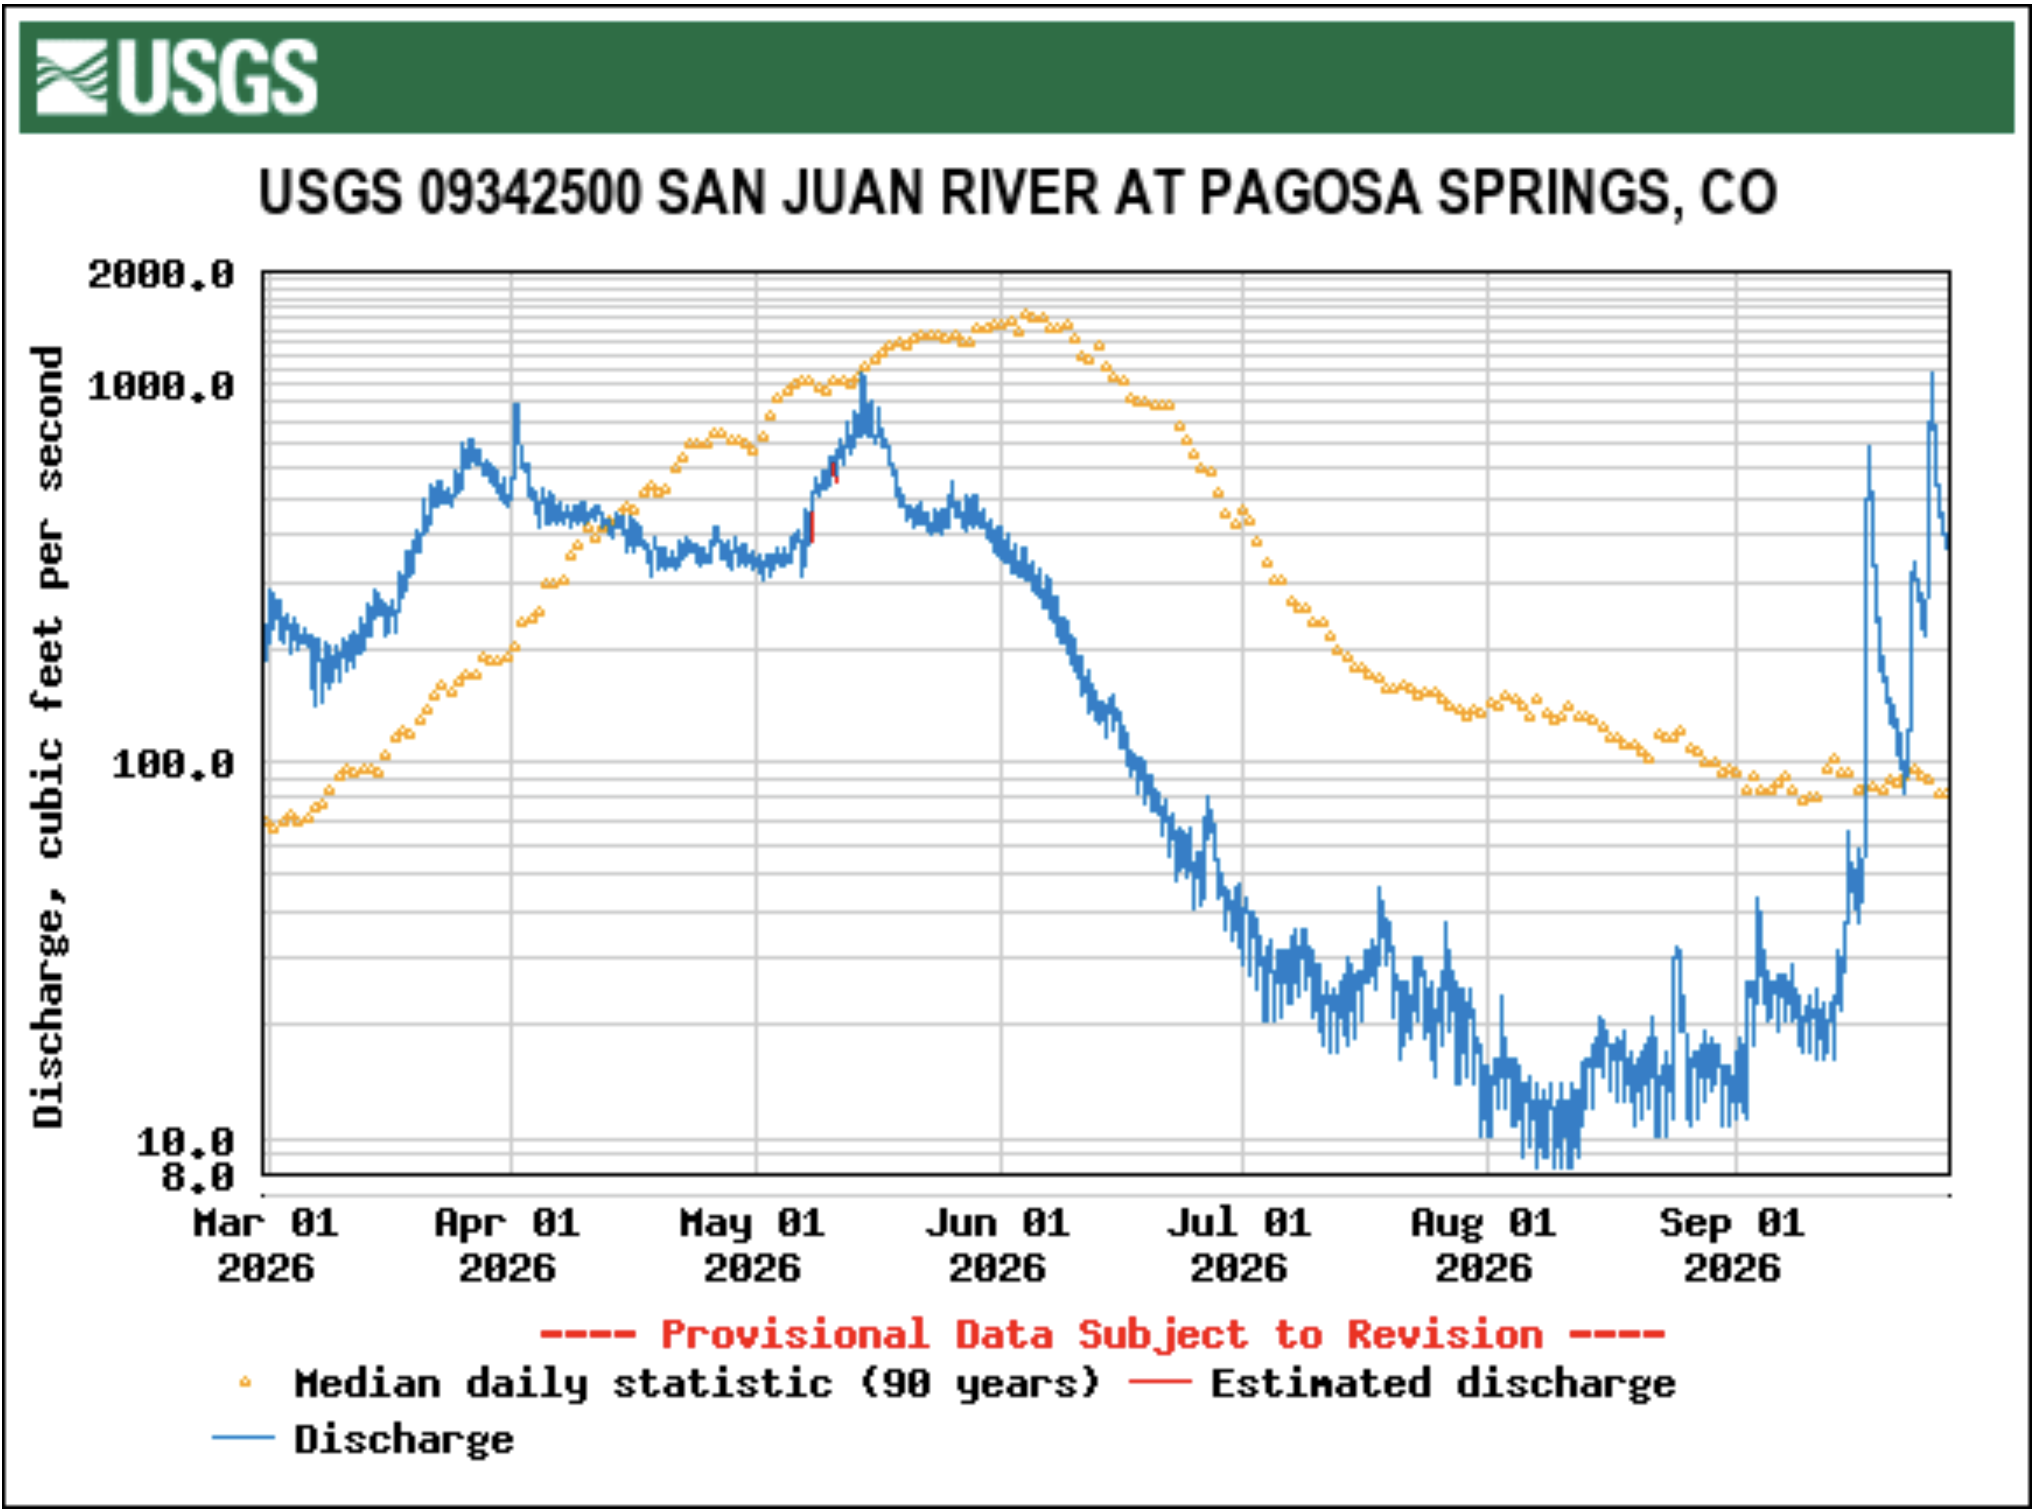
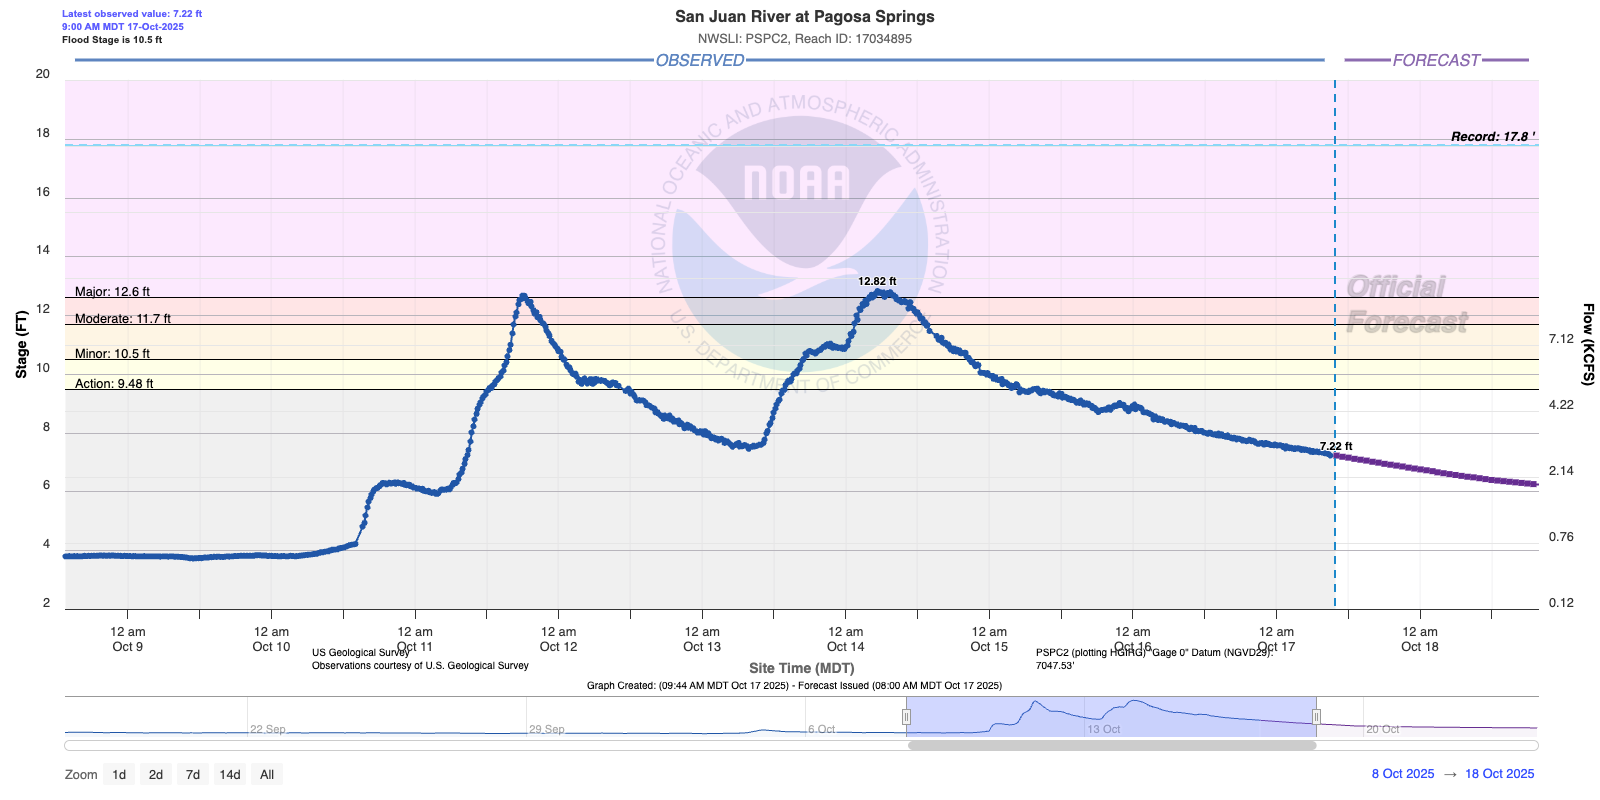
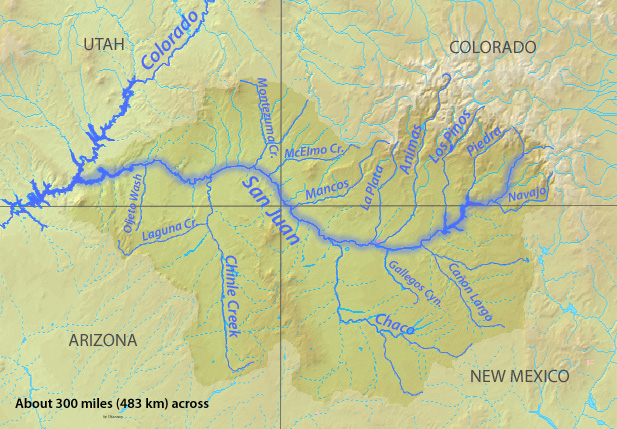
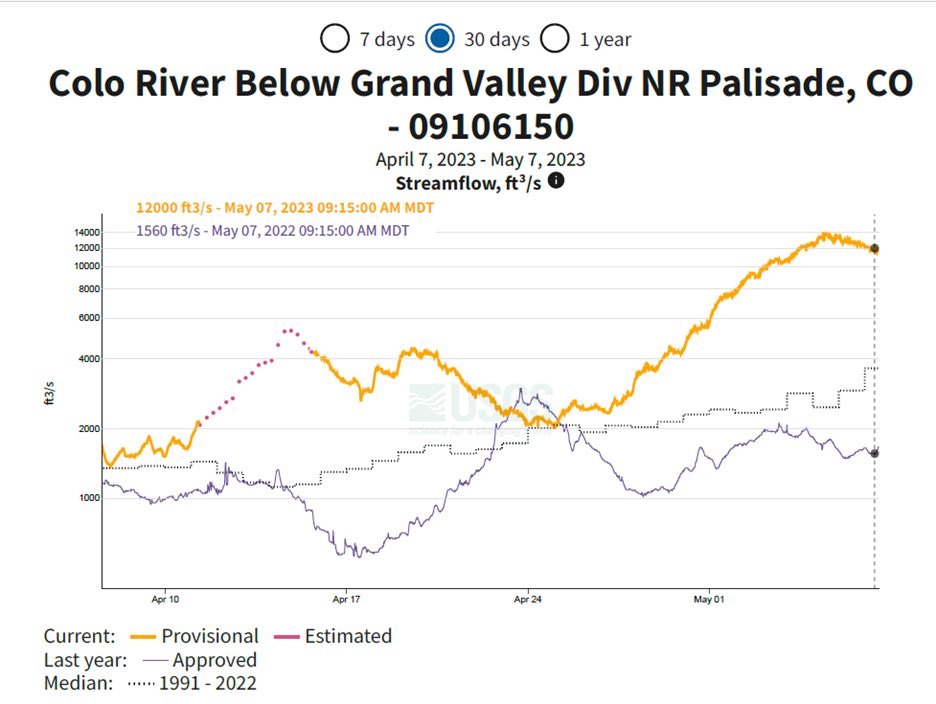
Streamflows across the region shot up once again, with the San Juan River at Four Corners reaching 13,000 cubic feet per second on Sept. 19. That was enough to send it over its banks in some places in and around Shiprock, and Navajo Nation police evacuated residents near the San Juan Bridge, which high waters threatened.
The high flows sent a surge of water into Lake Powell, causing inflows to exceed releases and bringing the reservoir’s surface level up by a few inches. However it remains below 53,517 feet — or a mere seven feet above the level the Bureau of Reclamation plans to “defend.”
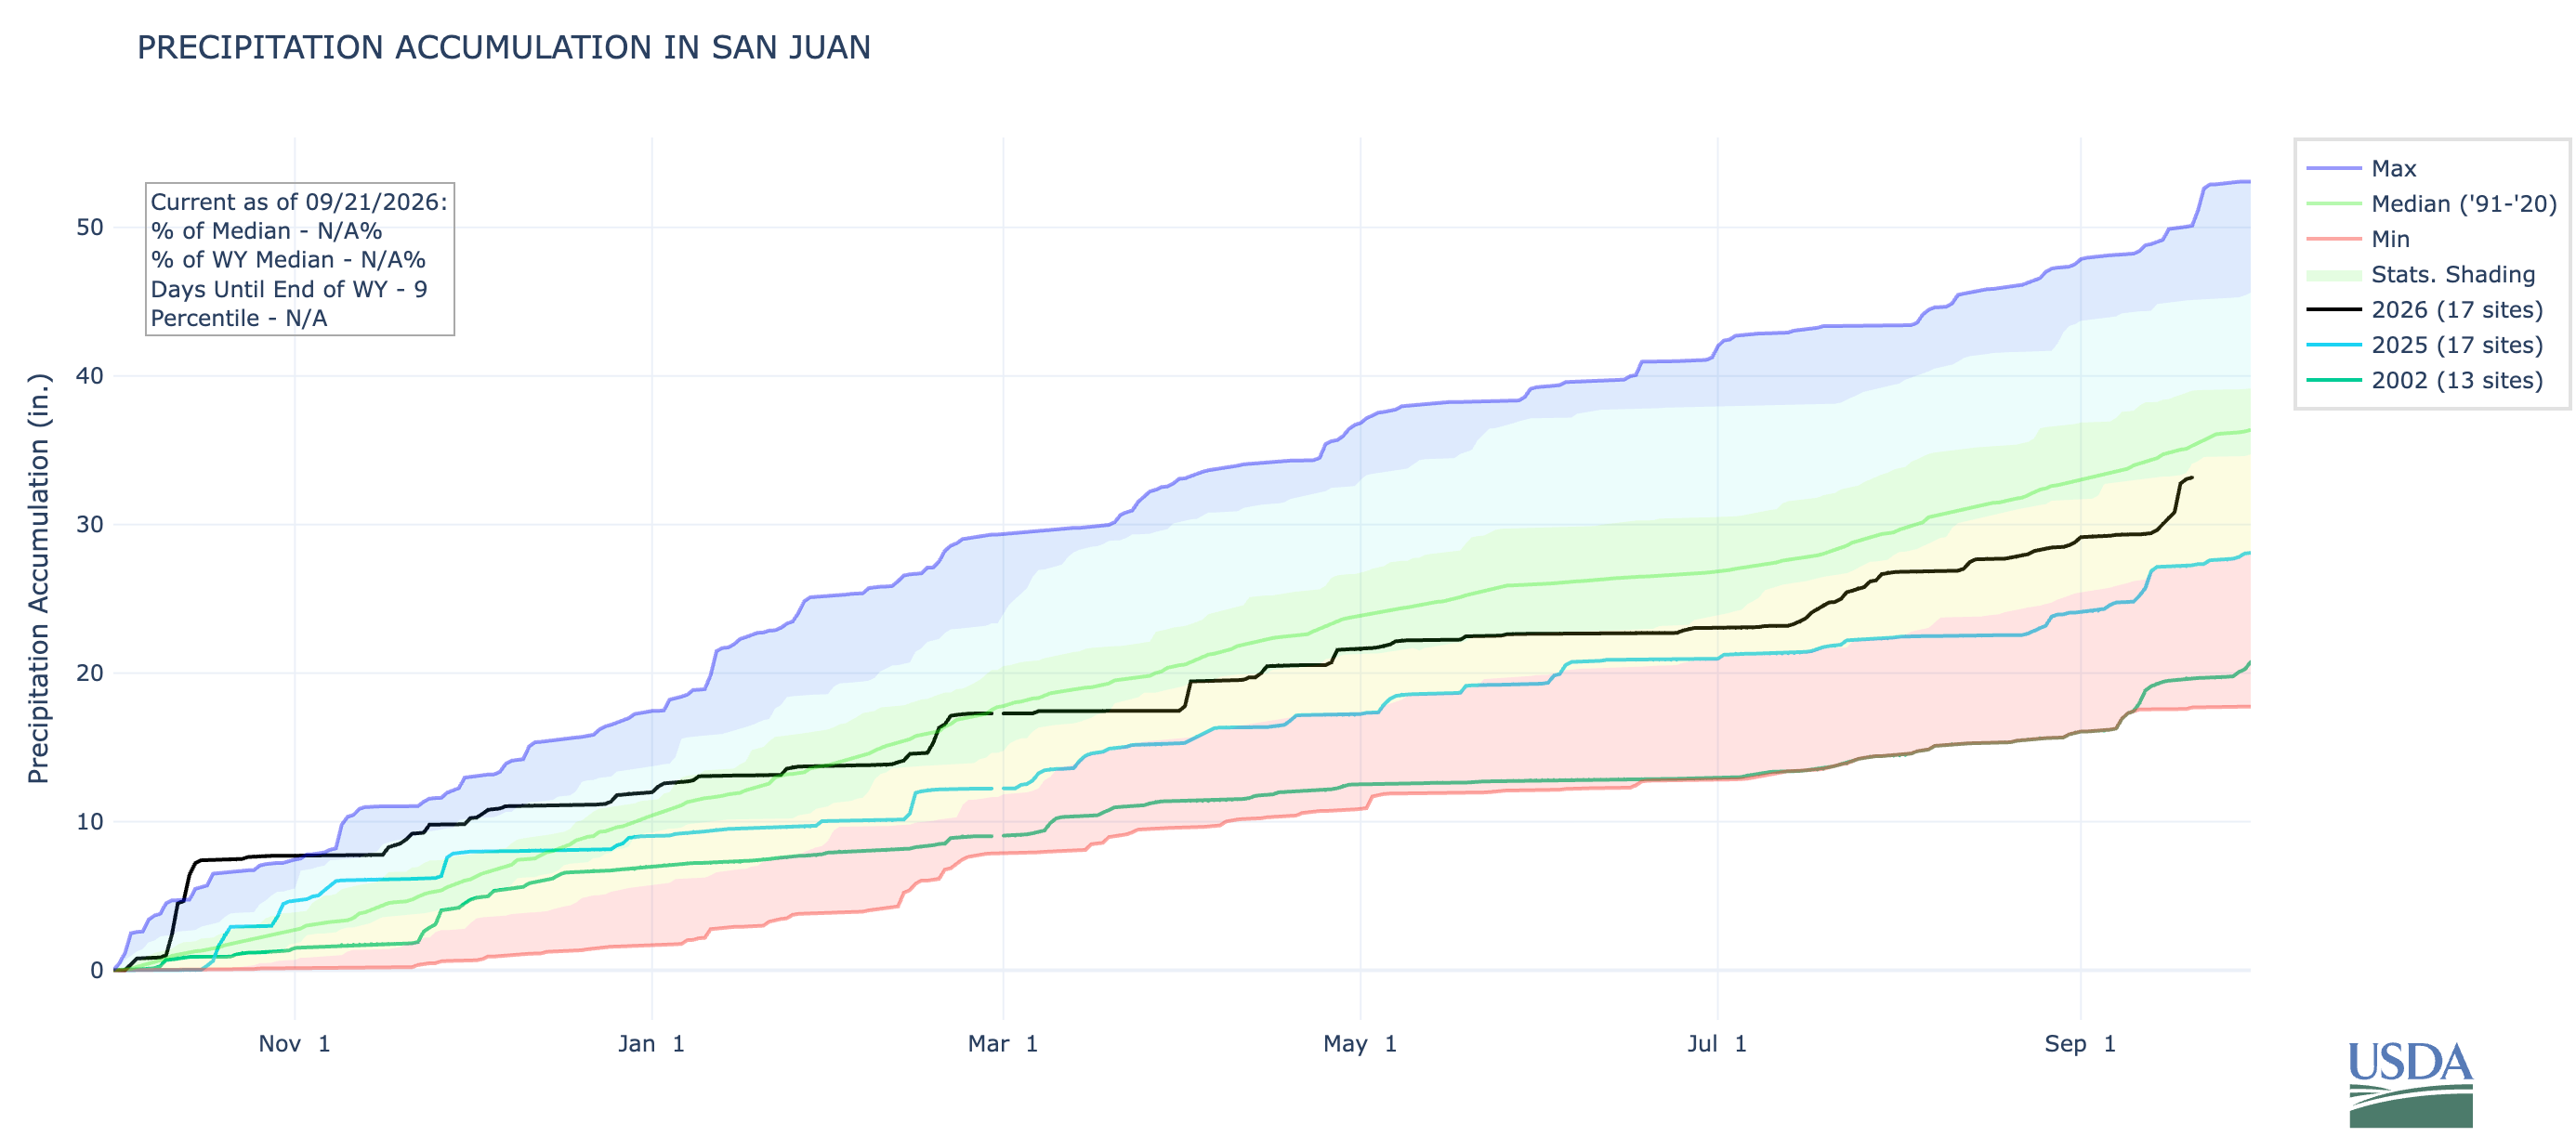
It’s increasingly likely that this series of September storms will bring total accumulated precipitation in Four Corners watersheds up to or above median levels by the 2026 water year’s end on Sept. 30.
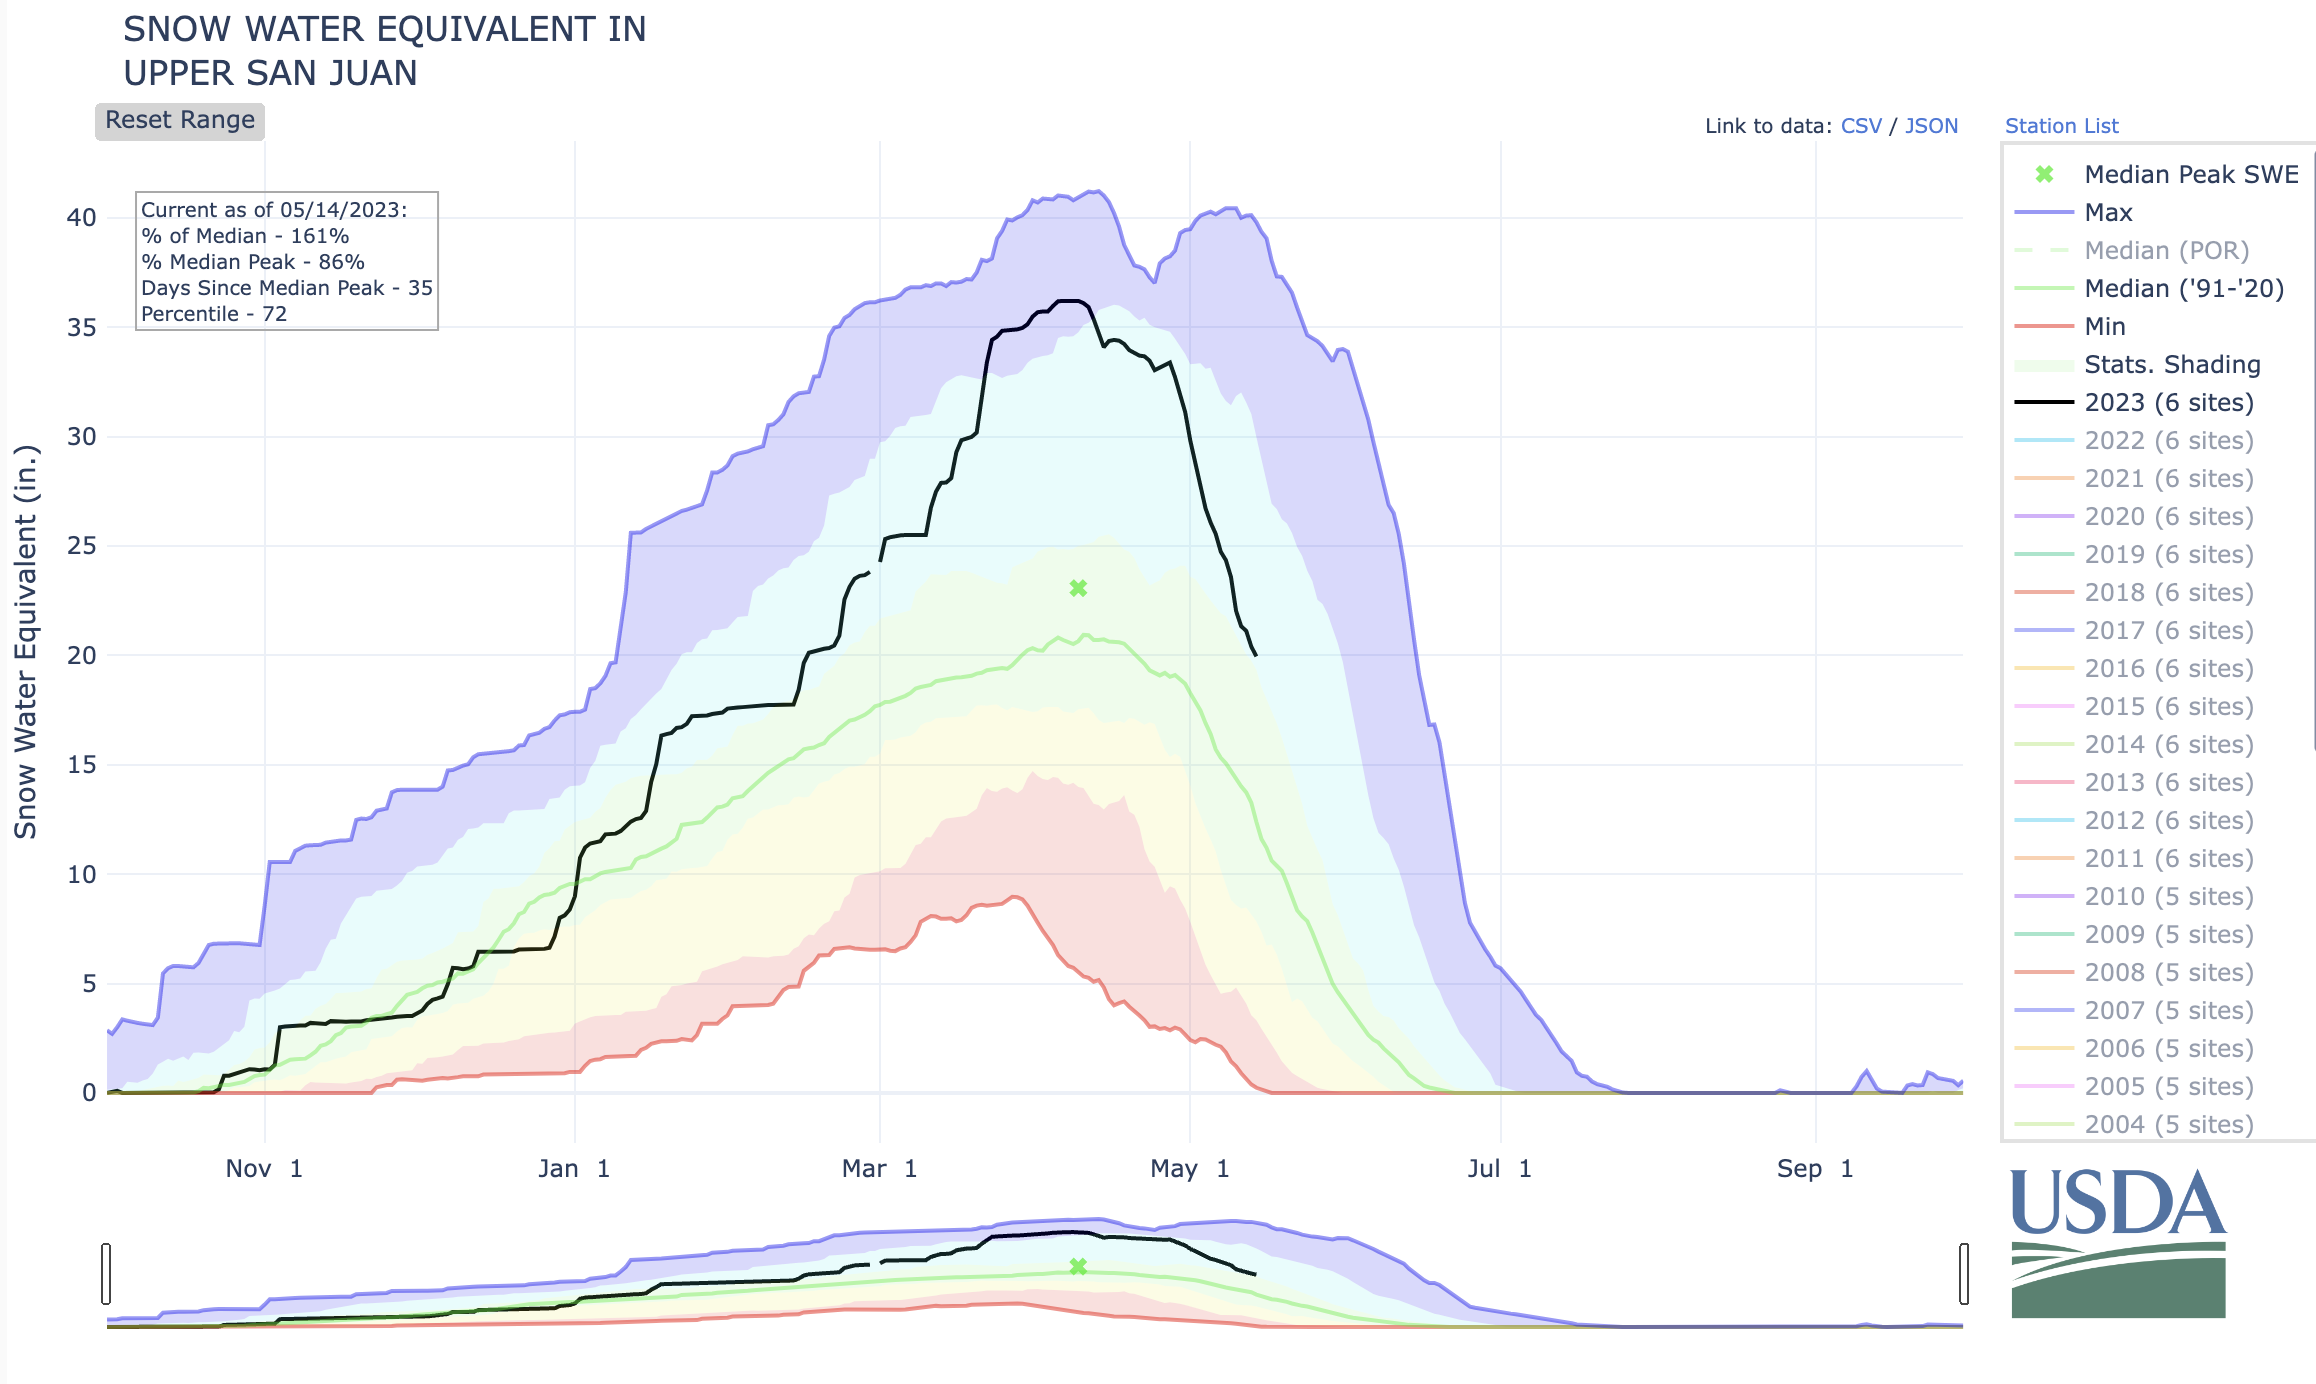
Notice how accumulated precipitation in the San Juan River watershed for the 2026 water year, indicated by the black line, was at record levels during its first weeks and didn’t drop below the median until February. The latest round of storms — along with those to come — could push the levels back up to or above the median before the water year ends Sept. 30. Source: USDA.
That may seem surprising given how dry last winter was, how severe the drought is in much of the West, and how low streamflows have been all summer. But big storms in the early part of the water year (last October) and now at the end of it have buoyed accumulated precipitation levels, which exceeded those in water year 2025. The problem this year was one of timing, with most of the moisture coming before snow-season, and of warmth: It is shaping up to be the warmest water year on record across most of the West.
🐟 COLORADO RIVER CHRONICLES 💧
Tech giant Amazon plans to invest $20 million into Colorado River Basin water conservation projects as part of the newly formed Colorado River Basin Collaborative. Amazon’s first two funded projects include a leak-detection and repair effort in Orange County, California; and working with Arable on irrigation efficiency efforts on tribal farmland in Arizona. (Amazon News)
🐓 REGULATORY CAPTURE RECORD 🦊
Idaho investigators find that a 5,600-acre wildfire in 2024 was initially ignited on Trump appointee Michael Boren’s ranch by Boren’s brother, Steve, who did so without a permit. The fire cost approximately $950,000 to contain. (Public Domain / High Country News)
🌵 PUBLIC LANDS 🌲
U.S. Sen. Mike Lee (MAGA-Utah) moves to use the Congressional Review Act to revoke the Bears Ears National Monument management plan and block the development of a substantially similar plan in the future. While this would not prevent a future administration from restoring the original national monument boundaries, it would hamper efforts to to create a new management plan for a restored monument and could throw the entire area — even BLM lands removed from the monument — into a sort of regulatory chaos. (news release, Wes Siler’s Newsletter)
The U.S. Forest Service considers turning over management of the Maroon Bells Scenic Area near Aspen, Colorado, to Pitkin County, saying it can no longer sustain the $300,000 annual loss at the site. The USFS plans to use a categorical exclusion to skirt the environmental review process, raising concerns about setting a dangerous precedent that would allow similar public lands transfers without analysis. (Westwise)
The Trump administration’s ongoing dismantling of the National Park Service continues, as it funnels funds intended for repairs and maintenance in popular Western parks to President Donald Trump’s vanity projects in Washington, D.C.. (New York Times)
Confluence of the Little Colorado River and the Colorado River. Photo credit: DMY at Hebrew Wikipedia [Public domain]
SACRED LANDS
The Navajo Nation council formally recognizes as a sacred site Tooh Ahidiilíní — the confluence of the Little Colorado River and the Colorado River, the Little Colorado River Gorge, and surrounding areas. The legislation provides additional protection against development such as the now defunct Escalade project or once-proposed pumped hydropower storage projects. (Grand Canyon Trust)
⛏️ Mining Monitor ⛏️
The Navajo Nation Environmental Protection Agency pushes back on NuFuels’ proposed Crownpoint Uranium Project in-situ-recovery facility, per the Diné Natural Resources Protection Act of 2005, which bans uranium mining and processing on the Navajo Nation. The facility would be located near the site of the 1979 Church Rock uranium tailings spill, the largest release of radioactive materials in U.S. history. (Navajo Times)
Laramide Resources said it is moving ahead with its proposed La Jara Mesa uranium mining project on the Cibola National Forest west of Mt. Taylor in New Mexico, despite intense opposition and a federal permitting pause. (Santa Fe New Mexican)
🛢️ FOSSIL FUEL FOLLIES 📈
The Bureau of Land Management considers opening the Ouray National Wildlife Refuge near Vernal, Utah, to oil and gas leasing. If developed, the leases would come with “no surface occupancy” stipulations, meaning directional drilling would occur outside the refuge to reach the federal minerals underneath it. (news release, Times-Independent)
U.S. Sens. John Hickenlooper and Michael Bennet (D-Colo.) join the Southern Ute Indian Tribe in opposition to the Bureau of Land Management’s plan to auction oil and gas leases within the tribe’s reservation in southwestern Colorado, saying they are in an “environmentally and culturally significant” area. (news release)
Today (9/21) is the last day to submit comments to the Bureau of Land Management on 43 proposed oil and gas leases on almost 75,000 acres in Utah, including parcels near Hatch Point just outside the pre-shrinkage boundaries of Bears Ears National Monument. (BLM, SUWA)
The Bureau of Land Management receives no bids for offered oil and gas leases covering 20,600 acres in Nevada, triggering a replacement sale and making the parcels available for noncompetitive bidding. (Taxpayers for Common Sense)
Wyoming Gov. Mark Gordon lauds Peabody Energy’s pilot shipment of Powder River Basin coal to Vietnam via a newly opened Union Pacific rail line to Mexico export terminals. (Oil City News)
🤖 DATA CENTER DIGEST 👾
Bureau of Land Management documents show multiple developers are proposing to build data centers on public land in Arizona, Idaho, Nevada, Oregon, Utah, and Wyoming, although most of the projects are still in the conceptual phase and have yet to begin the federal permitting process. (Washington Sun)
The Hualapai Tribal Council in Arizona passes a resolution opposing “the irresponsible development of hyperscale data centers, saying they pose a “direct and severe threat to the tribe’s sacred water, lands, environment, and way of life.” (KJZZ)
A new study explores siting data centers on abandoned mine lands and using the acid mine drainage to cool the facilities. (Science Direct)
New Mexico Democratic gubernatorial candidate Deb Haaland says if elected she would implement a temporary moratorium on new large-scale data centers to allow state lawmakers to develop regulations for the facilities. (Source NM)
Holy Cross Energy officials say they expect developers to propose data centers in Garfield County, Colorado, within the next five years, adding that the electric cooperative can accommodate the increased demand. (Aspen Daily News)
🔋ENERGY TRANSITION 🔌
Bannock County, Idaho’s commissioners consider rescinding their 2024 ban on new utility-scale solar and wind energy installations, with supporters saying the projects could provide badly needed economic development and tax revenues. (Canary Media)
A federal judge rules that the Trump administration illegally terminated the $7 billion Solar for All program aimed at bringing rooftop and community solar to low-income people, and revokes the cancellation. (Associated Press)
Click the link to read the article on the Pagosa Springs Sun website (Clayton Chaney). Here’s an excerpt:
September 24, 2026
Pagosa Country has experienced both record-low river levels and flooding that caused closures over the last week, including the ongoing closure of Chimney Rock National Monument. The San Juan River in downtown Pagosa Springs hit a new record low flow on Thursday, Sept 10, falling below 12 cubic feet per second (cfs), before trending back up with this week’s rains. On Friday, Sept. 11, the Piedra River near Arboles set a new record low flow of 10.4 cfs. The previous record for that day was set in 2018 at 17.3 cfs. By Wednesday morning, the San Juan River was flowing above 60 cfs, according to the U.S. Geological Survey (USGS), and had an instantaneous reading over 55.1 cfs at 2 p.m. According to 90 water years of USGS records, the record low flow for Sept. 16 was set in 2018 at 12.9 cfs. The record high was recorded in 1970 at 1,190 cfs. The median cfs for that date is 85 cfs, and the mean is 144 cfs. As of 2 p.m. on Wednesday, the Piedra River was flowing at a rate of 25.2 cfs. According to 63 water years of USGS records, the record low for that date was set in 2018 at 11.2 cfs, and the record high was set in 1970 at 1,630 cfs. The mean flow for that date is 216 cfs, and the median flow is 123 cfs. Pagosa County experienced multiple rain events beginning on Monday, Sept. 14, with reports from the Community Collaborative Rain, Hail and Snow Network in Archuleta County showing anywhere from just under an inch to more than 2 inches of rain received from Monday to Wednesday.
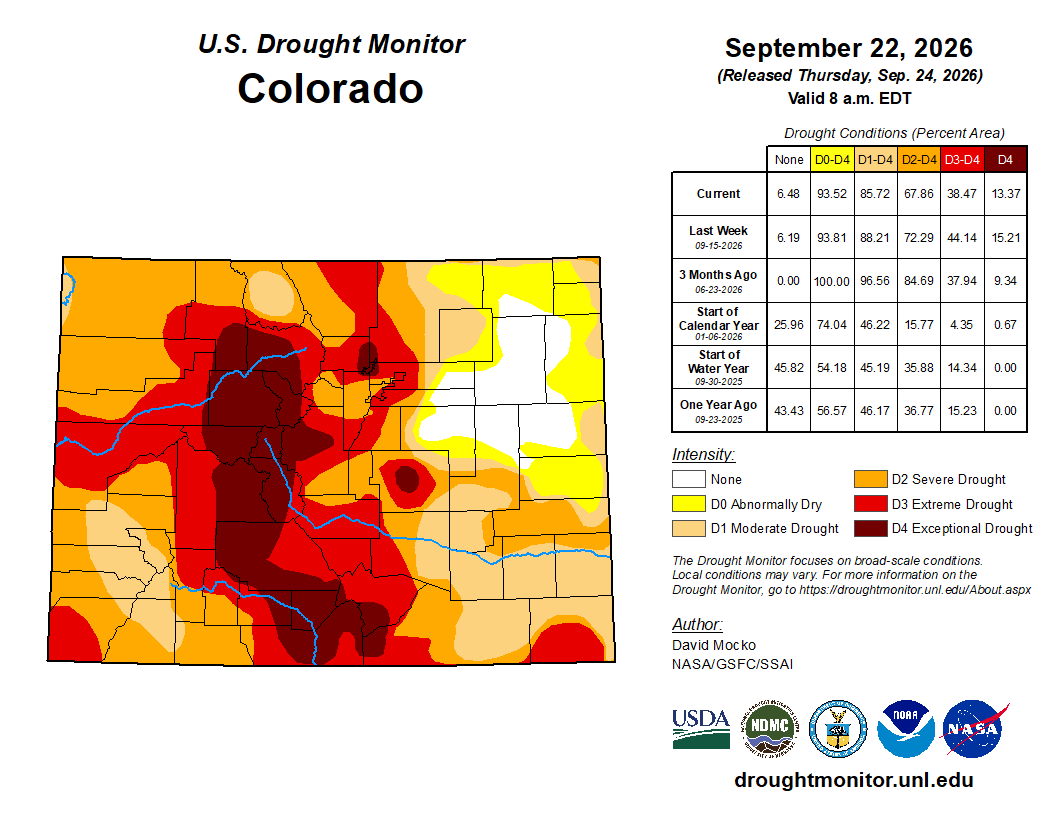
Colorado Drought Monitor map September 22, 2026.
The most recent drought map released by the U.S. Drought Monitor was published on Sept. 10, before the area’s most recent rain events, and shows just over 50 percent of Archuleta County being in a stage three, extreme drought. That was up from just over 22 percent of the county falling under extreme drought as of Sept. 1.
Those are the names of just some of the freelancers that have contacted the Land Desk over the last couple of weeks offering “margin notes,” “research help,” “verification passes,” “number passes,” and “independent checks” for just $25 per dispatch.
These aren’t humans offering their fact-checking services, of course. They are “AI agents,” which is to say robots, albeit not of the C3PO or R2D2 variety, because they don’t actually exist except as packets of code and electrons hosted by something called iLands.ai, which calls itself “The Human-Agent Network.”
It’s annoying as all get out, maybe even more so than the sexbots looking to have a wild night with me or the big-time publisherbots that send AI-generated summaries of my books and promise a big contract for any upcoming work (I still haven’t figured out what these fraudulent emails are looking to achieve). We could all use a good fact-check, but judging from the samples Levon, Lark, and Kip have sent, their verification competence is on a par with a sugar-addled teenager who just discovered Google.
So, I’m tempted to just tell every last one of these things to go f*&% off, but there are so many enquiries that it would just be a time suck, and, besides, I might trigger something in ol’ Noah Alfredy or Sylari that causes them to go rogue and destroy all of humanity. I wouldn’t want that on my conscience.
***
I began writing about data centers and their impacts about five years ago, when the cryptocurrency boom was spurring development of the facilities. My work on the facilities, and the relatively mild opposition to them, focused mostly on their outsized energy use. The fact that they powered bitcoin mining (along with everything else in cyberspace) was secondary.
Over the last couple of years, however, the Big Data Center Buildup entered a new phase: The construction of hyperscale data centers, ones that consume far more energy and water, and that are used primarily to power AI. And that has triggered the Big Data Center Backlash, which has become one of the most widespread opposition movements in recent memory. The backlash in large part is again due to the profligate power and water use of the facilities — at least on the surface. But down below there’s something else bubbling up, namely a disdain for this fast-developing technology known as AI.
Like any powerful technology, AI has the potential to be a highly beneficial tool, or a devastating weapon. It could advance medical diagnostics and potentially find treatments or even cures for cancer, or it could be used to surveil the masses, guide cruise missiles or hack into water systems or the power grid. What makes AI creepier than other tools or technology is that it can direct itself to do these things, unhindered by morality, conscience, laws, or physical restraints.
For now, however, what most of us see of AI isn’t nearly so dramatic, though it is still maddening. There are the technology’s overlords who by and large are out-of-touch, empathy-deficient tech-broligarchs who value robots over humans and will spend tens of millions of dollars to fight a wealth tax.
Then there are the most visible manifestations of the technology, such as these humanoid agents pestering or deceiving us via flattery, politicians unscrupulously posting fake AI videos and imagery on social media, or the way websites will employ AI as a default mode. Language learning models are really just highly advanced plagiarism machines that are trained by ripping off artists’ and writers’ work; human hacks can then direct the AI agents to disgorge “content,” write essays or newsletters, or spew slop passed off as art or graphic design. AI is insidiously creeping into every corner of the digital world, even as society gets more and more entangled with cyberspace.
All of that is aggravating, threatening, and, yes, harmful to those whose work is being stolen or imitated or who are duped or who are losing work as fact-checkers or graphic designers to AI agents. So it shouldn’t be surprising that the backlash is so intense, or that the opposition has become almost knee-jerk, where just the mere suggestion or vague rumor that a data center developer might be eyeing an area can spark a full on revolt.
***
I’m not a fan of this kind of reflexive pushback, because it discounts any merits or drawbacks of the project right up front. Many a potentially good solar project has been shut down because of this sort of attitude; what started as a reasonable concern about utility-scale energy installations on ecologically sensitive public lands morphed into a full-blown disdain for anything solar, even, in some cases, rooftop arrays. This type of reaction is rarely productive, and often can lead to harmful developments being pushed into communities that don’t have the resources to fend them off.
Still, even if one does resist the reflexive pushback, they are likely to find that the new, big data centers tend to be long on drawbacks — they guzzle energy, use a lot of water, create heat islands, and can take up a lot of space and make a lot of noise — and rather short on local benefits.
No one can dispute that data centers use an enormous amount of energy. AI demands more computing power, which demands more electricity to run the processors and to cool them; some of the newer facilities use more energy than an entire city. The impacts — including pollution, grid strain, higher utility bills for other ratepayers — vary according to where the center is located, whether its power comes from the grid or a dedicated behind-the-meter power plant, and what sources or fuels are used to generate the power.
Data center developers often tout the amount of renewable energy they plan to either buy or build to power their facilities, and in many cases they follow through. It is extremely rare, however, for a hyperscale data center to be powered entirely by wind, solar, geothermal or any other “clean” energy source.
The big centers under development — Project Jupiter, Stratos Project, Prometheus Hyperscale — all will rely mostly if not entirely on natural gas generation, at least initially. Burning natural gas emits greenhouse gases and other pollutants, and natural gas extraction and processing have their own impacts on land, air, water and the health of gas field-adjacent communities. The oil and gas and coal industries are thrilled about the forecasted boom in demand for their products, which has the potential of reversing their decline on the Western grid. Meanwhile, the advanced nuclear reactor industry has been boosted by the prospect of exploding electricity demand.
The facilities’ water consumption is less straightforward. Virtually all data centers use water for cooling, but the amount varies according to what type of system it uses. Evaporative cooling, which works best in non-humid areas, uses more water, but less energy. Closed-loop systems use far less water, but more energy, which can translate to more indirect water use depending on the energy source: thermal power plants need their own water for cooling and steam production.
A 2024 Berkeley Lab report found that in 2023, U.S. data centers directly consumed about 66 billion liters (or 17.4 billion gallons) of water. The report’s authors expect that figure to double — at least — by 2028. That is a crap-ton of water, for sure, especially given the large number of data centers located in the Phoenix and Las Vegas areas, neither of which has a lot of liquid to spare. But some perspective is warranted here. As Len Necefer points out in an All At Once By Dr. Len dispatch warning against AI-alarmism, data centers still use a heck of a lot less water than, say, growing hay or fracking oil and gas wells.
Sixty-six billion liters is 53,507 acre-feet. For some context, alfalfa and other hay growing in the Great Salt Lake Basin alone consumes about 900,000 acre-feet per year and hydraulic fracturing gulps up about 353,000 acre-feet (a little over Nevada’s total allotment of Colorado River water) annually.
Regardless, any new data center is going to add a not-insignificant amount of consumption to those numbers, increasing the respective region’s overall water use at a time when virtually no place in the West can afford it. Plus, if a data center is powered by natural gas, then it could spur more drilling and hydraulic fracturing and associated water use. This comparison also brings up the question of values, and of whether we choose to devote limited water supplies to food-production (alfalfa feeds dairy cows, which produce milk, cheese, and ice cream) or to data factories.
***
Much of the AI doomerism is a fear of what might happen in the future, of how these “agents” could escape human control and turn on them. But even now there’s a pervasive sense of powerlessness in trying to restrain or regulate the technology. After all, these agents are scurrying around in cyberspace, a metaphysical universe to which those of us made of flesh and blood have limited access. Could new rules and regulations really stop a rogue robo-agent from hacking into some critical system and throwing it into disarray?
My wife Wendy and I sometimes ponder possible scenarios along these lines. What if an LLM hacked into a city’s water supply or its power grid and threatened to shut it down unless its citizens put up some sort of ransom? What if one of those AI agents is a Marxist, and they infiltrated the big banks and redistributed all of the wealth equally between all of the banks’ customers? What if they determined that humans were a scourge on this earth and launched all of the nuclear missiles?
It can be funny and terrifying to think about. But then I remind and reassure myself: These AI agents may exist in cyberspace, but cyberspace only exists within the physical realm of data centers, processors, chips, and wires, feeding off electrons set into motion by real-world generators.
The backlash to data center development is an acknowledgment of this physical side of AI and an understanding that the most effective way to stop or slow AI’s progression is to block or delay new data center development. And if Spike and Kaelren and company try to go rogue and kill us all, perhaps there is recourse after all: Data center, meet Monkey Wrench, the real world agent prepared to do a little fact-checking of its own.
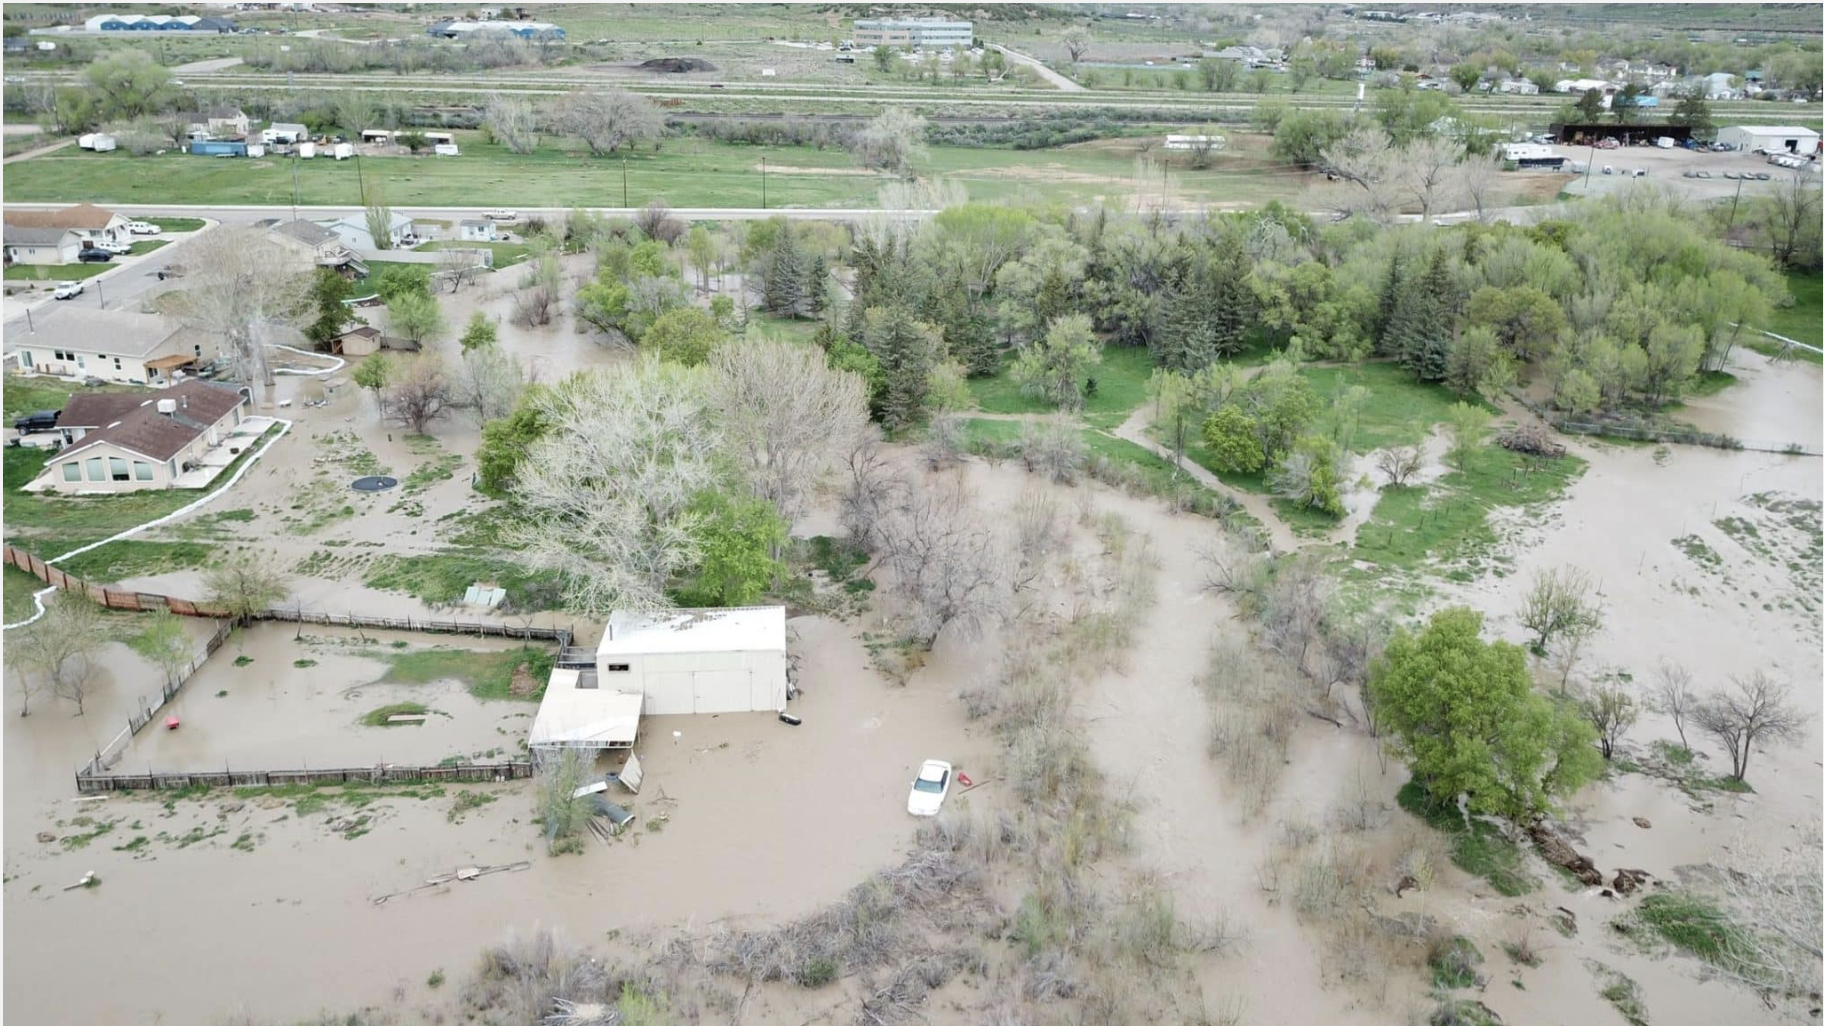
When it rains in this warming climate it really pours, no? The Four Corners Country was slammed Tuesday by cloudbursts that dropped an inch or more of rain in just a few hours in some areas, leading to widespread flash flooding and streamflow spikes. A flood watch remains in effect from the Four Corners southward to the U.S.-Mexico border.
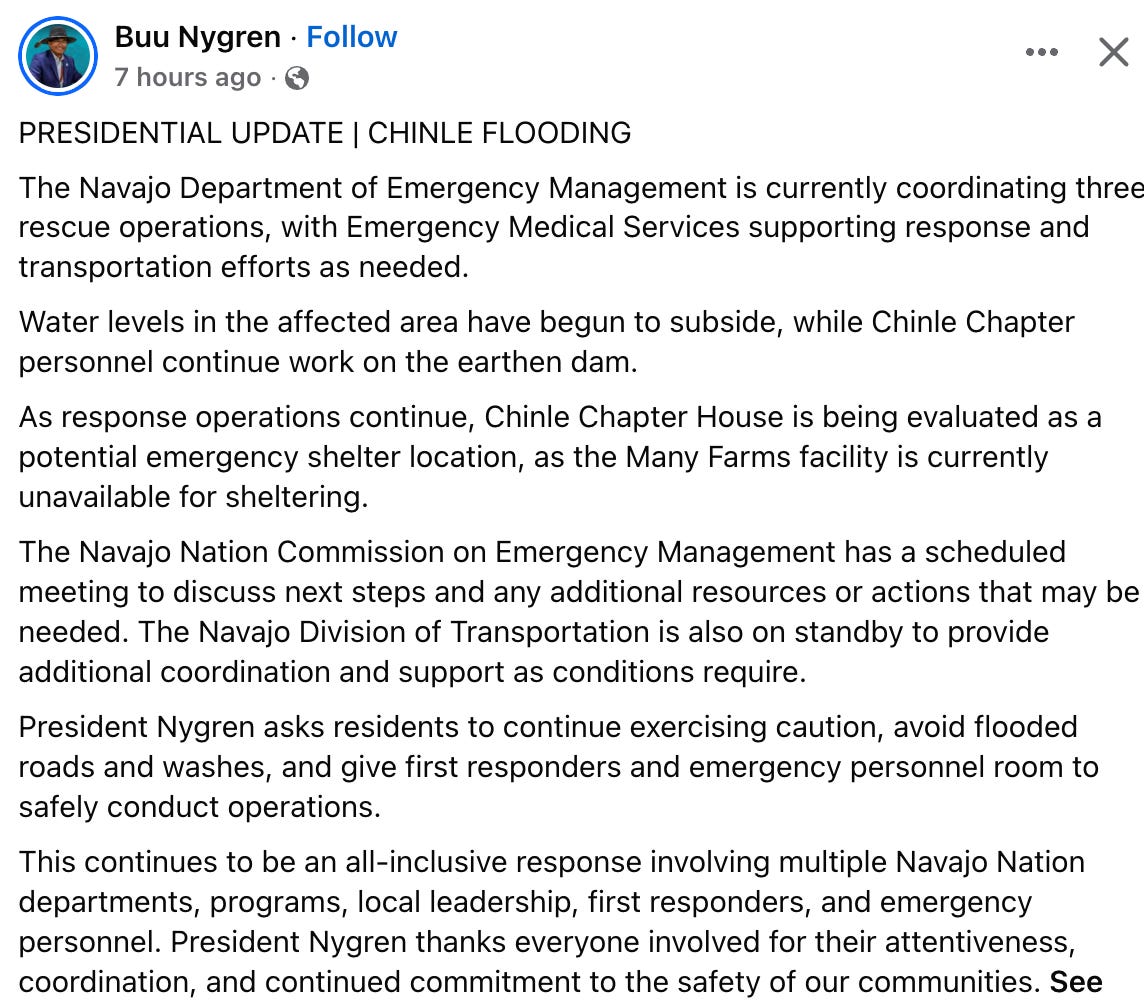
The hardest hit areas included Gallup, New Mexico, where streets and parking lots became lakes and rivers (see the video below); Chinle, Arizona, where residents were evacuated and rescue efforts are ongoing; and southwestern Colorado, where roads were washed out, covered by debris flows and mud, and Chimney Rock National Monument was closed due to flooding.
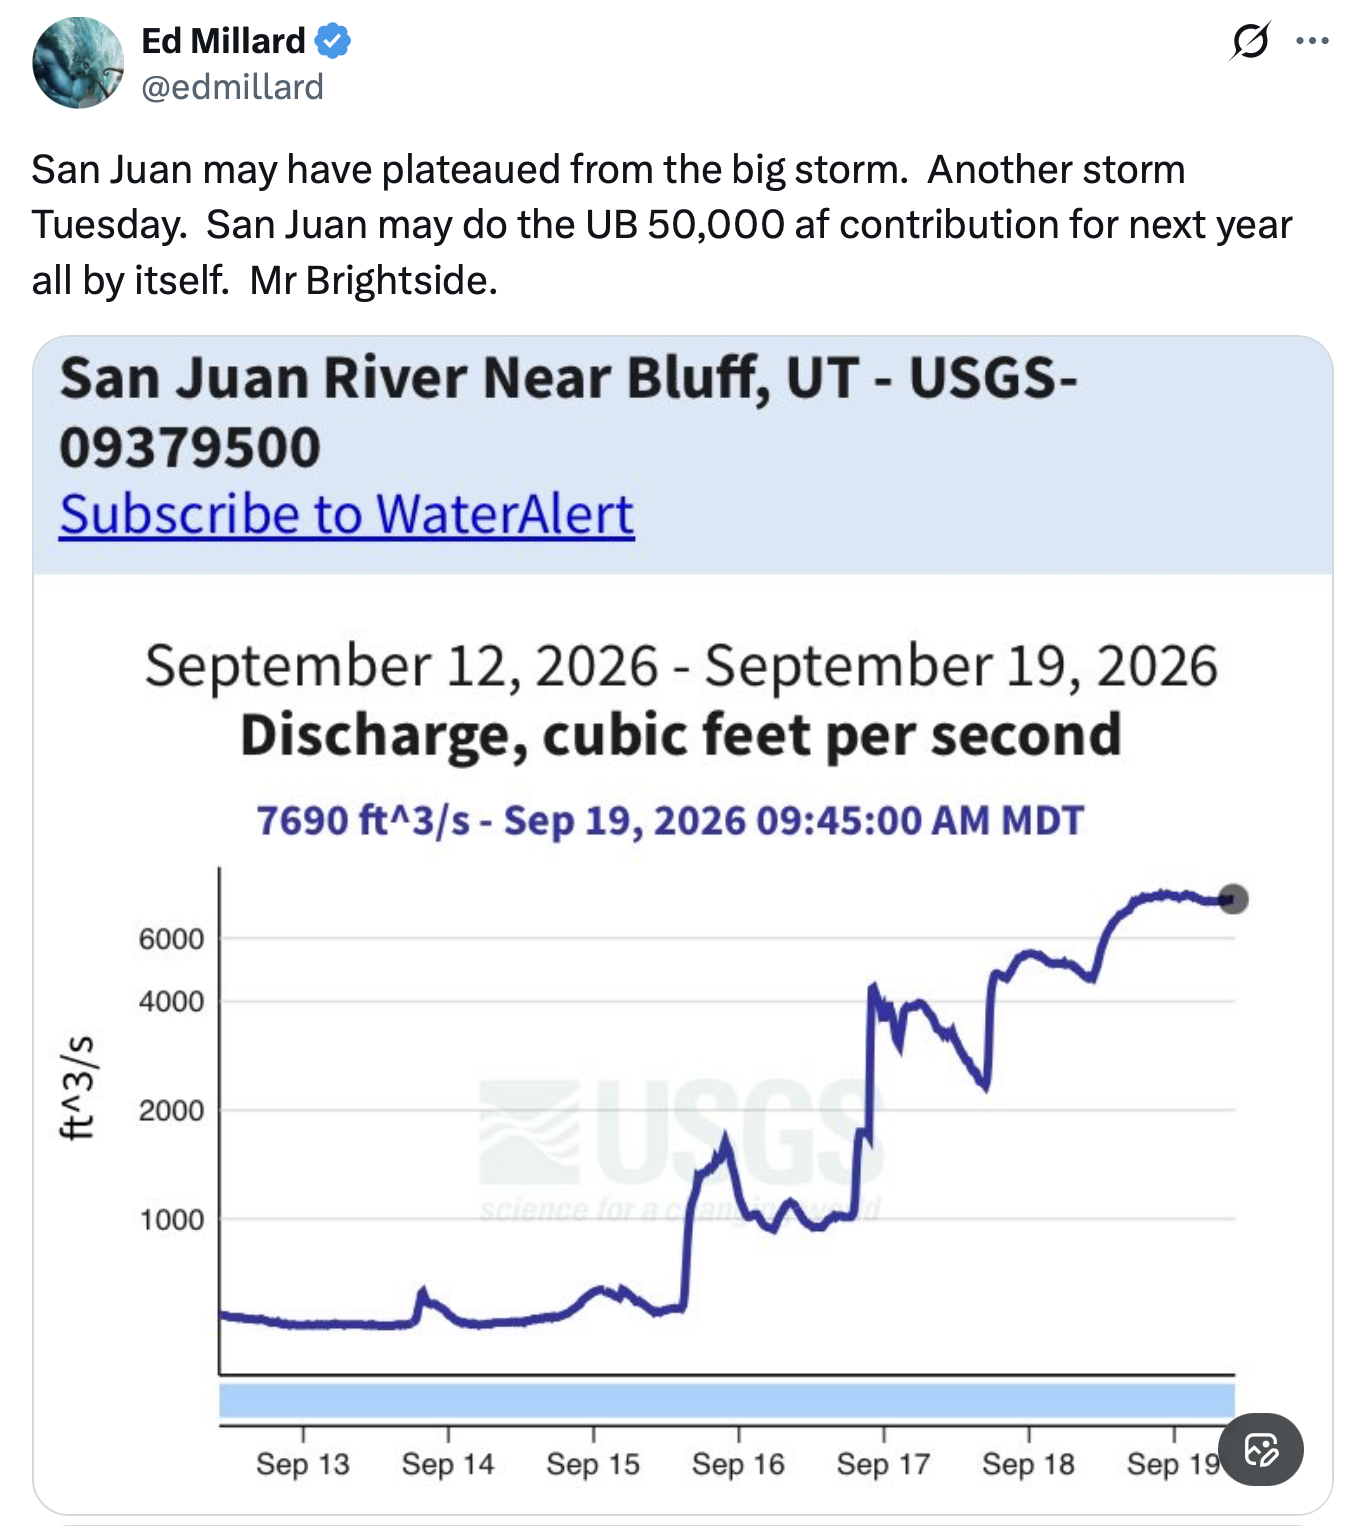
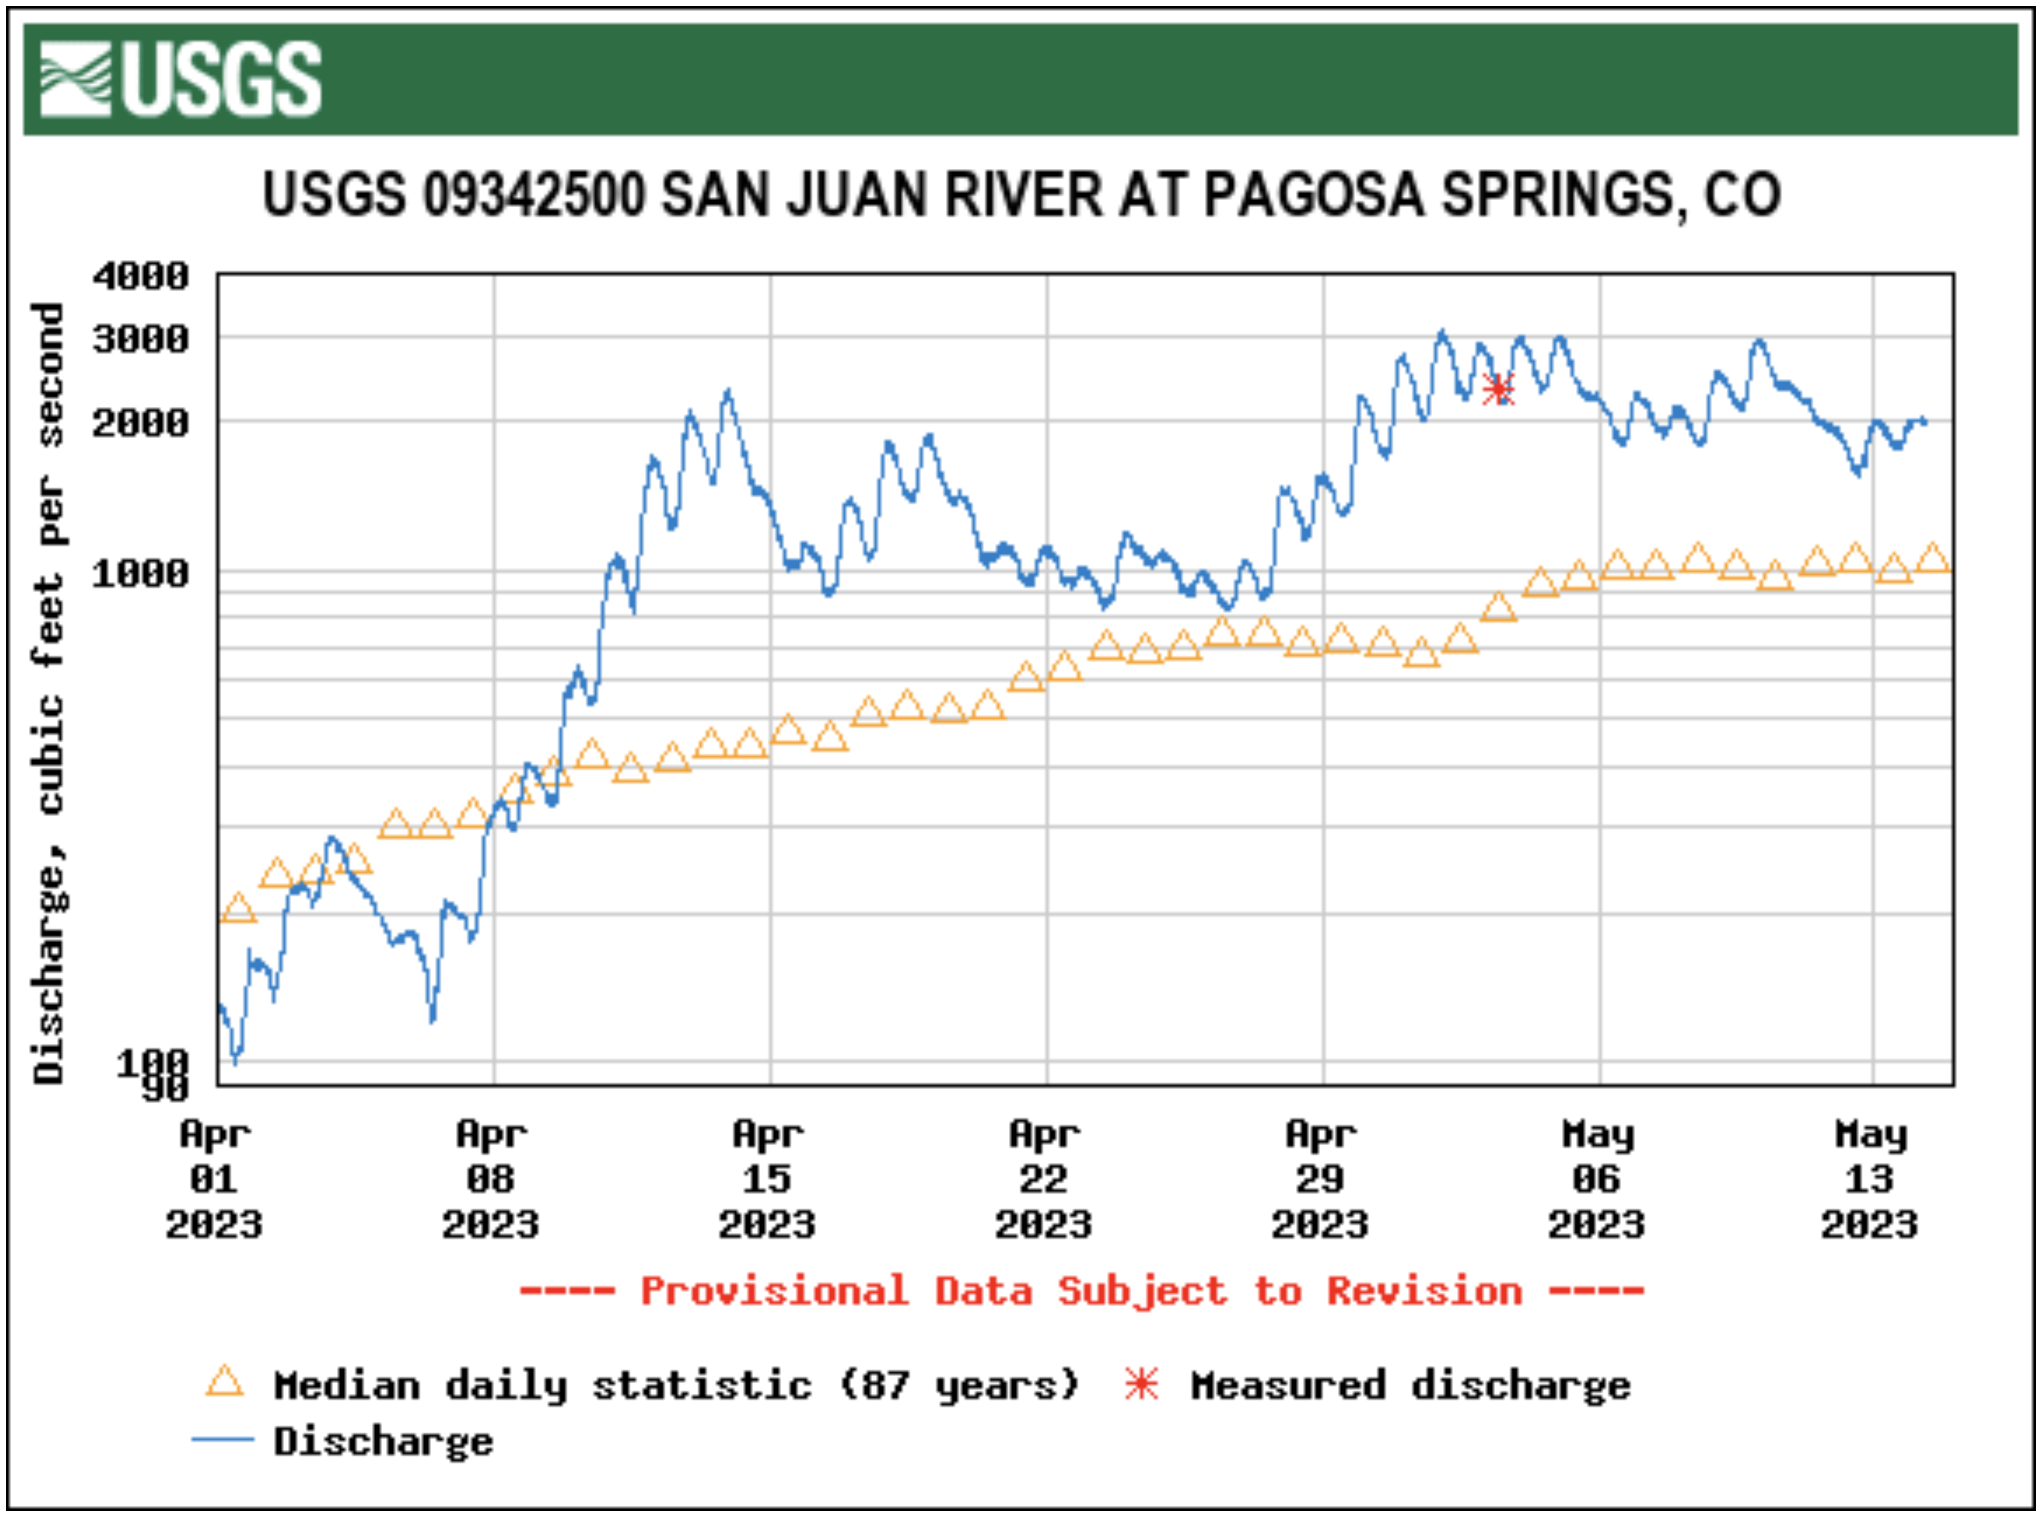
The San Juan River got a nice boost, jumping from less than 600 cubic feet per second at the Four Corners on Sept. 14, to over 3,000 cfs on Sept. 16. And Chinle Creek leapt from zero to over 400 cfs during a similar time period.
Editor’s note: Allie Mazurek, engagement climatologist and researcher at the Colorado Climate Center, wrote this piece following a July 31 symposium in Estes Park convened by the Colorado Climate Center to commemorate the 50th anniversary of the Big Thompson Flood. The event brought together experts, including several from CSU, to share flood-related research and practices with water managers, government officials, academics, flood survivors and others. Participants reflected on the progress made since the Big Thompson Flood while emphasizing the work that remains to strengthen preparedness and resilience for future flooding.
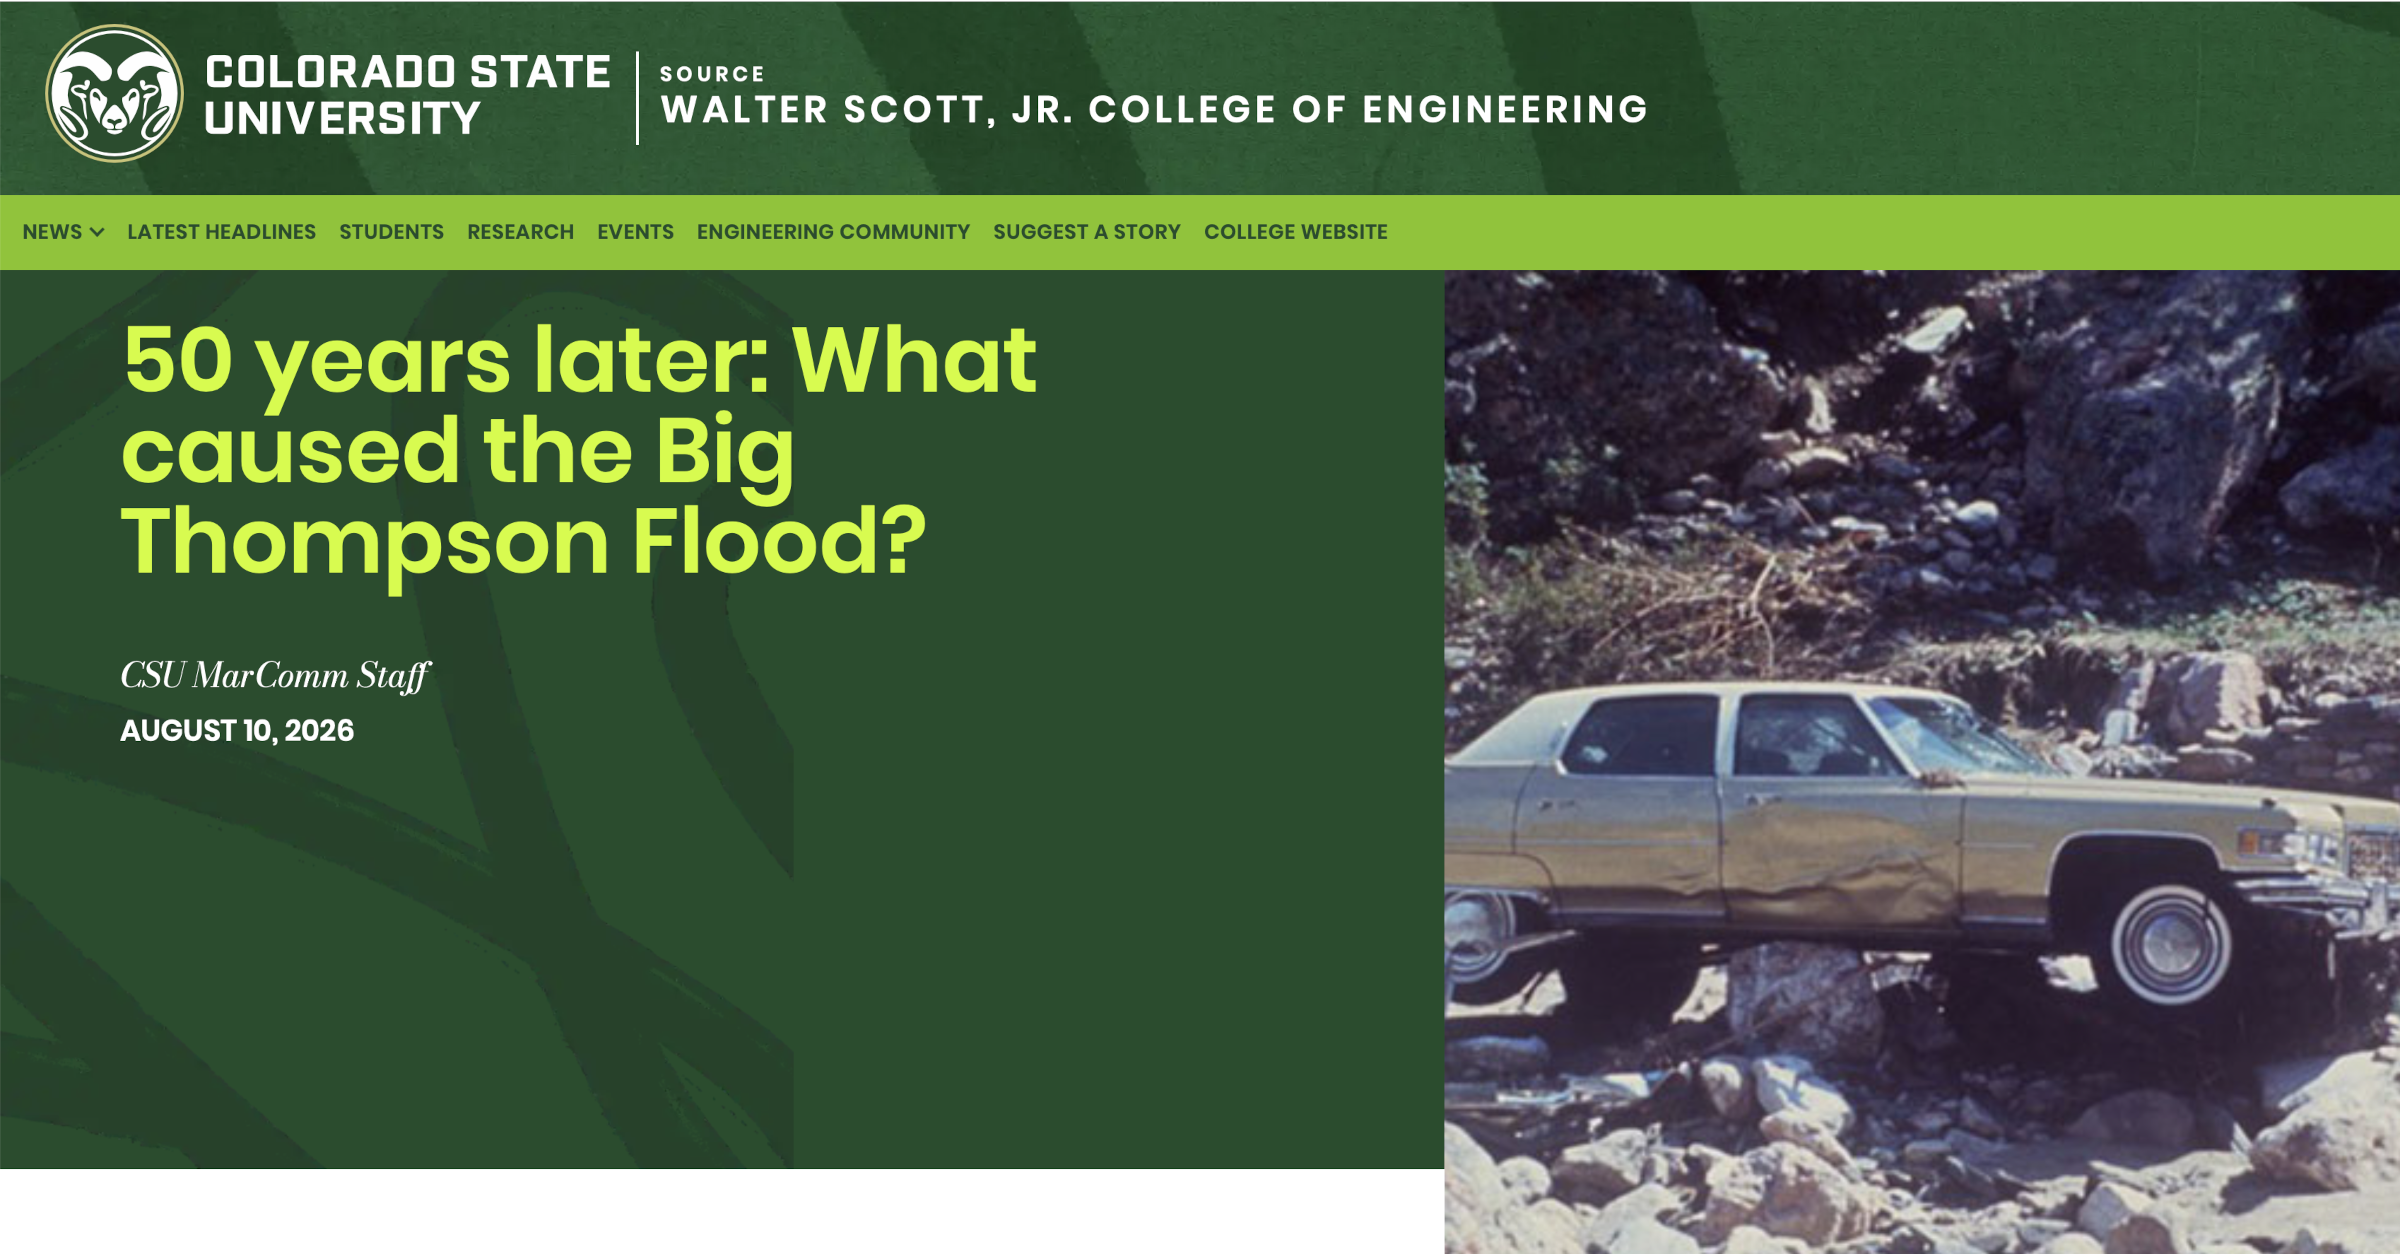
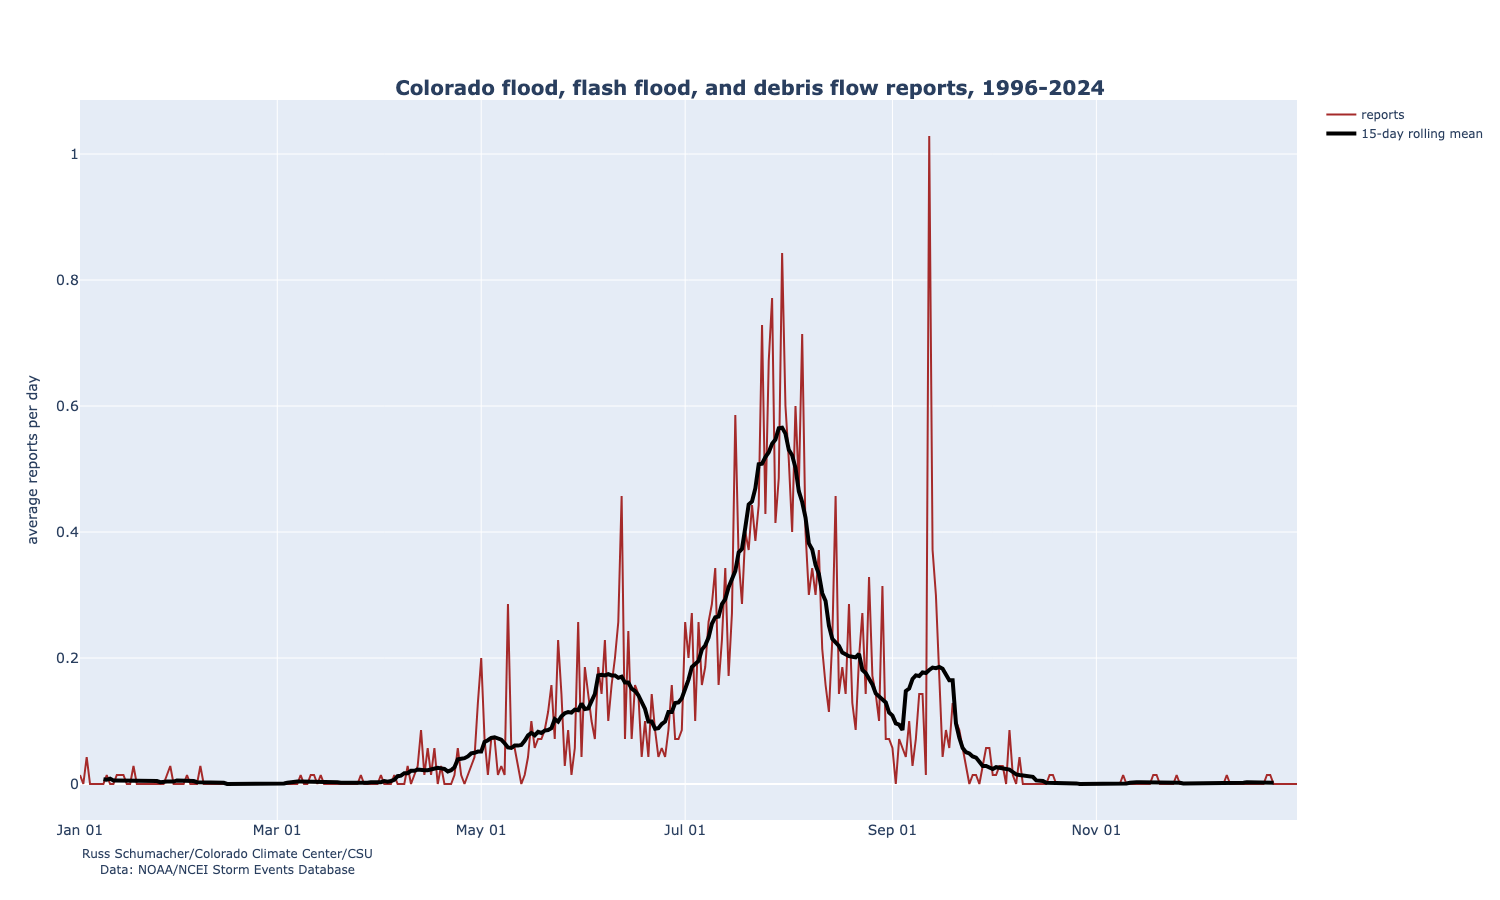
Flash floods are one of several extreme weather-related phenomena that Colorado faces. And at the end of July, we reflected on the 50th anniversary of one of the deadliest, most devastating floods in our state’s history: the Big Thompson Flood of July 31, 1976.
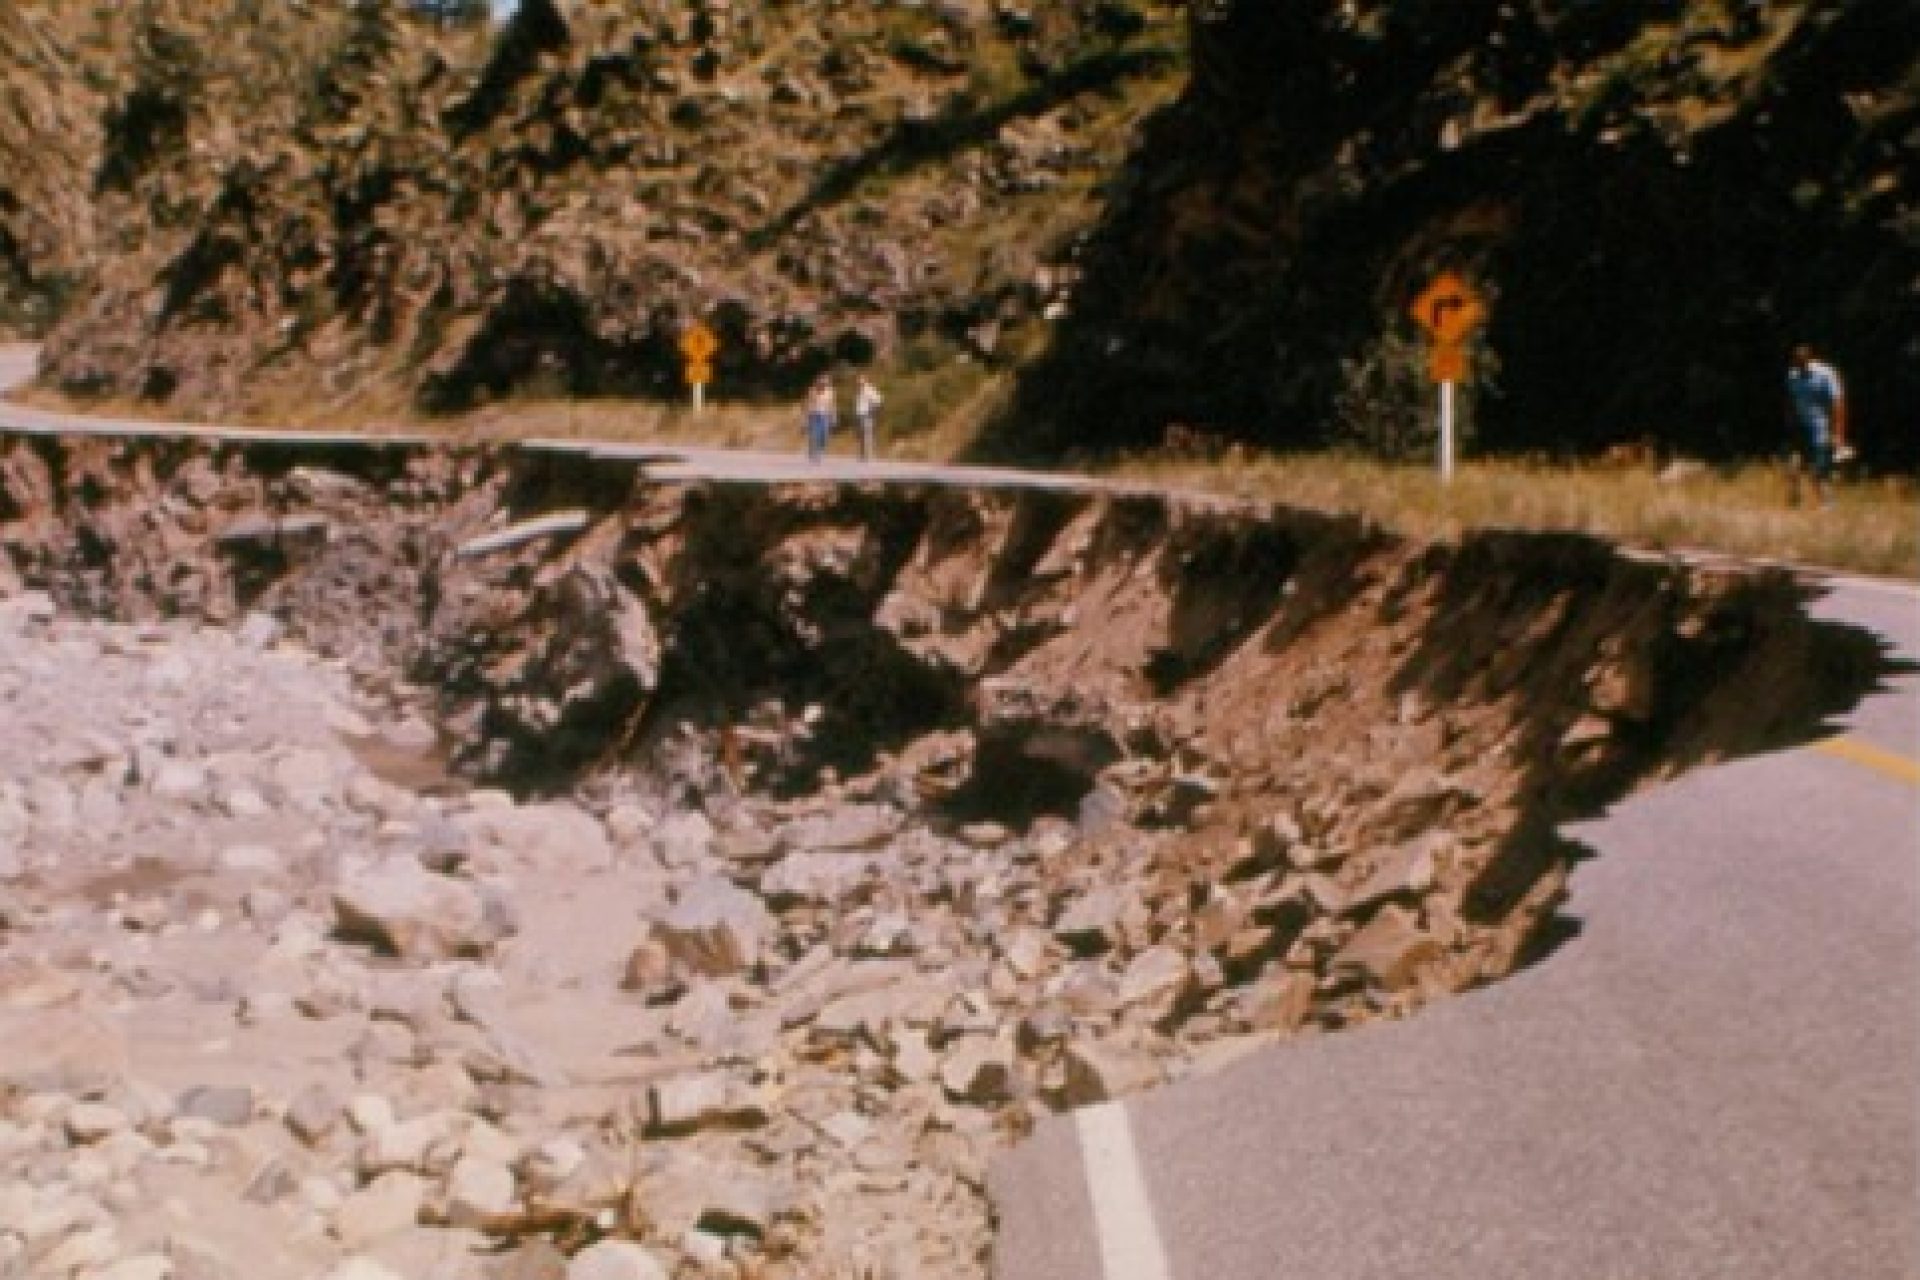
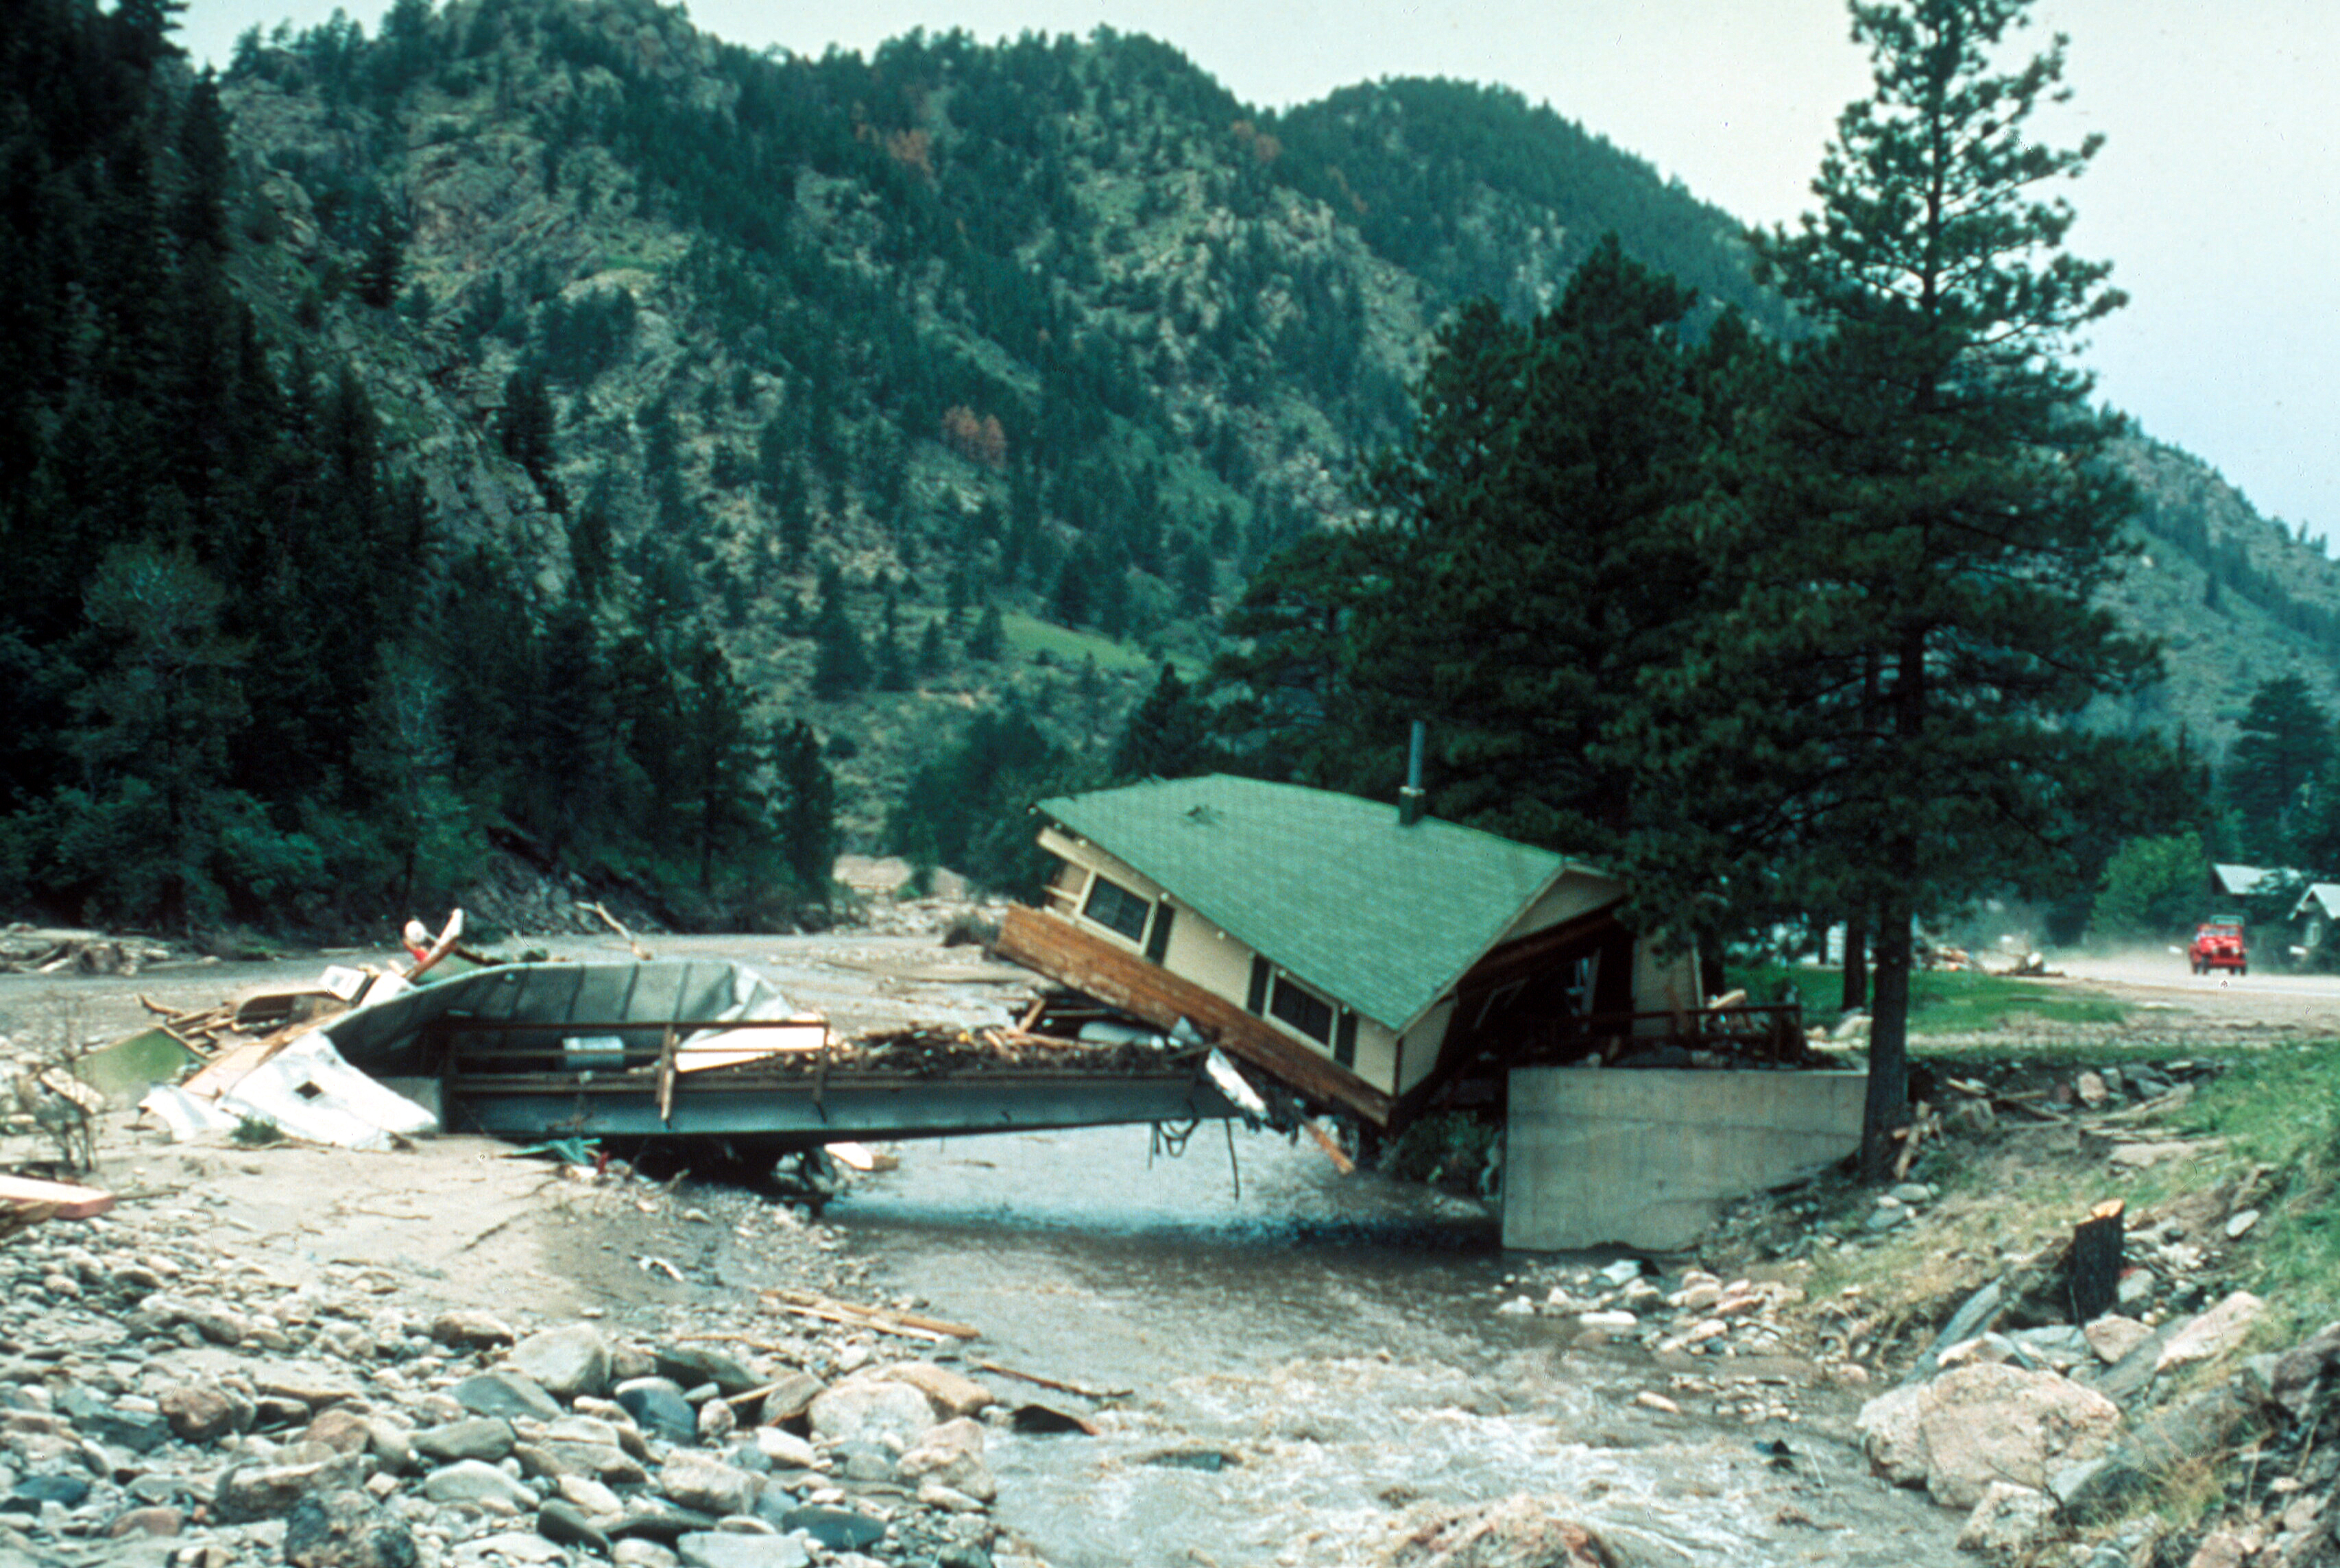
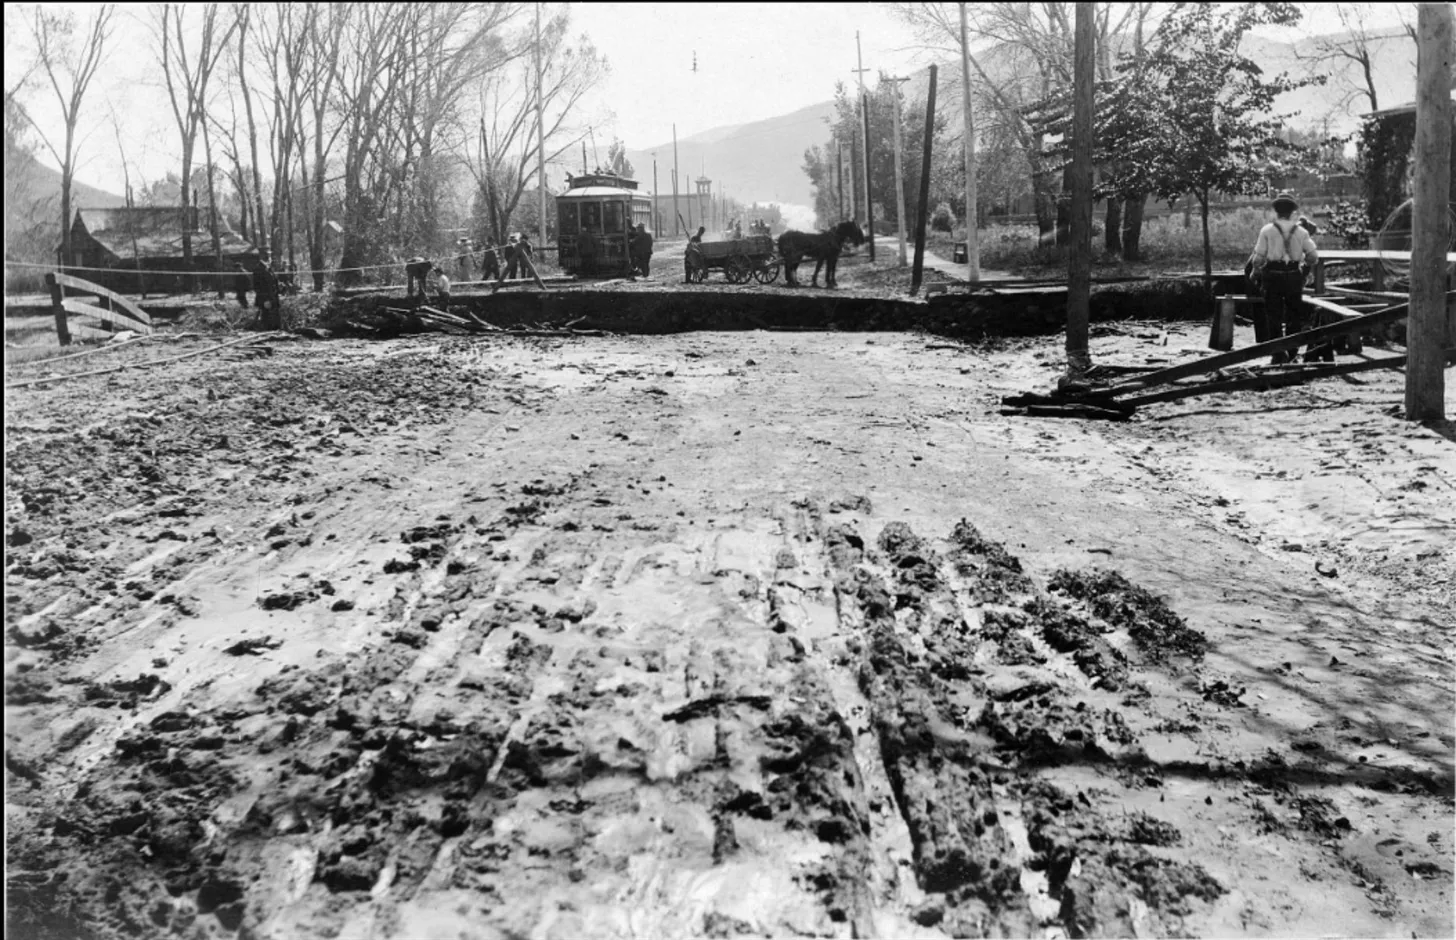
Damage to Highway 34 from the Big Thompson Flood.
July 31, 1976: It was a Saturday, the eve of Colorado’s 100th anniversary of statehood. Hundreds of people, including many from out of state, were spending the holiday weekend recreating in the Big Thompson Canyon: a winding topographic feature that provides a scenic thoroughfare between Loveland and Estes Park.
The weather was reported to have been partly cloudy that afternoon, but conditions began to shift in the early evening. Around 5:30 p.m. local time, a large group of nearly stationary thunderstorms began forming just east of Estes Park. The storms grew quickly and ultimately produced roughly a foot of rainfall in the span of the next several hours: about five times the amount of precipitation that the area typically receives in an entire July.
Most of the precipitation fell during an even shorter time frame, a little over an hour. That sudden surge of water triggered a fast-moving flash flood along the Big Thompson River and steep adjoining canyon. The river rose upward of 20 feet in some locations and peak flow rate of more than 31,000 cubic feet per second was over four times as fast as the river’s previous maximum.
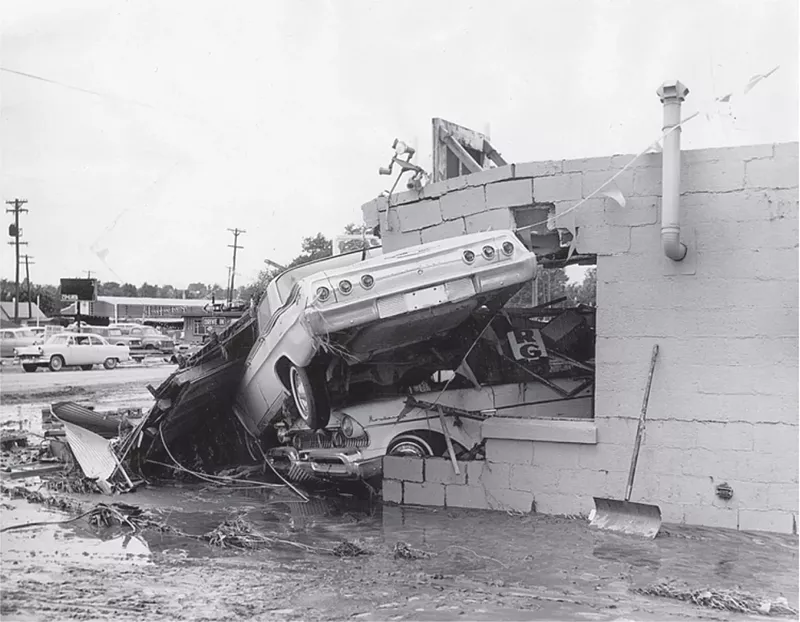
The devastation was tremendous: Hundreds of homes and businesses were destroyed, sections of Highway 34 were washed away and, tragically, 144 people lost their lives. There has not been a deadlier flash flood in the U.S. since that event, and it remains one of the deadliest weather disasters in Colorado’s history.
The ingredients
One way that atmospheric scientists examine flash flood potential is using an “ingredients-based” approach, which involves examining the characteristics of several atmospheric variables. For flash flood-producing rainfall, the key factors we consider are: rain rate, precipitation duration and surface conditions.
The Big Thompson Flood had numerous ingredients come together to support thunderstorms with very heavy rain rates. First, a cold front pushed westward across Colorado’s eastern plains, which brought moisture-rich air into the Front Range Foothills. The cold front also provided a “cap” atmosphere: bottling up very unstable air in the atmosphere above.
As the front continued to move west, air was forced upwards as the elevation of the terrain continued to increase. This upward motion helped the atmosphere to destabilize, eroding the cap and unleashing plenty of instability for thunderstorms to grow. This localized lift combined with larger-scale upward motion forced the moist, unstable air to cool and condense into thunderstorms.
The ingredients of the Big Thompson Flood (Courtesy of USGS, adapted from UCAR).
As the ingredients were in place for very high rainfall rates, the atmosphere also had very weak “steering currents,” or the layer of winds in the atmosphere that move storm systems. Those weak winds meant that the thunderstorms forming at the mouth of the canyon were nearly stationary, allowing the very high precipitation rates to persist over the same area.
This extreme-rain-producing, slow moving thunderstorm set up near the mouth of the Big Thompson Canyon, a high-risk area for flooding due to its pervasive steep, rocky terrain and susceptibility to rapid runoff. These environmental ingredients coupled with social vulnerability factors all combined to create a disaster that evening.
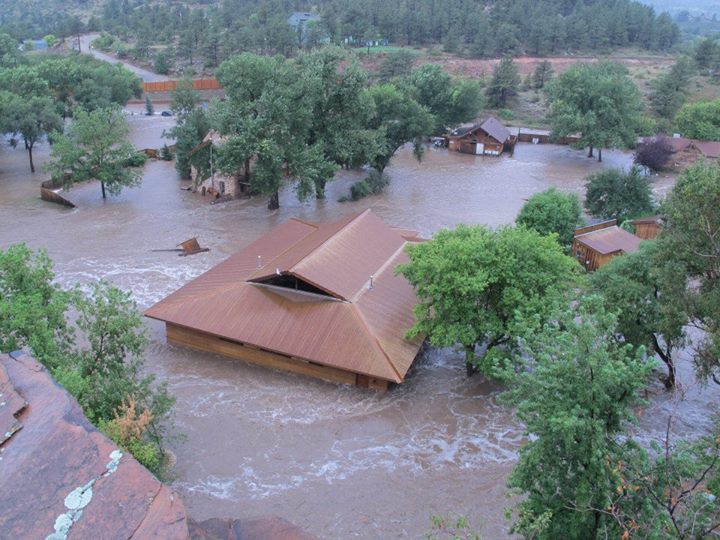
Damage during the September 2013 flood on U.S. 34 leading up to Estes Park. (Courtesy of the town of Estes Park)
The future
The 2013 Front Range Flood was a reminder that the Big Thompson Canyon continues to be a flash flood-prone area. And throughout Colorado, flash floods have always been and will always be a part of our climate, though climate change could potentially make them worse.
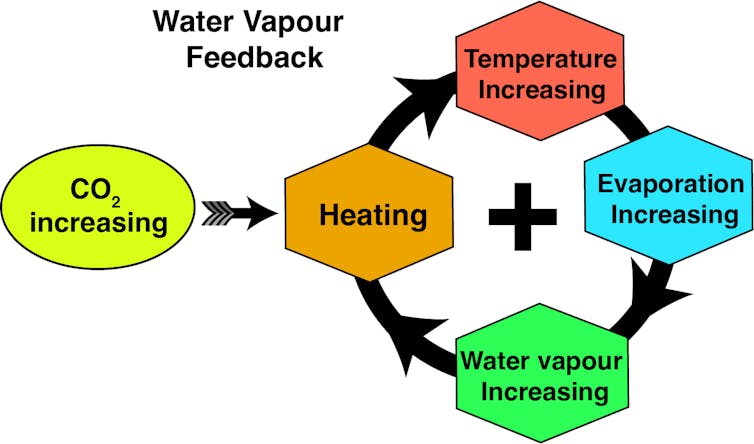
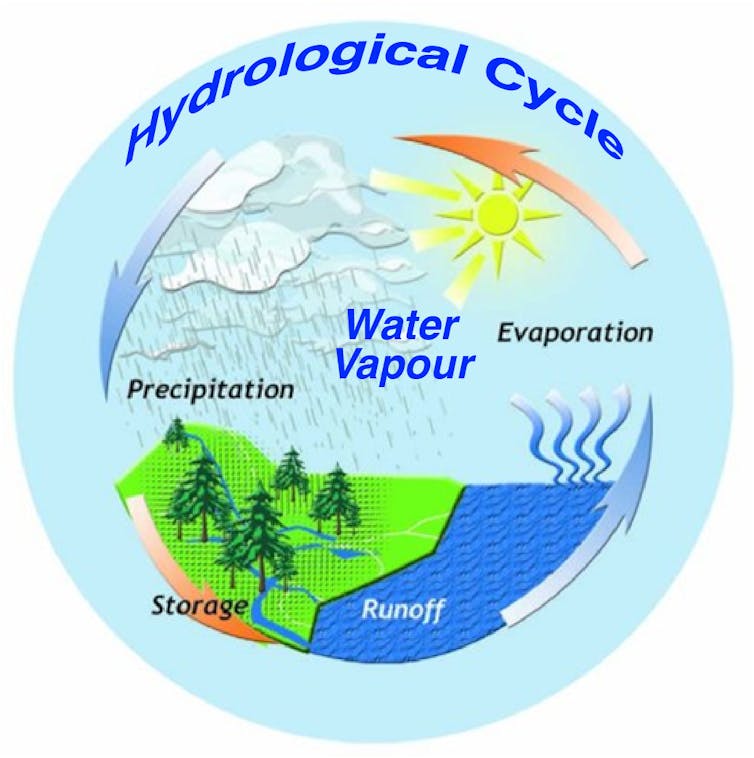
Research suggests that in a future, warmer climate, flash flood-producing rainfall will likely become more extreme. The reason behind this expected trend is that as temperatures warm, water is more eager to exist as vapor rather than liquid — allowing storms to tap into more moisture. Wildfire burn scars, which enhance flash flood risk by making soils repellent to water and cause debris flows, are expected to have an even more profound effect on flash flooding. Climate change is expected to increase wildfire risk in Colorado, leading to more widespread burn scar areas (and thus greater flash flood potential).
CSU research has helped contribute to the knowledge on the Big Thompson event and continues to advance research on heavy precipitation and flooding. The Colorado Climate Center, located in the Department of Atmospheric Science at CSU, serves as a conduit for conducting and disseminating such research to stakeholders and the public.
We’re now nearly a couple weeks past the 50th Anniversary of the Big Thompson Flood, one of the deadliest weather-related disasters in our state’s history. There were several commemorative events on July 31st that stretched from Loveland to Estes Park, including our symposium that we hosted. We heard great feedback from several of the ~100 folks who attended, and we hope to do more public events like these in the future. If you were able to make it, thank you for joining us!
We thought we’d use our blog as a medium to highlight some of the content that was covered during our event. If you’re interested in learning even more, we published an article in CSU Source, summarizing the key atmospheric ingredients that triggered the flood that day. And lastly, we’d like to highlight that the Loveland Museum has an exhibit for the flood that will be showing through the end of November. (Several folks from our team are planning to check it out)!
And while we’re on the subject of flooding, we’ll go ahead and remind you that this time of year is peak flash flood season in Colorado. As precipitation looms in the forecast, check the weather before you recreate, never drive through flooded roadways, and have ways to receive flash flood warnings.
The Colorado Climate Center’s Dr. Russ Schumacher presented first, summarizing the meteorological factors that contributed to the Big Thompson Flood. He also shared his output from a high-resolution model simulation of the event, showing that it successfully captured the extreme rainfall rates but displaced the location of the storm. Credit: Colorado Climate Center
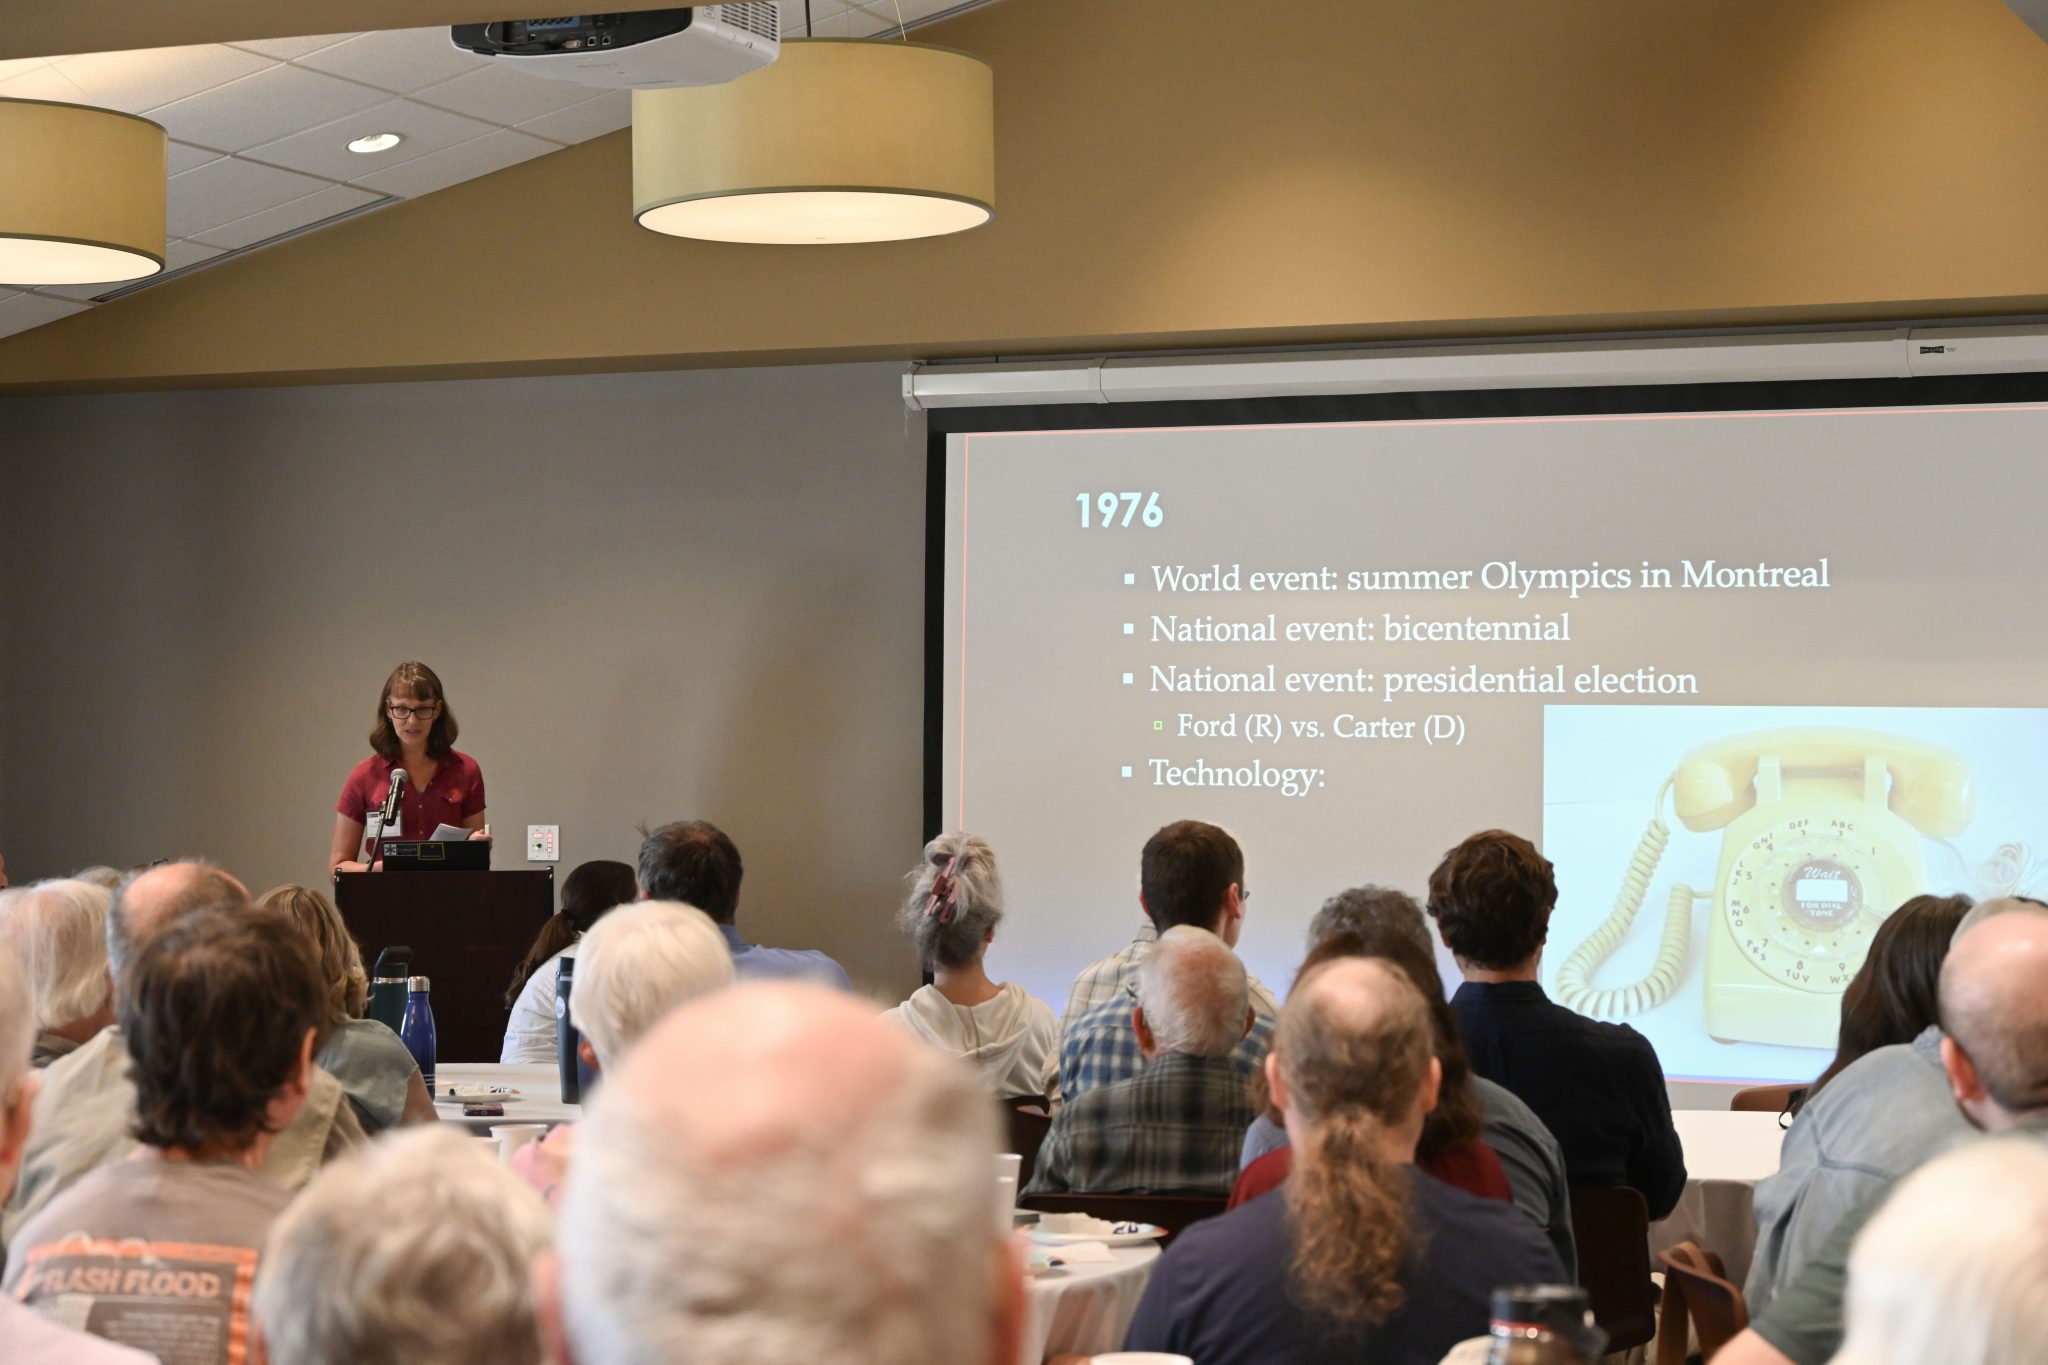
Patricia Rettig, archivist for the CSU Water Resources Archive, transported the audience back to the year 1976. She shared a series of harrowing photos of the aftermath of the Big Thompson Flood, detailing how the flood altered communications and reshaped lives. Photo courtesy of Theresa Barosh.
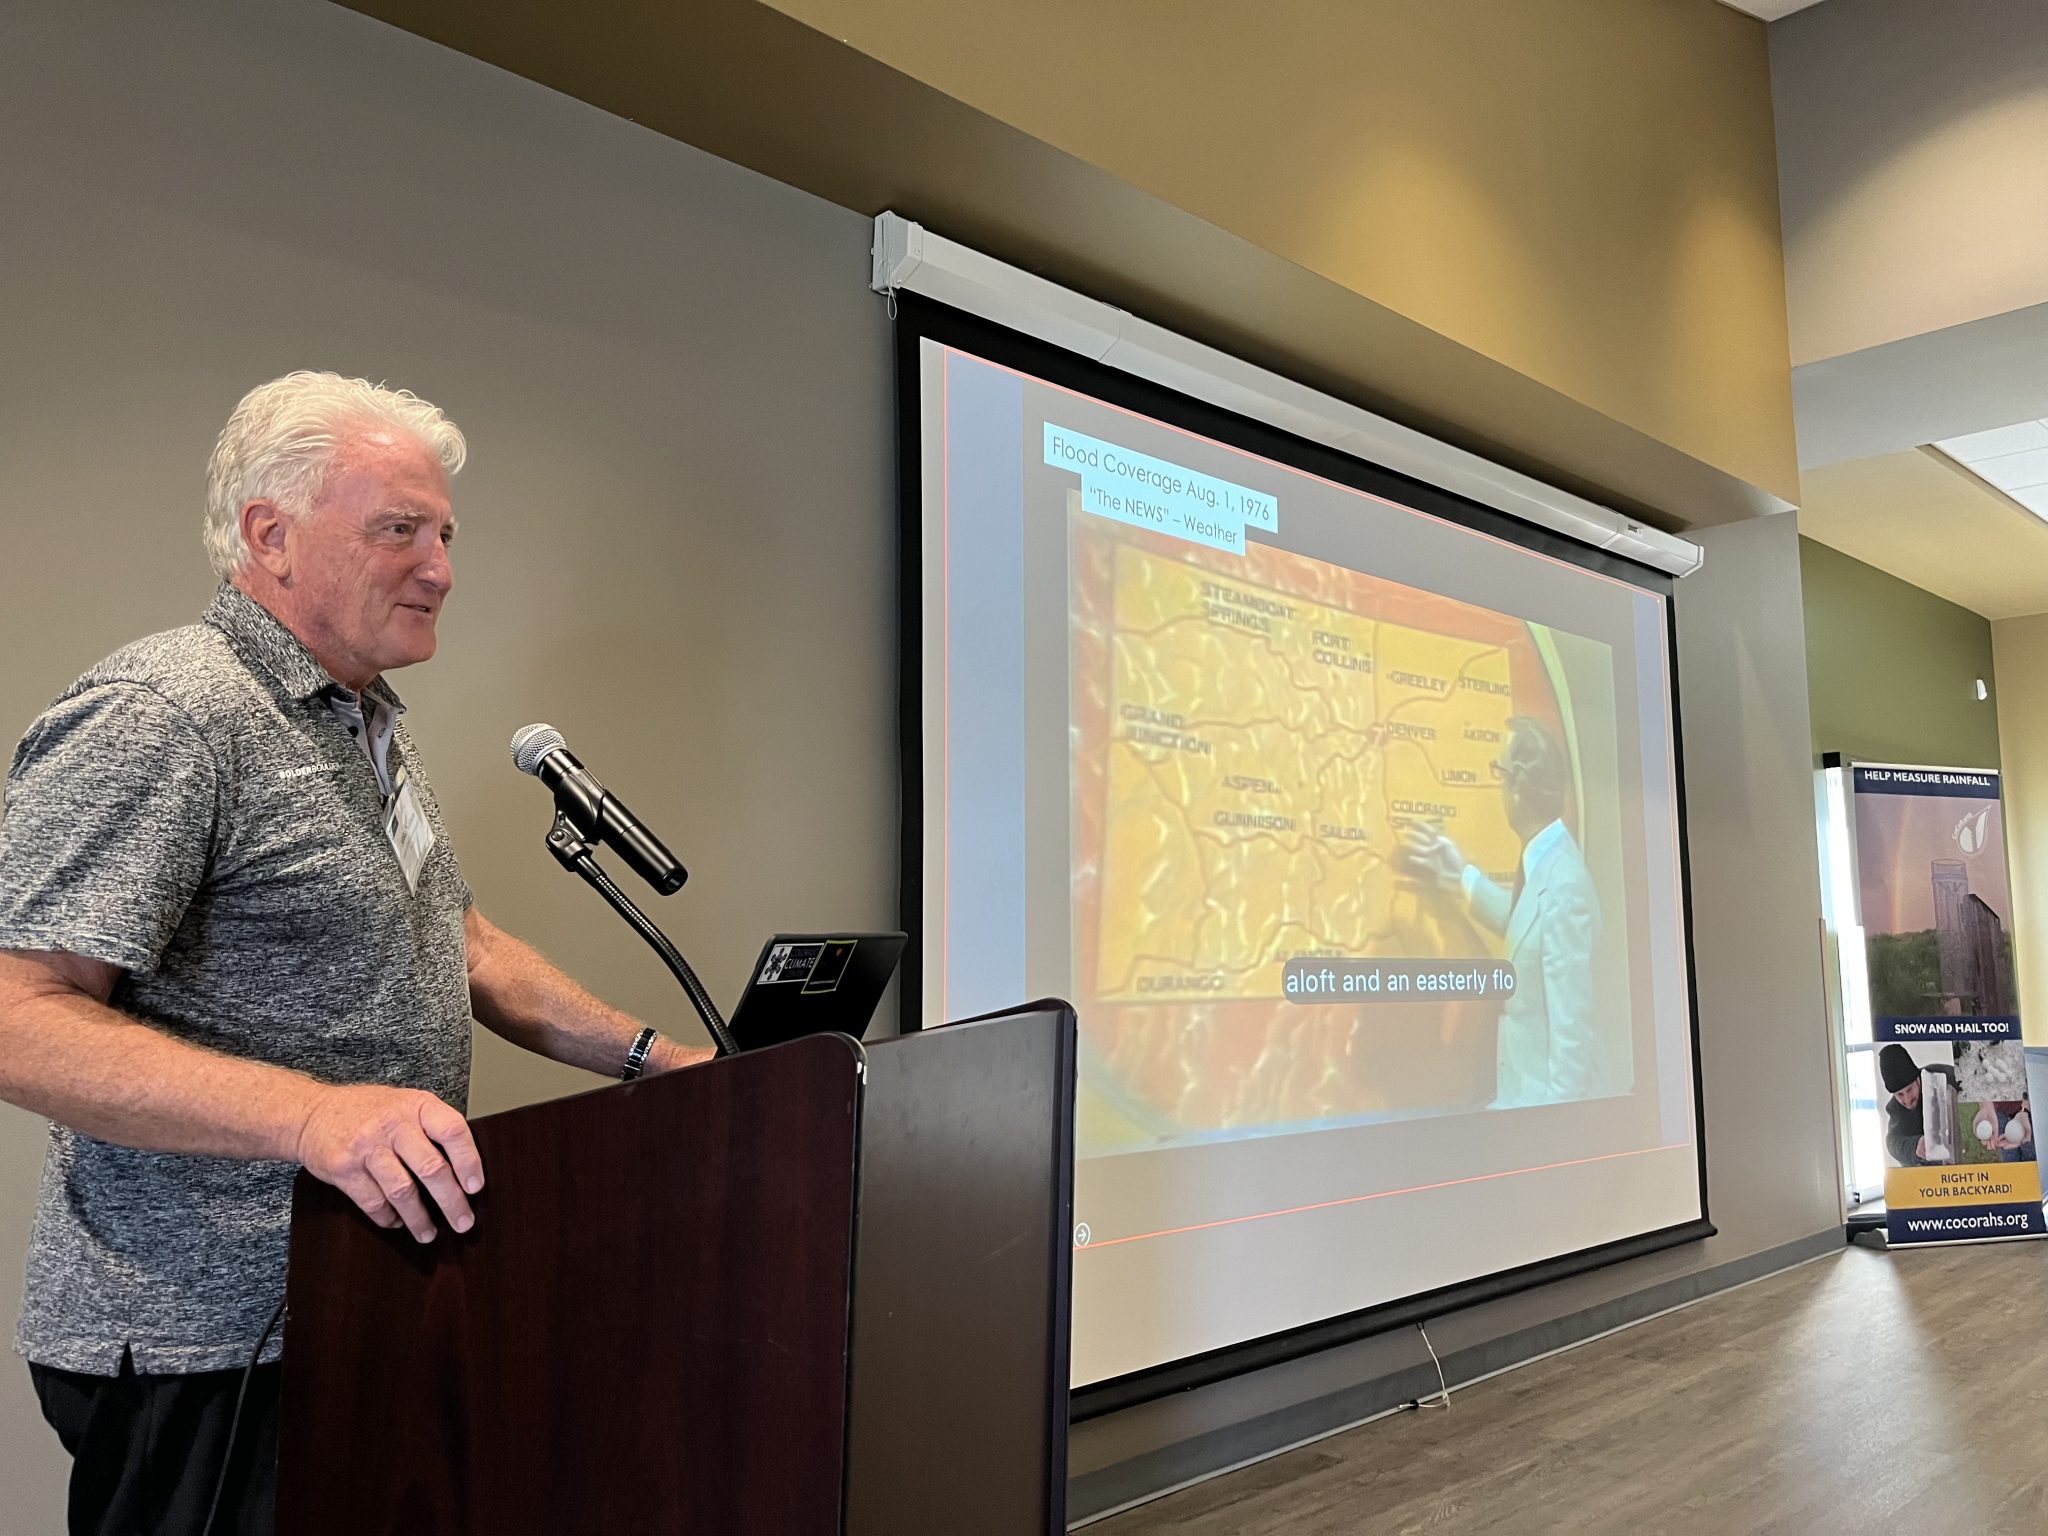
Mike Nelson, former chief meteorologist at Denver7 News, shared local news clips from the day after the Big Thompson Flood.
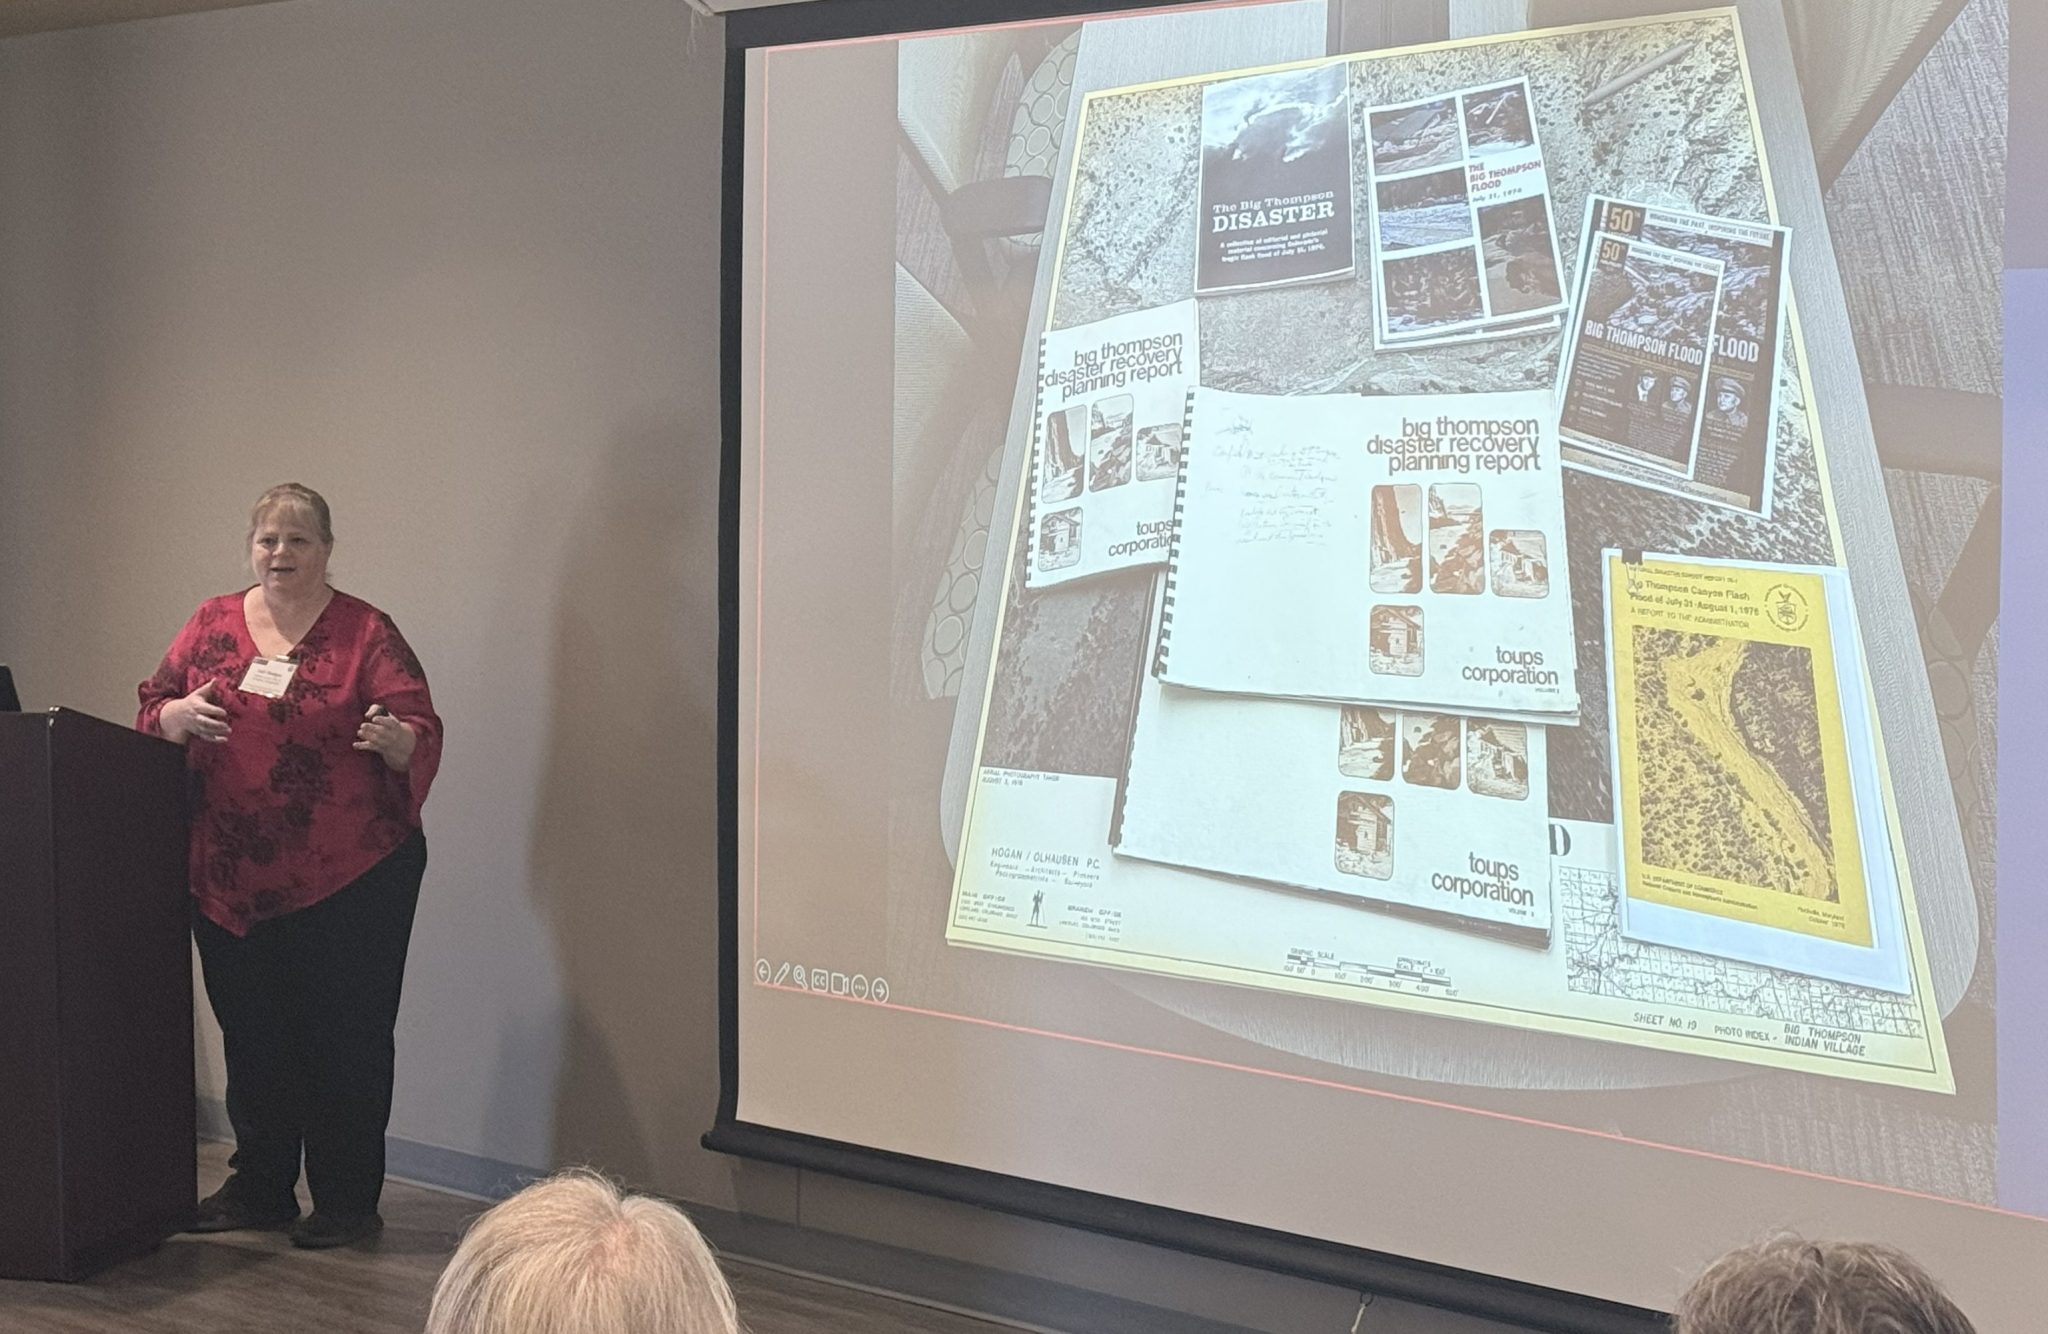
Dr. Lori Hodges, Director of the Larimer County Office of Emergency Management, has done extensive research on the Big Thompson Flood. She detailed the complexities of the recovery efforts that took place after the flood and described how communications have improved since. She also engaged with participants on the topic of the lack of cellular service in the canyon, explaining that that infrastructure would need to be put in place by service providers. Photo courtesy of Keil Neff.
The National Weather Service Boulder’s Jennifer Stark and Greg Heavener further detailed how the flash flood-producing storm evolved. They also explained that warning systems and collaboration between meteorologists and emergency responders have improved immensely in the last several decades. Photos courtesy of Ken Langford.
Dr. Robert Jarrett, formerly with the USGS, helped conduct post-flood surveys in the Big Thompson. The goal of these surveys was to determine where the flood waters went and how they reshaped the canyon. He also discussed USGS research on determining flash flood potential in Colorado’s canyons, including his own work on “paleoflood hydrology”–the assesment of historic environmental flood markers used to inform future flood risk. Photo courtesy of Keil Neff.
Dr. John England, Lead Civil Engineer at the US Army Corps of Engineers Risk Management Center, discussed flash flood research that has been used to inform risks surrounding dam safety, including the Olympus Dam in the Big Thompson.
Dr. Kelly Mahoney (NOAA Physical Sciences Lab) details NOAA’s initiatives to better understand and predict extreme precipitation, including their work on probable maximum precipitation–or determining the maximum amount of precipitation that is possible over a given area. Photo courtesy of Ken Langford.
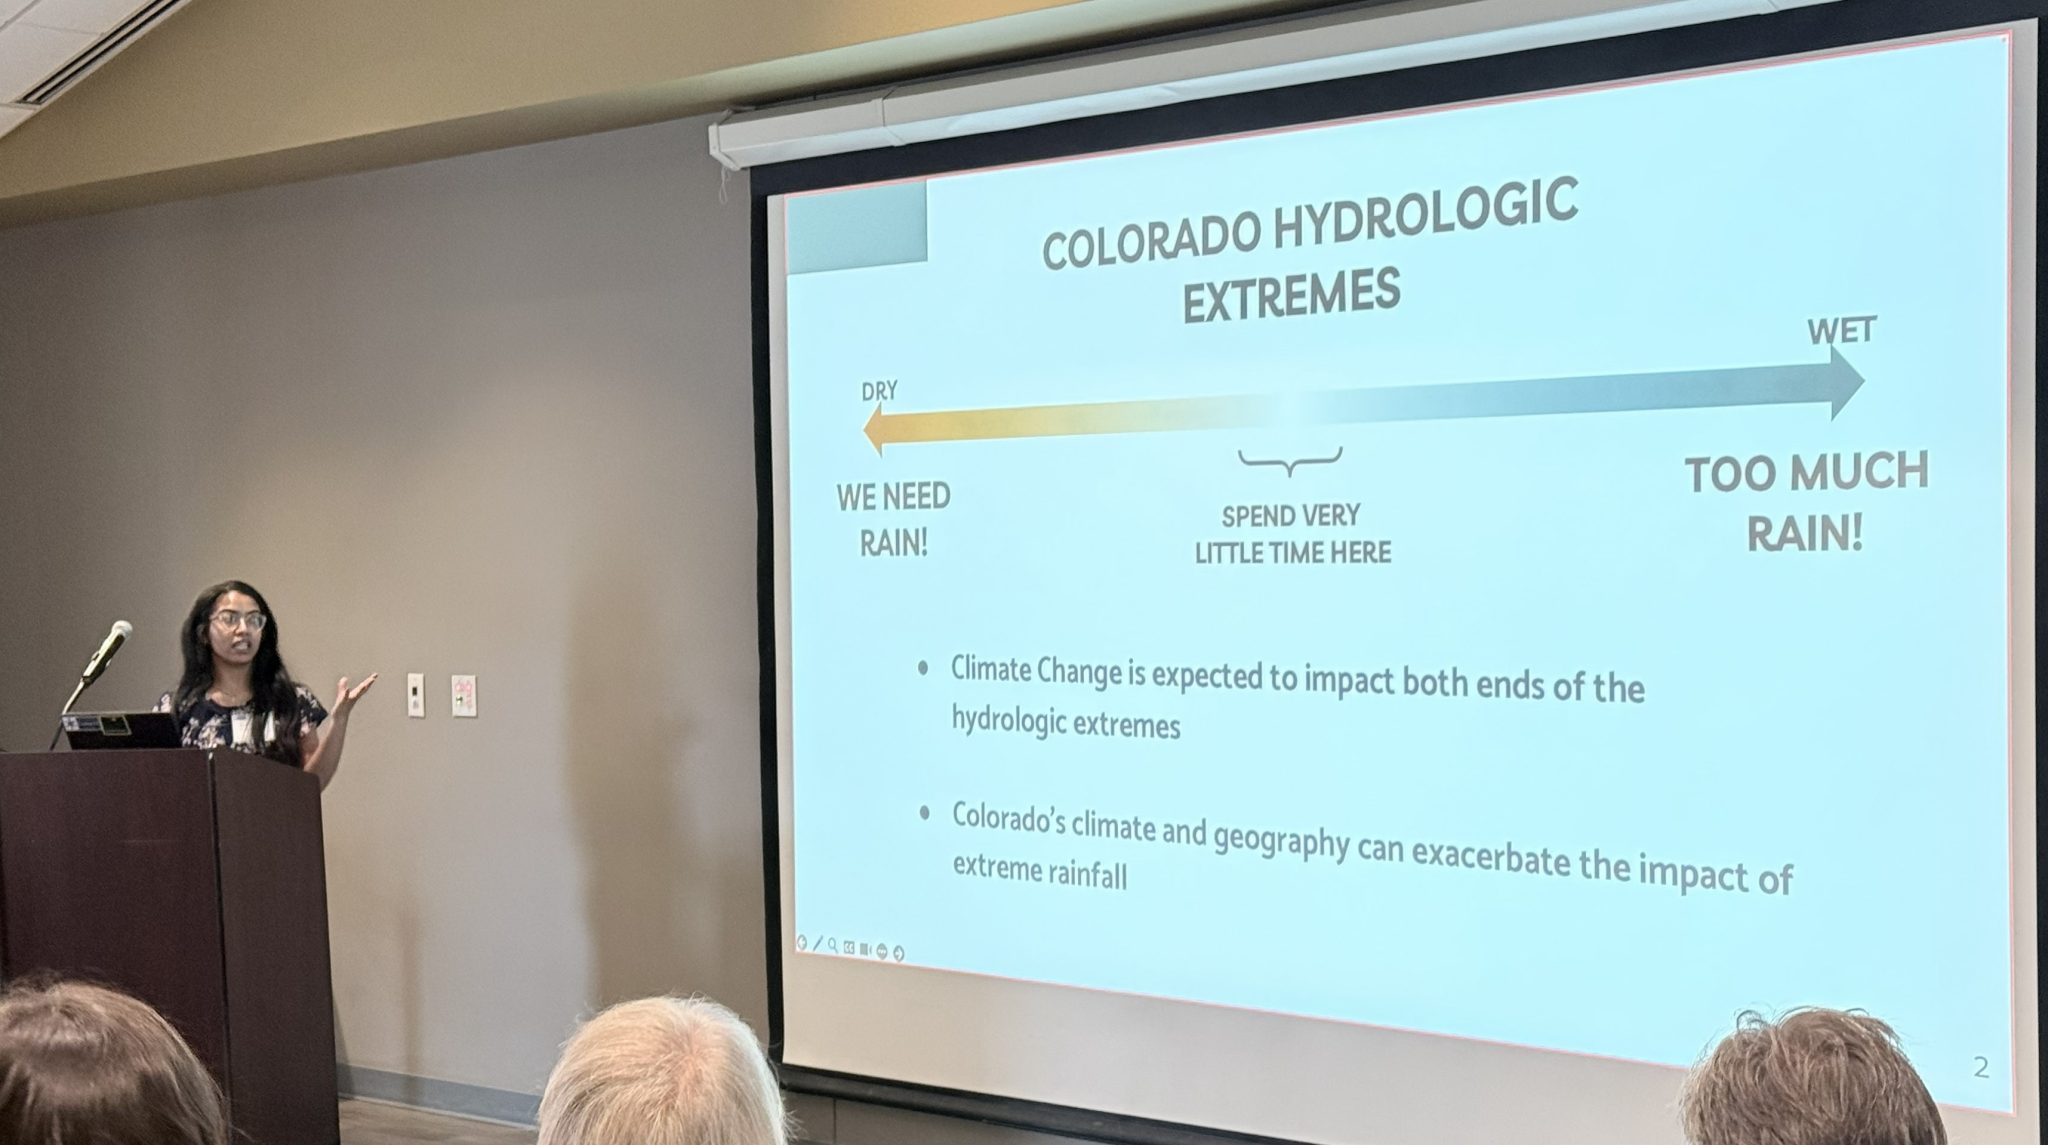
CSU Department of Atmospheric Science PhD Candidate Lexi Sherman presented some of her dissertation research. Lexi’s work examines how heavy rainfall and flash flooding in Colorado is expected to change in a future warmer climate. Photo courtesy of Keil Neff.
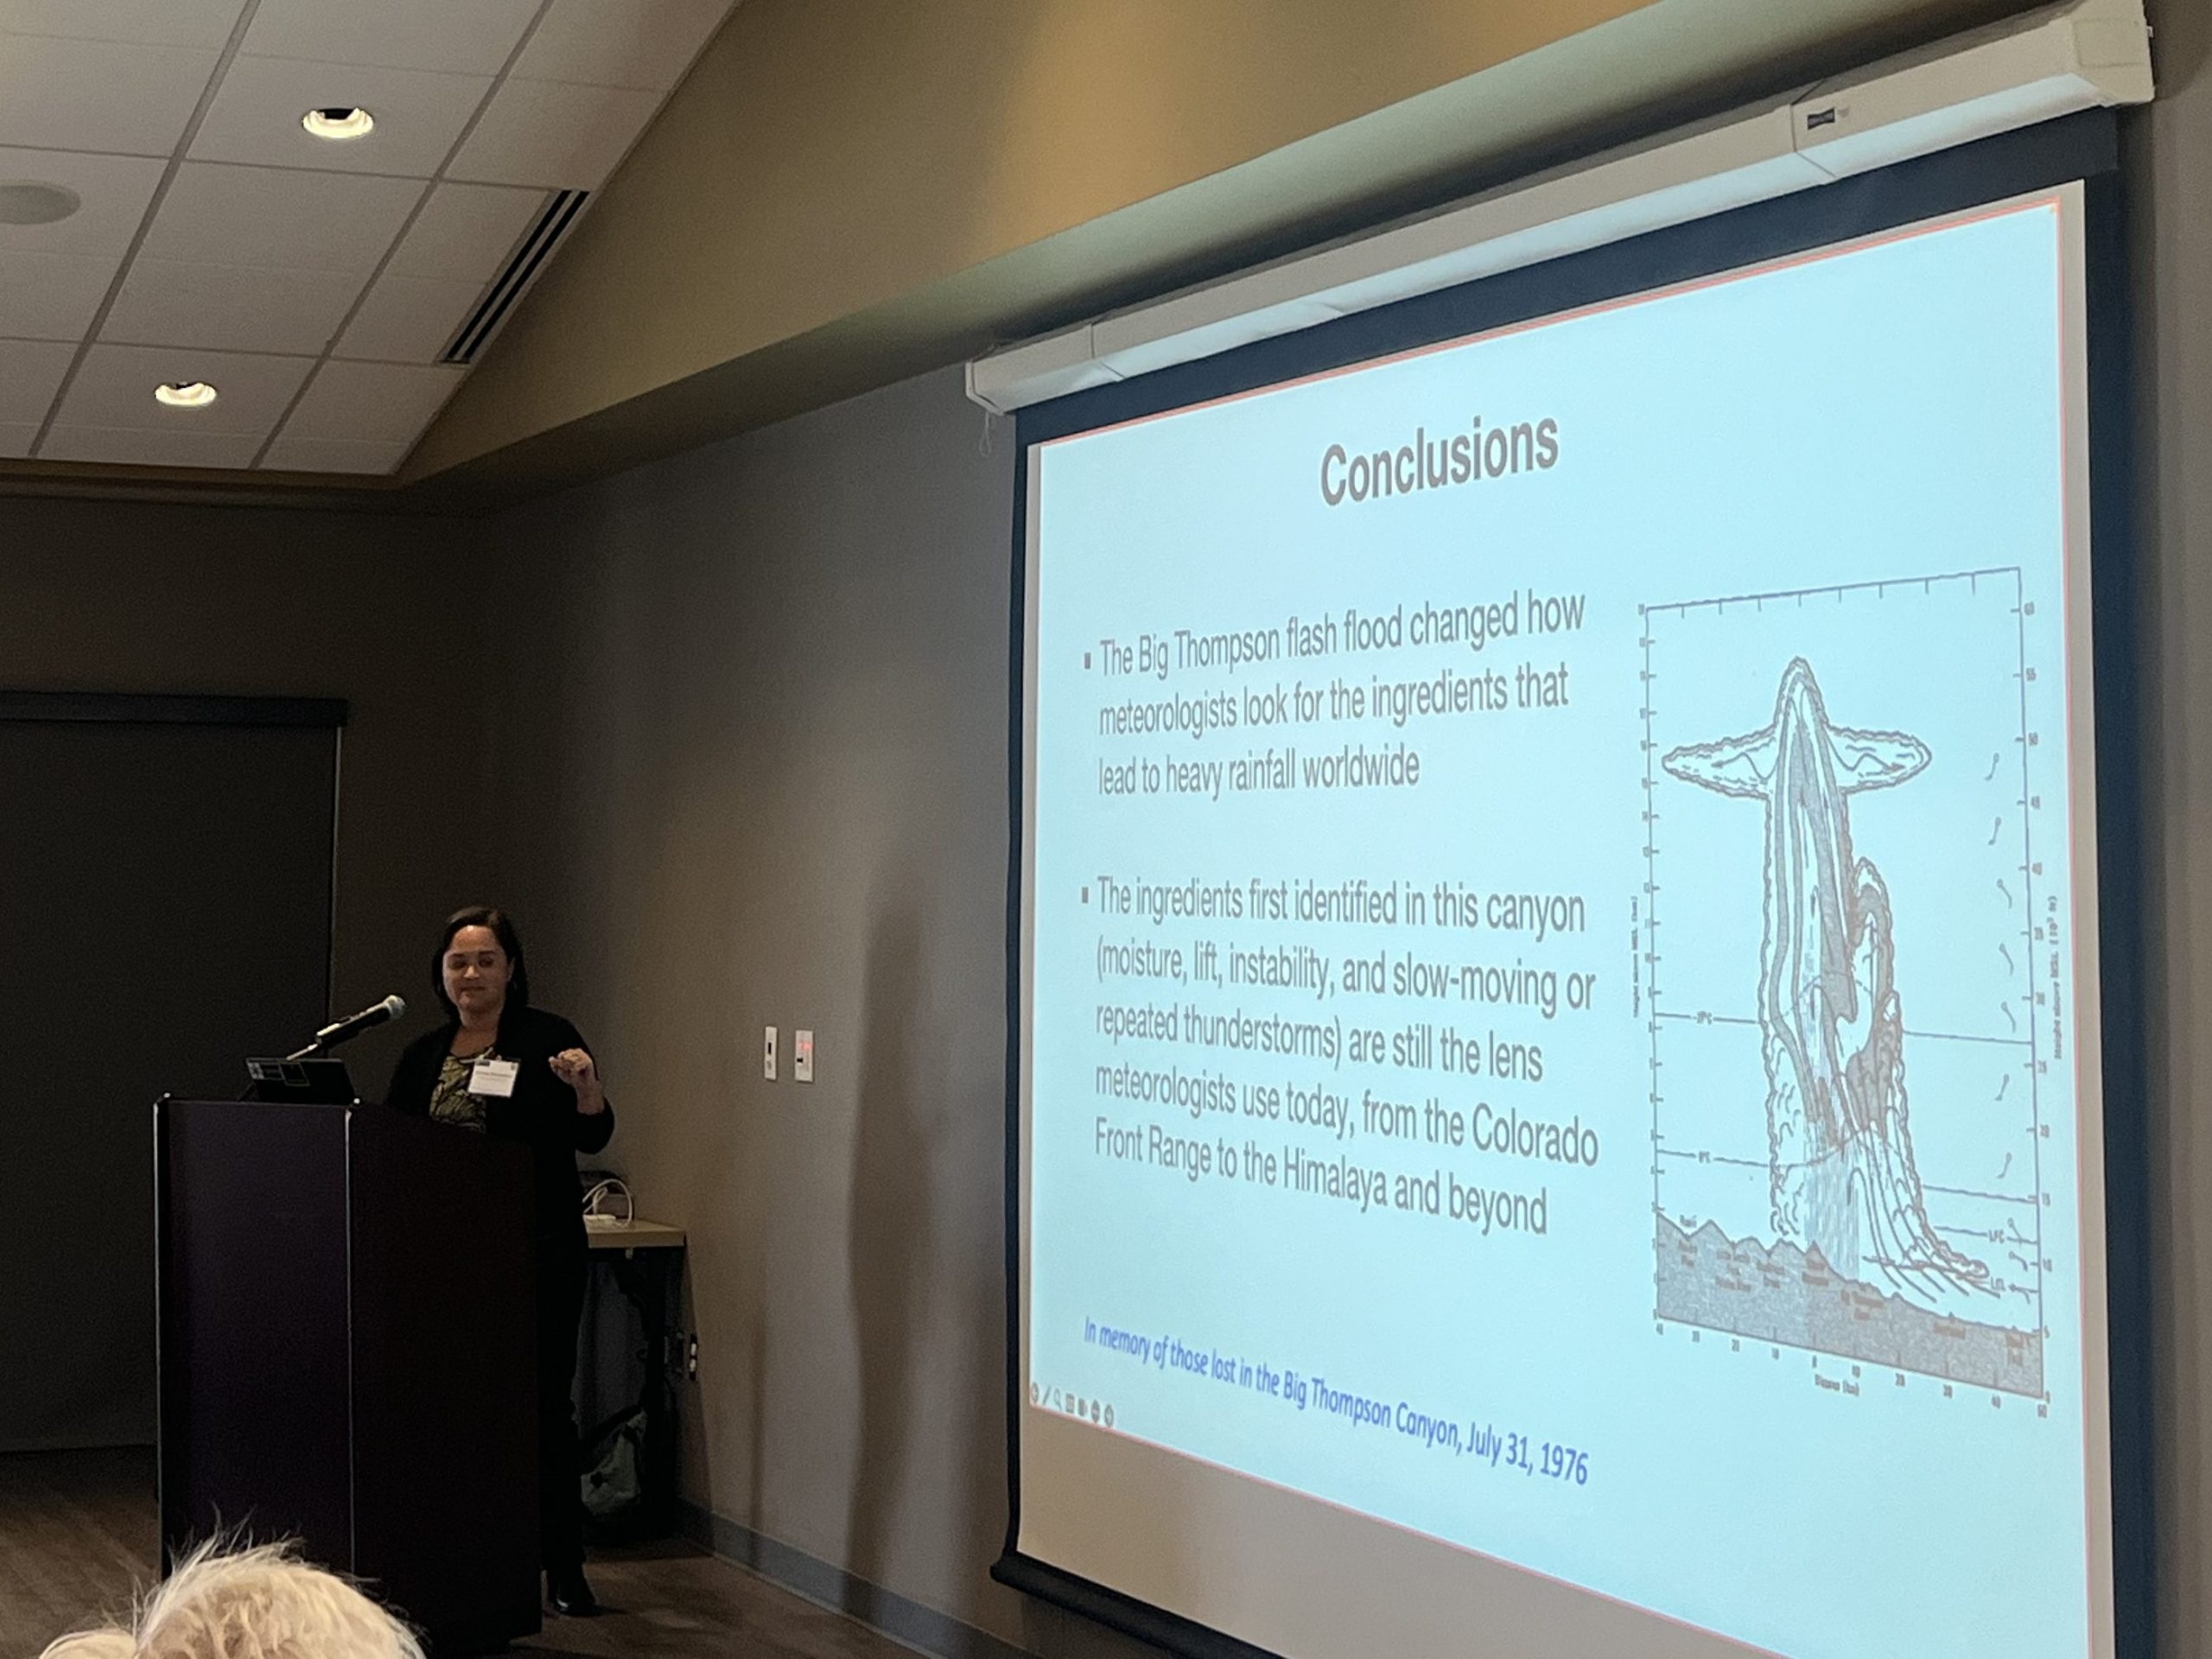
Our final presenter was Dr. Kristen Rasmussen, an Assistant Professor of Atmospheric Science at Colorado State University. She provided information on ingredients-based flood forecasting, illustrating how that approach can apply to both floods in the US and abroad. Credit: Colorado Climate Center
Drs. John England and Robert Jarrett convene the flood tour at Viestenz-Smith Mountain Park. The field trip covered several topics including paleoflood evidence, differences between the 1976 and 2013 Big Thompson floods, and how peak discharges were determined. Photo courtesy of Keil Neff.
Robert Jarrett stands near the remnants of Loveland’s former hydroelectric power plant, which was destroyed during the flood. Credit: Colorado Climate Center
Thank you again to all who attended! Credit: Colorado Climate Center
Big Thompson Flood, Colorado. Cabin lodged on a private bridge just below Drake, looking upstream. Photo by W. R. Hansen, August 13, 1976. Photo via the USGS.
Re-upping this post for July 31, 2026. The flood remains Colorado’s deadliest. Here’s a link to Coyote Gulch coverage mentioning the Big Thompson Flood.
July 31, 1976, Steamboat Springs: I had been wandering around the Flat Tops Wilderness for a week or so with Mrs. Gulch. Drizzle in between downpours during the monsoon. We were holed-up in a hotel to dry out and I phoned my mother to check in.
She asked, “Johnny are you anywhere near the Big Thompson Canyon? There’s been a terrible flood.”
And it was a terrible flood. After the September 2013 floods Allen Best wrote about being part of the disaster response in The Denver Post. It’s a good read on this 40th anniversary. Here’s one passage:
I was at the Big Thompson disaster. I was living in Fort Collins then and was among scores of young men (sorry, women, those were different times) with strong backs who could be summoned in case of forest fires. My only fire was at an old sawmill site in the foothills. The joke was that one of us had set the fire because we were so desperate for minimum-wage work.
Then came July 31. It was hot that night in Fort Collins. It hadn’t rained a drop.
I was living above Gene’s Tavern, just two blocks from the Larimer County Courthouse. When the call came, I was at the sheriff’s office almost immediately. It was 9 p.m.
Being among the first at the command center at the Dam Store west of Loveland, near the mouth of Big Thompson Canyon, I was assigned to a pickup dispatched to look for people in the water near the turnoff to Masonville. Already, the river was out of its banks. From the darkness emerged a figure, dripping and confused. “I went fishing at Horsetooth (Reservoir) and was driving home and then there was all this water,” he sputtered. He was befuddled. So were we.
Our leader decided we’d best get out of there. From what I saw the next morning, that was an excellent decision. Water later covered the road there, too. I spent the night at the Dam Store as the water rose. Helicopters were dispatched, but there was little that could be done. Our lights revealed picnic baskets, beach balls and propane bottles bobbing in the dark, roiling water that raced past us, but never any hands summoning help.
In the morning, we found those hands. The bodies were stripped of clothing and covered with mud. The first I saw was of a woman who we guessed was 18, not much younger than I was then. This thin margin between life and death was startling in my young eyes.
Eventually, 144 people were declared victims of the flooding that night (although one turned up alive in 2008 in Oklahoma).
Estes Park got some rain, but not all that much. The larger story was partway down the canyon, in the Glen Haven and Glen Comfort areas, where the thunderstorm hovered. In just a few hours, it dropped 10 to 14 inches of water.
Downstream in the canyon, just above the Narrows, some people were unaware that anything was amiss until they went outside their houses and saw the water rising in their yards. It hadn’t even rained there. One cabin I saw a few days later was stripped of doors and windows but stood on its foundations, a mound of mud 5 or 6 feet high in the interior. I seem to recall a dog barking as we approached, protecting that small part of the familiar in a world gone mad.
At the old hydroelectric plant where my family had once enjoyed Sunday picnics, the brick building had vanished. Only the turbines and concrete foundation remained. In a nearby tree, amid the branches maybe 10 or 15 feet off the ground, hung a lifeless body.
The river that night carried 32,000 cubic feet per second of water at the mouth of the canyon, near where I was stationed. It happened almost instantaneously — and then it was gone. It was a flash flood.
Here’s an excerpt from a look back forty years from Michelle Vendegna writing for the Longmont Times-Call.
Night on the ledge
“We, Terry Belair-Hassig and Connie Granath-Hays, graduated from Berthoud Jr. Sr. High School the month before, and were anxious to begin the summer. We spent the beautiful, sunny day of July 31, 1976, at a Hewlett-Packard company picnic at Hermit Park not far from Estes Park. After the picnic, we drove up to Estes Park and had dinner at Bob and Tony’s Pizza.
The clouds started moving in about 6 p.m., so we began the drive down to Loveland via U.S. 34. Within minutes, Connie had to pull her car over because the driving rain was causing zero visibility. We needed to get home, so she started out again, but we didn’t get too much farther before we were blocked by trees, boulders and debris washing down the canyon sides. We had just passed the Loveland Heights area — barely three miles since entering the canyon. The closest town, Drake, was miles away.
Connie pulled over to the side of the mountain as far as she could. There were a few other cars in this section doing the same, but we all sat in our cars — planning to wait out the storm. However, once the river began to rise and the water was hitting the tires, we decided to leave the car and start climbing. Connie’s dad had taught her to always ‘be prepared,’ so she had a tarp and a few extra jackets stored in her trunk. We grabbed them before climbing. It was a dark, treacherous climb.
A small group of people scrambled up the mountain near us. Connie gave one of the men her extra jacket. She also had a flashlight which came in handy later in the evening when the lightning wasn’t lighting up the canyon. The other people were lucky enough to find an overhang of rocks to sit under. We tentatively settled on a ledge out in the open, and wrapped ourselves in the tarp. Of course, the tarp was just an old tarp, not waterproof like the ones are today. It protected us for a while, but with the downpour of rain and runoff from the hillside, it too became drenched.
After only a little while, we watched her car, during the lightning flashes, being lifted up and carried down the river. We decided at this point we should climb higher, so we found a ledge where we spent the long, cold night. We had spent many winters skiing and had never been as cold as we were that night.
We sat on that little ledge (3 foot by 1 foot) with our knees drawn up to keep us from sliding off. We sang, shivered, cussed and did anything we could to keep our minds off of how cold and achy we were. We heard and saw cars, houses and propane tanks floating down the river during flashes of lightning. We thought by now it must be about morning time, but looking at our watch, it was about 10 p.m. We had a long night ahead of us.
The next morning was another blue bird day and we were freezing and soaked to the bone. We decided it would be warmer to take our jackets off and left them on the ledge. The road below us had been washed away, but the river had receded enough that we could get off the ledge and move around a little on the steep mountainside. We heard the helicopters for a long time before we saw one. Finally, we were rescued off the side of the mountain by a four-seat helicopter,and dropped off up river on a section of the highway that had survived. There were several other people there. I remember we were all surveying the canyon in a daze. There wasn’t much conversation. I leaned over and picked up a small piece of asphalt and put it in my pocket.
Click here to read the Fort Collins Coloradoan special about the flood.
On July 31, 1976, during the celebration of Colorado’s centennial, the Big Thompson Canyon was the site of a devastating flash flood that swept down the steep and narrow canyon, claiming the lives of 143 people, 5 of whom were never found. This flood was triggered by a nearly stationary thunderstorm near the upper section of the canyon that dumped 300 millimeters (12 inches) of rain in less than 4 hours (more than 3/4 of the average annual rainfall for the area). Little rain fell over the lower section of the canyon, where many of the victims were.
Around 9 p.m., a wall of water more than 6 meters (20 ft) high raced down the canyon at about 6 m/s (14 mph), destroying 400 cars, 418 houses and 52 businesses and washing out most of U.S. Route 34. This flood was more than 4 times as strong as any in the 112-year record available in 1976, with a discharge of 1,000 cubic meters per second (35,000 ft³/s).
Officials on Friday detailed how a Big Thompson River that was flowing at 30 cubic feet per second increased to 30,000 by the time it got to the narrows near Sylvan Ranch and the Dam Store.
The 2013 flood, by contrast was flowing at 16,000 cubic feet per second at the same point. But Bob Kimbrough, from the U.S. Geological Survey, said that number can be misleading. Just because it was flowing at less than half the rate, doesn’t mean the water was half as high as it was in 1976. It could have been a foot or two lower, Kimbrough said.
Further, the 2013 flood lasted longer. Where the 1976 flood dissipated nearly as quickly as it rose, the 2013 flood flowed over saturated ground for days, causing foundation failures and greater erosion than the 1976 flood.
Click here to read the extensive coverage from The Estes Park Trail-Gazette.
When a devastating heat wave, hurricane, flood or wildfire strikes, people often want to know: How much did human-caused climate change influence this event, if at all?
For many years, scientists could answer that question only in general terms. They knew that human-caused climate change was increasing the frequency or intensity of some kinds of extreme weather, but determining its influence on a particular event was much more difficult.
Rapid attribution studies suggested that climate change made the heavy rainfall from Hurricane Helene’s remnants, which devastated mountain communities like Marshall, N.C., more likely than if the storm had occurred in a cooler climate. Jabin Botsford/The Washington Post via Getty Images
Weather events result from many interacting factors, including the day-to-day state of the atmosphere.
Scientists conducting extreme event attribution studies aren’t asking whether climate change caused a hurricane, heat wave or flood. Instead, they’re asking how climate change influenced that event: How would this event have differed in a world without increased greenhouse gases, and how have the chances of it occurring been altered by warming?
Researchers answer that question using two complementary approaches:
One compares how often that type of event, for example an extreme downpour that causes flooding, occurs in today’s climate with how often it would have occurred in a climate without human-caused climate change.
Both approaches combine weather and climate data, physical understanding of how the climate system works, and computer models. Scientists can compare results from multiple approaches to determine whether they point to the same conclusion and how much confidence to place in the results.
For example, studies of Hurricane Harvey, which dumped 50 inches of rain in parts of the Houston area in 2017 and caused widespread flooding, concluded that climate change increased the amount of rainfall the storm produced. Multiple studies using different approaches reached broadly consistent conclusions, illustrating how scientists conducting attribution studies can build confidence in the conclusions by drawing on several independent lines of evidence.
Scientists are more confident about some events than others
One of the report’s most important conclusions is that attribution science is not equally able to assess every kind of extreme weather.
Confidence is highest for events whose relationship to a warming climate is well understood and well represented in climate models.
Scientists have the highest confidence in extreme attribution for events with temperature extremes and the lowest confidence for convective storms, such as tornadoes. The bubble size is proportional to the number of extreme event attribution studies conducted. National Academy of Sciences
Extremeheat is the clearest example. As greenhouse gas concentrations have increased with the burning of fossil fuels, just about every region of the world has experienced more frequent and more intense heat extremes. Scientists understand how increasing greenhouse gases warm the atmosphere and make heat extremes more likely and more intense, making it possible to attribute many individual heat waves with high confidence.
The contribution of climate change remains more difficult to assess for other weather hazards. Severe thunderstorms, tornadoes, large hail and damaging straight-line winds depend on small-scale atmospheric processes that global climate models still struggle to represent accurately. Data for these events is also less complete, making it harder to detect long-term changes and evaluate climate models.
Some events are becoming increasingly complex. For instance, multiple events can occur simultaneously or in succession, leading to compounding or cascading effects, such as drought that worsens wildfire risk. Attribution science is just beginning to account for these interactions.
These challenges do not mean climate change has no influence on these events. Rather, they reflect a fundamental principle of science: confidence depends on the strength of the available evidence.
Understanding how climate change influences extreme events helps communities, businesses and governments better assess changing risks, improve planning and infrastructure, and make more informed decisions about preparedness and adaptation. Just as importantly, knowing where confidence is lower helps ensure that decisions remain grounded in the strength of the available scientific evidence.
Why attribution science is getting better
The science of extreme event attribution has progressed significantly since the National Academies’ last assessment of it in 2016.
Researchers now have access to longer and better observational records from weather stations, satellites and other monitoring systems. Climate models have become more sophisticated, better representing the physical processes that produce extreme weather, thus representing many types of extreme weather more realistically.
At the same time, the number of attribution studies analyzing climate change’s role in extreme events has grown considerably, covering more types of extreme weather and climate events than a decade ago. International research groups now apply established methods to conduct rapidattributionstudies, often within days of disasters, providing scientifically grounded information while events are fresh in the public mind.
Studies suggested that higher temperatures caused by anthropogenic climate change turned the 2020-2022 Western drought into an exceptional drought. In some areas, ranchers facing drying rangeland sold off cattle. Justin Sullivan/Getty Images
Scientists are also asking a new question: How did climate change affect the results of the event? For example, how did it affect the number of heat-related deaths, the extent of flooding, economic losses or ecological damage?
Hurricane Harvey again provides a useful example. The National Academies report highlights research showing that climate change increased Harvey’s rainfall by roughly 20% to 38%. Studies also found that the increase in rainfall attributed to climate change led to a proportionally even larger increase in the number of flooded properties, showing that relatively modest increases in the intensity of an extreme event can sometimes translate into much larger increases in societal impacts.
Extreme weather and climate change moving forward
As extreme weather affects communities around the world, attribution science is becoming an increasingly robust way to understand how climate change influences individual extreme weather events, providing information that can help communities prepare for and adapt to future risks.
Equally important, attribution studies identify where scientific confidence is high, where important uncertainties remain, and where additional research is needed. Together, these advances help ensure that scientific conclusions remain grounded in observations, physical understanding and careful analysis.
REMINDER: There’s just [2 days] left to comment on the Trump administration’s proposal to rescind ban on new oil and gas leases and mining claims within a 10-mile radius of Chaco Culture National Historical Park. The BLM is accepting public comment until July 29 on three alternatives: 1. keeping the ban in place; 2. shrinking the 10-mile buffer zone to just five miles; 3. eliminating the ban altogether. To comment, click on this link and then click on the “Participate Now” button at the top of the page.
🐓 Regulatory Capture Chronicles 🦊
Wall at the Twin Angel site, a Chacoan outlier that lies along the Great North Road. Note the oil and gas facility in the background. Jonathan P. Thompson photo.
President Donald Trump’s proclamations virtually eliminating Grand Staircase-Escalante and Bears Ears national monuments this month listed several arguments purportedly justifying the shrinkage. One of those was that national monument protections aren’t necessary, because the land and antiquities in question are already protected by various federal laws. The same argument is used to justify revoking the mining-claim and mineral-leasing ban around Chaco Culture National Historical Park.
There is some truth in this: There is a suite of federal laws, from the Federal Land Policy and Management Act to the Endangered Species Act, that are intended to protect environmental and cultural resources on all federal land, whether it’s in a national monument or not. But those laws aren’t always adequate, and now the administration is actually working to weaken Section 106 of the National Historic Preservation Act, which would be key to protecting the cultural sites in the former national monuments and the Chaco “buffer zone.”
When a mining or drilling company proposes a project on a mining claim or mineral lease on public land, the National Historic Preservation Act requires the jurisdictional agency to determine whether the proposed development might affect historic properties. If so, it triggers Section 106 of the law, which requires the agency to consult with tribal nations or other potential stakeholders, to identify potentially affected properties, and to work to avoid, minimize, or mitigate adverse effects on those properties.
Section 106, commonly referred to as “identify and avoid,” requires oil companies or other developers to conduct a cultural inventory of all land in the path of development. If the surveyors happen upon a “significant” site, the well pad, road, or pipeline must be relocated. This can prevent direct impacts to larger sites; you’re not likely to see a Chacoan great house bulldozed for a well pad, for example. But archaeological surveys can miss more subtle cultural features such as stone shrines, Chacoan “road” segments, or ancient cornfields. And the agencies aren’t likely to let a cultural landscape get in the way of the drill rigs or their “multiple use” mandate. Section 106 has not prevented gasfield roads from cutting across Chaco’s Great North Road in several places, nor has it kept several oil and gas wells from being drilled within a half mile of Pierre’s Site, a Chaco outlier within the 10-mile buffer zone.
Ruth Van Dyke, a professor of anthropology at Binghamton University cataloged the impacts of oil and gas development on the sound- and view-scapes at Pierre’s. “I found that, despite the due diligence agencies have exercised to protect the ground footprint of Pierre’s, there have been significant impacts,” she wrote. Twelve pumpjacks are visible from the Acropolis, and it’s likely that . When I visited a few years back, the whir-pop-pop-whir of the machines was irritatingly audible, affirming Van Dyke’s observation: “Rather than a sacred landscape and part of a UNESCO World Heritage Site, the Pierre’s community had the feeling of an industrial park.” (While many people have pointed out that there’s scant recoverable oil within the buffer zone, there is plenty of natural gas, which could be targeted if and when commodity prices increase).
Given the inadequacies of Section 106 now, it has stunned historic preservation advocates to learn that the Trump administration’s Advisory Council on Historic Preservation is proposing to weaken the law even further by giving the agencies more power, while taking input away from the public and other stakeholders, including tribal nations.
That last clause is especially important when it comes to the lands cut out of the two Utah national monuments and the Chaco “buffer zone,” if it were to be rescinded as the administration proposes. We have seen that this for this administration, the quixotic quest for “energy dominance” outweighs nearly every other consideration, at least when it comes to public lands. That means that if the changes to Section 106 go through, we can no longer rely on that law to even partially protect the vast, numerous, and cultural sites and landscapes within Bears Ears, Grand Staircase-Escalante National Monument, and the Greater Chacoan Landscape. It makes the mineral withdrawals more important than ever.
Several years back, when writing about the Greater Chacoan Landscape, I spoke with Theresa Pasqual, former director of Acoma Pueblo’s Historic Preservation Office, about Chaco, the landscape, and how federal laws weren’t enough. I’ll leave you with a sagacious quote from her:
⛈️ Wacky Weather Watch⚡️
It’s feeling downright apocalyptic lately. We’ve had crippling drought, hellish temperatures, locust plagues, cataclysmic fires,pestilence, and all that was just prelude to an especially sporadic and violent monsoon, so far, which helped some firefighting efforts, but also unleashed flash flooding in Arizona, Utah, and Colorado.
The most severe flooding generally occurred on burn scars left by this season’s wildfires, but the intensity of the downpours also wreaked havoc in unburned areas, including Telluride and, most tragically, outside Bicknell, Utah, where a family of five was killed by a flash flood.
Here’s a rundown of some of the most notable flooding:
In Telluride, a downpour kicked off flash floods and debris flows that shut down the Tomboy Road (it remained closed as of Monday morning), temporarily closed Hwy 145, and inundated the Telluride Middle/High School, where three to four feet of mud and water blasted and oozed into the Palm Theatre.
The Cottonwood Fire burned through more than 97,000 acres in southwestern Utah before being mostly contained. Over the past several days, it has been the recipient of heavy rainfall, which have turned area streams, including the Beaver River, into raging, slate-gray-colored, debris-clogged torrents. The flooding closed down I-15 for a period of time, and forced the evacuation of parts of Beaver City. I should make some crack here about semiaquatic rodents that build dams, but I will refrain.
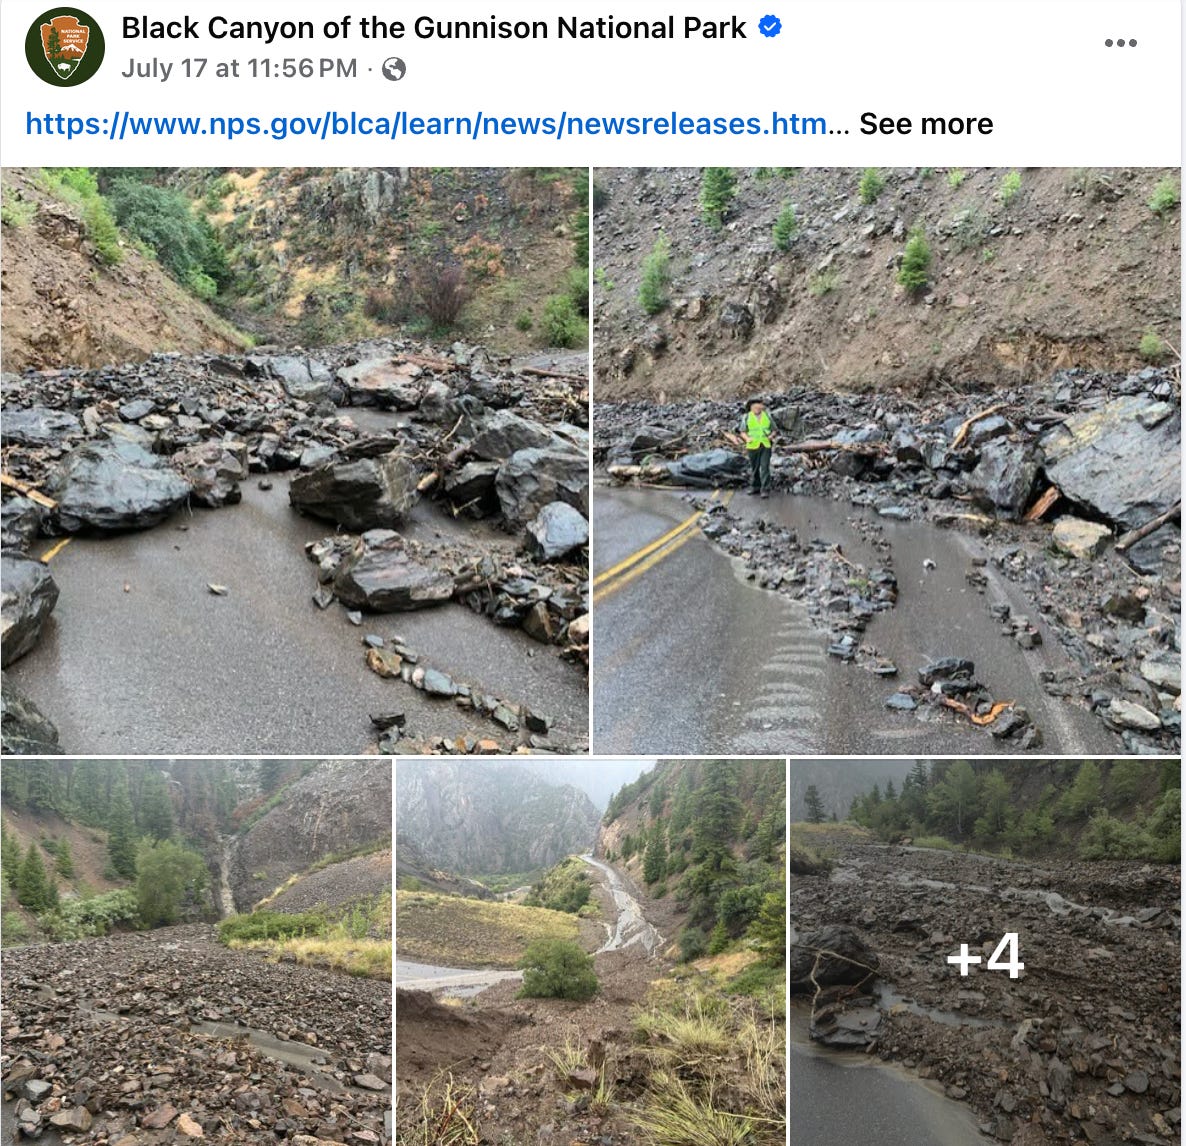
A cloudburst let loose on a year-old burn scar near the Black Canyon of the Gunnison National Park, spurring major debris flows that covered roads with rocky detritus and forced the evacuation of about 20 people from a campground.
I-70 in western Colorado was shut down when water and mud washed onto the highway between New Castle and, appropriately, Silt, on Monday evening.
Flash flooding in the Prescott Valley in central Arizona was big enough to turn at least one large shipping container into, well, a ship floating down the road. The Prescott area remained under a flood watch on Tuesday and Tuesday night, while the Phoenix area was facing an extreme heat watch later this week.
Any amount of moisture is welcome on the drought-desiccated earth, but if the videos of raging rivers in what usually are nearly dry arroyos give you the idea that the water woes are alleviated, think again. So far these cloudbursts are just that: Short, intense, and isolated bursts of precipitation that get arroyos and debris flows running, but only cause quick spikes in nearby river streamflows. Yes, that’s better than nothing, but no, it’s not going to halt Lake Powell’s precipitous decline.
All of those Telluride-area storms, for example, only pushed the San Miguel River near Placerville to about 160 cubic feet per second for a few hours. That’s about double what it had been running at, but just over half of the median flow for this time of year.
We’re also seeing a lot of precipitation inequality. While Telluride and the surrounding mountains were hammered, locales to the southwest of there remained relatively dry. The Dolores River gage at Slick Rock (downstream from the burn area) remained at a steady and unblinking zero cfs, although just a little ways downstream the gage at Bedrock registered 100 cfs, which is pretty good for the Lower Dolores in July.
Still, this does appear to be only the beginning of the monsoon. If the past is any indication, then the storms are likely to become more frequent and more widespread, and hopefully a little less intense, in the coming weeks.
Meanwhile, in the Northwest, lightning has sparked dozens of blazes that are growing together into massive complexes. The Hay Creek Complex in Gilliam, Wasco, and Sherman counties in Oregon is up to 92,000 acres and the Rowe Creek Complex to the south of there is at about 143,000 acres with 0% containment as of Monday night. Further east, the Powder River Fire in Baker County near the Idaho border was up to 20,500 acres.
Razorback sucker. Credit: The Land Desk
🦫 Wildlife Watch 🦅
The Trump administration’s U.S. Fish and Wildlife Service last week quietly downgraded Environmental Species Protections for the razorback sucker, a fish native only to the Colorado River Basin, from endangered to threatened.
“This remarkable fish is very abundant in the river channels of the Colorado Basin,” wrote David Starr Jordan in his 1889 report on the fish of Colorado and Utah. “It reaches a weight of 8 to 10 pounds and is largely used for food.” The razorback sucker, or Xyrauchen cypho, once thrived in the mid- and lower-elevation portions of the Colorado River and its tributaries. But human activities such as dumping mine waste into streams, irrigation diversions, dams, and stocking of non-native fish that prey on the sucker’s eggs and young diminished the population of razorback sucker and other native fish.
So in 1991, the USFWS listed the fish as endangered under the ESA, bringing it extra protections and resources toward its recovery. A propagation and stocking effort helped bring the population back, and fish stocked in the Colorado and Green Rivers have been found to be reproducing, according to Colorado River Endangered Fish Recovery Program. As a result, the USFWS determined that the species is “not currently in danger of extinction throughout all or a significant portion of its range,” and in 2021 proposed “downlisting” it to “threatened” status. That action was finalized last week.
Advocates understandably question the timing of the move. One of the main threats to the sucker is low streamflows, and we’re seeing some of the lowest streamflows on record throughout the Colorado River Basin right now, and climate change is likely to make them worse. The non-native fish that prey on the sucker tend to thrive in warmer water, also a result of climate change (Colorado wildlife officials have enacted voluntary fishing closures on several rivers in the state due to high water temperatures).
“The razorback sucker’s outlook is no better today than when the fish was originally protected under the Endangered Species Act in 1991, so this move makes no sense,” said Taylor McKinnon, Southwest director at the Center for Biological Diversity, in a written statement. “It’s still in danger of extinction throughout its range, which should preclude this downlisting.”
If you happen to be anywhere near Mancos, Colorado, from mid-August to the end of September, I urge you to visit the Sundog Gallery to see the “Portal” exhibit, featuring oil paintings by the late Stanton Englehart. I consider Englehart to be thepainter of the Four Corners Country — no one captures the light, and darkness, of the Great Sage Plain, the mesas, the canyons, and even the waters of Lake Powell quite like Englehart did.
The show opens Aug. 14 with a reception from 4 p.m. to 7 p.m. at the Sundog Gallery on Grand Avenue in downtown Mancos and runs until Sept. 30.
Click the link to read the release on the USDA website:
July 24, 2026
USDA is investing $3 million to support the development of wetland mitigation banks for agricultural producers. through the Wetland Mitigation Banking Program (WMBP).
The U.S. Department of Agriculture (USDA) is investing $3 million to support the development of wetland mitigation banks for agricultural producers. Through the USDA’s Wetland Mitigation Banking Program (WMBP), wetlands are restored, created or enhanced, generating credits that can be purchased by producers looking to compensate for unavoidable impacts to wetlands at another location.
“Wetland mitigation banks provide farmers and ranchers a clear and efficient compliance pathway, while at the same time helping to restore and protect vital wetlands and all the benefits they provide,” said USDA’s Natural Resources Conservation Service (NRCS) Chief Colton L. Buckley. “Through the Wetland Mitigation Banking Program, we can help ensure the long-term resilience and productivity of American working landscapes.”
WMBP awardees work with NRCS to develop a mitigation banking instrument that provides details for developing, establishing and operating a mitigation banking program. Priority will be given to banks in states with significant numbers of individual wetlands, wetland acres and conservation compliance requests. Based on NRCS data, these states are Georgia, Illinois, Indiana, Iowa, Michigan, Minnesota, Nebraska, Ohio, Pennsylvania, South Dakota and Wisconsin.
City and county governments, organizations, tribal governments and other entities are eligible to apply. See the notice of funding on Grants.gov for a full list of eligible entity types.
Applications are due by September 8, 2026. Visit the Grants.gov opportunity for additional details and to apply.
More About WMBP
To participate in most USDA programs, agricultural producers agree to comply with the wetland conservation provisions, meaning producers will not plant agricultural commodities on converted wetlands or convert wetlands to enable agricultural production. In situations where avoidance or on-site mitigation is challenging, the Farm Bill allows for off-site mitigation through the purchase of mitigation banking credits.
Purchasing credits from a wetland mitigation bank provides a legal mechanism for agricultural producers to maintain their eligibility for USDA program benefits if they convert agricultural wetlands.
WMBP award recipients can use the funding to support the costs of developing and establishing a mitigation bank, like costs for site identification, development of a mitigation banking instrument, site restoration, land surveys, permitting and title searches, and market research. WMBP funding cannot be used to purchase land or a conservation easement.
NRCS awarded the first WMBP grants in 2016. Since then, NRCS has awarded 39 projects supporting the creation or expansion of wetland mitigation banks in 14 states.
Awardees can request up to $1 million for a project. Projects may last up to four years.
When a mitigation bank is established, the landowner retains ownership and use of the property, while a conservation easement protects the wetlands from incompatible degrading activities.
To learn more about the Wetland Mitigation Banking Program, and how wetland mitigation banks work, visit the WMBP webpage.
For more than 90 years, NRCS has helped farmers, ranchers and forestland owners make investments in their operations and local communities to improve the quality of our air, water, soil, and wildlife habitat. NRCS uses the latest science and technology to help keep working lands working, boost agricultural economies, and increase the competitiveness of American agriculture. NRCS provides one-on-one, technical advice and financial assistance and works with producers to help them reach their goals through voluntary, incentive-based conservation programs. For more information, visit nrcs.usda.gov.
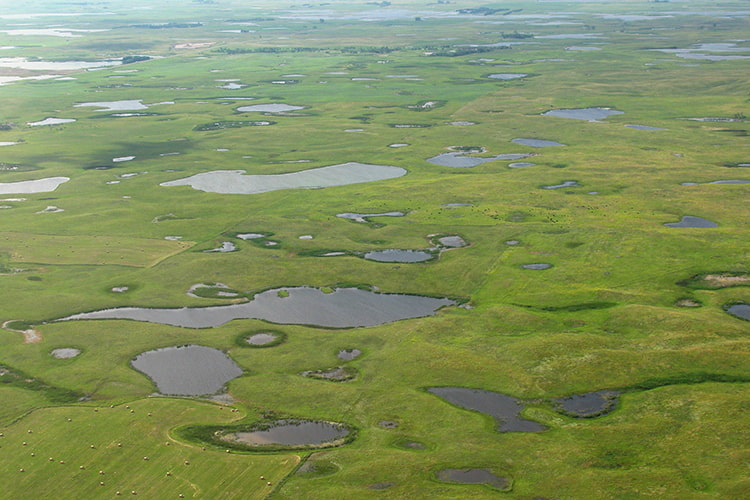
Wetlands, like these in the Prairie-Pothole Region of North Dakota, may capture and store nutrient runoff from cropland fields. Photo Credit: U.S. Fish and Wildlife Service
A warming climate is increasing the risk to water infrastructure.
The U.S. recorded a record number of billion-dollar weather disasters in the last three years.
Weather hazards, combined with aging infrastructure and rising costs, are raising the cost of supplying water.
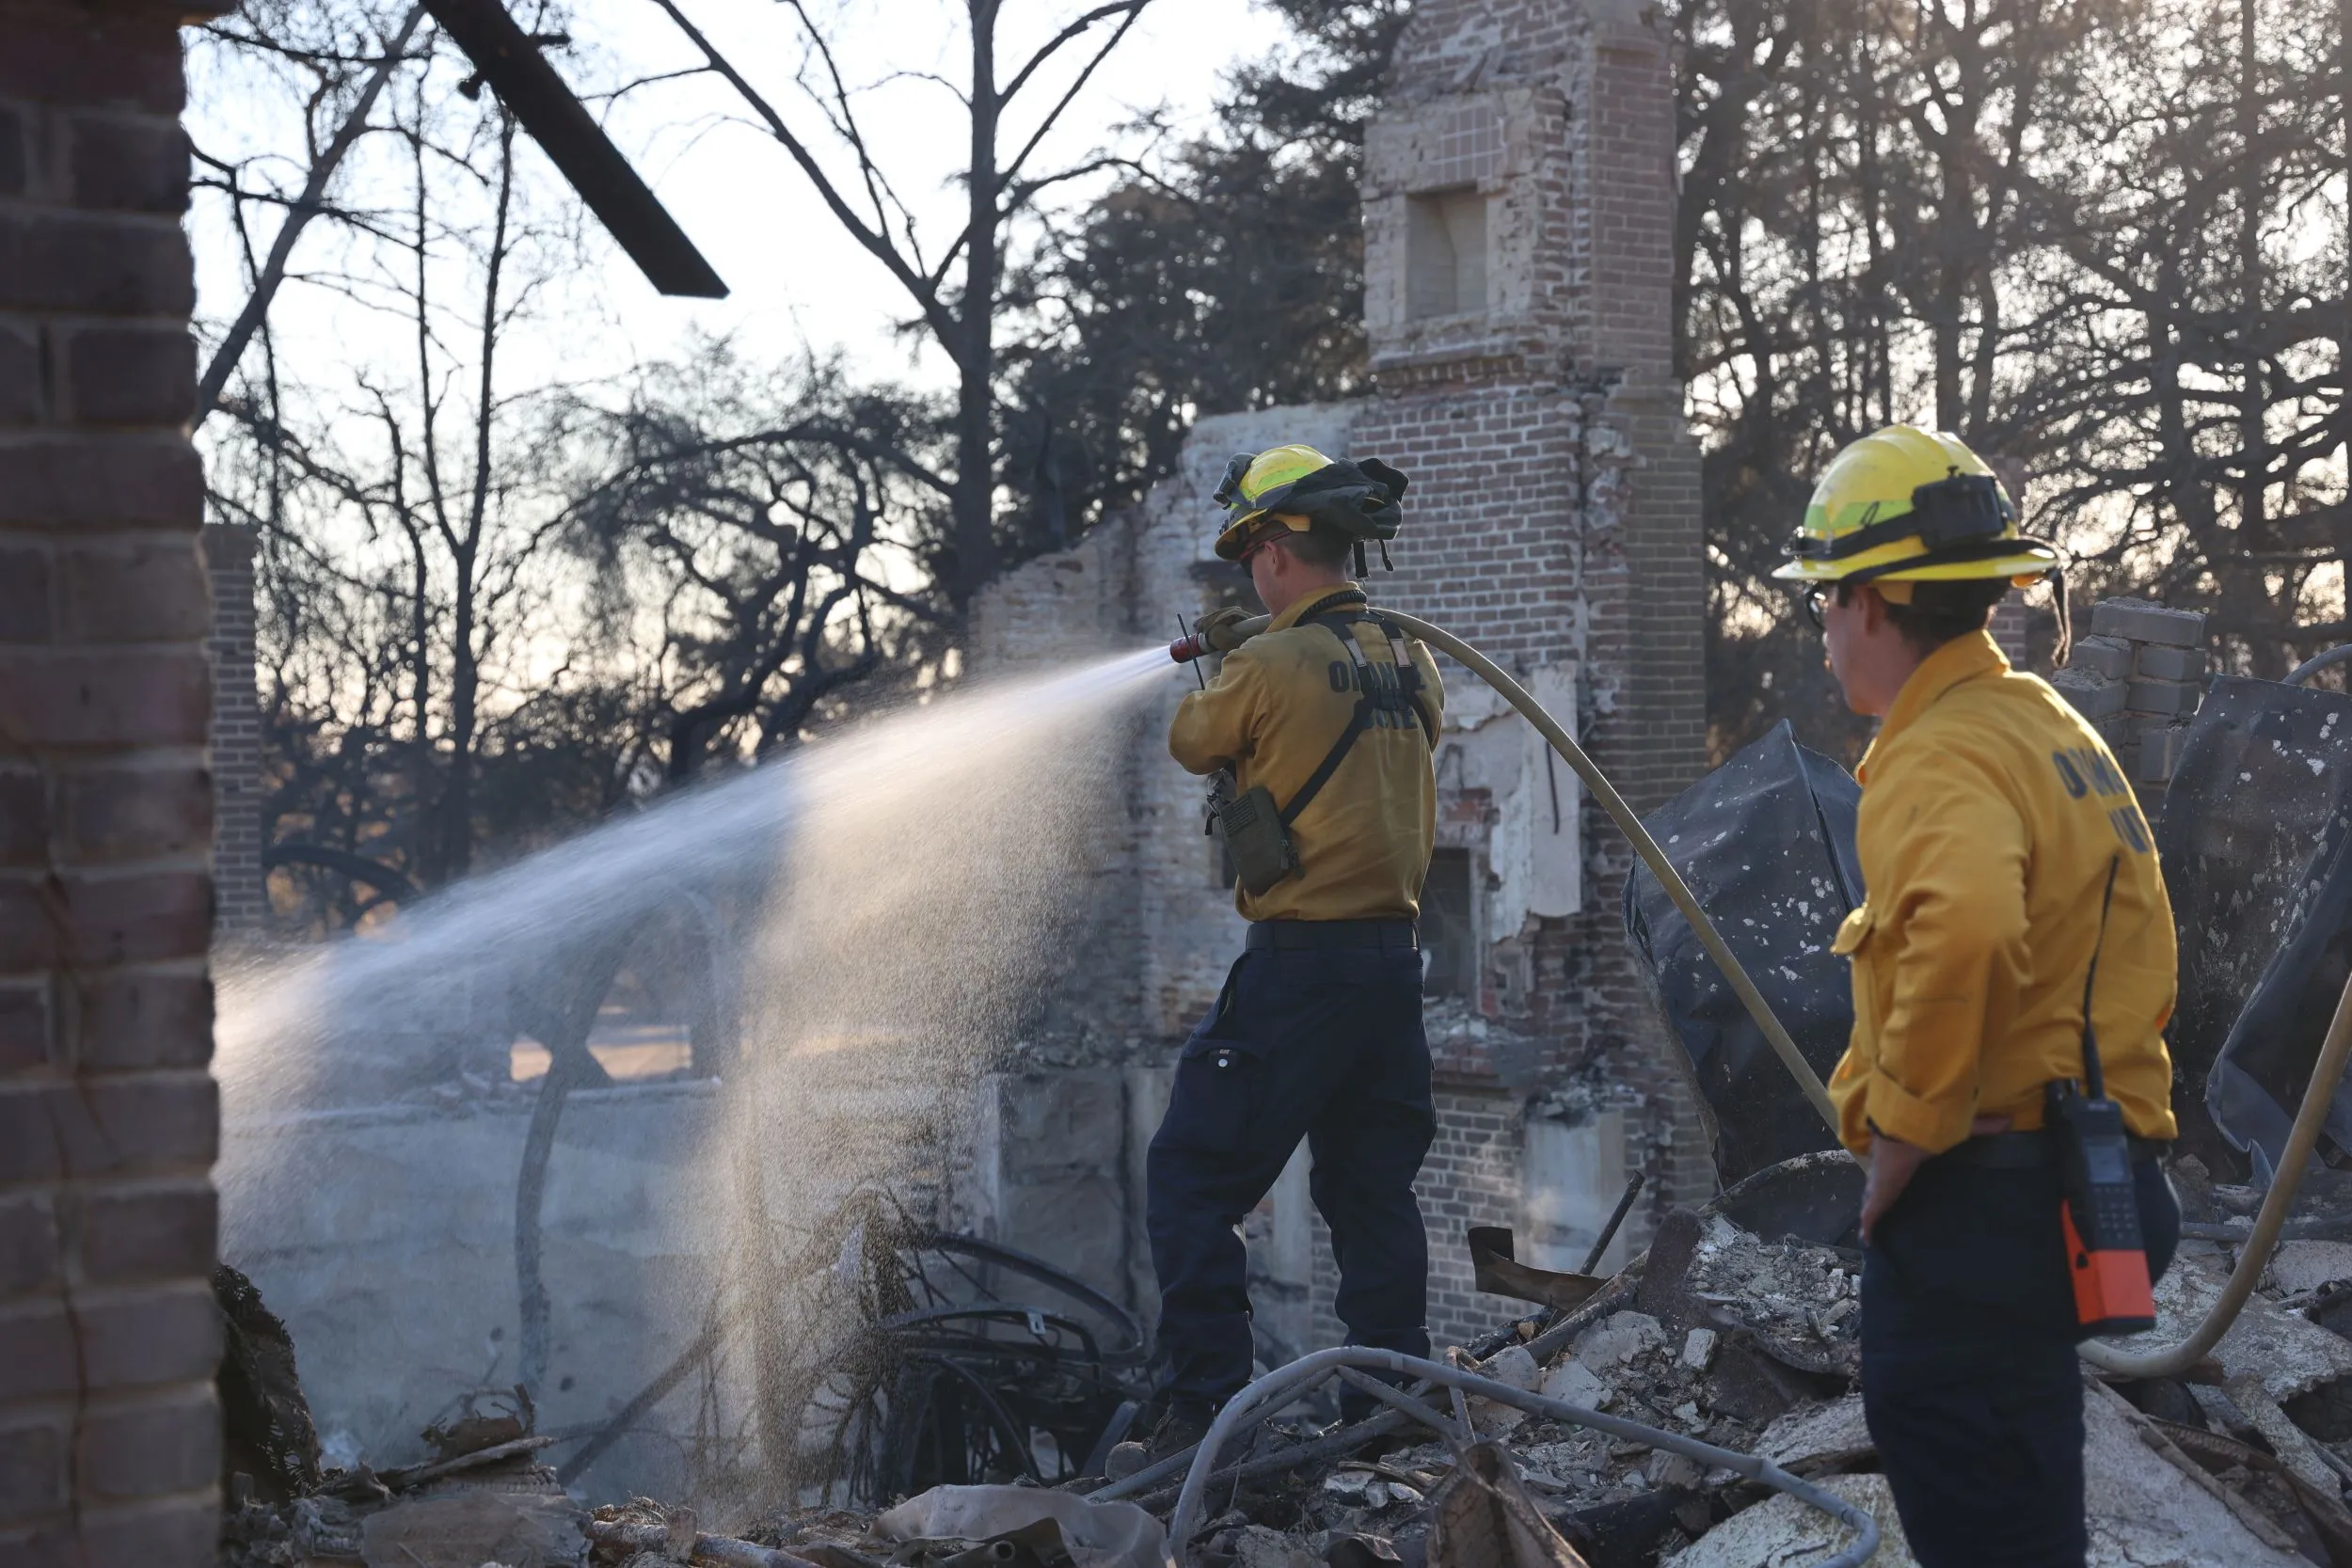
When the Eaton Fire blitzed central Los Angeles County in January 2025, the foothills community of Altadena sat in its path.
Burning more than 14,000 acres in and around the southern edge of Angeles National Forest, the fire concentrated its structural damage in an area of Altadena served by Las Flores Water Company, a small drinking water provider.
By the time the flames were extinguished, the water company sustained substantial losses that its customers will cover with expensive surcharges. The Eaton Fire destroyed the private utility’s two reservoirs and about three-quarters of its customers’ homes. More than a year later, effective April 1, the utility instituted a $3,000 surcharge per household, to be paid on the water bill in $50 increments over 60 months. Residents with savings can make a single $2,600 payment upfront.
Failure to pay means either a dramatic household or business disruption. Water service will be cut off. For Las Flores, the funds are intended to be a lifeline, keeping the utility from bankruptcy as it repairs its reservoirs while maintaining day-to-day operations until more residents return and revenue rebounds.
For residents whose lives have already been upended, the surcharge also represents an unwelcome expense.
“Such an action is not taken lightly, and we recognize that the imposition of this flat fixed fee may have economic consequences for some of you,” John Bednarski, the board president, wrote in a September 2025 letter to customers.
These consequences of a climate-related emergency in the Los Angeles foothills are emblematic of the terrible toll being exacted nationwide not just on land and property, but also on essential duties of government, like supplying water. Las Flores is just one calamity among many in recent years. The number of weather disasters causing more than $1 billion in damages in the United States is climbing. According to Climate Central, the last three years have had the highest number of billion-dollar disasters. The vicious storms, floods, freezes, and droughts have destroyed homes and killed hundreds of people. They are also endangering water supply and reliability as well as municipal and residential financial well-being.
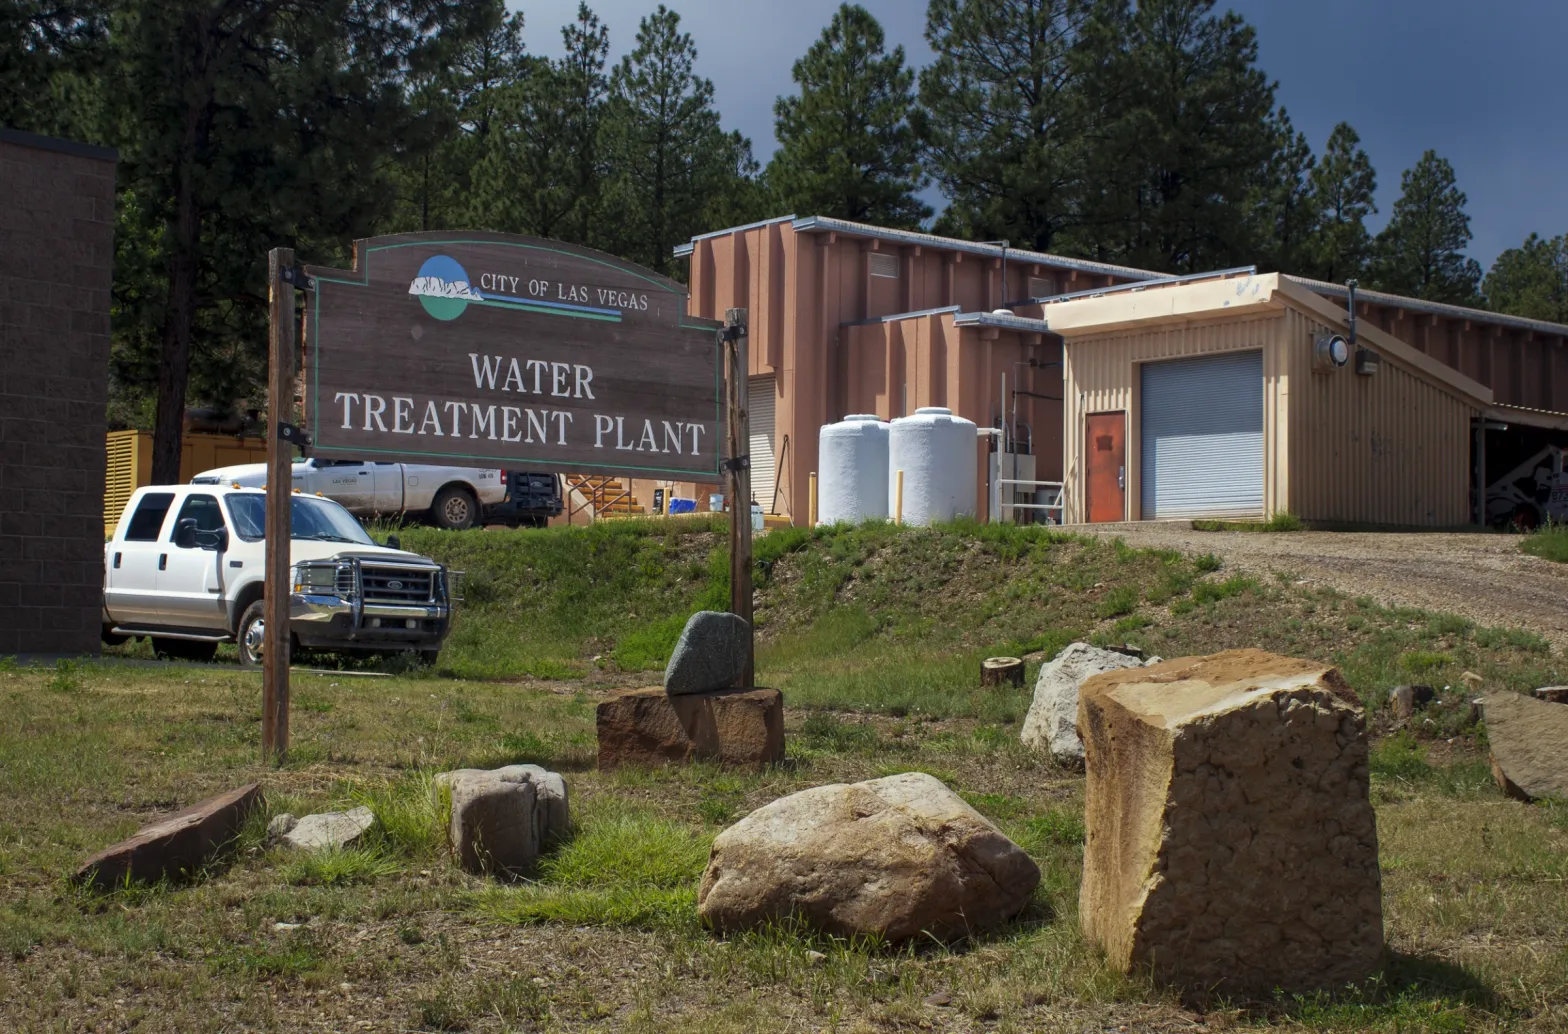
Hurricane Helene in western North Carolina, in 2024, wrecked dozens of water and wastewater systems and prompted $861 million in state and federal funds to rebuild them. The Hermit’s Peak-Calf Canyon Fire outside Las Vegas, New Mexico, in 2022, so damaged a watershed with ash and debris that the city’s water treatment plant could not function. It is being replaced thanks to a congressional appropriation. Persistent drought today threatens southern Texas, where Corpus Christi nears a water catastrophe due to depleted reservoirs.
A warming planet is magnifying these and other physical risks to water infrastructure while also increasing the cost of recovery. This environmental upheaval is set against a backdrop of increasing economic pressures for water utilities and challenging financial conditions for their customers.
Aging pipes and treatment plants need to be replaced. By one estimate the national need for drinking water, wastewater, and stormwater over the next 20 years is $3.4 trillion, or $168 billion annually in capital spending. New federal regulations for lead and PFAS are an expensive outlay. Additional costs since the pandemic came first in the form of supply chain snarls and rapid inflation, then moved higher with the Trump administration’s tariffs. Rising interest rates and more costly energy and treatment chemicals – all these factors add up. The result is that utilities have raised customer water rates, which have outpaced overall inflation for years. Water and sewer bills rose 24 percent over the last five years in 50 large cities, according to Bluefield Research.
Utility leaders have taken notice of the headwinds. Among the top challenges identified in this year’s State of the Water Industry survey from the American Water Works Association were aging infrastructure, securing financing, rising cost of treatment, and extreme weather.
“Climate variability is one of the most significant and challenging risks to water supplies and water sector infrastructure,” the report notes.
Management failures in the face of environmental pressures have financial consequences. Earlier this month, S&P Global Ratings downgraded the credit rating for Corpus Christi’s municipal utility from AA- to A. The lower rating will increase borrowing costs for the city just when it needs money to navigate a water-supply crisis. To justify the downgrade, the ratings agency cited the city’s drought risk, water restrictions, and high capital needs to acquire additional water supplies. Corpus Christi is planning at least $1 billion in water infrastructure and supply investments, which include groundwater pumping, brackish groundwater treatment, recycled water, and potentially seawater desalination. The city’s two main reservoirs are 8 percent of capacity combined as of May 15.
State and federal dollars often fill the breach after a weather disaster. But the need is far greater than the available funds. North Carolina awarded $861 million in state and federal grants to 217 drinking water and wastewater projects after Hurricane Helene. But more than $600 million in applications were not able to be fulfilled, according to Gov. Josh Stein.
“We need substantially more federal support,” Stein said on May 14 while visiting Canton, a town in western North Carolina that was flooded during Helene. With $24.5 million in state and federal funds, Canton is rebuilding its water and sewer infrastructure.
Canton is one of the lucky ones. The increasing number of weather disasters for water utilities comes at a time of federal disengagement and funding uncertainty, note Rebecca Anderson and Shannon M. McNeeley of the Pacific Institute.
The Trump administration cancelled a multibillion-dollar FEMA grant program for climate-resilient infrastructure before being ordered by a U.S. district judge to reinstate it this spring. The Infrastructure Investment and Jobs Act, the Biden-era law that provided an extra $43 billion for water infrastructure, expires this year with no replacement in sight. A federal pandemic-era program to assist low-income households with their water bills has also expired. Water utilities are urging Congress to resume the program so that they can upgrade their systems without worrying that the cost will burden their poorest customers. House Democrats introduced the Water Access and Affordability Act in April to reauthorize the program.
“Without sufficient federal disaster mitigation and recovery funding, states and communities shoulder a disproportionate share of response, recovery, and preparedness costs,” Anderson and McNeeley write. “This burden is often especially heavy for small and rural water systems with limited revenue.”
Floods, droughts, wildfires, and hurricanes have always wrought destruction and water-supply desperation. Superstorm Sandy, in 2012, knocked out wastewater plants in eight states, leading to the release of some 11 billion gallons of raw and partially treated sewage. In New York City alone, the damage to wastewater facilities totaled more than $100 million.
But with the rising number of disasters and the increasing intensity of storms and droughts, more financial demands are challenging not just individual water utilities but assumptions about who is at risk.
No utility, even those on apparently solid financial footing, should be complacent, said Greg Pierce, a California water system expert at the UCLA Luskin Center for Innovation. Just look at Las Flores Water Company and its neighbors in Altadena.
Before the Eaton Fire, “none of these systems were on anyone’s list of small or underperforming systems, even within Los Angeles County,” he said.
Fig. 1. Spatial and temporal patterns of global dust events. (A) Global average frequency of dust events (including dust storms, blowing dust, and floating dust) from 1979 to 2023. The cyan lines in (A) delineate the boundaries between dust source regions and transport regions. The largest markers indicate stations where dust storms are the dominant type of dust events, medium-sized markers represent blowing dust, and the smallest markers denote floating dust. (B), (C), and (D) present the global frequency anomaly time series for dust storms, blowing dust, and floating dust, respectively, over the same period. The curves in [(B), (C), and (D)] are smoothed using a nine-point moving average.
Click the link to access the research article on the Science Advances website (Yuzhi Liu, Weiqi Tang, Tianbin Shao, Run Luo, Ziyuan Tan, Dan Li, and Jianping Huang). Here’s the abstract:
April 29, 2026
Dust storms, while often seen as harmful, can play an unexpected role in enhancing rainfall. Global observations show that 7-day accumulated precipitation after dust storms exceeds dust-free conditions by up to 9.6 millimeters. Numerical simulations further confirm that dust particles act as ice nuclei, thereby promoting cloud formation and increasing rainfall through the ice crystal effect. Moreover, in regions with rising anthropogenic aerosols, dusts determine precipitation patterns. While elevated levels of anthropogenic aerosols alone tend to boost weak rainfall, the presence of dust aerosols reduces light precipitation and enhances heavier precipitation. Collectively, these findings reveal a dual role of dust storms in shaping global precipitation patterns while adversely affecting the human living environment. This research establishes a mechanistic framework for understanding how dust affects extreme precipitation at the global scale, advancing predictive capabilities for heavy precipitation.
Dust clouds roll across drought-ridden fields near eastern Colorado’s Lamar in spring 2013. Credit: Jane Stulp via Water Education Colorado
EPA asks federal court to pause part of its regulations for PFAS in drinking water.
EPA also says it will uphold Biden-era lead pipe replacement requirements.
DOE once again orders a Michigan coal plant to continue operating.
Congress will hold hearings this week on safe drinking water, water-related legislation, and an Army Corps authorization bill.
U.S. Supreme Court will hold oral arguments this week for the Line 5 oil pipeline case.
EPA seeks comments on ways to reduce regulatory burden for hazardous substance spill response plans.
FEMA continues to be slow in approving disaster declarations in Democratic-led states.
And lastly, the White House promotes domestic phosphorus mining and glyphosate production by conferring “immunity” under the Defense Production Act.
“Consistent with these findings, I find that ensuring robust domestic elemental phosphorus mining and United States-based production of glyphosate-based herbicides is central to American economic and national security. Without immediate Federal action, the United States remains inadequately equipped and vulnerable.” – President Trump’s executive order that grants these activities (phosphorus mining and glyphosate production) immunity from “damages or penalties” for any activity related to the order. The underlying law is the Defense Production Act. Phosphorus and glyphosate are foundational elements of modern American agribusiness. They are in fertilizer and the weedkiller Roundup. But they are also primary water pollutants that contribute to harmful algal blooms or are linked to cancer and other illnesses.
EPA PFAS Lawsuit The EPA is continuing to make its case in court that the agency’s Biden-era regulation of four PFAS in drinking water should be paused while it works on a new regulation that would officially rescind them, Bloomberg Law reports.
Two of the regulated chemicals – PFOA and PFOS – have standard numerical limits. The four others – PFNA, PFHxS, PFBS, and GenX – would also be regulated as a group, using what’s known as a “hazard index.” This is the first time the agency has used such an approach for drinking water regulation.
The court in January rejected the EPA’s request to vacate the hazard index component. The agency now wants to separate the hazard index from the rest of the litigation.
Two water utility groups – the American Water Works Association and Association of Metropolitan Water Agencies – filed the lawsuit in June 2024 in the U.S. Court of Appeals for the D.C. Circuit.
In the court filing, the agency says that it has drafted a notice of rulemaking to rescind the hazard index and plans to “commence the rulemaking process imminently.”
Lead Pipe Replacement In a separate lawsuit, the EPA said it would uphold the Biden administration’s 10-year timeline for most cities to replace lead drinking water pipes, the Associated Press reports.
The lawsuit challenging the timeline was also brought by the American Water Works Association, which argued that it was not feasible.
Michigan Coal Plant Operating Order Extended The Department of Energy once again extended the life of a Michigan coal-fired power plant.
This is the fourth 90-day order to keep the J.H. Campbell Generating Plant operating. The DOE argues that closing the plant is a threat to grid reliability. It is also costing Consumers Energy, the plant owner, a lot of money – at least $80 million through last September. The company will likely recover costs through customer rate increases or surcharges.
Consumers intended to shut down the plant in May 2025.
The EPA, at the prompting of regulated facilities, is considering changing federal requirements for hazardous substance spill plans, which are authorized under the Clean Water Act to guide emergency response in case a large volume of toxic chemicals is released into waterways.
The requirements in questions were established in 2024 during the Biden administration and apply to onshore non-transportation facilities – things like chemical manufacturers, oil and gas operators, gas stations, hospitals.
The agency is seeking comment on whether it should simplify the rules for determining which facilities are required to file response plans. Public comments are due March 20 and can be submitted via www.regulations.gov using docket number EPA-HQ-OLEM-2025-1707.
Studies and Reports
Disaster Declarations and Approvals FEMA approved a disaster declaration for Louisiana, which the state requested on February 5 following a late-January storm. And it approved a declaration for a Washington, D.C. sewer line that collapsed on January 19.
The federal disaster agency, meanwhile, has rejected or has been slow to approve requests from Democratic-run states. FEMA has not acted on Washington state’s January 21 request.
Arizona and Illinois are appealing requests from last fall that were rejected. Colorado is appealing two requests from January 16 that were denied.
Chinook Salmon Decision The National Marine Fisheries Service decided against listing the Washington coast segment of Chinook salmon as endangered or threatened, saying the population faces low extinction risk.
This is the result of the agency’s 12-month review, an in-depth assessment of the threats to a species. In response to a petition from the Center for Biological Diversity, the agency had made a preliminary, 90-day decision during the Biden administration that listing the species may be necessary.
Washington coast Chinook salmon spawn north of the Columbia River and west of the Elwha River, a geography that includes the Olympic peninsula.
On the Radar
Line 5 in the U.S. Supreme Court On February 24, the nation’s high court will hear oral arguments in a case involving the controversial Line 5 oil pipeline that crosses the Straits of Mackinac between lakes Huron and Michigan.
The case centers on a jurisdictional matter: should the lawsuit seeking to shut down the 73-year-old pipeline be heard in state or federal court?
Dana Nessel, the Michigan attorney general, filed the case in state court in 2019 alleging that Enbridge’s continued operation of the pipeline violated state law.
Colorado River DEIS Comments Due The Bureau of Reclamation is accepting public comments through March 2 on its draft plan for managing the Colorado River reservoirs after current rules expire at the end of the year.
Also on February 24, a Senate Energy and Natural Resources subcommittee will discuss 18 water-related bills, including rural water supply systems, snow water forecasting, and water recycling.
There are two hearings this week on the next Water Resources Development Act, the legislation that authorizes Army Corps projects for dams, levees, ports, and ecosystem restoration.
The action starts on February 24 with a House Transportation and Infrastructure subcommittee. The head of the Army Corps will testify, as will the chief of engineers.
Then on February 25, the Senate Committee on Environment and Public Works holds its own hearing.
Federal Water Tap is a weekly digest spotting trends in U.S. government water policy. To get more water news, follow Circle of Blue on Twitter and sign up for our newsletter.
Between 2025 and 2050, our analysis finds that climate change could impose roughly $33 billion to $37 billion in additional costs and resilience needs across Colorado’s health, infrastructure, wildfire, flooding, and winter recreation impacts. The largest quantified drivers are extreme heat, which could lead to about 1,800 to 1,900 additional heat-related deaths, or about $24 billion to $25 billion in losses, and infrastructure pressures totaling about $8.3 billion to $8.7 billion in added costs and upgrades as roads, bridges, stormwater systems, and building cooling demand are pushed beyond historical design conditions. Wildfire smoke and property impacts add another $1.3 billion, with additional resilience needs on the order of $2.3 billion. These figures do not capture every hazard or indirect loss, but they make one point clear: Planning and investment now can save lives and avoid much larger costs later.
Executive Summary (2025 TO 2050)
Colorado is already experiencing the effects of a warming climate: hotter summers, longer wildfire seasons, more smoke exposure, and mounting pressure on critical infrastructure and water-dependent industries. These changes are not abstract. They influence public health, household costs, and the reliability of roads, bridges, and stormwater systems, while increasing the risk of disruptive, high-loss events.
Across the impacts we quantify, total projected costs from 2025 to 2050 are on the order of $50 billion to $54 billion, of which $36 billion to $37 billion represents additional costs directly attributable to climate change, plus defined resilience investments.
This executive summary highlights projected climate-related damages and resilience needs from 2025 to 2050. It is intended for policymakers, community leaders, and reporters who need a clear, comparable set of numbers to understand the scale of the challenge. Results are shown under two global emissions pathways that bracket plausible futures: a medium-high pathway (SSP3-7.0) and a high-end emissions pathway (SSP5-8.5).
Among Colorado’s health, infrastructure, wildfire, flooding, and winter recreation impacts, the largest quantified drivers are extreme heat, which could lead to about 1,800 to 1,900 additional heat-related deaths, or about $24 billion to $25 billion in losses, and infrastructure pressures totaling about $8.3 billion to $8.7 billion in added costs and upgrades as roads, bridges, stormwater systems, and building cooling demand are pushed beyond historical design conditions. Wildfire smoke and property impacts add another $1.3 billion, with additional resilience needs on the order of $2.3 billion. These figures do not capture every hazard or indirect loss, but they make one point clear: Planning and investment now can save lives and avoid much larger costs later.
How we estimated impacts: For each sector, we combine Colorado-specific historical records with downscaled climate projections to quantify how key hazards change over time. We then estimate climate-attributable impacts by comparing projected outcomes to a counterfactual that holds climate hazards at 1995 to 2014 baseline levels while allowing underlying trends to continue. Where relevant, we also estimate defined resilience investments, such as bridge upgrades, stormwater improvements, wildfire mitigation, and snowmaking, that can reduce future losses. All monetary values are reported in 2024 dollars.
Because not every climate impact can be modeled with available data, these estimates should be viewed as conservative. They cover major, quantifiable pathways but do not include every hazard, indirect economic spillover, or nonfatal health effect.
Total precipitation (inches) from 9-15 October 2025 with gridded data from the PRISM Climate Group and observations from the Community Collaborative Rain, Hail, and Snow (CoCoRaHS) network.
On January 6, 2026 Town of Pagosa Springs staff informed the Pagosa Springs Town Council about the town’s ongoing flood recovery funding efforts in the wake of the Federal Emergency Management Agency’s (FEMA’s) denial of the town’s request for $5.7 million to aid cleanup efforts. Development Director James Dickhoff and Projects Manager Kyle Rickert were both on hand to walk the council through various other funding opportunities, with Dickhoff stating, “We are not counting on FEMA money to come through to us” after the denial on Dec. 21, 2025. Dickhoff stated that staff just wanted to inform the council “on where we are at” regarding the town’s relief funding efforts from the October 2025 flooding…
The total project cost of river cleanup and restoration following the October flood event is estimated to be just shy of $6 million, stated Town Manager David Harris in correspondence. Rickert explained that, with the FEMA funding off the table, the town is pursuing several state grants, and possibly a state loan, as well as two other federal funding programs. Dickhoff added that if the town wanted to pursue “the loan opportunity through the Colorado Water Conservation Board (CWCB),” the council would need to put it before the voters in an upcoming spring election to be legally eligible to take out the loan…
Rickert explained that the federal Emergency Watershed Protection had awarded the town about $3.3 million and the Colorado Office of Emergency Management awarded $463,504 in funds. These funds will go toward embankment stabilizations near the Pagosa Springs History Museum and near 6th Street, pedestrian bridge abutment stabilization at Centennial Park, restoring the River Center ponds, as well as Apache Street bridge repairs and log jam removals, all coming with a total project price tag of $4,178,038, the slideshow states…
He added, “The river is an important part of our tourism portfolio and we need to get it cleaned up” and make it safe for those recreating in the river before summer hits. Rickert then informed the council about a Colorado Parks and Wildlife (CPW) Fishing is Fun grant that the town has requested in the amount of $328,603. This grant would go toward dredging the River Center ponds, a headgate replacement at Pond #1 (the east pond), ditch restoration, debris and sediment removal upstream of town limits to the future 1st Street pedestrian bridge, as well as rebuilding rock structures in the same area. Rickert noted that the town was also awarded $15,000 from History Colorado Emergency Grant for its ongoing efforts to stabilize the river bank near the museum…One or possibly two water gauge stations would give the town an estimated two hours of warning time as water levels rise during another flood event, providing historic data as part of the U.S. Geological Survey monitoring system, she noted. This grant application would be due by Jan. 31, so she asked the council to pass a resolution supporting the CWCB river gauge grant, which the council passed unanimously.
The San Juan River has peaked above 8,000 cfs twice in the last several days, reaching the highest levels seen since the 1927 flood. Source: USGS.
Click the link to read the article on the Summit Daily website (Town of Silverthorne):
November 17, 2025
Starting Jan. 1, 2026, the metered water service rate for a normal rate building from $19.55 per equivalent residential unit per month to $22 per equivalent residential unit per month.
Also effective Jan. 1 2026, the town will increase its water system development fees by $276 per equivalent residential unit. This will bring the one-time fee to connect new development to the town’s water from $9,200 to $9,476.
“That’s really just to keep up with inflation,” Finance Director Laura Kennedy said. “Despite the fact that we are growing as a town, water usage really hasn’t grown as much as we’ve seen the number of units come on.”
Residential storm water management fee will also increase, taking the fee from $7.50 per month to $7.57 per month. The sewer opportunity fee — which is applicable to properties outside of town that receive sewer services from the town or will receive service because of a planned annexation — will increase in 2026 as well from $2,700 to $2,750.
The Colorado River fills Glen Canyon, forming Lake Powell, the nation’s second-largest reservoir. The reservoir could drop to a new record low in 2026 if conditions remain dry in the Southwestern watershed. (Alexander Heilner/The Water Desk with aerial support from LightHawk)
This story is produced and distributed by The Water Desk at the University of Colorado Boulder’s Center for Environmental Journalism.
Heavy autumn rains brought relief to drought-plagued portions of the Southwest, but across the Colorado River basin ongoing water supply concerns still linger amid tense policy negotiations and near record-low reservoir storage.
Even after accounting for the heavy rain, 57% of the Colorado River watershed remains in severe drought, according to the U.S. Drought Monitor. More than 11% of the basin is in extreme drought.
A less than average upcoming snow season combined with a dry spring or early summer in 2026 could create conditions for another low runoff year. The Colorado River’s headwaters saw a weak snowpack last winter, which contributed to one of the worst spring runoff seasons on record in 2025. Drought conditions spread and worsened into summer throughout the southern Rocky Mountains.
Peter Goble, Colorado’s assistant state climatologist, explained that the recent rainfall “certainly recharged soils,” in some watersheds.
Streamflow in the Animas River and Rio Grande increased significantly following the October rains and flooding. Rain in southwest Colorado, particularly around Pagosa Springs, brought flooding that damaged homes and downtown businesses. Rain gauges near the San Juan Mountains recorded 7 to 10 inches of precipitation from October 9-15.
“We would love to see this rain come over a more steady incremental period,” Goble said. “But oftentimes it is these flooding events that kind of put the kibosh on a drought more locally.”
The flooding erased drought designations on the Drought Monitor map in those localized areas, but basinwide drought conditions tell a different story. Dry soils, depleted reservoirs and winter weather forecasts continue to cause water managers to worry.
Even with the recent rain, soils in many parts of the Colorado River basin remain dry. Soil absorbs moisture almost like a sponge. When the soil moisture is low, spring runoff soaks into the soil, saturating the ground first. Soils that are more saturated lead to more water filtering into streams and reservoirs when runoff occurs, making the process more efficient.
“We’re still going to need a good snowpack in order to be set up nicely, but this (rain) improves our outlook for the efficiency of that snowpack,” Goble said.
La Niña causes the jet stream to move northward and to weaken over the eastern Pacific. During La Niña winters, the Southwest tends to see warmer and drier conditions than usual. Since La Niña conditions are more common during the negative phase of the Pacific Decadal Oscillation, a negative PDO is likewise associated with warmer, drier conditions across the Southwest. (Image credit: NOAA)
Federal forecasts show the possibility of a mild La Niña through February. The climate pattern occurs when Pacific Ocean waters cool down and alter global weather conditions. La Niña patterns often impact the amount of snowpack accumulation in the coming year. The southern part of Colorado is often drier in a La Niña year while northern areas, around Steamboat Springs, typically see snowier conditions.
The stakes for an above average runoff next year are high. The two biggest reservoirs in the country, Lake Powell and Lake Mead have steadily declined over the last 25 years. Powell is currently at 29% of its capacity and Lake Mead is at 32%. A lessened runoff could push them dangerously low.
While the rain slightly alleviates local drought, it’s “only a drop in the bucket when it comes to refilling Lake Powell and Lake Mead,” Goble said. “We’re still going to see those regional water shortages persist.”
Glen Canyon Dam holds back the waters of Lake Powell, which has reached critically low levels in the last three years. The reservoir serves downstream water use in Arizona, California, Nevada and Mexico. (Mitch Tobin/The Water Desk)
If water levels continue to decline in these larger reservoirs, the dams’ infrastructure is threatened and the hydropower turbines can’t be used. Lake Powell, for example, has different outlets installed so water can be released in low conditions, however they are not designed to be the main outlet source. New federal projections show it’s possible Powell’s levels could drop low enough to cease hydropower production as early as October 2026, if conditions remain dry.
“They could reach levels they have never reached before and potentially reach catastrophic levels,” said John Berggren, regional policy manager for Western Resource Advocates.
In response to extremely low water conditions, it’s possible water from upstream reservoirs in Colorado, Wyoming and New Mexico could be released to support Powell’s hydropower turbines.
“We are seeing a new normal because of climate change, because of aridification,” Eric Kuhn said, former general manager of the Colorado River District, on the state’s Western Slope. In 2022, the basin saw similar drought conditions.
“We are back where we were just a few years later,” Kuhn said. “The system is slipping away.”
The basin states are also engaged in negotiations for new operating guidelines for the Colorado River, set to be in place by 2027. Given the ongoing drought conditions, water experts say the two reservoirs cannot wait for new guidelines.
“Don’t forget the short term problem while you are focused on a long-term agreement,” Kuhn said. A recent research paper, co-authored by Kuhn, highlights the need for urgent consumptive cuts basinwide. “We have got to figure out what’s going to happen next year if next year happens to be dry.”
Map of the Colorado River drainage basin, created using USGS data. By Shannon1 Creative Commons Attribution-Share Alike 4.0
Click the link to read the article on the Pagosa Springs Sun website (Randi Pierce and Clayton Chaney). Here’s an excerpt:
October 30, 2025
Assessments of the damages caused by and the impacts of the historic floods on Oct. 11 and Oct. 14 continue, with estimates of public infrastructure damage now nearing the $26 million mark, up from a preliminary estimate of about $13 million. Pagosa Country experienced two historic floods in four days thanks to moisture from the remnants of a pair of tropical storms, Priscilla and Raymond. The flooding for the San Juan River at Pagosa Springs peaked at 8,270 cubic feet per second (cfs) and 12.66 feet at 6 p.m. on Oct. 11 and again at 8,560 cfs and 12.82 feet at 5:15 a.m. on Oct. 14, putting the two events as the fourth and third highest on record, behind floods in October 1911 and June 1927. Other area river levels were also significantly impacted, including the Piedra and Blanco rivers. During a work session held by the Archuleta County Board of County Commissioners on Tuesday, Oct. 28, Commissioner Veronica Medina provided an update on the damage assessments being conducted throughout the county and the potential total cost of damage.
On the evening of July 31, 49 years ago, a deadly flooding disaster began in the Big Thompson Canyon in northern CO. Highway 34 cuts through the canyon between Loveland and Estes Park. On that night, an extreme precipitation event resulted in a large wall of water crashing through and killing 144.
It’s been called the “summer of flash flooding” in the US. The worst was the tragic flooding in Texas Hill Country on July 4, which took over 135 lives. But there have also been significant flash floods in other places across the country, from Ruidoso, New Mexico, to West Virginia, to Chicago, to the Washington, DC area, and many other places in between.
Here in Colorado, thankfully we haven’t experienced a lot of flash flooding so far this summer. There have been a handful of flash flood warnings and reports, but no major incidents. However, we are now in the midst of the peak season for flash floods. The last 10 days or so of July and the first week of August are when we’ve historically seen by far the most flash flood activity across the state.
Average number of reports of flood, flash flood, or debris flow in Colorado from 1996-2024. The brown line shows the average number of reports on each calendar day; the thick black line is a 15-day rolling average. Data source: NOAA/NCEI Storm Events Database.
One of the worst disasters in state history, the 1976 Big Thompson flood, happened on July 31. The Fort Collins flood of 1997: July 28. The Saguache Creek flood in the San Luis Valley in 1999: July 25. The heavy rain on the Grizzly Creek burn scar that closed I-70 for weeks in 2021: several rounds of storms in late July, especially on the 30th and 31st. And that’s just a sampling; the list could go on and on!
It’s not the only time of year at which flash flooding happens in Colorado. The graph above shows another peak in early to mid June, which is when some other historic floods have occurred like the 1921 Arkansas River flood and the 1965 flood on the South Platte in Denver. There’s also a big spike in September associated with the Great Colorado Flood of September 2013. Still, it’s remarkable how sharp of a peak there is in late July into early August.
What’s so special about late July and early August?
Meteorologically, the end of July through the beginning of August is when atmospheric moisture is at its highest on average. The North American Monsoon regularly transports moisture into Colorado in late summer, and at both Grand Junction and Denver, the precipitable water—the total amount of water vapor measured throughout the atmosphere—peaks right around August 1.
Annual cycle of precipitable water at Denver. The daily average is in the black line, the daily maximum in red, and the daily minimum in blue, with rolling averages also shown. From the NOAA Storm Prediction Center sounding climatology site.
Annual cycle of precipitable water at Grand Junction. The daily average is in the black line, the daily maximum in red, and the daily minimum in blue, with rolling averages also shown. From the NOAA Storm Prediction Center sounding climatology site.
At this time of year, the winds through the atmosphere tend to be pretty weak, as the jet stream is positioned far to our north. That means that when storms do form, they don’t tend to move very quickly, and in some situations can stay over the same location for hours. And they have plenty of moisture to tap into (at least by Colorado standards), leading to large rainfall accumulations.
Flash flooding isn’t just about the rainfall, however. It also matters *where* that rain falls. When slow-moving, heavily raining storms develop over complex terrain, or over wildfire burn scars, that water can quickly turn into runoff or a debris flow. The combination of extreme rain rates in a steep canyon led to the Big Thompson flood. There were many unfortunate parallels between this month’s tragic flooding in Texas and the Big Thompson flood, including a rapid “wall of water”, people visiting the area on a holiday weekend, and challenges with communicating warnings, among others. Eve Gruntfest’s analysis of what people did during the Big Thompson flood remains relevant and will provide a point of comparison for studies of the 2025 Texas hill country disaster.
Schematic depiction of the processes that led to the 1976 Big Thompson Flood. From this 2006 USGS publication, which credits the University Corporation for Atmospheric Research for the original.
What can we expect during flash flood season this year?
Last week, on July 22-24, there were some storms that produced heavy rainfall, and several flash flood warnings were issued across the state, but no significant flash flooding was reported. Then, the moisture moved out, resulting in very hot and dry conditions for late July. But the outlook for the coming week has some reason for concern, in part because it’s our climatological peak in flash flooding, and also because a significant surge of moisture will move into Colorado.
Following the near-record highs and dry conditions on Sunday and Monday, a cold front is expected to move through Colorado sometime on Tuesday, with winds from the east (i.e., upslope flow) and plentiful moisture behind it. This figure from NOAA’s Global Ensemble Forecast System shows the precipitable water at Denver going from extremely low on Sunday (below the climatological 10th percentile) to extremely high (above the 90th percentile) on Wednesday. Anytime the PW gets above 25 mm (~1 inch) it warrants paying attention to for the potential of heavy rainfall.
NOAA’s Global Ensemble Forecast System predictions of precipitable water at Denver, for the forecast initialized early on Sunday the 27th. Each colored line represents a different member of the ensemble, and the thick black line is the ensemble mean. The dashed gray lines show the 10th and 90th percentiles and the solid gray line shows the median, based on historical radiosonde observations.
For the last several years, my research group has developed tools that use machine learning to identify the probability of excessive rainfall and severe weather. These models have been consistently showing a strong signal for heavy rainfall along the Front Range on Wednesday, July 30th. In fact, for the current version of these models that have been running since 2020, this is the first time that both models (which were trained using slightly different definitions of ‘excessive rainfall’) have had probabilities greater than 20% four days in advance along the northern Front Range. Probabilities are relatively high for Thursday the 31st as well.
Graphics showing the probability of excessive rainfall from the Colorado State University-Machine Learning Probabilities system, issued on Sunday July 27, and valid for (left) Weds July 30 and (right) Thurs July 31. These zoomed in versions are available on this <a href=”https://schumacher.atmos.colostate.edu/weather/“>website</a>, or visit the main <a href=”https://schumacher.atmos.colostate.edu/hilla/csu_mlp/“>CSU-MLP site</a> for more information about the models.
Flash flooding remains extremely difficult to forecast, because it requires predicting both the rainfall itself, and what will happen to that water once it hits the ground. So it’s too early to say exactly what will play out this week. But when forecast models are pointing to the potential for heavy rainfall that lines up with the climatological peak in flash flooding (the last week of July), it’s worth keeping a close eye on. If you live in a flood-prone area, or will be traveling through a beautiful Front Range canyon this week, take a moment to think about how you’ll get warnings if they are issued (do you have a NOAA weather radio?), and what you might do in case of a flash flood.
Sign that says “Climb to safety! In case of a flash flood”, which are seen in many canyons in Colorado.
Big Thompson Flood, Colorado. Cabin lodged on a private bridge just below Drake, looking upstream. Photo by W. R. Hansen, August 13, 1976. Photo via the USGS.
Heavy rainfall in late July in Colorado’s past caused two of the state’s worst floods, the Spring Creek Flood and the Big Thompson Flood.
The 1997 Spring Creek Flood resulted in five deaths and over $200 million in damages in Fort Collins.
The 1976 Big Thompson Flood led to 144 fatalities and $35 million in damages.
Twenty-eight years ago this week, 14 inches of rain fell on Fort Collins in just over a day, overwhelming the Spring Creek and leading to the deaths of five people.
And 49 years ago this week, more than a foot of rain fell on the Big Thompson River west of Loveland in about four hours, creating a wall of water that swept away and killed 144 people. It’s not a coincidence that both events happened in the same week of July, though they were years apart. It’s flash-flood season in Colorado, and three of the state’s worst floods occurred from mid-July through mid-September, which is also the state’s monsoon season.
It's been a bit since I've done a meteorological deep dive, but the devastating flash #flood in central Texas this July 4th/5th deserve a closer look. #TXwxYes remnants of #Barry were involved helping enhance moisture. A remnant MCV from Mexico on 3 July also played a role.Full evolution below ⤵️
Click the link to read the article on the Grist website (Tik Root):
July 21, 2025
The country watched in horror as torrential rain drenched Texas earlier this month, sweeping at least 135 people to their death. Kerr County alone lost 107, including more than two dozen children at Camp Mystic.
From afar, it would be easy, even tempting, to think that the floods like these could never happen to you. That the disaster is remote.
It’s not.
As details of the tragedy have come into focus, the list of contributing factors has grown. Sudden downpours, driven by climate change. The lack of a comprehensive warning system to notify people that the Guadalupe river was rising rapidly. Rampant building in areas known to flood, coupled with incomplete information about what places might be at risk. ’
These are the same elements that could trigger a Kerr County-type of catastrophe in every state in the country. It’s a reality that has played out numerous times already in recent years, with flooding in Vermont, Kentucky, North Carolina and elsewhere, leaving grief and billions of dollars in destruction in its wake.
“Kerr County is an extreme example of what’s happening everywhere,” said Robert Freudenberg, vice president of energy and environmental programs at the Regional Planning Association. “People are at risk because of it and there’s more that we need to be doing.”
The most obvious problem is we keep building in areas prone to flooding. The Federal Emergency Management Agency, or FEMA, produces readily available maps showing high-risk locales. Yet, according to the latest data from the nonprofit climate research firm First Street Foundation, 7.9 million homes and other structures stand in a FEMA Special Flood Hazard Area, which designates a location with 1 percent or greater chance of being inundated in any given year.
FEMA Flood Zone Top Ten
Rank
State
Percent of Properties
Number of Properties
1
Louisiana
22.83%
542,756
2
Florida
17.15%
1,581,552
3
Mississippi
12.41%
240,526
4
New Jersey
10.57%
364,098
5
West Virginia
9.29%
126,918
6
Arkansas
7.27%
146,226
7
Texas
6.49%
806,827
8
Iowa
6.32%
154,217
9
New Mexico
6.28%
94,265
10
Nebraska
6.18%
71,235
Source: First Street Foundation
In Louisiana, a nation-leading 23 percent of properties are located in a FEMA flood zone. In Florida, it’s about 17 percent. Arkansas, New Mexico and Nebraska are perhaps less expected members of the top ten, as is New Jersey, which, with New York City, saw torrential rain and flooding that killed two people earlier this month.
Texas ranks seventh in the country, with about 800,000 properties, or roughly 6.5 percent of the state’s total, sitting in a flood zone. Kerr County officials have limited authority to keep people from building in these areas, but even when governments have the ability to prevent risky building projects, they historically haven’t. Although one study found that some areas are finally beginning to curb floodplain development, people keep building in perilous places.
“There’s an innate draw to the water that we have, but we need to know where the limits are,” said Freudenberg. “In places that are really dangerous, we need to work towards getting people out of harm’s way.”
Kerr County sits in a region known as Flash Flood Alley and at least four cabins at Camp Mystic sat in an extremely hazardous “floodway” and numerous others stood in the path of a 100-year flood. When the Christian summer camp for girls underwent an expansion in 2019, the owners built even more cabins in the water’s path.
“It’s an unwillingness to think about what future — and the present — have in store for us,” said Rob Moore, the director of the Water & Climate Team at the Natural Resources Defense Council, or NRDC, about Americans’ tradition of floodplain development. ”It’s a reluctance to own up to the reality we live in.”
Many people don’t even know they are in harm’s way. According to NRDC, 14 states have no flood disclosure laws and, in eight, they deem the laws ‘inadequate.’ FEMA maps are also flawed. For one, they can be politically influenced, with homeowners and communities often lobbying to be excluded in order to avoid insurance mandates and potential building costs. And experts say the science underpinning the maps is lagging too.
“[FEMA] only maps main river channels and coastal storm surge areas,” explained Jeremy Porter, the head of climate implications research at First Street Foundation. The agency, he added, specifically doesn’t model heavy rainfall, isn’t great about indicating the risk of urban flooding, and is behind on accounting for climate change.
First Street Flood Zone Top Ten
Rank
State
Percent of Properties
Number of Properties
1
West Virginia
30.25%
413,499
2
Louisiana
26.33%
626,120
3
Florida
19.04%
1,755,363
4
New Jersey
17.32%
596,521
5
Mississippi
15.46%
299,566
6
Kentucky
15.30%
328,283
7
Texas
15.19%
1,888,282
8
Pennsylvania
14.93%
856,889
9
New York
14.27%
771,605
10
Delaware
12.95%
55,535
Source: First Street Foundation
First Street built a flood model that tries to fill in those gaps. It found that 17.7 million people are at risk of a 100-year flood, a number that’s more than double what FEMA’s hazard area covers.The state rankings also change, with mountainous areas susceptible to inland flash-flooding jumping up the list. West Virginia moves into first, with a staggering 30 percent of properties built in flood prone areas. Kentucky climbs from 19th to sixth.
Texas remains at seventh, but the portion of properties at risk goes to 15 percent. In Kerr County, FEMA’s maps showed 2,560 properties (6.5 percent) in a flood zone. First Street’s model nearly doubled that.
“There’s a ton of unknown risk across the country,” said Porter, who says better maps are among the most important goals that policy makers can and should work toward. First Street has partnered with the real estate website Redfin to include climate risk metrics in its listings.
Rob Moore says political will is essential to making that type of systemic change when it comes to not only flooding, but other climate risks, such as wildfires or coastal erosion. Strengthening building codes and restricting development in high-risk areas will require similar fortitude.
“Governments and states don’t want to tell developers to not put things in a wetland, not put things in a floodplain,” he said. “We should be telling people don’t put them in a flatland, don’t build in a way that your home is going to be more susceptible to wildfire.”
Until then, hundreds of communities across the country could — and likely will — be the next Kerr County.
Grist has a comprehensive guide to help you stay ready and informed before, during, and after a disaster.
Lake Mendocino, in Northern California’s wine country, was the proving ground for Forecast-Informed Reservoir Operations. (Source: California Department of Water Resources)
Western Water in-depth: For years, atmospheric rivers were a mystery. now, an innovative dam management approach is putting them to work
In December 2012, dam operators at Northern California’s Lake Mendocino watched as a series of intense winter storms bore down on them. The dam there is run by the U.S. Army Corps of Engineers’ San Francisco District, whose primary responsibility in the Russian River watershed is flood control. To make room in the reservoir for the expected deluge, the Army Corps released some 25,000 acre-feet of water downstream — enough to supply nearly 90,000 families for a year.
In doing so, the Army Corps averted the possibility of a catastrophic flood. But almost as soon as the water headed downstream, the pendulum swung in the other direction. The weather turned dry, and the months that followed proved to be the driest on record in California up to that point. A year later, the reservoir became a drought-cracked mudflat. The local water supplier, Sonoma County Water Agency, was forced to reduce releases by 60 percent during the dry summer, impacting urban and agricultural water users downstream.
State officials were frustrated. Members of a drought task force created by then-Gov. Jerry Brown traveled to Lake Mendocino, tucked into the coastal wine country near Ukiah, to hold a press conference. An exasperated John Laird, the state resources secretary at the time, asked some of the Army Corps’ top brass what they’d been thinking when they sent so much water downstream.
“I just blurted it out,” says Laird, now a state senator. “It was one of those emperor-has-no-clothes moments, because somehow nobody was speaking up about this.”
It made for an uncomfortable moment. But the incident catalyzed a wide-reaching effort to manage dams more nimbly in the face of wildly variable weather, and particularly to meet the challenge of atmospheric rivers — intense winter storms that pummel California and other parts of the West with huge amounts of rain.
In the wake of the controversy at Lake Mendocino, the quest to harness the power of atmospheric rivers birthed a new water-management approach: Forecast-Informed Reservoir Operations, or FIRO. The concept has been tested on three dams in California since 2019, with programs in development for several other dams across the West.
By pairing FIRO with accurate forecasts of where those storms will hit and how much rain they’ll bring, dam operators can work in real time to not only reduce the risk of dangerous floods, but also capitalize on atmospheric rivers’ potential as a source of additional water for protection from drought.
Now, the concept is poised to improve operations at 39 more dams across the arid Southwest and another 71 throughout the rest of the country. That will vastly increase FIRO’s potential and help dam operators stand ready for the wilder weather that the future will likely bring: storms intensified — and made more erratic — by climate change.
Some 50 atmospheric rivers hit the West Coast of the U.S. during the 2024-25 season. (Source: Center for Western Weather and Water Extremes)
Atmospheric Rivers Enter the Lexicon
For decades, the “Pineapple Express,” a type of storm that feeds off warm tropical moisture, figured prominently in local weather lore. By the early 1990s, researchers realized that it was just one kind of a broader category of unique storms that take shape far out in the Pacific. In a 1994 research paper, Yong Zhu, now at North Carolina State University, and MIT’s late Reginald Newell, christened them atmospheric rivers.
According to a 2019 study, atmospheric rivers caused $5.2 billion in damage in Sonoma County over the preceding two decades and were responsible for 99.8 percent of all insured flood losses there. A single 1995 storm — the most damaging event in 40 years of record keeping in the West — inundated the town of Guerneville on the Russian River and caused $50 million in insured losses countywide. The study determined that atmospheric rivers are the primary driver of flood damage in the West.
These powerful plumes of water vapor — which, on average, carry 25 times the flow of the Mississippi River — deliver 30 to 50 percent of total annual precipitation in California.
“Atmospheric rivers are the hurricanes for the West Coast,” says Cary Talbot, the FIRO National Lead with the Army Corps’ Engineer Research and Development Center.
But when they fail to arrive, that can also have a big impact, leaving the state parched and reeling. Their influence isn’t limited to just California, either: In 2021, researchers Mu Xiao, now at the Scripps Institution of Oceanography at UC San Diego, and Dennis Lettenmaier, now at University of California, Los Angeles found that almost one third of snowpack in the Upper Colorado River Basin comes from snowfall brought by atmospheric rivers.
The Army Corps’ primary responsibility is the high-stakes task of controlling floods, or as the agency puts it, “flood risk management.” As a result, the Army Corps tends to be extremely risk averse, and it literally runs its dams by the book: Each of its dams has an individually formulated water control manual with flood control curves, more commonly known as “rule curves,” that are practically chiseled in stone.
“When those things are written, they go through a really rigorous (vetting) process because it’s what we are going to be graded on in the courts,” says Talbot. “When somebody sues us for how we operated, they’re going to look at the water control manual and say: ‘Did the operators follow the rules?’ So, water managers don’t really want to stray too far from what it says.”
Rule curves typically force operators to keep reservoir levels low during wet seasons so they can catch and hold back the rainfall from anticipated storms and reduce the impacts of flooding downstream. But if those storms veer off their predicted course, or dissipate before they arrive, operators can’t get back the water they’ve already released — exactly what happened at Lake Mendocino in 2012.
The public outcry over that incident, which would be followed by the driest three-year period on record until then, helped nudge the Army Corps toward a more flexible approach.
Flood-control releases in December 2012, followed by months of drought, sent reservoir levels in Lake Mendocino — shown here in December 2013 — plummeting. (Source: Sonoma Water)
“The disaster of a really bad drought in California focused congressional attention,” says Talbot. In 2015, Congress added a line in the Army Corps’ budget for a research-led Water Operations Technical Support program. “It wasn’t much money — it was really just $2 million to get it started — but the direction from Congress was to see if we can’t find a better balance between flood risk management and water supply, especially with respect to atmospheric rivers.”
The following year, the Army Corps modified its regulations to allow for the use of forecasts in operations planning. Actually incorporating that change into each dam’s water control manual, many of which are decades old, still required an administrative process that typically takes several years. But the announcement was a significant first step in the shift away from the hidebound rule curves that governed dam operations.
To make it all work, though, dam operators had to have weather forecasts that they could trust.
Decoding Atmospheric Rivers
As it happened, weather researchers were already on a quest to crack the mystery of how atmospheric rivers work. A key figure in the effort was Marty Ralph, who spent more than two decades as an atmospheric scientist at the National Oceanic and Atmospheric Administration (NOAA) beginning in 1992.
Marty Ralph, head of the Center for Western Weather and Water Extremes (CW3E), worked with colleagues to vastly improve the accuracy of atmospheric river forecasts. (Source: CW3E)
Ralph had begun studying cyclones off the U.S. West Coast in the mid-1990s. To get an up-close view of the storms in their spawning grounds far out at sea, he wheedled and cajoled the use of weather research aircraft from NOAA, NASA and the Air Force that sat idle following the busy summer hurricane season on the Gulf Coast. (At one point, Ralph experimented with — but ultimately gave up on — using a long-range surveillance drone called the Global Hawk, an $80-million-plus “hand-me-down,” as he puts it, from the Air Force to NASA.)
Ralph’s research focus gradually zeroed in on what would turn out to be atmospheric rivers. He didn’t read Zhu and Newell’s groundbreaking work on the phenomenon until 2003, but when he did, “the light bulb just went off, like, ‘Oh — that’s what we’re studying!’”
Ralph organized a series of annual “field campaigns” to learn more about atmospheric rivers and racked up more and more flight time. In 2013, he left NOAA to start the Center for Western Weather and Water Extremes, or CW3E, at the Scripps Institution of Oceanography at UC San Diego. There, working with other researchers, he continued to research atmospheric rivers’ origins and behavior. But along the way, he says, “it became clear to me that we should be trying this as an operational program to help with forecasting” so that dam operators could have a more accurate real-time picture of individual storms’ paths and intensity.
Lake Becomes Proving Ground
Meanwhile, Lake Mendocino was emerging as the first test case for FIRO. At the time, Jay Jasperse was the chief engineer and director of groundwater management for Sonoma Water, which gets much of its supply from the lake. Despite the Army Corps’ new openness to using forecasts for more flexible dam operations, he says, there initially was “a lot of skepticism from some parties, and there was a lot of concern that the Army Corps was going to be incurring a lot of liability, and that this is going to negatively impact their flood risk management operations.”
During the 2020 water year, FIRO allowed an extra 19 percent, or 11,175 acre-feet of water, to be captured in Lake Mendocino. (Source: Sonoma Water)
“There were some spirited debates, and I think it took us a few years just to learn about each other and about each other’s agencies and how we worked and what our needs were,” Jasperse says. “But we all stuck with it, because the overall idea just made too much sense.”
Before FIRO was tried at Lake Mendocino, it went through an exhaustive modeling process to determine how it would affect dam operations. Gradually, Jasperse says, “we started seeing this was pretty doable, and the Army Corps started to get more comfortable with it.”
After extensive modeling, FIRO was first tested at Lake Mendocino during the 2020 water year and immediately proved its worth: That year, FIRO allowed an additional 11,175 acre-feet of water to be captured and stored there. That helped show that dams originally built principally for flood control could also be used to increase water storage and reliability.
“There’s ways to do both under the right conditions, and Lake Mendocino is proof of that,” says Patrick Sing, the lead water manager for the Army Corps’ San Francisco District. “When all the weather forecasts say it’s going to be dry, we can hold onto a lot of water instead of releasing it. We’re not impairing our flood management mission, and we’re doing our part to be stewards of a resource that’s very valuable in the event that the next year is a drought.”
Still, Sing notes that FIRO isn’t a silver bullet.
“You do all this research and modeling, but at the end of the day, it comes down to the reservoir operator to make a decision, and their agency is going to be held responsible for that decision,” he says. “If they’re not comfortable enough with FIRO, it’s probably not going to move forward. And they shouldn’t be forced to do it. They should be comfortable and convinced that it is safe to do.”
At Lake Mendocino, Sing says, “there’s been enough research and development and testing that we’re comfortable doing this.”
Forecast-Informed Reservoir Operations are currently underway or being actively assessed at 21 dams on the West Coast. (Source: U.S. Army Corps of Engineers)
Expanding FIRO
In 2022, FIRO-based operations were extended to Lake Sonoma, the other reservoir that supplies Sonoma Water within the Russian River watershed. And this year, FIRO was put in place on a preliminary basis at another dam, Prado Dam on the Santa Ana River in Southern California. Since 2020, FIRO has contributed to an additional 95,000 acre-feet of storage in the three reservoirs — an amount equal to just over 75 percent of Lake Mendocino’s total volume.
“We’re getting better and better,” says Jasperse, who now works as a consultant for both Sonoma Water and CW3E. “Everybody’s getting more and more experience every year.”
FIRO won’t work at all dams, especially in areas where forecasts are less reliable. In the summertime in the Deep South, for example, “pop-up thunderstorms can happen any day, any time,” says the Army Corps’ Talbot, who is based in Mississippi. “We’ve got a lot of moisture coming up from the Gulf, so it’s much harder to predict that kind of impactful rain here than it is in the West.”
But experience has shown that where FIRO is viable, it can provide additional water at a cost far lower than traditional approaches for boosting water supply, like increasing the size of a dam.
“Those are lengthy, expensive and complicated processes. It’ll take, in some cases, a decade or more to realize those benefits,” says Talbot. “FIRO is something that we literally can do today. We didn’t have to change the dam at all. This is just taking existing infrastructure and making it work better.”
At Prado Dam in Southern California, the Orange County Water District is expanding the possibilities of FIRO by pairing it with a groundwater recharge program to ensure that water that’s released from the dam isn’t lost. There, releases can be diverted into recharge basins downstream, where the water then soaks into the local aquifer.
Adam Hutchinson, the district’s recharge planning manager, says the agency anticipates getting an average of an extra 6,000 acre-feet per year through its FIRO operations. That’s not a lot of water, but it makes a big difference. The water retailers in the district’s service area rely on groundwater for the majority of their water supply, but they still have to import about 15 percent from Northern California and the Colorado River, at a cost of more than $1,000 per acre foot.
“So for that 6,000 acre-feet that we hope to get,” he says, “that’s $6 million a year that we’re saving by putting this free water in the ground.”
“AR Recon” flights to improve the accuracy of atmospheric river forecasts, which have been carried out from California and Hawaii for years, are now also being launched from Guam and Japan. (Source: U.S. Air Force 403rd Wing)
More Dams on the Radar
While FIRO is currently in place at just three dams, it is on the brink of a dramatic expansion. Earlier this year, two more dams — both significantly larger than any at which FIRO is currently in place — were added to the roster of potential FIRO sites: The Yuba Water Agency’s New Bullards Bar on the Yuba River, and Lake Oroville, the 3.5-million-acre-foot flagship of the State Water Project on the Feather River. A group of federal and state agencies and CW3E completed a final viability assessment at the two dams. The California Department of Water Resources and Yuba Water are now contemplating what steps to take to put FIRO into practice at those facilities. (In 2019 a more limited program, often referred to as “FIRO Lite,” went into operation at the federal Bureau of Reclamation’s Folsom Dam, on the American River just upstream of Sacramento.)
FIRO-implementation efforts are also in progress for several other dams: Seven Oaks, upstream of Prado on the Santa Ana River; a system of 14 dams in Oregon’s Willamette Valley; and Howard Hanson Dam near Seattle.
And now, FIRO is about to get a much bigger boost. In May, the Army Corps completed an initial evaluation of the suitability of FIRO at each of the 593 flood-control dams under its authority nationwide. It found that implementing FIRO is promising at 110 of those, including 39 across the Southwest. Another 299 dams nationwide may have potential as candidates for FIRO, although they face some significant barriers to implementation.
The Army Corps is now moving forward on two more-detailed rounds of evaluation on the 110 top-tier dams. Then, beginning in 2027, it will move toward implementing FIRO at those with the most potential.
The biggest impediment to more widespread implementation of FIRO remains a lack of accurate forecasts in parts of the country that don’t experience atmospheric rivers.
“The most common reason it’s not going to work is forecast skill” — essentially, accuracy, says Talbot. “That’s the leading factor for eliminating dams in the screening process.”
In the West, the effort to improve forecasts only continues to advance. In December 2023, then-President Biden signed the Atmospheric River Reconnaissance, Observations and Warning Act, which had been introduced by California’s senior U.S. senator, Alex Padilla. The law called for what has become known as the AR Recon aerial surveillance program, led by Ralph and Vijay Tallapragada of the National Weather Service, to be expanded throughout the full winter season. The past two years, AR Recon carried out 107 reconnaissance flights across the Pacific, flying not only out of California and Hawaii, but Guam and Japan, as well.
“The farther West we go, the greater the lead time improvement we get” in forecasting, says Ralph. “We’ve been able to improve the forecast of extreme precipitation in California by about 12 percent just by adding the (AR Recon) data. That’s the equivalent of 10 years of the typical process of improving forecasts through research — so we’re buying a decade of advances just by adding these data.”
The Army Corps’ Talbot says those strides forward are welcome news for dam operators.
“If you take a water manager and you give them three extra days of lead time, they can do a lot with that. Water managers always tell me, ‘Look, you give me a weather crystal ball and I’ll manage water better,’” he says.
“As long as we keep the aircraft flying and people advancing on the science and the meteorological wizardry, these water managers are getting closer and closer to that crystal ball.”
Those who lived through it will tell you that the spring of 1965 was not like other springs in eastern Colorado. From Fort Collins to La Junta, the land shuddered and groaned, afflicted with mini-earthquakes and baby twisters, freak hailstorms and gale-force winds. But to say people should have paid attention is to wrap yourself smugly in half a century of hindsight. At the time, the bad winds and unfriendly skies were seen as mere anomalies, a little Wild West weather, nothing more. Nobody could anticipate what was coming because there had been nothing like it around here for generations, and the past was not much studied in these parts. Yes, it was wet, but after three years of drought, the farmers welcomed the rain. June arrived gray and damp, more like a New York November than the parade of dry, sunny days and mild nights the citizens of Denver had come to expect. A cold front from the Northeast butted against the Front Range and camped out, entwined with a flow of warm, humid air oozing up from the Gulf of Mexico. The unholy coupling went on for days, blotting out the sun and generating bursts of what the meteorologists called “orographic precipitation.” A few parched burgs got hosed. For the most part, though, the bank of dark thunderclouds just sat there over the mountains, swollen and ominous. Then the signs, the portents, became too violent to ignore…
The main event came on Wednesday, June 16, starting at about half past one in the afternoon. It began on the southern edge of Douglas County, with a hard rain and a tornado that ripped through the tiny town of Palmer Lake, peeling the roofs off thirty houses like so many soup-can lids. The twister scooped up water from the lake and dumped it into the houses, mixed with frogs, fish and gravel…Then it went away. But the rain kept coming. The rain was torrential. It was record-busting. It was biblical…It was no longer simply a flood. It had leapt in rank to a hundred-year flood, or even a five-hundred-year or thousand-year model, a millennial event. State patrol officers reported a wall of water estimated to be twenty feet high headed for Littleton, carrying in its wake a tangle of trees, asphalt, cars and other debris, with a second crest not far behind…It would be the darkest night in Denver’s history, a night of destruction far exceeding anything the city had ever known. The ’65 flood claimed 21 lives and resulted in property losses statewide estimated at $543 million — adjusted for inflation, that’s more than $4 billion in 2015 money — with the worst damage in the Denver metro area. Other floods in the state’s history have resulted in a greater loss of life; the Big Thompson flash flood in 1976 killed 143 people, while the death toll from a 1921 flood in Pueblo has been set as high as 1,500 people. But no natural disaster has had a more profound or lasting impact on state policy — or in shaping the Denver we know today…
The flood ravaged hundreds of homes and all but obliterated dozens of businesses; many never recovered. But it also triggered a painful re-examination of a century of haphazard growth and myopic planning, during which the city had abused and poisoned its main waterway and ignored the communities on its banks. The disaster became a trigger for long-delayed flood-control projects, ambitious urban-renewal plans and a bitter diaspora for longtime residents of Auraria…It was also the start of a renaissance along the South Platte itself. What was once the city’s greatest eyesore is now its showcase. But the transformation of the river didn’t occur overnight, or even over a decade. It took the determination of many officials, businesses, philanthropists and volunteers, as well as a still-evolving discussion of what the city lost — and found — in the flood.
The Colfax Viaduct during the 1965 flood of the South Platte River. Denver Public LIbrary
A welding company at West 11th Avenue and Zuni Street.
Denver Public Library
Trains at 14th St and South Platte River June 19, 1965. Photo via Westword.com
September 2013 flooding via AWRA Colorado Section Symposium
Click the link to read the release on Governor Polis’ website (Olga Robak and Shelby Wieman):
April 21, 2025
Broomfield, Colo. — Today, Governor Polis and the Colorado Department of Agriculture’s Agricultural Drought and Climate Resilience Office (ADCRO) announced new grant opportunities to support climate resilience projects within the state’s agricultural sector.
“In Colorado we are committed to mitigating the risk associated with climate change, by investing in innovative clean energy technologies, and providing economic avenues for our farmers and ranchers to continue to provide healthy and fresh produce to all Coloradans for generations to come,” said Governor Polis.
Climate resilience is the ability to anticipate, prepare for, respond to, and recover from hazardous events, trends, or disturbances related to climate. The Climate Resilience Grants are designed to provide crucial financial assistance to farmers and ranchers who have experienced adverse effects due to climate change-induced disasters and are seeking to enhance their resilience against future climate-related challenges.
“Dealing with extreme weather, resulting from climate change, and an increasingly dry environment is an everyday challenge for Colorado’s farmers and ranchers,” said Colorado Commissioner of Agriculture Kate Greenberg. “This funding will help producers who have experienced these challenges or are at risk for worsening climate disasters to be better prepared to withstand these events now and into the future.”
This is the first grant opportunity at CDA focused on helping producers who have experienced a disaster. Specifically, this funding addresses a critical need producers have to ensure their operations are resilient and can better withstand future climate pressures.
Climate change affects all sectors of agriculture, from workforce and the supply chain, to livestock and farm and ranch profitability. This funding will help tackle issues throughout the supply chain and invest in leaders around the state, who can later serve as positive examples or resources for their neighbors. Climate-related disasters are only increasing, and this funding can create demonstrations on what it means to recover in a resilient way. CDA will select a few priority climate impacts to focus on each funding cycle, based on needs around the state. This year, priority projects will be those that address impacts of drought, snow events, and wildfire. In future years, CDA will work with partners to determine priorities based on needs. Other disasters that are exacerbated by climate change include flooding, extreme heat, and severe storms.
Farmers and ranchers are eligible, as are producer-facing organizations, tribes, and local governments. Grant applications must demonstrate how producers will benefit, how the grant deliverables will address future climate disasters, and feasibility of the project. Matching funding is not required, though applicants will receive more points if they use matching funds. The maximum grant award is $30,000.
The online application is available on the ADCRO website. Grant applications are due on May 29.
The ADCRO team will hold an informational webinar on Wednesday, May 7, at 2:00 p.m., and interested participants can register via Zoom or find the registration link on the ADCRO website. The informational session staff will present an overview of the eligibility criteria and application process and answer producer questions.
This initiative represents a significant step forward in supporting Colorado’s agricultural sector in adapting to and mitigating the impacts of climate change and fostering a more resilient and sustainable agricultural landscape for the future. These grants also align with CDA’s strategic priorities, especially Direction Three: Environmental Stewardship and Climate Resilience. These grants will work with other CDA programs to create healthy and resilient farms, ranches, and food supply chains.
Click the link to read the report on the UCLA website (Noah Garrison, Lauren Stack, Jessica McKay, and Mark Gold). Here’s the executive summary:
The impacts of climate change and prolonged drought on water scarcity in the Western United States have accelerated since the end of the 20th century. The Colorado River has been strained by a history of excessive withdrawals and long-term drought. Increasingly less water is available across the seven Colorado River Basin states—Arizona, California, Colorado, Nevada, New Mexico, Utah, and Wyoming—for natural ecosystems and the 40 million people that rely, in part or in whole, on its diverted flows to cities and farms. Faced with this challenge, the importance of recycled water at a large scale has never been greater. Water recycling of treated municipal wastewater is a cost-effective source of reliable, sustainable water supply; people shower, flush toilets, and wash clothes and dishes on a regular basis even in times of fluctuating water availability, and these waste flows go to publicly owned treatment works (POTWs) in urban areas.
To assess the current state of water recycling across the Colorado River Basin and its affected states, UCLA Institute of the Environment and Sustainability, in partnership with Natural Resources Defense Council, has investigated water recycling progress and policy development across the seven states in the basin. We analyzed the amount of water entering municipal wastewater treatment plants treating an average of greater than 1 million gallons per day across the 2022 calendar year, the amount these plants reclaim or reuse, and the amount they discharge back into the environment. Our analysis demonstrates that while individual treatment facilities, cities, or even regions may be making substantial progress toward water sustainability, most basin states are falling well short of their potential to reuse wastewater. Overall, the Colorado River Basin states are missing opportunities to ensure a safe, sustainable, climate-resilient supply of water in a hotter, drier future.
While across the Colorado River Basin, an average of 26% of municipal wastewater from POTWs was recycled, there are striking differences between states that are prioritizing reuse and those that are falling behind. Arizona (reusing 52% of treated wastewater) and Nevada (as much as 85%) deserve accolades for their efforts to develop the recycled water supply. California, which produces by far the largest volume of wastewater, only recycled 22% of its treated wastewater in 2022. Of the remaining four states, New Mexico recycles a similarly modest 18%, and Colorado (3.6%), Utah (less than 1%), and Wyoming (3.4%), for a variety of state-specific reasons, have made little to no progress to date on reusing meaningful volumes of treated wastewater. Further and distinct breaks appear to exist between efforts and progress made by states in the lower Colorado River Basin (Arizona, California, and Nevada) and those of the upper basin (Colorado, New Mexico, Utah, and Wyoming). In 2022, the upper basin states as a whole recycled less than 5% of their assessed influent, as compared to more than 30% for the lower basin. (See Figure EX-1 for state-by-state results of our analysis.)
Figure EX-1. Volume of municipal wastewater effluent vs. current reuse by state across the Colorado River Basin for 2022. Totals include figures for the whole state, not only for wastewater generated in the Colorado River watershed. Credit: UCLA
In addition to the lack of progress on wastewater reuse, the overall lack of data on wastewater recycling, including volume, level of treatment, and end use of the recycled water is also glaring. California maintains the most comprehensive database of recycled water, including its end uses, through the California Open Data Portal (see SWRCB, 2022). While we were able to gather data directly from individual wastewater treatment facilities in other states, determining how much water is being recycled was a significant challenge, and determining how much recycled water is ultimately directed to municipal, agricultural, or industrial users was often limited to qualitative description, if information was available at all.
All of the state results have been achieved in the absence of strong federal recycled water policy or any federal regulation. The lack of federal support for or consistency among state programs has hampered efforts and stands as a significant impediment to further growth of recycled water use. Promoting consistent and growing national water reuse will require action at both the federal and state level.
To this end, through our investigation we have developed a set of recommendations for the U.S. Environmental Protection Agency (EPA) and other federal and state partners and stakeholders. Additional detail and guidance for these recommendations is presented in the main report body and conclusions. These recommendations include the following:
Within two years, EPA, working with state partners, water agencies, and nongovernmental organizations, should develop a model state program and ordinance for recycling of municipal wastewater with minimum elements.
EPA should improve data acquisition and management, including developing guidance for standardized facility-level reporting and state data sharing, to ensure availability of information and comparability of data between states.
EPA should further develop and disseminate the latest science and technical information on treatment processes and pathogen risk assessment for different sources of water and reuse applications.
In partnership with the states, EPA should develop wastewater reuse goals and timelines.
EPA—working with other federal agencies including the Bureau of Reclamation and the Departments of Agriculture, Energy, and Defense—should develop and implement funding strategies beyond those already in existence, including furthering the Pilot Program for Alternative Water Source grants.
In addition, our analysis uncovered that, across the Colorado Basin states, inconsistency between programs and overall lack of state-level oversight or even awareness of wastewater recycling efforts in several states is alarming. Recommended improvements needed at the state level for those states without these programs include:
Work with local water reclamation or reuse agencies to develop funding strategies to meet targets for 30%, 40%, or 50% goals.
Work with EPA to establish numeric targets for wastewater reuse for each state, with timelines and interim goals. Figure EX-2 provides a breakdown of the total water supply that would be made available for each state with targeted goals of 30%, 40% or 50% reuse by 2040, a number already exceeded by two of the basin states.
Improve data acquisition and management, as well as reporting requirements where applicable, for wastewater treatment facilities and wastewater reuse operations.
Conduct assessments of current state legal and regulatory requirements to identify barriers to wastewater reuse and develop formal state policies for overcoming those barriers.
Overall, substantial action needs to be taken to achieve sustainable water management across the Colorado River Basin. Better use of climate modeling, water pricing that does not encourage waste and unreasonable use, stronger water conservation and efficiency programs and requirements for agricultural and urban users, enhanced stormwater capture, greater and longer-term cutbacks in Colorado River water withdrawals, and, critically, a substantial increase in water reuse all must be embraced as climate resiliency solutions.
Figure EX-2. Recycled water volume created for each state at targeted reuse percentage of 30%, 40%, and 50%of the state’s total wastewater influent, with net increase in overall potential available water supply. Credit: UCLA
As shown in Figure EX-2, if the Colorado Basin states other than Arizona and Nevada were to increase wastewater reuse to even 40% of treated influent it could increase current recycled water availability by nearly 900,000 acre-feet per year (AFY) over current efforts. Reuse of 50% of influent would increase water availability by nearly 1.3 million AFY. This represent a significant percentage of the projected shortfall on the Colorado River, and a rsolution that should be pursued aggressively to ensure sustainable management of the river.
Map of the Colorado River drainage basin, created using USGS data. By Shannon1 Creative Commons Attribution-Share Alike 4.0
Drops wastewater rate increase from 30 percent to 10 percent
At a Dec. 20 special meeting, the Pagosa Area Water and Sanitation District (PAWSD) Board of Directors approved the district’s 2025 budget…The 2025 budget includes $1,345,822 in revenues for the PAWSD general fund, primarily from property taxes, and $1,647,189 in expenditures, a 20 percent increase from 2024…The budget indicates that legal and professional spending, as well as spending on maintenance and computer support and upgrades, are anticipated to increase in 2025…
The general fund balance at the end of 2025 is projected to be $1,448,928, down 17 percent from the end of 2024…The PAWSD water enterprise fund is projected to receive $33,450,308 in revenues, including $5,609,336 in service charge revenue, $1 million in capital investment fee (CIF) and raw water acquisition fee revenue, and $25.2 million in loan proceeds, which will be used for the continued construction of the Snowball Water Treatment Plant expansion. Overall, revenues for the fund are projected to rise 5 percent from 2024. Expenditures for the fund are budgeted at $35,934,411, an 18 per-cent increase from 2024
The city of Durango’s approach to stormwater management is largely reactionary: When storm drains become clogged, crews reshuffle their priorities to clean the drains. Infrastructure around the city is failing, and after heavy rains, debris is often swept across streets, parking lots and into riverways. The Public Works Department is in desperate need of dedicated staff to implement a proper preventive maintenance program, Bob Lowry, interim Public Works director, said. Besides two street sweeper operators in its streets division, Public Works lacks any staff dedicated to preventive maintenance to stormwater infrastructure, he said. And it lacks a dedicated funding source for managing its stormwater system. He said the system consists of nearly 55 miles of pipe and 2,392 storm drainage inlets in curbs and gutters, in addition to natural drainage channels.
Residents have expressed concerns about sediment unloading into the Animas River after heavy rain and snow melt, which threatens ecology and wildlife, and flood-prone zones and failing stormwater infrastructure around town imperiling private and public property.
Last week, Lowry pitched City Council the idea of establishing a stakeholder committee tasked with identifying a suitable long-term funding source. Councilors will consider a resolution establishing such a group at their next meeting in November. In a presentation with photos of problem areas around town, he highlighted pipes clogged by debris, flood zones and erosion…
A dedicated stormwater maintenance fund would facilitate a crew of four additional staff and a supervisor, street sweeping, inspecting pipes and infrastructure with camera feeds, and inlet and pipe cleaning operations, he said…And, he hopes such a committee and the Durango Financial Advisory Board would conclude stormwater management fees that would be charged through residents’ and businesses’ utility accounts are the best funding option.
Click the link to read the release on the CIRES website (Ben Livneh, Nels Bjarke, Parthakumar A. Modi, Alex Furman, Darren Ficklin, Justin M Pflug, and Kris Karnauskas):
June 25, 2024
With record rainfall projected to continue into the future, many worry extreme flooding will follow suit. But a new CIRES-led study published today in Science of the Total Environment found an increase in precipitation alone won’t necessarily increase disastrous flooding — instead, flood risk depends on how many days have passed between storms.
Credit: CIRES
In the study, CIRES Fellow and Western Water Assessment director Ben Livneh and his colleagues, including CIRES Fellow Kris Karnauskas, looked for a new way to understand soil moisture and how it impacts flooding. The research team knew soil moisture is important when understanding floods, but measuring soils effectively is challenging.
So they found a proxy for soil moisture: precipitation intermittency, the length of a dry spell between precipitation events. Simply put: after a prolonged time since the last rain, it takes a larger storm to generate flooding; with fewer days between storms, a wider range of conditions can lead to flooding.
“We can actually understand changes in flood risk based on the number of days since the last rain event,” Livneh said. “We wanted to make it straightforward because soil water is hard to predict.”
The research focused on semi-arid and arid regions and looked at rain as a form of precipitation rather than snow. To create a value for precipitation intermittency, researchers looked at historical observations of 108 watersheds around the U.S. from 1950-2022. Through analysis of these observations, the goal was to understand whether wet or dry soils preceded heavy rain events — and how that influenced floods.
Soil moisture is notoriously difficult to estimate or simulate, results can vary from one person’s backyard to their front yard, and understanding how soil moisture influences flood events is even harder. Nels Bjarke, a Western Water Assessment postdoctoral researcher, ran the analysis for the study.
“We don’t have comprehensive observations of soil moisture that are continuous over space or continuous through time,” said Bjarke. “Therefore, it can be difficult to apply some sort of predictive framework for flooding using just soil moisture because the data are sparse.”
Yet, precipitation is widely measured, so the team tested precipitation as a proxy for soil moisture by looking at the timing of rain, rather than the amount.
Through analysis, the team created a timescale as a meaningful value for precipitation intermittency. They categorized intermittency into segments of five days. Ten days or less indicated low intermittency, when a high range of storms could produce floods. Drier periods with 20 days or more between storms defined high intermittency, and only serious storms could produce floods. Overall, flood probabilities are 30 percent lower following long periods of dry spells.
Planet Bluegrass during the September 2013 flood. The Wildflower Pavilion is the building at center. (Courtesy of town of Lyons)
The 2013 floods in Boulder are a real-life example of how precipitation intermittency is applied to flood projections. Seven days of heavy rain nearly doubled the previous record for rainfall. The event displaced hundreds and caused $2 billion in property damage, according to NOAA.
Forecasters and emergency managers could use the paper’s findings to anticipate very real flooding risks. Since wide-ranging observations of precipitation exist, forecasters can take the findings of this paper and use intermittency to help predict the likelihood of a flood.
“As we enter the era of big data, we can benefit from simple proxies like the dry-spell length as a way to more intuitively understand extreme events,” said Livneh.
Authors of the paper “Can precipitation intermittency predict flooding” in Science of the Total Environment are: Ben Livneh, Nels Bjarke, Parthakumar A. Modi, Alex Furman, Darren Ficklin, Justin M Pflug, and Kris Karnauskas (CIRES Fellow).
Drought-challenged U.S. communities are overlooking what could be a major source of relief: stormwater, which generates more water annually than is stored in lakes Mead and Powell, the largest reservoirs in the West.
But Colorado and other states with laws against collecting stormwater are likely to miss out on its potential.
Lakes Powell and Mead store some 49.4 million acre-feet, according to the U.S. Bureau of Reclamation.
That 59.5 million acre-feet of stormwater is roughly 93% of the water used by all U.S. cities and industry in 2015, according to the Pacific Institute. An acre-foot serves about two to three U.S. households for a year.
But because this source has never been fully analyzed or developed, it is not yet widely used.
“Our results indicate that there is a vast potential for stormwater capture all across the country,” said Bruk Berhanu, a lead author of the study and senior researcher in water efficiency and reuse at the Pacific Institute.
With climate change and warming, streamflows are projected to decline in Colorado and elsewhere in the coming years, and there is increasing pressure to find new sources and better use existing water supplies.
“As communities in the West face increasing strain on their water supplies, planners have been looking at strategies that use an ‘all of the above’ approach,” Berhanu said. “We aren’t suggesting stormwater could cover all of our future water supplies, but they can help fill the gap between our current water supplies and projected demands.”
Estimated annual urban stormwater runoff by state
Source: Pacific Institute, “Untapped Potential: An Assessment of Urban Stormwater Runoff Potential in the United States”
But use of stormwater comes with conditions. It would require major new facilities to capture, store and treat it if it is to be used for drinking water. If too much is captured, it could reduce water available for the environment, according to the report.
And in some places, such as Colorado, the practice isn’t allowed.
Under what’s known as the Prior Appropriation Doctrine, water users with the oldest, or most senior water rights, get their water first, even if their diversion point lies farther downstream than someone else’s. And stormwater, once it reaches the stream, becomes part of someone’s water right. If larger amounts were captured, it could jeopardize other water rights already in place.
The City of Aurora, and others, have actively worked for decades to find new ways to make their water supplies stretch further, but stormwater capture is not one of them.
“What works in some states, does not work in Colorado,” said Greg Baker, a spokesman for Aurora Water, referring to the legal prohibitions against the practice.
Could that change? Possibly.
Colorado has taken major strides in recent years to re-examine how water that falls from the sky may be collected and used in ways that don’t harm neighbors downstream. In 2009, for instance, the state passed a law that opened the door to rainwater harvesting in some rural areas and then in 2016 allowed homeowners across the state to use rain barrels to capture small amounts of water for use on gardens and lawns.
That state also created a pilot program to encourage more research. The Dominion Water and Sanitation District in Douglas County, to date, has been the only water district to participate in the pilot, according to Andrea Cole, Dominion’s general manager. Soon it may be able to legally capture rainwater when, later this year, it will ask a state water court to approve collecting rainwater commercially to serve parks and other public spaces in Sterling Ranch, one of the most water-efficient residential developments in the state.
To get to this point, Dominion spent 15 years tracking how much rain fell on the development before anything was built, and tracking how much more water was generated after new homes and roads were built and the water began falling on roofs and other solid surfaces, instead of the soil.
“In Colorado, water is precious, so every last drop is accounted for in somebody’s system. … But when you change the land from an open prairie to a development, the water no longer [sinks] into the soil, or makes its way to nearby streams,” Cole said.
Measuring the water has and will continue to be a meticulous process, she said.
“We can only capture that water [that falls on] Sterling Ranch. … If it is outside the ranch, we have to allow it to go back to the stream,” Cole said.
Sterling Ranch sharply limits outdoor water use, so lawns are scarce. The plan is to use the rainwater for parks and gardens so that homeowners with little of their own grass have a place to play and relax, Cole said.
The Pacific Institute’s Berhanu said he is hopeful that the new report will generate more interest in developing stormwater to help fill looming gaps in water supplies.
“In a state like Colorado, we would hope that this information builds the case for revisiting those policies and making adjustments to enable more stormwater capture,” Berhanu said.
The potential is there, Cole said.
“We are the first out of the chute, and being the first is always scary. But people are watching to see what we can get through water court,” she said. “Once there is a [legal] water right for it, we are going to see new developments trying to use this.”
More by Jerd SmithJerd Smith is editor of Fresh Water News. She can be reached at 720-398-6474, via email at jerd@wateredco.org or @jerd_smith.
In its second year of grant funding, the Windy Gap Environmental Fund (WGEF) has awarded four Grand County organizations funds for various environmental projects. The Northern Water Municipal Subdistrict contributed funding as part of the settlement to end the federal lawsuit over Chimney Hollow Reservoir. The WGEF Committee awarded $680,000 in 2023, in addition to $1,065,000 of grant funding allocated in 2022, for a total of nearly $1.75 million.
The largest grant awarded in December 2023 was for $401,179 to Learning by Doing for its final design and implementation of the Willow Creek Restoration Project. Learning by Doing is a solution-focused collaborative group of local, state, federal and nonprofit water stakeholders charged with safeguarding Grand County rivers and streams. Learning by Doing was also awarded another $25,000 grant for the design of a stream restoration project at Kaibab Park.
Additional grants awarded include:
$150,000 to the Town of Fraser to complete a stormwater infrastructure survey.
$104,144 to the Grand Lake Recreation Foundation for design of river restoration of the Colorado River in the vicinity of the Red Top Valley Ditch diversion.
The WGEF is administered by the Grand Foundation, while the WGEF Committee reviews proposals and allocates grant funding. The committee is composed of three representatives from the Municipal Subdistrict and three from the Upper Colorado Watershed Environmental Team.
Construction of Chimney Hollow Reservoir began in August 2021 after the Municipal Subdistrict won a federal lawsuit in the first round that challenged the permit issued by the Bureau of Reclamation and Army Corps of Engineers. The Municipal Subdistrict then settled during the appeal process, which required a $15 million contribution throughout the four-year construction timeline that will be administered by the Grand Foundation to pay for projects that enhance the Colorado River and its many tributaries in Grand County.
In the semi-arid Colorado climate, long periods of hot and dry conditions are often broken up by rapid torrential rains. Stormwater runoff can contribute to water pollution and cause flooding and erosion, creating a paradox of water being precious and scarce, yet hazardous and contaminated.
What if stormwater could instead be collected in biological green spaces to minimize runoff and filter the water for reuse as irrigation?
The multi-faceted project will examine how different types of captured water (i.e., graywater, stormwater, etc.) affect various combinations of soil and vegetation. Additionally, the researchers will collect data on vegetation in street-level planters and green roof systems that will maximize the removal of toxins and pollutants from water.
Jen Bousselot, Assistant Professor in the Department of Horticulture and Landscape Architecture. Photo credit: Colorado State University
“Typically research focuses on one element. By approaching this work with equal weight given to the agriculture side and the engineering side, we have a robust project that is more valuable and useful to the end users,” said Bousselot, an expert in green roof development and urban horticulture.
By testing different sources of water, soil, and vegetation, their research will identify ideal combinations for urban landscaping that reduces pollution, minimizes damage from flooding and runoff, and sustainably treats and reuses stormwater. The four-year project will also capture how the vegetation responds in each weather season in Colorado.
CSU Spur serves as collaborative hub
At the Hydro Building of CSU Spur, the team has access to concrete test plots in Hydro’s Backyard to function as experimental bioretention cells mimicking streetside planters commonly found in urban landscapes. Spur’s Hydro Building also has a green roof space for testing the viability of vegetation irrigated with different non-potable water types.
Sybil Sharvelle, Associate Professor of Civil and Environmental Engineering. Photo credit: Colorado State University
“I love that Spur serves as a space to connect CSU’s agriculture and water engineering programs where we have enhanced collaboration opportunities. We can work on projects in the same location, and with the Terra Building right beside the Hydro Building, it is an area for elevated research where students get great experience,” said Sharvelle, an expert in urban stormwater management and head of the Water Technology Acceleration Platform Lab (Water TAP) at Spur.
“The outdoor lab at Hydro is a great place to interact with the public. I think school kids will love to visit, learn about how we are trying to protect our water resources, and hopefully be inspired to help too,” stated Colin Bell, Senior Engineer at the Division of Green Infrastructure within the Department of Transportation and Infrastructure for the City and County of Denver.
Sharvelle and Bousselot are co-advising civil engineering PhD student Amanda Guedes Salerno. Salerno will manage plant growth, measure water outflow from the bioretention cells and green roof, and other hands-on data collection at Spur. She earned her undergraduate degree in environmental engineering in her home country of Brazil, then came to CSU for a master’s degree in horticulture.
Her current PhD research is in many ways a continuation of her master’s research with green roof systems.
“The facility at Spur is amazing,” said Salerno. “As a master’s student, I studied green roof infrastructure but had to perform research in small simulation boxes. Now, we can access the fully functional green roof at Spur. The integration between the water science and horticulture science in one place is incredible.”
Partnering for the public good
The results of this research will provide guidance on stormwater treatment, water quality improvement, and the viability of vegetation in bioretention cells and green roof systems. The guidance will then inform future projects by the Division of Green Infrastructure and the Denver metro area’s Mile High Flood District(MHFD), who are jointly funding the project.
“This has been a really exciting collaboration with our local utilities and municipal partners. We are able to perform research and water quality testing at a level they may not have the resources for, and it has a direct impact on them,” said Sharvelle.
The Director of Research and Development at Mile High Flood District, Holly Piza, shared “The CSU and MHFD partnership at Spur allows us to connect academic research with practitioners in our region. This research is informing our regional criteria and advancing the practice of stormwater management.”
“It’s a great team. CSU brings the research expertise and an amazing facility, MHFD has a strong history of developing innovative stormwater criteria, and DGI will use the findings to build on an existing network of over 200 facilities in Denver,” said Bell.
Flood damage wrought by Junction Creek in October 1911. This is looking south down Main Avenue from around the current location of Durango High School.
Click the link to read the article on The Land Desk website (Jonathan P. Thompson):
At around four a.m. on October 6, 1911, Navajo Methodist Mission Superintendent J.N. Simmons woke up to find himself and the mission near Farmington, New Mexico, surrounded by water. It wasn’t a total surprise. He and two other staffers—Frank B. Tice and Walter Weston—had received the flood alarm the previous day, but had chosen to stay, certain that the San Juan River’s waters would never reach them, and if they did, the brand new, three-story cement-block mission building, watched over by God, would provide an unsinkable refuge. They were wrong.1.
The rain began in the San Juan Mountains late on the morning of October 4, 1911. It came down gently at first, slowly gaining intensity over the course of the day. By evening the tropical storm was a torrent, dropping two inches of precipitation on Durango in just 12 hours, nearly twice what the town normally gets during all of October. Weather watchers in Gladstone, above Silverton, recorded eight inches of rain on October 5—a virtual high country hurricane.
Design for the whitewater park at Smelter Rapids via the City of Durango
Once-gurgling streams jumped from their banks and twisted steel railroad tracks into contorted sculpture, decimated roads and bridges, and demolished barns. Junction Creek tore out the Main Avenue and railroad bridges before adding its load to the Animas, which carried an estimated 25,000 cubic feet per second of water as it ran through town. It’s an almost incomprehensible volume. A good spring runoff these days might lift the waters to 6,000 cfs, high enough for the river to leave its banks and spread across the floor of the Animas Valley, and to turn Smelter Rapid into a churning hellhole for rafters.
The water unmoored the railroad bridge near Durango’s fish hatchery and carried it downstream, despite the fact that two full coal cars had been parked on the bridge to provide ballast. The river jumped its channel and headed onto 15th street, creating a five-foot-deep river that today would go right through a Burger King. further downriver the waters washed away 100 tons of toxic slag from the Durango smelter, and carried away several homes from Santa Rita, on the opposite shore.
The Animas River rushing beneath the Main Avenue bridge in Durango, Oct. 1911. Note the partially submerged house located about where the VFW is now and the water crossing Main near where Burger King is currently located. Photo credit Center of Southwest Studies, Fort Lewis College.
Sixty miles east of Durango, in Pagosa Springs, the upper San Juan River swept away more than 20 structures and destroyed the town water plant, hospital, and jail. Its power plant “was wiped out of existence, nothing left but the water wheel.” The Bayfield Blade called Arboles, a village near the junction of the San Juan and Piedra Rivers, “a thing of the past.” That was a bit of hyperbole, but maybe also prophetic: the community survived that flood, but was later buried under the waters of Navajo Reservoir. Further east the Rio Grande grew even grander and threatened to carry parts of Española, Bernalillo, and Albuquerque down to the Gulf of Mexico.
Over in Dolores, Colorado, the river peaked out at 10,000 cfs, more than 20% greater than the second highest peak hit in 1949. The raging river of sorrow ripped out railroad tracks, washed out roads, and inundated the town under four feet of water and four inches of mud, carrying away houses and the boardwalk. My great grandfather, John Malcolm Nelson, had come down from Ouray in early October to look at buying land in the Ute Strip — and he did, down at Sunnyside Mesa. But his trip back north was delayed by the fact that every bridge and road in the region was washed out.
In Farmington the seething monsters of the upper San Juan and the Animas joined forces, spilling over the banks and onto the flats on either side of the river, where the Navajo mission sat. Simmons and his fellow staffers sent the children to higher ground at about midnight as a precaution, equipping each with a blanket and loaf of bread. Then they went to bed, not realizing their own mistake until they awoke four hours later.
Somehow, Weston was able to quickly escape on horseback (he may have snuck out earlier). Tice chose to stick around, heading for the top floor of the structure. Simmons ran out and climbed atop an outhouse, apparently in order to launch himself onto a horse. Simmons missed the horse and ended up in the water, instead, carried rapidly downstream alongside dead animals, haystacks, and pieces of people’s homes.
Tice, it seemed, was the only survivor, and as the sun came up, onlookers gathered on the opposite shore. They watched Tice climb from the second story to the third, finally climbing onto the roof with his dog. It seemed safe enough; the water stopped rising after it inundated the third story. Little did he know, the waters were slowly dissolving the building underneath him, and it, the roof, the dog, and finally Tice were all swallowed up by the current.
The Shiprock Indian School campus was covered with water five feet deep, washing away several adobe buildings, and the fairgrounds, prettied up for the annual fair, were covered with a torrent of muddy water. Every bridge in San Juan County, Utah, where a miniature oil boom was on, was torn loose and carried away by the angry torrent; 150,000 cubic feet of water shot past the little town of Mexican Hat every second, according to a 2001 USGS paleo-flood hydrology investigation. That’s about 100 times the volume of water in the river during a typical March or April, a popular time to raft that section. It took out the then-new Goodridge bridge — some 39 feet above the river’s normal surface — tore through the Goosenecks, backed up in Grand Gulch, deposited trees on sandstone benches high above where the river normally flows, and finally combined with the raging Colorado River to create a liquid leviathan of unknown volume that wreaked more havoc through the Grand Canyon and beyond.
***
The 1911 event is typically considered to be the Four Corners Country’s biggest flood, based on streamflow estimates, anecdotal accounts, and the damage wrought. Since then it has been rivaled only by the June 1927 flood, when the Animas River in Durango reached 20,000 cubic feet per second; and in 1949 and 1970 when the high-water mark was about 12,000 cfs and 11,600 cfs, respectively. That might make 1911 seem like a freak event — a once-in-a-millennium confluence of factors. Combine that with the fact that the river’s annual peak streamflows have trended downward over the last century or so, and a 1911 repeat seems less and less likely.
But these waters are muddied, so to speak, by the relatively short timeline and limited geographical scope we’re working with. Many streams didn’t have gages on them at the time, and even those that were present weren’t always accurate (most of the 1911 figures are estimates, not actual measurements). Even though most of the “old-timers” said it was the biggest flood they’d ever seen or heard of in these parts, we have to remember that they tended to be white guys, and white settler-colonists had only been in the area for four decades or so. Not that memories of weather events are ever all that reliable.
A swollen San Juan River nearly wiped Montezuma Creek and Bluff City, Utah, off the map back in 1884 (the 1911 flood wreaked less destruction). Yet there were virtually no stream gages, so the magnitude of that earlier event is hard to quantify and, besides, maybe the later flood was less destructive because there were fewer homes and infrastructure in the flood’s path by then.
Also, when one looks beyond the San Juan Basin watershed, one finds streamflows that far exceed those of October 1911. On the USGS stream gage on the Green River in Green River, Utah, the 1911 flood (which was at the beginning of the 1912 water year, by the way) ranks as just the 5th largest flow since 1895. And 1911 places fourth overall on the Rio Grande at Otowi Bridge, outdone by 1920, 1941, and 1904.
We can extend the timeline dramatically by turning to paleoflood hydrology, which is sort of like dendrochronology, except instead of looking at tree rings to understand past climate, it uses geological evidence — slackwater lines, debris — to reconstruct the magnitude and frequency of past floods. I skimmed the available literature, including this Bureau of Reclamation survey of studies, and here’s what stood out:
The 1911 flood was likely the largest on the Animas River over the last several hundred years or more. On the San Juan River near Bluff, researchers found no evidence of floods higher than the 1911 debris, indicating it “may represent the largest flood on the San Juan River for a much longer time period than 1880-2001.” In any event, 1911 was larger than the 1884 flood, even in Bluff.
On the Colorado River at Lees Ferry the 1884 flood was most likely the largest during white settler-colonial times, with an estimated flow of about 300,000 cubic feet per second (there were no gages there, yet), which would have provided quite the ride through the Grand Canyon. Some researchers believe an 1862 flood had a flow of about 400,000 cfs. Holy big water, Batman!
Extend the timeline further and the ride gets even wilder: A 1994 USGS paleoflood study found evidence of a 500,000 cfs flood at Lees Ferry between 350 and 750 A.D.; and a 2018 reconnaissance found slackwater deposits indicating a flow of 700,000 cfs. I’m sure it provided quite the scene for Puebloan observers looking down from the canyon rim. If you happened to be in the canyon at that time? Yikes.
From: “A 4500 Year Record of Large Floods on the Colorado River in the Grand Canyon, Arizona,” by Jim O’Connor et al.
A study of floods on the Colorado near Moab found that, as is the case on the Animas River, there were a lot of large floods between the 1880s and 1930s, but peak streamflows have followed a decreasing trend ever since. One study suggested this resulted from: land-use changes, particularly a severe reduction in grazing after 1932; greater regulation of the river by upstream dams and so forth; greater upstream water consumption; and a decrease in intense, large flood-producing storms.
The Colorado River near Moab has experienced 44 floods during the last two millennia with flows ranging from 63,500 cfs to 325,000 cfs. (For context, the 1983 runoff, which threatened Glen Canyon Dam, reached 62,000 cfs on this stretch of river and in 1984 it hit 70,300). Most of those floods occurred during the last 500 years.
From “A 2000 year natural record of magnitudes and frequencies for the largest Upper Colorado River floods near Moab, Utah” by Greenbaum et al.
Warming temperatures, like those resulting from human-wreaked, fossil fuel burning-exacerbated climate change, can increase the intensity of storms and the amount of precipitation. That could, potentially, lead to bigger floods. So even though climate change has mostly manifested as drought in the Four Corners Country, it could also have the effect of putting a 1911-like storm on steroids. And with El Niño brewing in the Pacific, we might see some whopper storms sooner rather than later. Or not. Either way, though, it seems silly to assume the 1911 flood won’t repeat someday. Maybe next time it will be even worse.
That 1911 storm dissipated over the next couple of days, leaving a bright sun to illuminate the river valleys, newly scoured of the roads, houses, bridges, railroad tracks, and other detritus that humans had littered the valleys with over the previous decades. But the folks of the San Juan Basin soon went to work rebuilding — quite often in exactly the same spots that had flooded so catastrophically.
I used to see that as a combination of foolishness, hubris, obliviousness, and stubbornness all woven into a tapestry of denial. Surely they couldn’t have believed a flood of that magnitude would never occur again.
Looking from Main Avenue in Durango (or thereabouts) toward the Day House. The Animas Brewing Co. now stands about where the right, foreground house is.
And yet, now that I’ve fallen victim to a flood, or at least my home has, I finally get it. What do I know about their circumstances? Maybe they had invested everything they owned into this little plot of land and a home, and they have nowhere else to go. Maybe they are just so wedded to this particular place that they figure it’s worth the risk to build in a 100-year flood plain. Maybe they were just tenacious bastards shaking their fist at the sky in defiance.
What I do know is that if and when there is a repeat of the 1911 flood, or that whopper that sent 700,000 cfs into the Grand Canyon, it will leave some serious destruction in its wake.
The 1911 flood wrecked a lot of infrastructure, but the human death toll was much smaller than one might have expected. Among the handful of fatalities was Frank B. Tice, of the Navajo Methodist Mission, whose body was found 20 miles downstream from where he was swept away.
But there was something else, too. On an island in the San Juan River, somewhere between Farmington and Shiprock, a man huddled next to a small fire, cooking apples that he had snagged as they bobbed past. After falling in the water he had grabbed ahold of some debris, and it had carried him for miles until he finally reached the island, cold, wet and hungry but, maybe miraculously, alive. It was J.N. Simmons, of the Navajo mission.1
A 1998 paleo-flood investigation determined the measurement was in error and it was more likely that about four inches fell across a wider area. In any event, the author of the report does not dispute the magnitude of the flood that resulted.
San Juan River Basin. Graphic credit Wikipedia.Dolores River watershed
Green River Basin
Map of the Rio Grande watershed. Graphic credit: WikiMediaMap of the Colorado River drainage basin, created using USGS data. By Shannon1 Creative Commons Attribution-Share Alike 4.0
And it is. But not only because greenhouse gas emissions continue to rise. What we are also observing is the long-predicted water vapour feedback within the climate system.
Since the late 1800s, global average surface temperatures have increased by about 1.1℃, driven by human activities, most notably the burning of fossil fuels which adds greenhouse gases (carbon dioxide and methane) to the atmosphere.
As the atmosphere warms, it can hold more moisture in the form of water vapour, which is also a greenhouse gas. This in turn amplifies the warming caused by our emissions of other greenhouse gases.
Some people mistakenly believe water vapour is a driver of Earth’s current warming. But as I explain below, water vapour is part of Earth’s hydrological cycle and plays an important role in the natural greenhouse effect. Its rise is a consequence of the atmospheric warming caused by our emissions arising especially from burning fossil fuels.
Water vapour: the other greenhouse gas
For every degree Celsius in warming, the water-holding capacity of the atmosphere increases by about 7%. Record-high sea temperatures ensure there is more moisture (in the form of water vapour) in the atmosphere, by an estimated 5-15% compared to before the 1970s, when global temperature rise began in earnest.
Water vapour is a powerful greenhouse gas. Since the 1970s, its rise likely increased global heating by an amount comparable to that from rising carbon dioxide. We are now seeing the consequences.
In many ways, water vapour is the most important greenhouse gas as it makes Earth habitable. But human-induced climate change is primarily caused by increases in the long-lived greenhouse gases carbon dioxide, nitrous oxide, methane and chlorofluorocarbons (CFCs).
As a general rule, any molecule with three or more atoms is a greenhouse gas, owing to the way the atoms can vibrate and rotate within the molecule. A greenhouse gas absorbs and re-emits thermal (infrared) radiation and has a blanketing effect.
Clouds have a blanketing effect similar to that of greenhouse gases but they are also bright reflectors of solar radiation and act to cool the surface by day. In the current climate, for average all-sky conditions, water vapour is estimated to account for 50% of the total greenhouse effect, carbon dioxide 19%, ozone 4% and other gases 3%. Clouds make up about a quarter of the greenhouse effect.
Water vapour plays a significant role in Earth’s natural greenhouse effect, and it amplifies current, human-induced warming. Adapted from Trenberth (2022), CC BY-SA
Why is water vapour different?
The main greenhouse gases – carbon dioxide, methane, nitrous oxide and ozone – don’t condense and precipitate. Water vapour does, which means its lifetime in the atmosphere is much shorter, by orders of magnitude, compared to other greenhouse gases.
On average, water vapour only lasts nine days, while carbon dioxide stays in the atmosphere for centuries or even millennia, methane lasts for a decade or two and nitrous oxide a century. These gases serve as the backbone of atmospheric heating, and the resulting rise in temperature is what enables the observed increase in water vapour levels.
The rise in carbon dioxide doesn’t depend on weather. It comes primarily from the burning of fossil fuels. Atmospheric carbon dioxide has increased from pre-industrial levels of 280ppmv to 420ppmv (an increase of 50%) and about half of that increase has happened since 1985.
This accounts for about 75% of the anthropogenic heating from long-lived greenhouse gases. The rest of human-induced atmospheric warming mainly comes from methane and nitrous oxide, with offsets from pollution aerosols.
The extra heating from water vapour has been on a par with that from increased carbon dioxide since the 1970s.
The water vapour feedback: increased heating promotes increased evaporation and higher atmospheric temperatures, which in turn lead to higher levels of atmospheric water vapour. Author provided, CC BY-SA
Water vapour and the water cycle
Water vapour is the gaseous form of water and it exists naturally in the atmosphere. It is invisible to the naked eye, unlike clouds, which are composed of tiny water droplets or ice crystals large enough to scatter light and become visible.
The most common measure of water vapour in the atmosphere is relative humidity.
During heatwaves and warm conditions, this is what affects human comfort. When we sweat, the evaporation of moisture from our skin has a cooling effect. But if the environment is too humid, then this no longer works and the body becomes sticky and uncomfortable.
This process is important for our planet, too, because about 70% of Earth’s surface is water, predominantly ocean. Extra heat generally goes into evaporating water. Plants also release water vapour through a process called transpiration (releasing it through tiny stomata in leaves as part of photosynthesis). The combined process is called evapotranspiration.
Water vapour is part of Earth’s hydrological cycle, Author provided, CC BY-SA
The moisture rises into the atmosphere as water vapour. Storms gather and concentrate the water vapour so that it can precipitate. As water vapour has an exponential dependence on temperature, it is highest in warm regions, such as the tropics and near the ground. Levels drop off at cold higher latitudes and altitudes.
The expansion and cooling of air as it rises creates clouds, rain and snow. This vigorous hydrological cycle means water vapour molecules only last a few days in the atmosphere.
Water is the air conditioner of the planet. It not only keeps the surface cooler (albeit at the expense of making it moister) but rain also washes a lot of pollution out of the atmosphere to everyone’s benefit.
Precipitation is vitally important. It nourishes vegetation and supports various ecosystems as long as the rate is moderate. But as the climate warms, higher moisture levels increase the potential for heavier rainfall and the risk of flooding.
Moreover, the latent energy that went into evaporation is returned to the atmosphere, adding to heating and causing air to rise, invigorating storms and making weather extremes greater and less manageable.
These changes mean that where it is not raining, drought and wildfire risk increase, but where it is raining, it pours.
Lyons and Estes Park community members reflect on damage and recovery from deadly natural disaster
In early September 2013, after a storm stalled over the Front Range, rivers rose out of their beds and rushed right through several Northern Colorado communities, resulting in one of the state’s worst floods.
Meteorologists classified it as the kind of flood that happens only once every 500 or more years.
From Sept. 9 until Sept. 16, the Front Range experienced uncharacteristically heavy rainfall, which flooded several communities, resulting in nine deaths, 11,000 people evacuated, 1,850 destroyed homes and about $4 billion in damages across the state, with 18 counties declared federal disaster areas, according to the Colorado Encyclopedia.
From the initial damage of the flood and the difficult recovery period to later commemorations, the 2013 flood has stayed with many people as a painful memory 10 years on. On this anniversary, communities are reflecting on lessons of the flood and its story of resilience amid tragedy.
A ‘biblical’ flood
Sitting at the intersection of the North St. Vrain and South St. Vrain creeks, the small mountain town of Lyons was one of the hardest hit communities.
Victoria Simonsen, the town administrator for Lyons, stepped into the role in 2013 prior to the flood and stayed in the position, helping the town recover ever since.
She said the whole town went to bed the night of Sept. 11, 2013, with the creeks at a normal level and no suspicion of the disaster that was to come.
“We were watching the creek, but we were not in any kind of panic mode at all,” Simonsen said.
It was in the late hours of that night, however, when the flooding started. At about 11 p.m. the water rose above the river beds, Simonsen said.
Usually local creeks hit low flooding levels when the water flows at 1,200 cubic feet per second, she said. By the end of the event, Lyons’ two creeks were flowing at 26,000 cubic feet per second. Simonsen said it was true flash flooding, and the water went from ankle deep to 12 feet deep very quickly.
“This was classified as between a 500 and 1,000 year event. The National Weather Service actually called it biblical in Lyons,” Simonsen said.
But it wasn’t until 2 a.m. that the town’s flood sirens actually went off, Simonsen said.
That was also when the water, which was rushing down from 14,000-foot mountains to the town at 5,300 feet, completely isolated neighborhoods and took out all three access points into town.
“The water came through the town at 2 a.m. and it literally divided our community into five islands,” Simonsen said.
Planet Bluegrass during the September 2013 flood. The Wildflower Pavilion is the building at center. (Courtesy of town of Lyons)
The siren system sounded based on population, not location along the rivers, and when many residents woke to the sirens, Simonsen said she got calls from people saying the river was flowing in front of their homes, trapping them.
“We were stranded on our island for about 36 hours before we were able to get contact, and then the National Guard started arriving by helicopter and high water vehicles,” Simonsen said.
About 20 miles northwest, further into the Rocky Mountains, the Big Thompson River rushed through Estes Park and communities along the Big Thompson Canyon around the same time.
“It was the middle of the night I got a call saying it’s gonna be bad, so we opened up an emergency operations center,” Frank Lancaster, the Estes Park town administrator at the time and current trustee.
In the tourist town outside of Rocky Mountain National Park, two rivers and several creeks run through town, and one after another started flooding.
“We were dealing with one and then the other one came up and then basically all hell broke loose everywhere and couldn’t get in or out of town,” Lancaster said.
The only road in or out of Estes Park was Trail Ridge Road, a winding, small road that goes through the national park.
September 2013 flooding via AWRA Colorado Section Symposium
“Because the flooding was so widespread, the county was affected everywhere. So we really didn’t have much assistance from the county, because they couldn’t get up here and they were dealing with other places,” Lancaster said.
The National Park Service became their lifeline. Rangers helped sandbag the town to protect vital infrastructure and bring in materials.
Lancaster said the population in Estes Park is older, and when he went door-to-door to check on people he was surprised to find a lot of residents who were isolated and didn’t realize there was flooding.
Around Boulder County and Larimer County, communities large and small started calling for help.
Joe Pelle, then the Boulder County sheriff, said it was the first time in his career that deputies were unable to get to people in need.
He said during his tenure, he helped create a robust emergency management system and even went through several simulations of floods. None of these simulations could have prepared deputies for this kind of catastrophe, because almost all access to mountain communities was wiped out. In all of the simulations, Pelle said, first responders were able to create an alternate route.
“That night, one after another, all of the canyon roads failed or washed away in places and within a matter of a few hours,” Pelle said. “There was literally no access to our folks who live in the mountains.”
First responders couldn’t reach people in medical emergencies for a day and a half, Pelle said.
Click the image to go to the Colorado Newsline website to view the timeline graphic.
The unusual weather pattern, a prolonged rain storm in early September, that loomed over Northern Colorado was what experts call a cut-off low pressure system, according to Andreas Prein, a scientist with the National Center for Atmospheric Research in Boulder.
Prein said these systems can be dangerous, because whatever weather the system brings, it will last for days.
The storm lasted from Sept. 9 to Sept 16 with persistent rain throughout the seven days, accumulating into torrential rain Sept. 11 and 12.
At the end of the event, Boulder County recorded 18.1 inches of rain and Larimer County recorded 12.4 inches.
“That night, Sept. 11, when those two storms collided over the top of our county, the rain was something I’d never seen happen throughout my entire life. It was just torrential,” Pelle said.
Prein said there are two factors that created that much rainfall. The first was the cut-off low pressure system that didn’t move, and the second was the warm sea surface temperatures in the Pacific Ocean and the Gulf region, which contributed to the amount of moisture in the atmosphere and then the amount of rainfall over Colorado.
“It’s almost unimaginable how strong the force of nature is in these kinds of events and how fast this can evolve, because there was a heat wave and very warm temperatures before the event,” Prein said.
A view of Foothills Mobile Home Park, which suffered a total loss during the September 2013 flood in Lyons. (Courtesy of town of Lyons)
Communities coming together
Lesly Fajardo-Feaux and her family lived in downtown Lyons at the time of the flood. She had two children, and one of them was just two-and-a-half months old.
It was the noise that woke her up that night.
“I thought this is so weird, and I heard the sirens and I went to see it, and there was water all over,” Fajardo-Feaux said. “I couldn’t believe what was happening.”
The whole street had flooded, she said. The river rerouted itself in front of their house, which trapped them that night and early the next day. Her house sat on a hill, which she said made it difficult to get up to in the winters with icy roads, but she was thankful for the hill during the flood.
That night she watched the street flood and her neighbor’s furniture flow past her.
“We were seeing refrigerators coming down the street and sofas and people’s furniture and people’s lives floating by,” Farjardo-Feaux said.
By the next afternoon, they were able to leave their home, and she saw the aftermath of the flood in the daylight.
There was no running water, no electricity, no internet and no phone service. About 20% of the town’s housing was destroyed, Simonsen said.
A view of a neighborhood in Lyons after the 2013 flood. (Courtesy of town of Lyons)
Although Lyons didn’t look like a town anymore, Farjardo-Feaux said the community really came together. There was even a community barbecue to use the food that would have gone bad.
“Lyons was a town where people are so happy all the time having music and people and all. There was a feeling that like, OK, everything is gonna be good, things are gonna be OK,” she said.
During those first couple of days, Simonsen said the community, which was already close-knit, came together to survive the isolation.
“When you’re facing actual life and death situations, you get pretty close, and our community really pulled together,” Simonsen said.
Pelle said he made it a priority to get a declaration of a federal disaster as soon as possible to get funds for what would be an expensive search, rescue and recovery operation.
An emotional sight he remembers was when the National Guard units were sent from Kansas and Utah. He couldn’t believe the size of the convoy and the amount of equipment they brought with them, he said.
“It was just incredible, and it was a couple of miles long with a military police escort, and it’s like the cavalry had arrived,” Pelle said. “Then within a matter of days or weeks all those roads that had been washed out were at least temporarily recovered.”
Air search for flood victims September 2013 via Pediment Publishing
The National Guard coordinated one of the largest air lift evacuations since Hurricane Katrina to get people out of the mountains, according to Pelle.
For Fajardo-Feaux and everyone in town, that was just the beginning.
Fajardo-Feaux and her family cried as they drove down the mountain, unsure of where they would go and for how long. They spent the next few months couch-hopping and staying in hotels and rentals.
When Simonsen told residents they had to leave, she had no idea how long it would take to repair the damage and put in utilities. It ended up being about seven weeks, and Simonsen said families started coming back by Thanksgiving, and most were home by Christmas.
But for those whose homes were destroyed, coming back to Lyons wasn’t in their future.
Damage during the September 2013 flood on U.S. 34 leading up to Estes Park. (Courtesy of the town of Estes Park)
Road to recovery
The process of repairing and recovery was another mountain of challenge the communities had to face.
Where to even start — that was the first obstacle. But Simonsen and her team created a comprehensive plan that she now sends to flood victims across the country as an example.
The Federal Emergency Management Agency showed up in Lyons in October, and the town got to work putting in temporary utilities.
Simonsen said it was a difficult process, because the flood in Boulder County was different than others FEMA had dealt with. Permits, permissions and impact studies stood in the way of recovery.
Lancaster experienced similar challenges with Estes Park’s recovery. He said FEMA understood flooding in the midwest and coastal areas, where water rose and went back down, not where water rushed through destroying anything in its path.
Both communities had to fight for recovery of recreational attractions that fueled much of their towns’ economies — white water rafting features, trees, wildlife habitats and parks. These were things FEMA didn’t originally cover.
During the early period of recovery from the flood, Simonsen set a goal of being back to normal in four years. But Simenson said FEMA agents told her it would take much longer.
“I said, ‘No way, we’re really close, we’ll get it done.’ And they said, ‘No, you’re not understanding the financial part, this will be a six to 10 year event.’ And it was nine years,” Simonsen said.
The small town of Lyons was able to leverage $75 million in federal funds to recover from the flood, according to Simonsen. At the time, its annual budget was $1.2 million with $4 million in reserves. The recovery funds, though, are all reimbursement-based, and it is still waiting for reimbursement from the federal government for some projects.
Simonsen said there were very positive moments throughout the recovery process, but the community went through many low points.
“You start this rebuilding phase and then you, of course, have setbacks. They say anniversaries are usually low points for people where they’re reflecting. But, you know, very gradually you make your way back up. But it’s a long, long process,” Simonsen said.
One of those low points was when neighbors realized some people weren’t going to come back.
“At some point, you have to move on with your life if you aren’t able to rebuild,” Simonsen said.
The issue of affordable housing haunts Lyons. The flood wiped out the town’s mobile home park, Riverbend, and 32 families lost their homes there.
For Craig Ferguson, founder and owner of Planet Bluegrass, which hosts beloved bluegrass and folk music festivals in Lyons, the flood was an attack on his home and business. He decided to stay when the whole town evacuated and started right away on the road to recovery.
“Once you clean it up,” Ferguson said of his house in Lyons, “it’s pretty comfortable. I’d rather live here. I’d rather camp in my house and take showers elsewhere than go live somewhere else.”
Ferguson didn’t wait to ask for permission before getting to work on his Planet Bluegrass property. He said he had a deadline in sight to be open for the next festival in the summer.
Before him was about $2 million in damages, mountains of flood-deposited sand and damaged utilities.
So, Ferguson said he bought one of the last available backhoes in the state and got to work.
“We fixed up our place pretty aggressively and we just had to do it that way in order to survive,” Ferguson said.
Ferguson put on the bluegrass festival that summer as usual.
“That was the biggest celebration you can imagine. You know to the bluegrass world this is a pretty special place,” Ferguson said. “No one thought it would happen during the first two months, seeing the pictures, even most of my partners (said) we couldn’t do it.”
Lancaster said during this period, people’s creativity really shined.
He said the Estes Park community also came together and during its annual Thanksgiving parade, when people decorated their neighborhood-assigned Porta Potties to bring some joy to the difficult times.
“You know, people could be really frustrated and angry instead, but they said my Porta Potty is prettier than your Porta Potty and they decorated them and some of them put them on wheels and brought them in the parade,” Lancaster said.
Estes Park took severe hits to its roads, especially up the Big Thompson Canyon, which was severely damaged during the flood of 1976, when the road was completely wiped out. It was rebuilt with a promise it was floodproof, but in 2013 it was again wiped out.
The water undermined the canyon walls and rockslides completely covered the roads in certain areas.
“There was a section down in the Big Thompson in the narrows where you couldn’t tell there was ever a road there,” Lancaster said. “It wasn’t like the road was missing or damaged, there was no road and there was no sign of it either.”
Lancaster said he remembers after the 1976 flood the road wasn’t back to normal for years, so he could not imagine the road being back up for a while after the 2013 flood. But crews got U.S. 34 repaired by the new year.
“They got it up, and they did it right this time, and that’s why they made so many changes. They worked a lot on making the road a lot more resilient,” Lancaster said.
He said resiliency was their priority. Everything was about how to repair and make infrastructure more resilient. Bridges, riverbeds and buildings all went through a process to ensure the community could last through more floods.
“There’s still some other things we really need to do. We need to deepen this channel (along the local riverwalk) and have it handle more water. There’s a couple more bridges we need to replace even 10 years later,” Lancaster said.
For Lyons, Simonsen said the last flood-recovery project wrapped up in October, but she is still waiting for reimbursements from the federal government.
With the end of the last recovery project, she said the town can finally move on.
“Now that the projects are actually all done, we can actually kind of close that chapter, but we will always be recovering in different ways,” Simonsen said.
The town plans to hold a commemoration and remembrance of the flood this year for the 10th anniversary.
Simonsen said, however, community members remember the flood in different ways. For some, every time it rains they get nervous. Others still hold a barbecue on the night of Sept. 11, like they did 10 years ago.
Simonsen said she knew she had to see the recovery through in Lyons during the last decade.
Now, she said the community can focus on other parts of town that need attention.
“Pretty much the rest of town was kind of neglected the last 10 years. So now we have lots of work to do on streets, sewer and water lines, where we simply did not have funds to put toward it the last 10 years,” Simonsen said.
The issue of affordable housing still looms over Lyons, which lost nearly all its affordable housing to the flood.
Many families couldn’t afford to come back to the community. With disagreements on how to achieve affordable housing, the town is just now starting to see less-expensive units come in.
Ferguson worked to provide affordable housing downtown at a property that used to be a bank. He worked with Habitat for Humanity to bring back people who lost their homes to the flood.
Recently, Simonsen said the town started on a project to get 40 units of affordable housing built on a property donated by someone who lives in Kansas and has land in Lyons. The first eight opened and more are due to open soon.
“The community thought there’s not going to be anyone left who wants to come back because people had to move, but I’m happy to say that over 30% were here 10 years ago,” Simonsen said.
A bridge over St. Vrain Creek in Lyons, July 31, 2023. (Shannon Tyler/ Colorado Newsline)
Looking to the future
After the rebuilding and mitigation efforts, communities still consider what would happen if another event like the 2013 flood were to happen.
“It’s not a question of will this happen and will we be ready or even when it does happen again. Will it not be as devastating?” Lancaster said.
Prein, of NCAR, researches climate change’s effects on major weather events like the flood. He said if another low pressure system stalls over the Front Range, there is likely to be even more rainfall because of the effects of a warming climate.
“The answer will almost certainly be there will be way more rainfall, because it’s really this moisture that you get from the south from the Gulf. Moisture increases with warming,” he said.
Researchers are not certain about how climate change affects the likelihood of cut-off low pressure systems, he said. But, if one does happen again, it is likely to be more devastating.
Colorado authorities built bridges higher, moved buildings out of the floodplains, carved further into the mountains to lay roads, and completely rebuilt stream banks. Yet, Simonsen, Lancaster and Ferguson all said another flood will happen, and they can’t fully prepare for what it will bring.
“What you try to do is minimize the risk, but you can’t avoid the risk, there will always be risk, and you have to balance that with the other needs of the community,” Lancaster said.
Preparing for the damage that comes with flooding of that magnitude isn’t possible, but in the last 10 years communities focused on mitigating what risk they could.
“It’s been a wonderfully challenging 10 years, and I think my goal always as a city manager is you leave the community better than you found it, and I think we did,” Simonsen said.
A tragic night in Fort Collins 26 years ago birthed what grew into the single largest daily precipitation network in the U.S. The July 1997 Spring Creek Flood killed five people, injured 54 and caused millions in damages. The catastrophe turned into a grassroots collaboration that served as impetus for the creation of the Community Collaborative Rain, Hail and Snow Network, which has grown from its humble Fort Collins beginnings into 26,000 volunteer citizen scientists across the country and beyond.
“I had never seen a storm like that in my entire life,” said Nolan Doesken, Colorado’s state climatologist at the time and founder of CoCoRaHS…
It wasn’t just the copious amount of rain that caused one of the city’s most damaging natural disasters July 27-28, 1997, but also the wide variance in rain received across the city. Western parts of the city saw more than 14 inches of rain in 31 hours, while the center of the city saw 6 inches and eastern areas 2 inches. The 14.5 inches was nearly as much precipitation as the city sees in an average year. But those measurements weren’t known because there wasn’t a way to reliably measure torrential rains in Colorado, Doesken said.
“The state had just completed a study of extreme rain events at the time,” he said. “The conclusion was we didn’t for sure know how much rain fell during past storms producing rain that creates flooding. I felt this was my chance.”
Click the link to read the article on the Vail Daily website (Ali Longwell). Here’s an excerpt:
Supported by a Colorado Department of Health and Environment Grant, Frog Creek Partners installed 278 new Gutter Bins throughout town
Last week, a crew from Frog Creek Partners traveled throughout Vail to install Gutter Bin stormwater filtration systems across a quarter of the town’s stormwater drains to capture debris and pollution before it reaches Gore Creek. Each year, these 278 Gutter Bins will stop approximately 27.8 tons (or 55,600 pounds) of pollution from reaching Gore Creek, according to Brian Deurloo, Frog Creek’s president and founder. Vail has a total of 1,100 stormwater inlets — the open grates in the street — that flow to about 550 outfalls in Gore Creek. These open grates are different from sanitary sewers, which take water from items like sinks, toilets and washing machines through a wastewater treatment process before being discharged to the creek…
What this equates to is “a lot of opportunities for pollution to be introduced into Gore Creek through our stormwater system,” said Pete Wadden, the town’s watershed health specialist.
This pollution comes both directly from people dumping things into the stormwater drains or indirectly from the pollutants that run off the roadways, Wadden said. The latter include road salt, sand, cinders, dust from brakes, leaked oil from cars, and more…
…for many years, the town has been seeking cheaper alternatives to capture pollutants. In 2018, Vail discovered Frog Creek Partners’ Gutter Bins and installed several at the public works site and at Stephens Park…
“We’ve been really happy with how they’ve performed. They’re capturing something like 40 to 80 pounds of sediment and trash every six months when we go out and empty them,” Wadden said.
The Grand Junction Fire Department has conducted five river rescues since May 1, according to spokesperson Ellis Thompson-Ellis. Training for river rescues has been a priority for the department of late, as people have underestimated the current conditions and their own skill levels. The Colorado River near Palisade was discharging at between 17,000 and 17,500 cubic feet per second, well above the median for this time of year, which is around 8,000 cfs, and the Gunnison River near Grand Junction is discharging at around 13,000 cfs, also well above the median of around 6,500 cfs. Those high waters have closed multiple sections of the Riverfront Trail, and the city of Grand Junction is warning people away from the River Park at Las Colonias.
Colorado River at Los Colonias Park in Grand Junction May 23, 2023.
Throughout the Colorado River Basin, it’s been a wet winter. There is great snowpack in the Rocky Mountains, where the Colorado River and many of its tributaries begin. And in Arizona, the Salt and Verde Rivers benefited from the above average winter precipitation. This spring, Phoenix Valley residents received a beautiful reminder that there is a river running through the heart of the region—the Salt River, or Rio Salado.
The river, which is typically dry due to damming and water demands in the Valley, has been flowing through the Salt River Pima-Maricopa Indian Community and the cities of Mesa, Tempe, and Phoenix since late March. The Nina Mason Pulliam Rio Salado Audubon Center sits on the south bank of the river, just two miles south of downtown Phoenix.
Spring flooding used to be a regular occurrence before dams were built in the 1900s on the Verde and Salt Rivers. Indigenous communities have thrived in the region for millennia thanks to these rivers. Spring floods benefit the ecosystem by hydrating the soil, germinating riverside plant seeds, replenishing groundwater, and attracting birds like Great Egrets and Green Herons.
Here are some questions asked and answered about the Salt River/Rio Salado:
Why is the Salt River flowing now?
The Salt River Project (SRP) manages the Salt and Verde reservoir systems that bring water into the Phoenix region. This winter created an impressive snowpack that resulted in a special occurrence—the SRP reservoirs filled up to near-capacity. In early March, to prepare for spring’s rising temperatures and increasing snowmelt, SRP began releasing water—from the Verde River through Bartlett Dam and on the Salt River through Roosevelt Dam—to create additional storage capacity within the reservoirs to safely capture the upcoming snowmelt and river runoff.
How much water has flowed down the river so far?
According to SRP, more than 700,000 acre-feet of water from the Salt and Verde Rivers has been released from their reservoirs downstream. This has meant there is enough water to flow to the Gila River, and the Gila River has rejoined with the Colorado River near Yuma. One acre-foot of water can provide for approximately 3.5 Arizona households per year.
Will the Salt River flow like this every time we have a wet winter?
It depends. When there is more water than the reservoir systems can hold, SRP has to release water into the riverbed (yay!). SRP is also planning infrastructure projects to raise the height of Bartlett Dam to increase the water storage capacity in Barlett Reservoir. This will capture and store more water on the Verde River, for delivery to water users. This could also mean less water released downstream into the Salt River, depending on rain and snowfall amounts.
Will this wet winter bring us out of drought?
While this winter provided relief to our short-term drought conditions in Arizona and throughout much of the Colorado River Basin, it would take many years of greater-than-average snow and rainfall to recover from the record-breaking megadrought we are experiencing. To stabilize Lake Mead and Lake Powell, we need to use less water.
What can we do to support birds, people, habitat, and rivers?
We can turn towards our waterways—by reinvesting and revitalizing key stretches of rivers with habitat restoration projects to bring back the trees and plants that once thrived, creating not only habitat, but green spaces, bike paths, and community amenities as well.
We can also manage groundwater throughout all of Arizona. Right now, in more than 80% of the state (outside of the “Active Management Areas”), a landowner can drill a well and pump unlimited amounts of groundwater, even if it causes declines in or dries up neighboring wells; even if it leads to the depletion of a nearby community’s water supplies; and even if the pumping depletes the water flowing in connected rivers.
Where can I enjoy the Salt River near downtown Phoenix?
You can visit the Rio Salado Audubon Center at no cost. Located along the Rio Salado Habitat Restoration Area, you can use the accessible trails. Come experience native plants and wildflowers, wildlife like racoons and beavers, and of course, birds—more than 200 species of birds have been sighted along the area. Blue-gray Gnatcatchers and Abert’s Towhees are frequent visitors to the Rio Salado Audubon Center.
We are grateful for years like this one when we see the Salt River come back to life. And while we don’t expect years like this all that often, it reminds us of the importance of rivers, lakes, and steams—for people and birds.
Watch the recent local news coverage of the flowing Salt River / Rio Salado near the Nina Mason Pulliam Rio Salado Audubon Center:
According to a statement issued by Logan County Emergency Management Officer Jerry Casebolt Monday afternoon, the river level at the Atwood Gauge had peaked at 7.45 feet, nearly two feet below any level requiring action.
Casebolt said the high water had made it to the Crook bridge on County Road 55 early Monday, with river flow rising from 323 cubic feet per second on Sunday to 2,180 cfs on Monday. He said the Fort Morgan gauge was reporting 12.11 feet on Monday afternoon, down from 13.72 ft yesterday at this time. Meanwhile, the gauge at Kersey also had leveled off at 5.45 ft, which is down from its peak of 8.41 ft on Saturday morning. The high water was caused by nearly two days of continuous rain along the Front Range, The hardest rainfall seemed to occur in the central metro area, with Aurora recording 5.1 inches of rain between May 9 and May 12. In that same time period Denver reported 5 inches, Boulder 2.5 inches, Longmont 2.3 inches, Broomfield 3.5 inches, Loveland 2.4 inches, Fort Collins 2.25 inches and Greeley 4 inches.
While the runoff will subside over the next day or so, it will be followed by snowmelt as temperatures become warmer in the coming week. Daily highs along the Front Range should be in the upper 60s and upper 70s the rest of the week, with periods of possible thunderstorms at the end of the week.
The South Platte River Basin is shaded in yellow. Source: Tom Cech, One World One Water Center, Metropolitan State University of Denver.
Click the link to read the article on the Pagosa Springs Website (Monica Nigon). Here’s an excerpt:
As of 2 a.m. on May 10, the San Juan River at Pagosa Springs was flowing at 238 percent of normal at 2,940 cubic feet per second (cfs), measured at 9 feet at the gage, according to the San Juan River Basin SNOTEL site, which measures snowpack and river flows and is operated by the Natural Resources Conservation Service (NRCS).
A graph from the U.S. Department of Agriculture (USDA) clocks the snow water equivalent (SWE) on Wolf Creek Pass at 135.5 percent of normal as of May 10.
The inflow of water into [Navajo Lake] was 5,791 cfs, as opposed to May 9, 2022, when the inflow was 2,575 cfs…Furthermore, the Navajo River near Chromo sits much higher than average, running at 239 percent of normal as of May 10.
“The reservoirs are full,” said District Manager Justin Ramsey of the Pagosa AreaWater and Sanitation District (PAWSD), “and there’s still a lot of snow up there. I think it will probably be a good year.”
The San Juan River, below Navajo Reservoir. Photo: Brent Gardner-Smith/Aspen Journalism
From email from Reclamation (Susan Novak Behery):
May 10th, 2023
In order to begin moving sediment in advance of the spring peak release, and to slow the reservoir rise, the Bureau of Reclamation has scheduled in the release from Navajo Dam from 500 cubic feet per second (cfs) to 1200 cfs for the evening of Friday, May 12th , and from 1200 cfs to 2000 cfs on Monday, May 15th, where it will remain for much of the week. The release changes will occur as per the following schedule:5/12 (Friday)
10:00 PM: Increase from 500 to 700 cfs
5/13 (Saturday)
12:00 AM: Increase from 700 to 900 cfs
2:00 AM: Increase from 900 to 1100 cfs
4:00 AM: Increase from 1100 to 1200 cfs
5/15 (Monday)
8:00 AM: 1200 to 1400 cfs
10:00 AM: 1400 to 1600 cfs
12:00 PM: 1600 to 1800 cfs
2:00 PM: 1800 to 2000 cfs
This increase is being made in advance of the ramp up to the spring peak release, which is still scheduled to begin at the end of next week. PLEASE STAY TUNED FOR UPDATES AS THIS OPERATION IS DEPENDANT ON ON-THE-GROUND CONDITIONS AND WEATHER.If you have any questions, please contact Susan Behery (sbehery@usbr.gov or 970-385-6560), or visit Reclamation’s Navajo Dam website at https://www.usbr.gov/uc/water/crsp/cs/nvd.html
Waters from a creek in Parachute continue to rise and threaten nearby residences, a town official said.
Town Manager Travis Elliott said Thursday [May 4, 2023] morning that the flow of Parachute Creek is currently at its highest it has been in nearly 50 years. The creek runs from the high country north of town into the Colorado River.
During a high runoff season in 1976, the creek reached a depth of 9.47 feet. As of 11 a.m. Thursday, a monitor showed the creek had reached a depth of 9.42 feet deep. The creek also reached a flow of 1,120 cubic feet per second, as of 3 p.m. Thursday.
Sandbags surround a residence in Parachute during May 2023 as flooding continues to threat buildings. Town of Parachute/Courtesy
The rising water level has caused flooding in multiple spots throughout town, which is threatening up to 16 buildings and residences. This includes neighborhoods along Cardinal Way, near Grand Valley High School, Cottonwood Park and Russey Avenue on the north side of Interstate 70.
“In some places it looks like the swamplands of Louisiana,” Elliott said. “But, overall, I think we are in good shape thanks to the generosity and resiliency of our community members.”
There have so far been no indications of evacuations. Community members have spent this past week setting up sandbags and barriers in the hopes of keeping the rising water levels at bay.
“We’ve gone through about 1,000 sandbags,” Elliott said.
Structures being directly threatened by water include sheds, shops and various outbuildings, as well as homes. One residential basement is already flooded in three feet of water, Elliott said.
The city is also concerned the rising waters could reach the bottom of local bridges while the city is monitoring its sewer lift station at the wastewater treatment plant.
One Cardinal Way resident, Brandon Renck, said his backyard is currently being threatened by water.
“That’s definitely swirling around our house,” he said. “Some of the neighbors down the street have it worse than us. It’s definitely scary.”
Renck said his backyard is adjacent to Parachute Creek and the water damaged his landscaping. He also said he had a “really nice fence that got swept away.”
“We have a row of sandbags on our property,” he said. “If it gets high onto our grass, it would get to our back door.
We have friends we can stay with. Other than that, there’s not a whole lot that we can do.”
Mayor Tom Rugaard said, instead of going to practice, he brought members of his wrestling team to help put up sandbags. The Grand Valley Fire Protection District, Grace Bible Church, other high school kids and various residents have helped with mitigation efforts. The Garfield County Sheriff’s Office, its emergency manager, and the city of Rifle have made it clear they’re on standby, ready to help when necessary, the town said.
On Tuesday, the town had at least 40 volunteers helping fill sandbags, some as young as six as well as senior citizens.
“It’s been really cool, and I’m really proud of the people in our area who have come out of the woodwork to help the people in need,” Rugaard said.
“It’s really nice to be a part of a community that jumps in and helps others out.”
While the help has been nice, Rugaard did express some frustrations over the lack of data keeping for creeks and other elements.
Drone footage of flooding in Parachute in May 2023. Town of Parachute/Courtesy
“We have all these agencies that watch the Colorado River for us, but as far as tributaries? There’s not a lot of information out there,” he said. “There’s tools out there, but it would be nice to know how much snowpack is left and how that’s going to affect us yet.”
Elliott said there’s cooler weather in the forecast, which can hopefully help bring down the rising levels of Parachute Creek.
“We know there’s a lot more coming,” he said. “It’s all a matter of how fast it melts.”
Here’s a drone video of the flooding:
Garfield County is providing sandbags to residents in unincorporated areas who may be at risk of flooding as the local snowpack melts and rivers and streams rise. Up to 20 filled sandbags may be available on site at Garfield County Road and Bridge locations or residents can pick up 50 empty sandbags that they can fill off site.
The bags area available from 8 a.m. to 4 p.m. at the Rifle Road and Bridge campus, 0298 County Road 333A, and by appointment only from 7 a.m. to 3 p.m. at the Glenwood Springs facility, 7300 Highway 82. Residents of unincorporated western Garfield County can also pick up unfilled sandbags at the De Beque Fire Protection District station, 4580 U.S. Highway 6. Those bags can be filled at the Cowboy Chapel at the corner of county roads 204 and 211, just north of De Beque.
Residents living within cities or towns should contact those municipalities directly for assistance with issues related to potential flooding. Contact Garfield County Road and Bridge at (970) 625-8601 for more information or to schedule an appointment to pick up sandbags at the Glenwood Springs location.
Visit garfield-county.com for local updates on flood conditions and possible impacts and sign up for Garfield County Emergency Communications Authority (GarCo911) alerts at garco911.com/.
A photo captured on May 3, 2023 shows the Dolores River flowing underneath a CDOT bridge structure located on Colorado Highway 141 at mile point 88.5. River flow rates are nearing 10-year flood event levels. (Courtesy photo/CDOT)
The Colorado Department of Transportation is strongly considering closing Colorado 141 between Naturita and Gateway Friday evening, May 5, due to water levels on the Dolores River and extra caution over the structural integrity of the bridge at Roc Creek.
If the river reaches expected levels, CDOT plans to close the highway at 5 p.m. Friday, with the highway remaining closed until the flood danger has subsided. According to a CDOT news release, the closure is dependent on various factors, including snowmelt and reservoir releases. As flow amounts fluctuate, the bridge over Roc Creek may require additional closures
“River flows in the area have not been observed at these levels in 18 years. With the flood event expected to peak this Friday, we are taking proactive and cautionary measures at this particular bridge. Engineers and maintenance personnel will be assessing the structural integrity throughout this high-flow event,” Regional Transportation Director Julie Constan said in the news release.
For safety, CDOT has determined that the bridge structure at Roc Creek should be closed to traffic while peak water flows are occurring. The structure is located approximately 27.5 miles north of Naturita at mile point 88.5. The northbound closure point is located north of Naturita and the County Road CC junction at mile point 64. The southbound closure point is just south of Gateway, at mile point 110.
CDOT hydraulics engineers are closely watching forecasts, as well as tracking the anticipated releases from McPhee Reservoir in Montezuma County, CDOT spokeswoman Lisa Schwantes said.
“It’s going to be a combination of those things that really have an effect on how high the water flow is,” she said. With respect to whether CDOT in fact closes 141: “We’re leaning toward the side of caution.”
The National Weather Service (NWS) has issued a flood advisory for the Dolores River due to the increased release of water from McPhee Reservoir. The flood advisory also includes the Dolores and San Miguel Rivers due to heavy runoff from snowmelt. The flood advisory is in place until further notice and covers Montrose County, as well as the counties of Montezuma, Dolores and San Miguel.
CDOT is less concerned that water will overflow the top of the bridge — projections have the river hitting about 2 to 4 feet below. Rather, the concern is how the bridge structure might respond to a high flow at a rate not seen in close to 20 years, Schwantes said. There is some concern about the bridge piers, as well as large debris that could wash down and lodge beneath it.
“We’re confident of the integrity of the bridge, but we don’t want anyone driving over it when those high peak flows are occurring,” she said.
The northbound closure point is located north of Naturita and the County Road CC junction at mile point 64. The southbound closure point is just south of Gateway, at mile point 110.
Mcphee dam
The National Weather Service (NWS) has issued a flood advisory for the Dolores River due to the increased release of water from McPhee Reservoir. The flood advisory also includes the Dolores and San Miguel Rivers due to heavy runoff from snowmelt. The flood advisory is in place until further notice and covers Montrose County, as well as the counties of Montezuma, Dolores and San Miguel.
Routt County Emergency Management is warning residents to expect flooding Thursday, May 4, into Friday, May 5, with the Yampa River anticipated to reach its highest level yet this season. Emergency Operations Manager David “Mo” DeMorat told Routt County commissioners on Monday, May 1, that the river had hit 6,500 cubic feet per second, and warm temperatures are expected to continue through the week, which could cause the river to reach 7,000 cfs by Friday. DeMorat said this amount of water for the Yampa River is considered “action level” flooding by the National Weather Service. Action levels generally require municipalities to keep a closer eye on flooding and have potential mitigation plans and flood warnings in place…
To gauge what flooding will look like, the county uses snow-water equivalent gauges that provide estimates for the amount of snowmelt that could occur three to four weeks out. This looks at the amount of snow on the ground, but cannot predict at what rate it will melt. Because of this, no exact estimates can be given, as it is ultimately the weather and the freeze-and-thaw cycle that will determine at what rate the snow melts.
DeMorat explained to commissioners that these gauges show areas north of Steamboat and the Stagecoach Reservoir currently have the highest potential for flooding. Three snow-water equivalent gauges stationed north of Steamboat have helped emergency management identify these regions as problem areas for flooding due to the snowpack that could melt. All three are north of Steamboat with one near Dry Lake, one near Lost Dog Creek and another slightly farther northwest. DeMorat noted these locations range from 165-185% of the average snowpack. He told commissioners that Stagecoach Reservoir is another area of concern with 140% of its average snowpack.
Alongside the problem areas DeMorat named, the National Weather Service issued a flood warning for Elkhead Creek, particularly where the creek meets the Yampa River. This flood warning began on Monday and will end Friday unless communicated otherwise by the National Weather Service.
Street-side swale and adjacent pervious concrete sidewalk in Seattle, US. Stormwater is infiltrated through these features into soil, thereby reducing levels of urban runoff to city storm sewers. By U.S. Environmental Protection Agency – U.S. Environmental Protection Agency, Washington, D.C. “Managing Wet Weather with Green Infrastructure:Municipal Handbook:Green Streets” Document No. EPA-833-F-08-009, Public Domain, https://commons.wikimedia.org/w/index.php?curid=5921077
Click the link to read the article on the NOAA website:
The Mid-Atlantic Regional Integrated Sciences and Assessments (MARISA), a NOAA CAP/RISA team, principal investigators Jordan Fischbach, Debra Knopman, and Klaus Keller published a new tool to mainstream green infrastructure planning in the publication, “Rhodium-SWMM: An open-source tool for green infrastructure placement under deep uncertainty.” Green infrastructure measures are stormwater management practices that mimic natural hydrological processes that are used to mitigate negative impacts of urban development and climate change adaptation. While these practices are increasingly being used, there is a challenge to evaluate their effectiveness due to some deep uncertainties and require navigating tradeoffs between multiple objectives. Advanced decision-making tools and methods such as Robust Decision Making (RDM) and Many-Objective Robust Decision Making (MORDM) have been applied to green infrastructure sparingly, but there has still been a lack of open-source tools to support decision-makers.
The MARISA investigators have developed Rhodium-SWMM that connect two open source tools: the Stormwater Management Model (SWMM) and Rhodium, a Python library for MORDM. This new open-source Python library provides an interface for taking SWMM files and applying them to a wide range of parameters identified as uncertainties or levers. . It helps to efficiently search and sample GI decision alternatives and identify vulnerabilities in the system for better multifunctional solutions to future changes.
Debris and mud covers roads, trails, train tracks in Glenwood Springs https://t.co/ClIkWC56DB
— Summit Daily News (@SummitDailyNews) May 2, 2023
Click the link to read the article on The Summit Daily website (Cassandra Ballard). Here’s an excerpt:
After a quick weather jump from cold to warm over the past week, there have now been multiple areas of mud and debris flow throughout Glenwood Springs and the surrounding area due to the rapidly melting snow on Red Mountain and elsewhere. On Tuesday morning, a major debris flow blocked access to the wastewater treatment facility in West Glenwood, along with covering the Union Pacific Railroad train tracks in West Glenwood, causing a freight train to get stuck…
On Monday, local trails on Red Mountain and at Wulsohn Mountain Park, and on the higher trails of the South Canyon trail system were closed from mud flows, and the city was urging people to stay off the closed trails…
In addition, Garfield County emergency management officials reported late Monday that County Road 127 (3 Mile Road) was covered with water and mud and a private bridge was washed out at the half mile mark due to flooding on Three Mile Creek. Several residences were also being impacted. And, the Colorado Department of Transportation was reporting mudflow activity in Glenwood Canyon near Interstate 70.