This week, a massive heat dome settled over the central and southern United States, creating unprecedented warmth for the holiday week. This high-pressure system shattered daily high-temperature records, with readings soaring 15 to 35 degrees above average across the region. Numerous daily records were broken between December 24 and December 27, contributing to what was forecast to be the warmest Christmas Day on record for the contiguous U.S. The weather pattern snapped violently late in the weekend as a powerful winter cyclone swept eastward from the Plains between December 27 and 29. This system drove a sharp cold front through the South, causing temperatures to plummet from record highs to near freezing overnight. Simultaneously, the storm unleashed severe winter conditions across the Upper Midwest and Great Lakes, delivering blizzard conditions and up to two feet of snow near Lake Superior, alongside significant ice accumulations that snarled travel in parts of the Northeast. Precipitation was near- to below-normal for much of the country, while much of the West, and parts of the Midwest and Northeast observed above-normal precipitation during this week. The West Coast was a notable exception where a strong atmospheric river brought heavy precipitation to most of California, dumping over 10 inches of rain in some areas and several feet of new snow in the mountains…
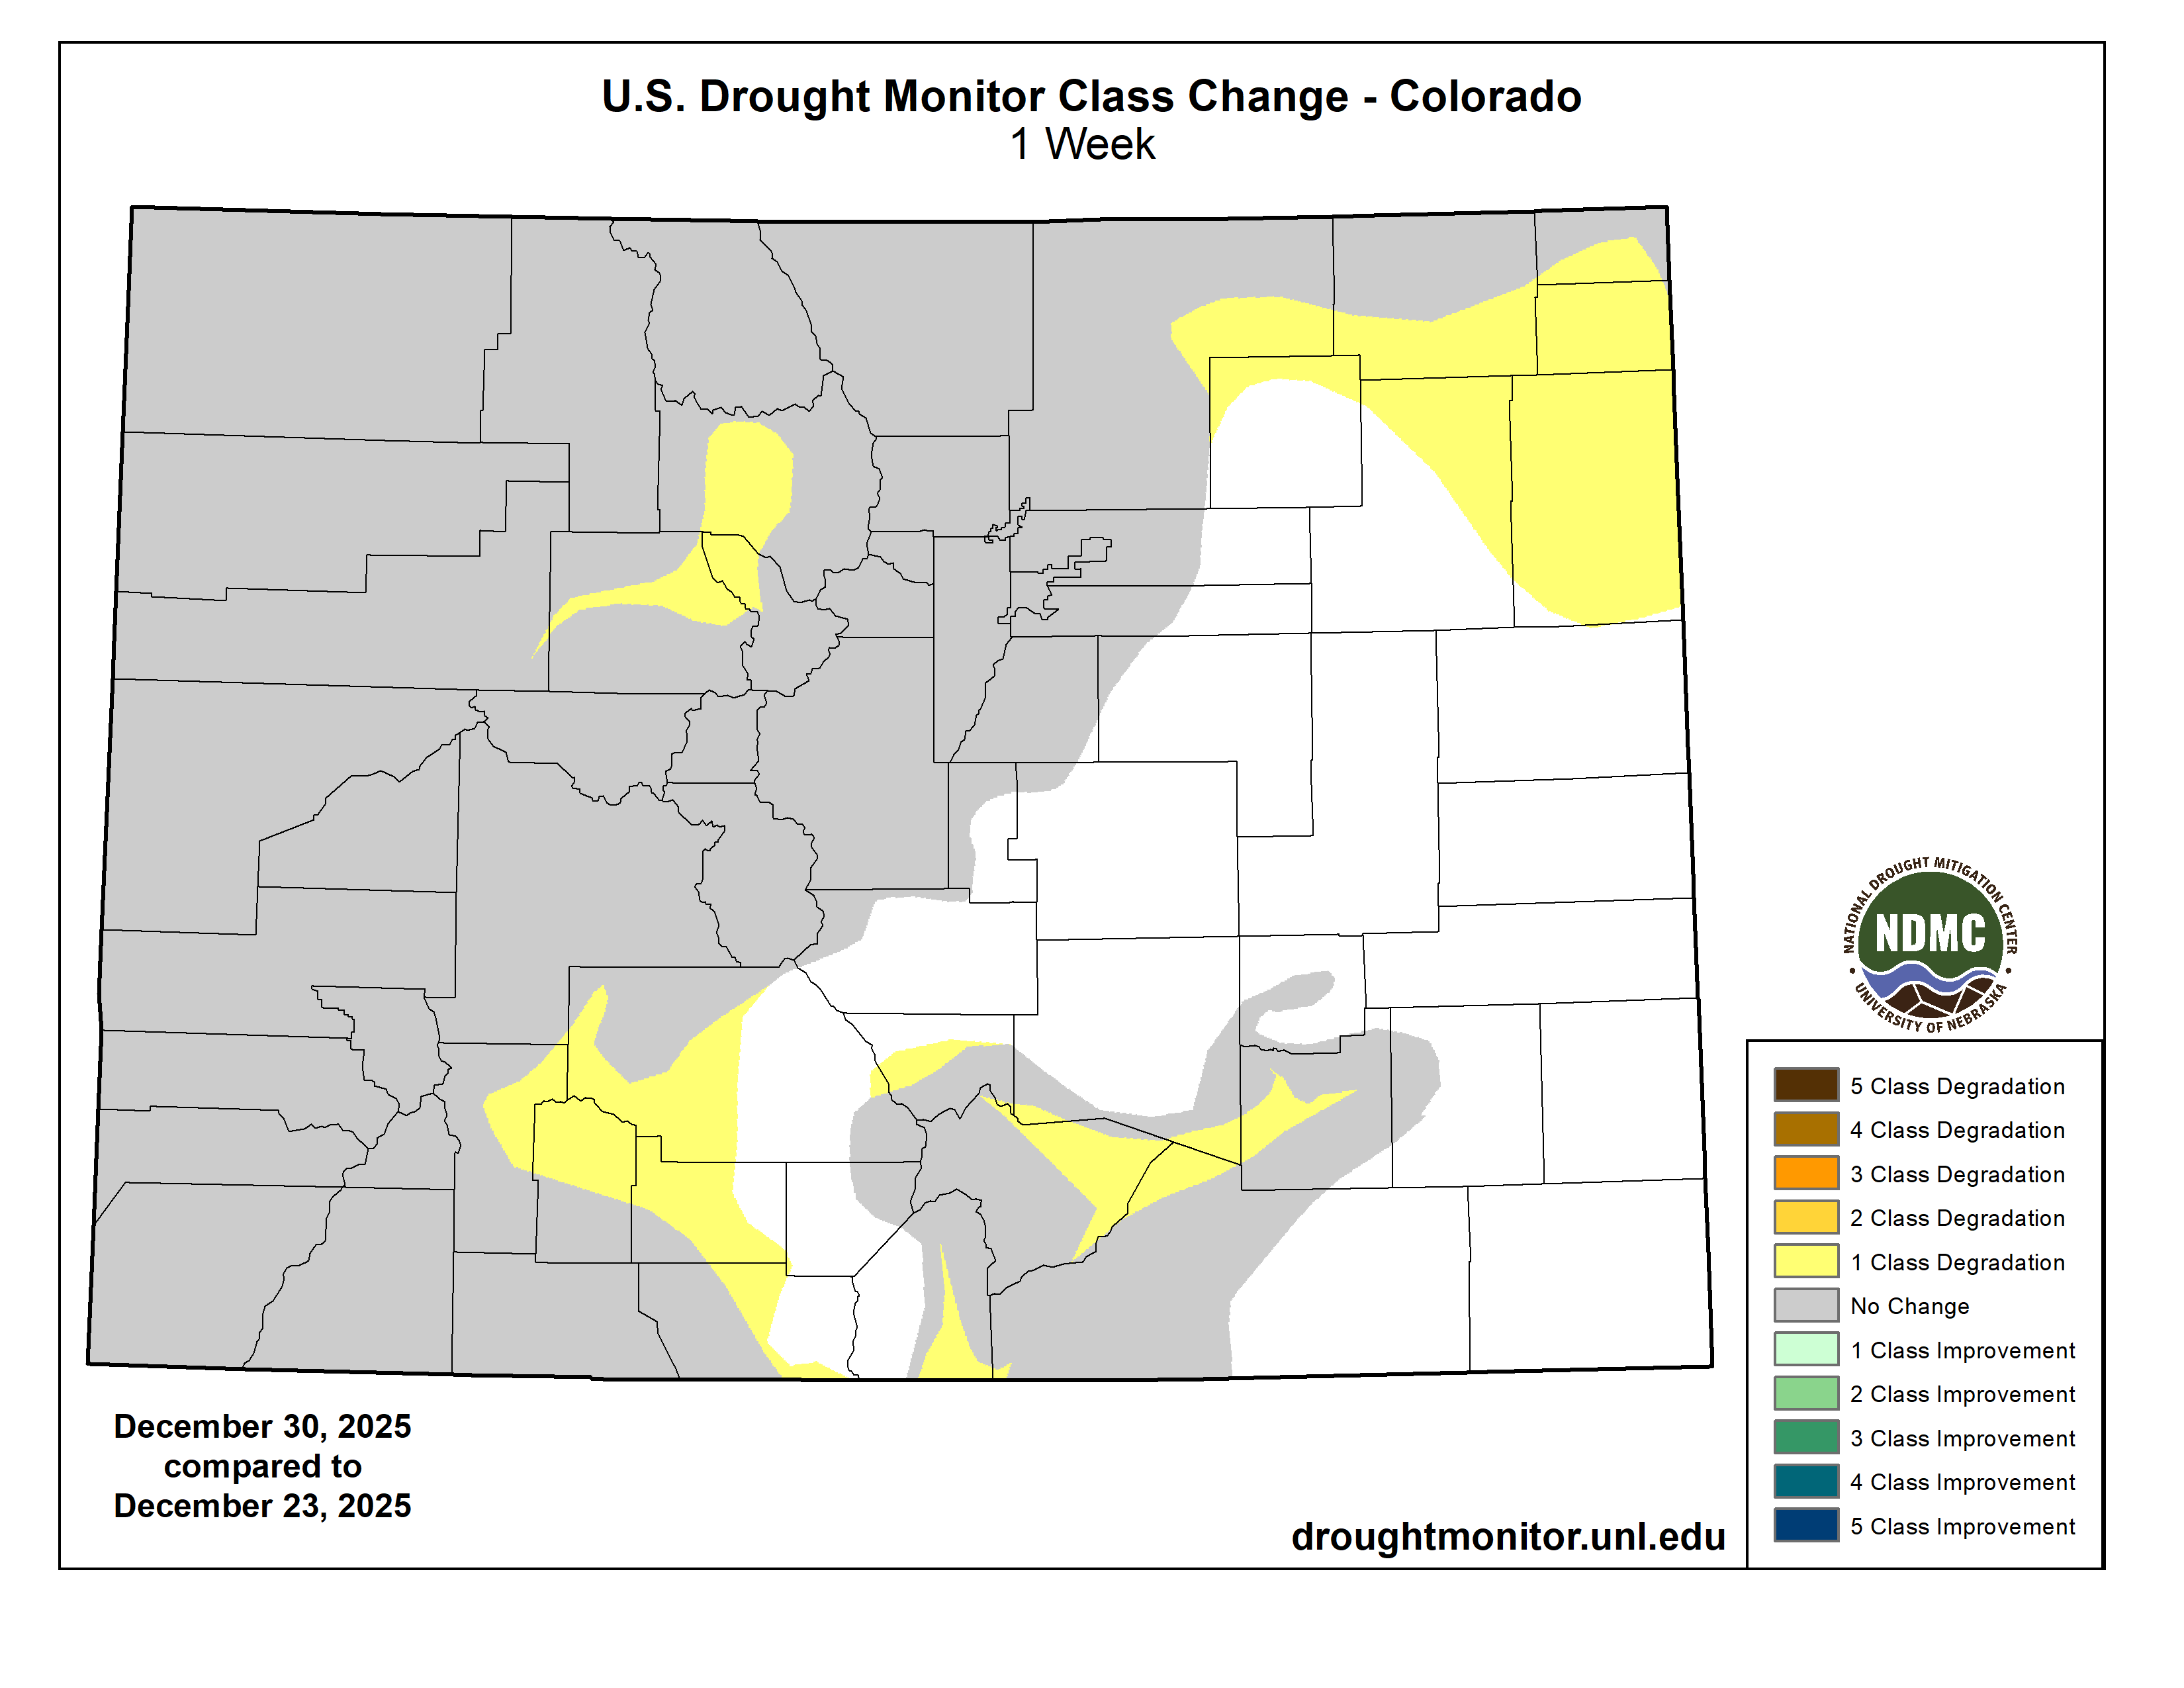
Warmer-than-average temperatures dominated the High Plains this week, with departures ranging up to +25 degrees F above normal, while near- to below-normal temperatures were observed along northern portions of the region. Precipitation varied across the region, with most areas reporting near- to below-normal totals. Western Wyoming was the exception, where weekly precipitation totals were 200% to 600% of normal. Consequently, severe drought (D2) was removed from western Wyoming, while moderate drought (D1) and abnormal dryness (D0) improved. Conditions were drier on the east side of the state, justifying the expansion of abnormal dryness in those areas. The majority of the southern half of the High Plains observed temperatures 10 to 20 degrees above normal for the week, while precipitation totals were reported to be 25% or less of normal. Extreme drought (D3) expanded in central Colorado, while moderate drought (D1) expanded in southern Colorado, across northern portions of Nebraska, and in southeast Kansas. Abnormal dryness (D0) expanded across northeast Colorado, southern and northern portions of Nebraska, and in southeast Kansas…
Colorado Drought Monitor one week change map ending December 30, 2025.
Temperatures were above normal across much of the West this week, while below-normal temperatures were observed along parts of the West Coast and in northern Montana. For the week, temperature departures ranged from -10 degrees F below normal in northern Montana to +25 degrees F above normal in parts of Nevada and Utah. Precipitation varied across the region, with beneficial amounts falling across much of the southwest and parts of the north. Over the past 14 days, much of the West has received 2 to 20+ inches of precipitation, with departures ranging from +1 to +8 inches above normal (150% to 800% of normal). This above-normal precipitation justified the removal of extreme drought (D3) from the Washington-Idaho-Oregon border and reduced severe drought (D2) coverage in northern Montana. Moderate to severe drought (D1-D2) conditions improved in portions of Washington, Idaho, Montana, Nevada, and southern Arizona, while moderate drought (D1) was removed in western Washington and improved in north-central Oregon and central Arizona. Abnormal dryness (D0) was removed from southern California and improved across northern portions of the region. Conversely, conditions were drier than normal across interior and eastern portions of the region. Lack of precipitation and growing deficits resulted in the expansion of severe drought (D2) in western Utah, while moderate drought (D1) and abnormal dryness (D0) expanded in central Nevada this week…
Below-normal precipitation and above-normal temperatures dominated the South this week, resulting in widespread drought degradation across the region. Temperatures were above normal for the entire region, with departures ranging from +5 degrees F to +25 degrees F. Dry conditions also persisted, with monthly rainfall totals ranging from 1 to 5 inches below normal (5% to 25% of normal) for December. Extreme drought (D3) expanded in central Texas, while severe drought (D2) was introduced or expanded in southeast Oklahoma, southeast Texas, west-central Louisiana, eastern Tennessee, parts of central Texas, and northeast Arkansas. Moderate drought (D1) and abnormal dryness (D0) expanded across much of the region…
Looking Ahead
During the next five days (December 30, 2025–January 3, 2026), a highly amplified pattern will create a sharp divide across the Continental U.S. An upper-level ridge situated over the West Coast will keep conditions initially quieter there, while a broad trough east of the Mississippi River will usher in cold air and active winter weather to the eastern states. A strong low-pressure system exiting the Northeast will leave behind blustery conditions and significant lake-effect snow, particularly downwind of the Great Lakes where accumulations of 1-2 feet are possible in Upstate New York. As the week progresses, a reinforcing cold front will sweep through the East on Thursday, maintaining the chill and snow chances, while the western ridge will begin to move inland. This split flow will result in a notable temperature dichotomy across the country. Below-average temperatures will grip the region from the Northern Plains to the East Coast, with the coldest conditions centered on the Upper Midwest where highs in the single digits and subzero overnight lows are expected. Dangerous wind chills may affect the central Gulf Coast and Southeast early in the period. Conversely, much of the West and High Plains will experience above-average warmth. By Thursday and Friday, the weather pattern will shift in the West as Pacific systems move in, bringing rain and mountain snow back to the coast, with potential heavy precipitation in Southern California and snow in the Sierra Nevada.
The Climate Prediction Center’s 6-10 day outlook (valid January 4–8, 2026) favors above-normal precipitation across Hawaii, the Pacific Coast and parts of the interior West, Alaska, and in parts of northern Plains and New England. Below-normal precipitation is favored from the central and southern Plains into portions of the Ohio Valley. Probabilities for above-normal temperatures are increased across most of the U.S., including most of Hawaii, while below-normal temperatures are favored across most of Alaska and much of the Northeast.
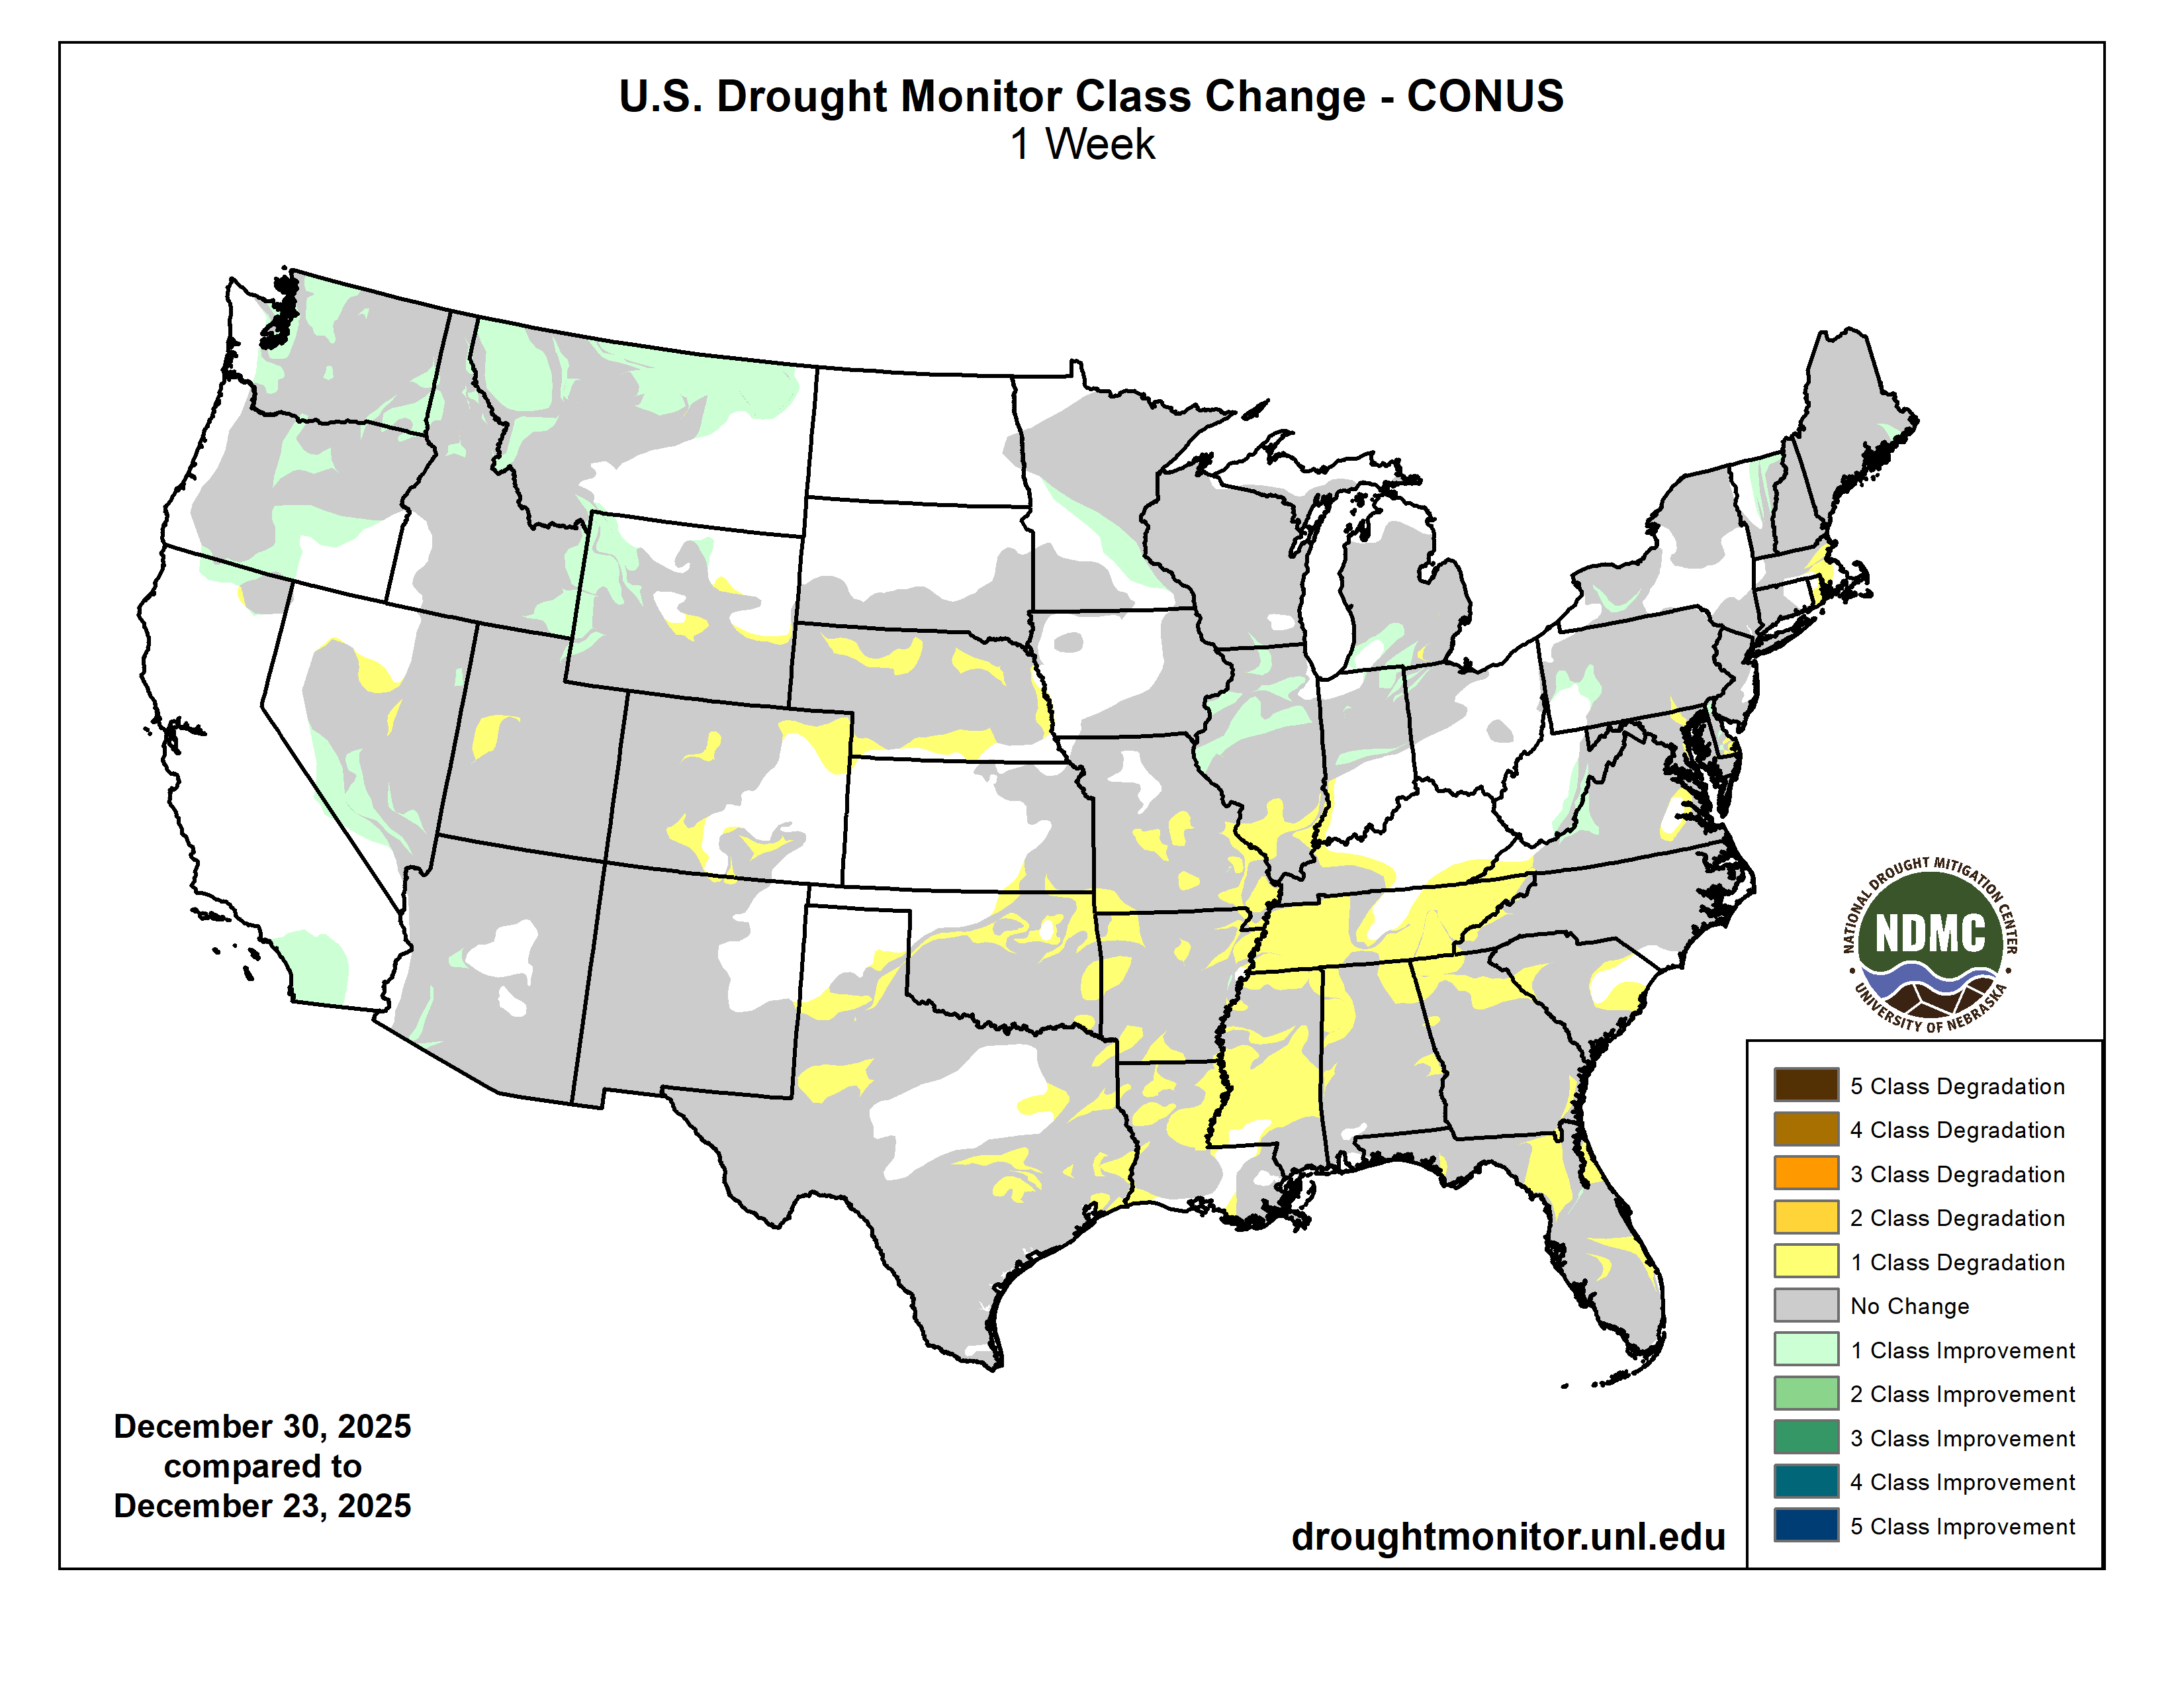
US Drought Monitor one week change map ending December 30, 2025.
Despite the escalating threats to rivers, this past year brought real progress worth celebrating. To highlight the positive strides being made across the country, we’ve curated a list of 10 exciting wins for rivers, community safety, people, and wildlife. From proposed Wild and Scenic protections for nearly 100 miles of the Gallatin and Madison rivers, to major investments in river restoration and wildfire resilience in California, and stronger permit safeguards for the Rappahannock River, 2025 proved to be a year of meaningful breakthroughs for waterways nationwide.
In no particular order, here’s a snapshot of 10 of our biggest river wins of 2025:
Secured major wins for America’s Most Endangered Rivers® of 2025
Our 2025 America’s Most Endangered Rivers® report ranked the Tijuana River #2 due to toxic pollution threatening border communities. This designation, developed with partners Surfrider Foundation and Un Mar de Colores, helped catalyze swift federal action. Within three months of the April report release, American Rivers and others were invited to meet with EPA Administrator Lee Zeldin in southern California, which helped build momentum for a landmark agreementbetween the United States and Mexico to address the ongoing public health crisis. This demonstrates how strategic advocacy, combined with persistent community leadership, drives solutions for rivers and their communities.
The Rappahannock River’s designation as one of America’s Most Endangered Rivers® of 2025 brought crucial national attention to the threats facing Virginia’s longest free-flowing river. But this spotlight did more than raise awareness; it galvanized action that delivered tangible results. Working alongside our dedicated partners, The Friends of the Rappahannock, the Rappahannock Tribe, and the Southern Environmental Law Center, we achieved a significant victory for the river and the communities that depend on it. This collaborative effort secured permit changes for a proposed data center, banning industrial cooling withdrawals and reducing drought withdrawals by millions of gallons.
Mobilized action to protect Public Lands and Roadless Areas
The Trump administration is looking to rescind the Roadless Rule, which protects clean water and wildlife habitat by preventing road construction and timber harvest on roughly 45 million acres of national forests. This would be a significant setback (100,000 river miles) to our goal of protecting one million miles of rivers. Our team is making sure decision makers understand the impacts to clean drinking water supplies and we are mobilizing our supporters (we’ve collected more than 10,000 signatures so far) in support of these important river protections.
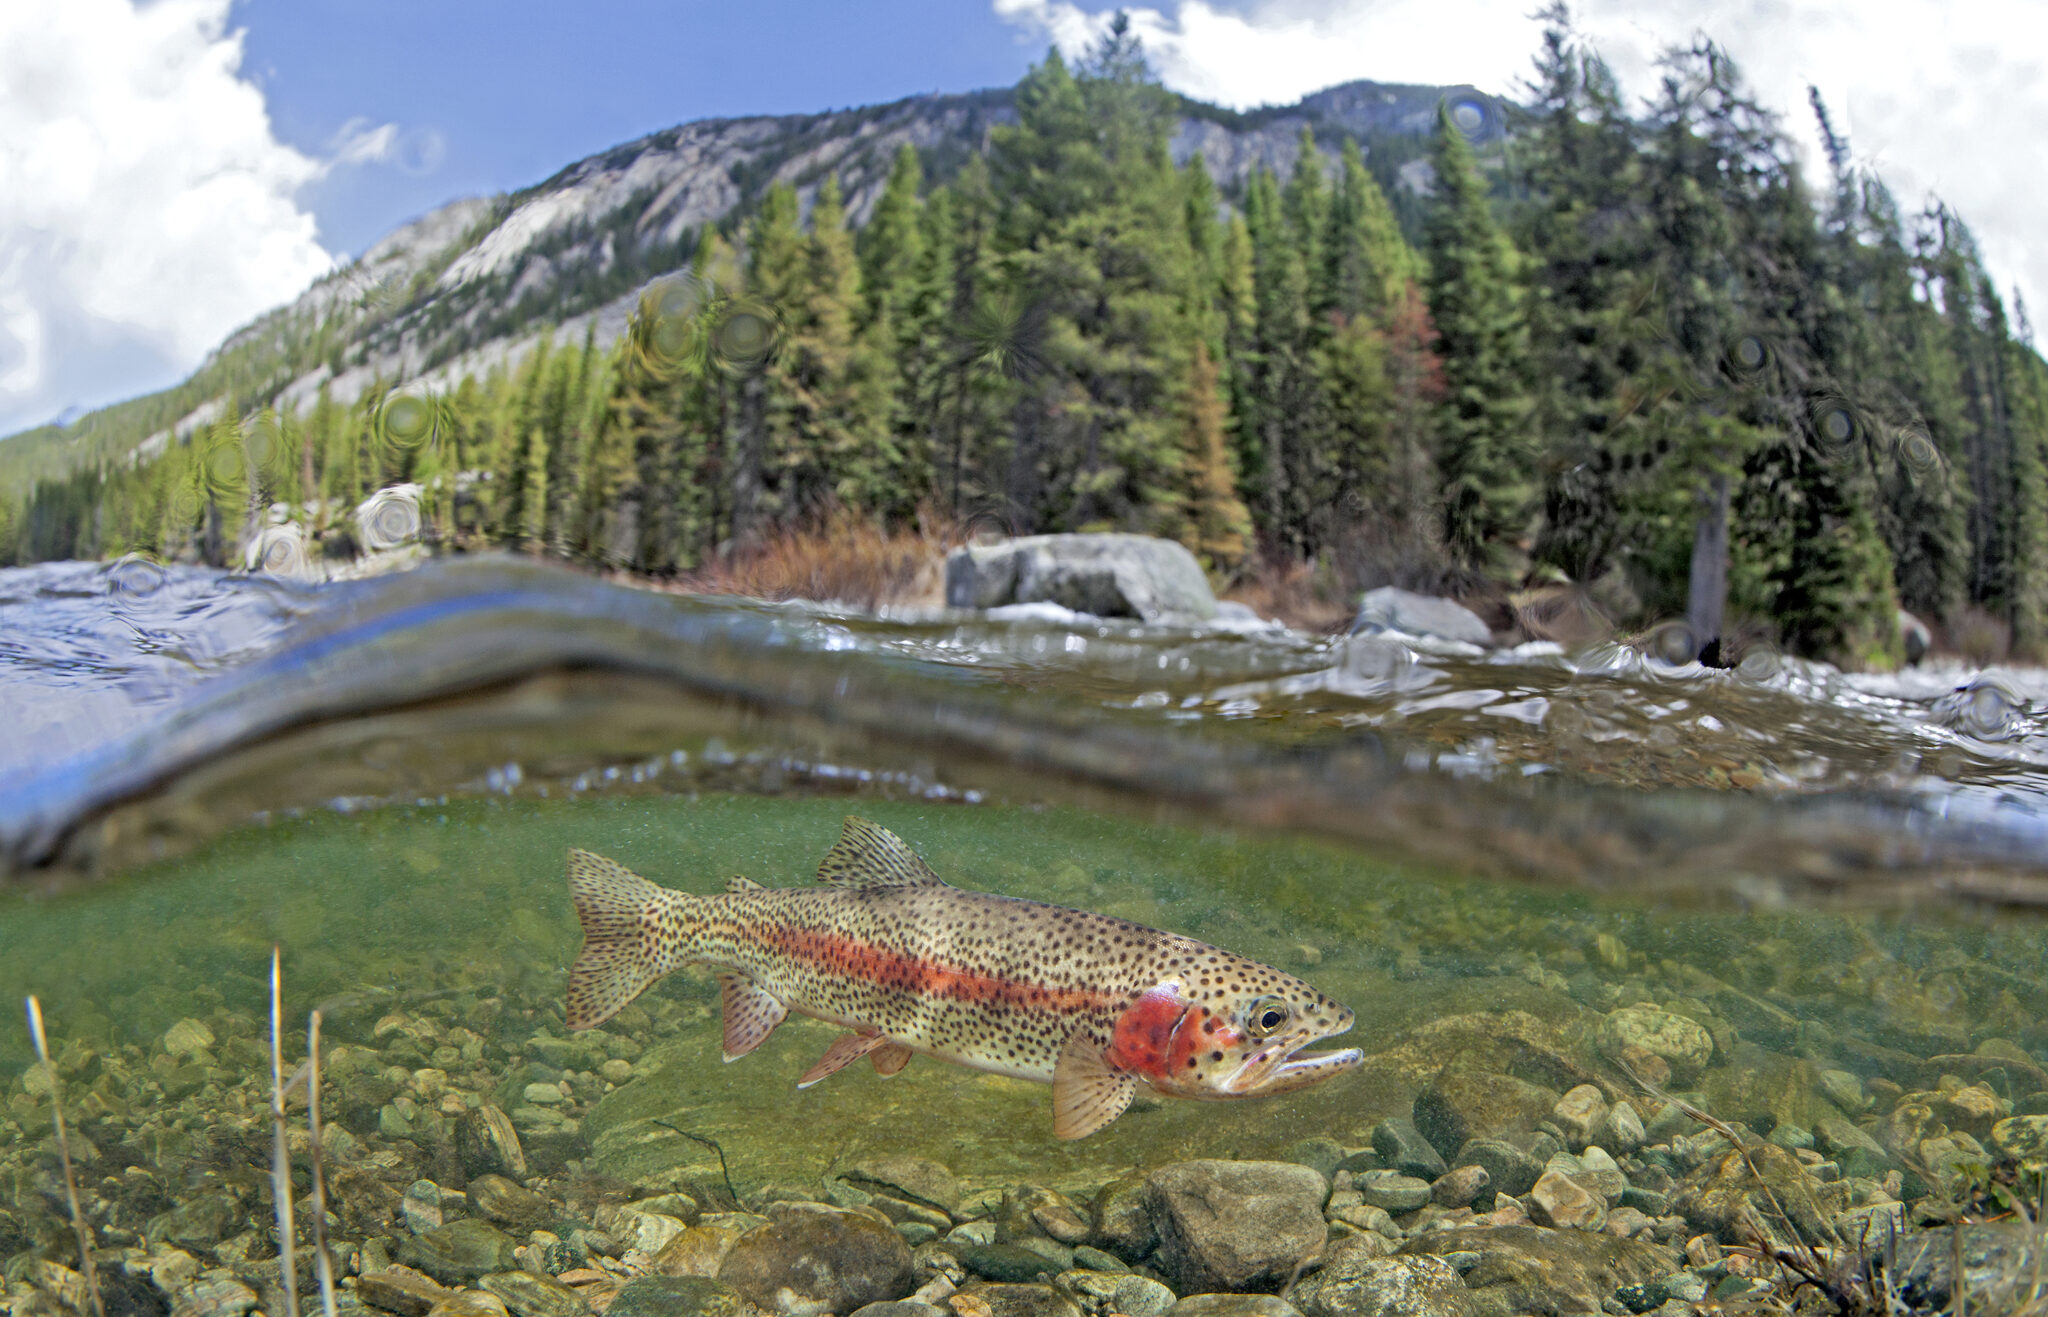
Rainbow trout in the Gallatin River, Montana.
Safeguarding Montana’s Gallatin and Madison Rivers
Rep. Ryan Zinke (MT) introduced the Greater Yellowstone Recreation Enhancement and Tourism Act (GYREAT Act) – Wild and Scenic legislation to protect nearly 100 miles of the Gallatin and Madison rivers and their tributaries in southwestern Montana. This legislation was developed through collaboration with American Rivers and our partners. If passed, these protections would create a vital corridor linking the rivers of Yellowstone National Park to the headwaters of the Missouri River.
Defending healthy rivers and Tribal sovereignty
American Rivers helped rally national, regional, and local partners in urging the Department of Transportation to protect aquatic connectivity programs — efforts that restore fish passage, reconnect rivers and wetlands, and replace outdated culverts and road crossings. The joint comment letter was signed by 140 groups — including Tribes, anglers, businesses, universities, research institutions, conservation organizations, community leaders, agencies, faith groups, and planners — all united for healthier, more connected waterways.
Additionally, when the Department of Energy urged the Federal Energy Regulatory Commission to roll back its 2024 policy protecting Tribal sovereignty in hydropower permitting, American Rivers acted fast. Working with Tribal attorneys, Native networks, and partner organizations, we mobilized national opposition and filed formal comments — demonstrating our deep commitment to Tribal leadership and ensuring healthy rivers. We’ll continue working alongside Tribal partners to ensure these protections remain strong.
Restoring mountain meadows in California
American Rivers is a key member of The Sierra Meadows Partnership, a coalition of environmental organizations working together to restore 30,000 acres of mountain meadows by 2030. These meadows act as natural sponges that store water, improve drought resilience, and provide essential wildlife habitat. Through this collaborative effort, we successfully secured a $24.7 million block grant from the Wildlife Conservation Board to support our restoration work.
Restored Wilson Ranch Meadow, California | Allison Hacker
Advanced critical protections for New Mexico’s waterways
After naming New Mexico’s waterways #1 on America’s Most Endangered Rivers® of 2024 list, we’re celebrating significant wins across the state. In the Pecos watershed — home to elk, black bears, Rio Grande cutthroat trout, and generations-old acequia farms — the Department of Interior paused new mining claims across 165,000 acres while pursuing longer-term protections. Through advocacy with our partners, we helped secure Outstanding National Resource Waters protection for over 250 miles of rivers across five watersheds, including the Rio Grande. And now, Senator Heinrich (NM) and the All Pueblo Council of Governors are championing protection of the Caja del Rio — a 107,000-acre landscape along the Rio Grande and Santa Fe rivers that holds deep cultural significance for Puebloan and Hispanic communities while supporting diverse wildlife.
Furthering community safety through dam awareness
American Rivers spoke on panels and hosted webinars addressing the deadly threat of low head dams, generating hundreds of participants from across the dam removal and safety industries. A low head dam is a human-made structure that spans the full width of a river and is designed to allow water to continuously flow over it, creating a dangerous hydraulic and earning them the nickname “drowning machines.” Our educational workshops brought together leading experts to discuss solutions for addressing these public safety hazards while advancing river restoration solutions.
Building momentum for dam removal across the Northeast
American Rivers is celebrating a wave of funding that will free multiple rivers across the Northeast. We were awarded $220,000 to remove the Yopp Pond dam on the Fourmile River in Connecticut — the first barrier blocking this coastal river that drains to Long Island Sound. Fisheries biologists note this removal will be transformational for alewife runs in this critical watershed. Additionally, New Hampshire Fish and Game committed $150,000 to support two strategic dam removals: North Branch Gale dam in the Upper Connecticut River watershed and Mead Brook dam in the Contoocook River watershed. Both dams impact excellent cold-water habitat and are scheduled for removal in 2026. Additionally, the Davis Conservation Foundation granted $20,000 for our hydropower relicensing work in Maine.
Defended Idaho’s Salmon River
Along with our partners at Advocates for the West and coalition members in Idaho, American Rivers and our Action Fund filed a lawsuit against the Forest Service to prevent a massive open-pit gold mine at the headwaters of the South Fork Salmon River. This important waterway is a national treasure that provides critical spawning habitat for the longest-distance, high-elevation salmon migration on Earth, as well as world-class whitewater recreation and fishing. It has been listed as one of America’s Most Endangered Rivers® for three consecutive years.
Improved wildfire resilience in California
American Rivers and our partner, Terra Fuego Resources Foundation, completed prescribed fire burns on 160 acres as part of a 570-acre fuel reduction and prescribed fire project — a critical effort to protect the South Yuba River and the communities of Nevada City and Grass Valley from catastrophic wildfire. In a major boost for river restoration, the California Wildlife Conservation Board approved nearly $5 million to launch the Pickel Meadow Restoration Project on the West Walker River. Construction begins this summer, marking an exciting next chapter for this important watershed.
Created by Imgur user Fejetlenfej , a geographer and GIS analyst with a ‘lifelong passion for beautiful maps.’ It highlights the massive expanse of river basins across the country – in particular, those which feed the Mississippi River, in pink.
Click the link to read the article on the AZCentral website (Debra Utacia Krol). Here’s an excerpt:
December 29, 2025
Key Points
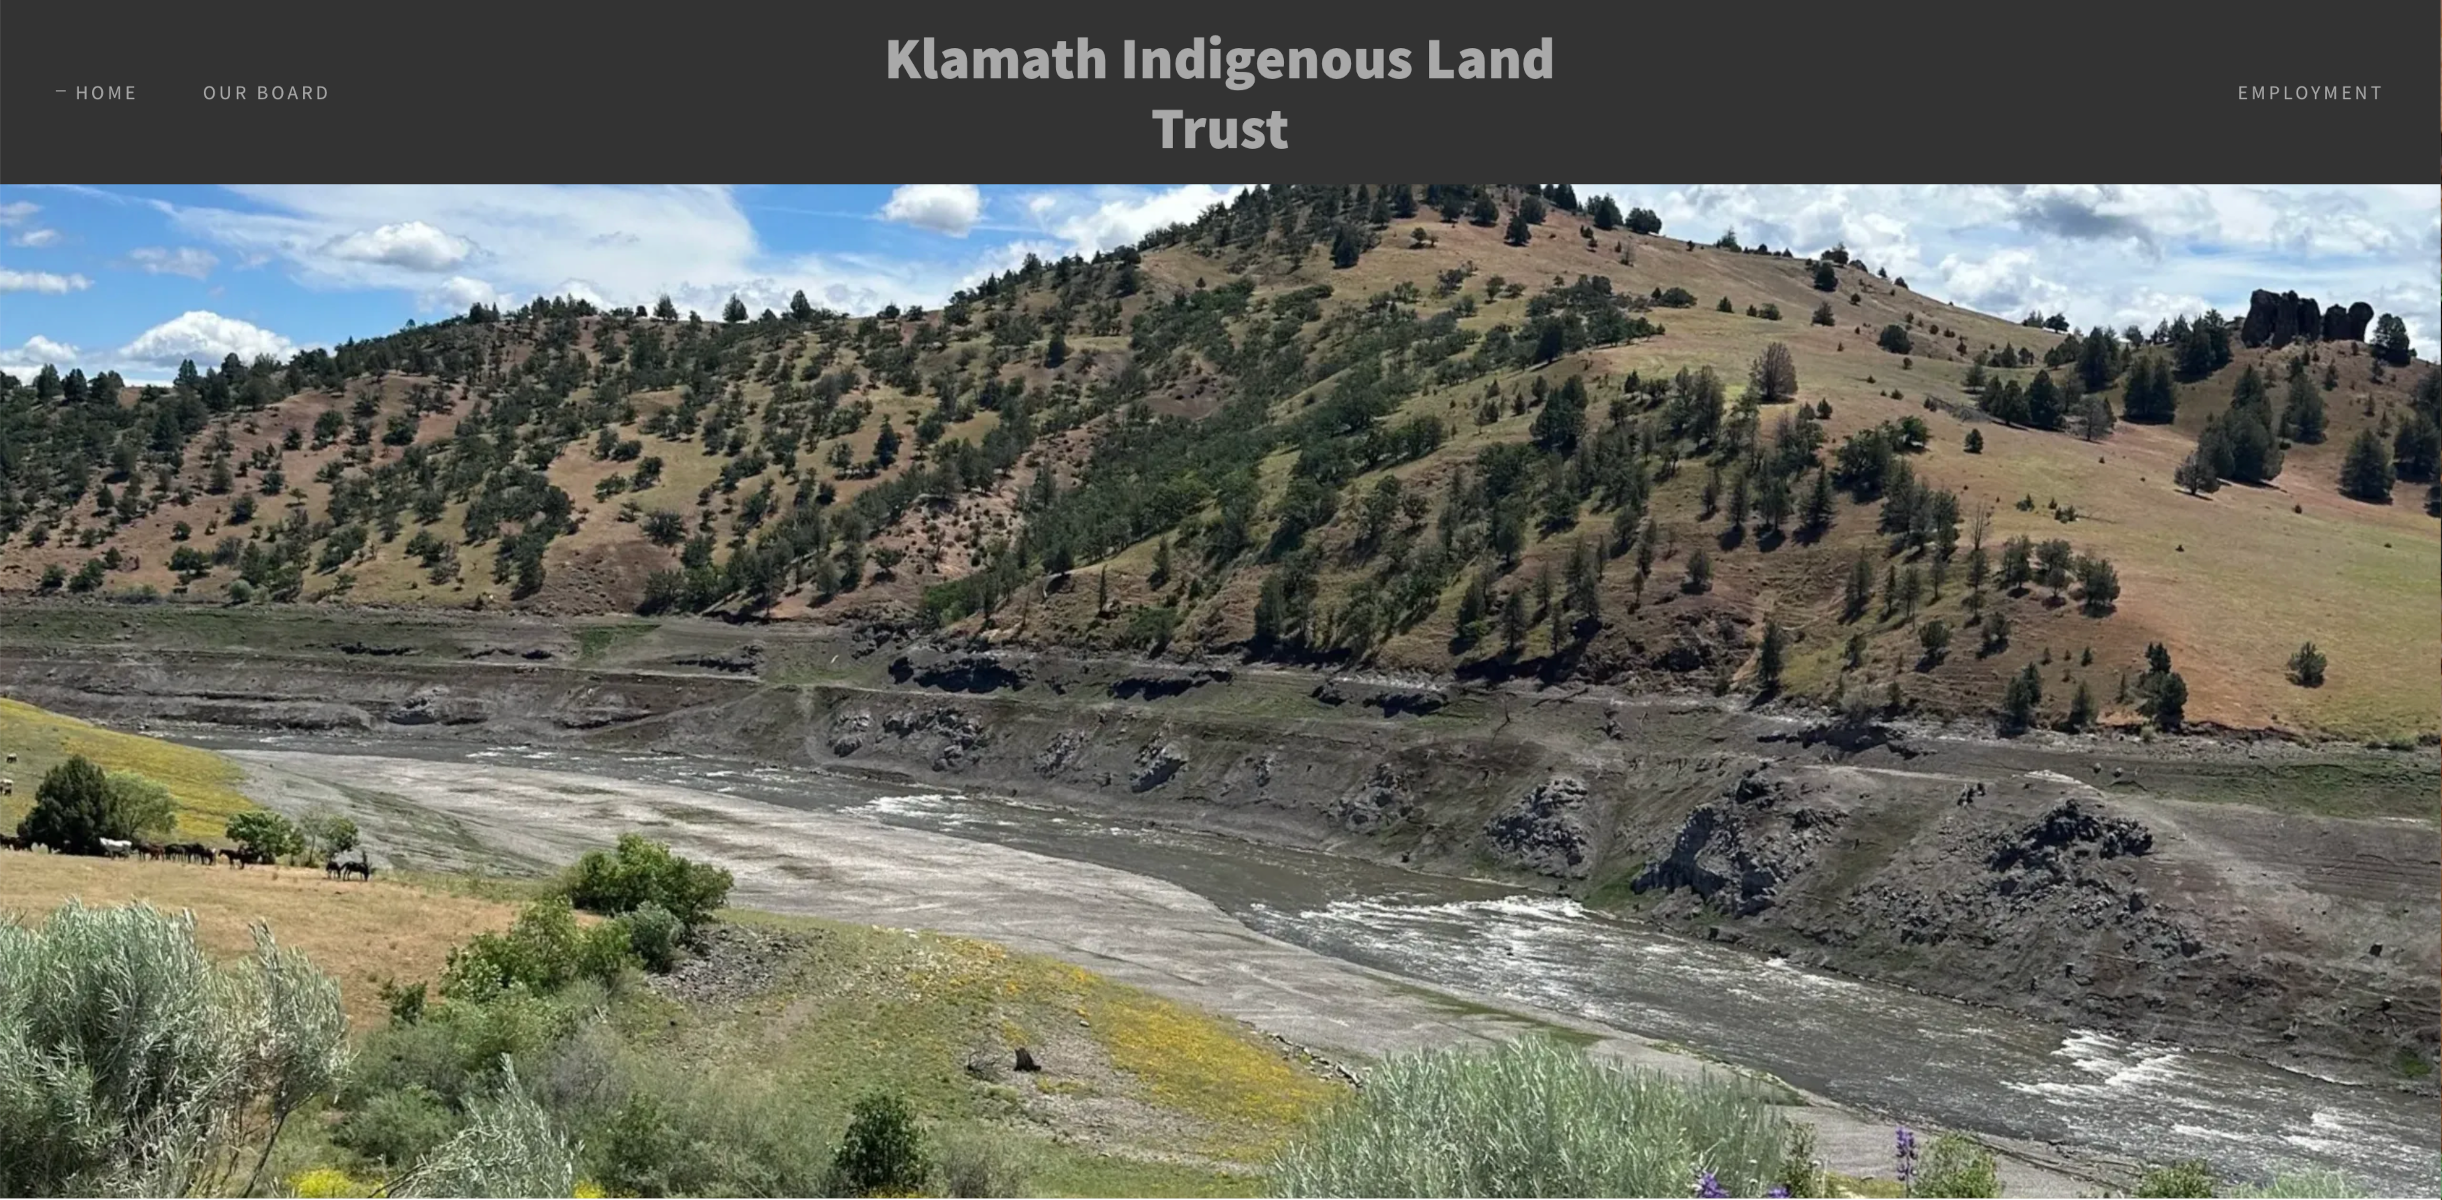
A new intertribal land trust has acquired 10,000 acres of land along the Klamath River from former dam operator PacifiCorp.
The land transfer is a key step in restoring the river basin’s ecosystem following the removal of four dams.
Indigenous values and traditional practices will guide the restoration of the land, which includes important salmon habitat.
Another milestone in restoring the Klamath River Basin has been reached. A new land trust received title to land on Dec. 22 that includes important salmon habitat and lands upstream of and adjacent to four now-removed dams and the shallow reservoirs that impeded fish and nurtured deadly algae in northern California and southern Oregon. The Klamath Indigenous Land Trust was formed by a coalition of members from four basin tribes after the historic 2002 fish kill to remove the dams as the beginning of a long-term effort to restore health to one of the West’s most imperiled rivers. PacifiCorp, the previous landowner and former hydropower operator, agreed to sell 10,000 acres to the land trust to return stewardship to the tribes who fought for decades to remove the dams as the first step in river recovery. Indigenous values and millennial-long practices which once made the basin one of the West Coast’s largest salmon habitats will direct the job of restoring the ecology of the area, which is the size of West Virginia. The Catena Foundation, the Community Foundation of New Jersey and an anonymous donor provided the funding for the purchase, which is one of the largest such purchases by an Indigenous-led land trust to date…
“Dam removal allowed the salmon to return home,” said Molli Myers, the land trust’s board president and member of the Karuk Tribe. “Returning these lands to Indigenous care ensures that home will be a place where they can flourish and recover.”
“PacifiCorp is pleased to see these lands transition to a stewardship model that honors their cultural and ecological significance,” said Ryan Flynn, president of Pacific Power, the division of PacifiCorp that serves customers in the Northwest.
Workers raise dam 109 feet in 2025. Next year’s goal: Reaching the top.
The Denver Water team working on Gross Dam in Boulder County is celebrating a successful year after the dam raise is 95% complete.
“In 2025, we raised the height of the dam by 109 feet above the original structure,” said Jeff Martin, Denver Water’s program manager for the Gross Reservoir Expansion Project. “We have 22 feet left to go to reach the new height and we’re on track to reach that in 2026.”
The dam-raising aspect of the Gross Reservoir Expansion Project wrapped up for the season on Nov. 14, due to the drop in temperatures. The project is designed to nearly triple the water storage capacity of Gross Reservoir.
In 2025, workers raised the height of Gross Dam by 109 feet. The final 22 feet will be completed in 2026 to reach the dam’s new height of 471 feet. Photo credit: Denver Water.
“We have to stop placing roller-compacted concrete when the temperatures drop below freezing,” said Casey Dick, deputy program manager for the Gross Reservoir Expansion Project.
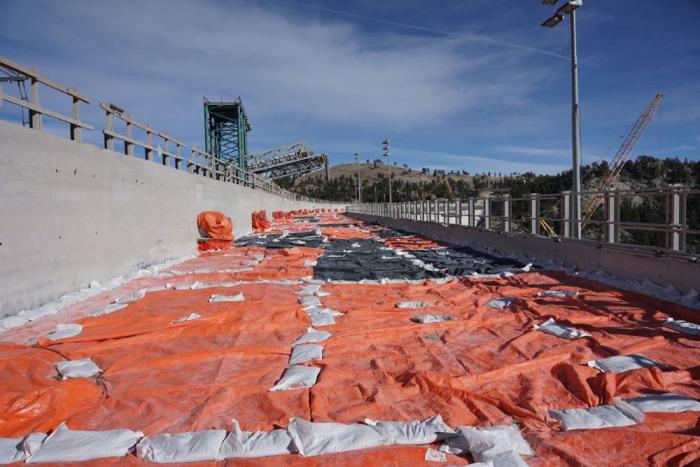
“To prepare for winter, we put blankets on top of the new concrete to keep it from getting too cold. That’s because if the concrete freezes while it is still curing, it can lead to a weakened final product.”
Work associated with the dam raise will resume in spring 2026, when the weather warms up enough to complete the final 22 feet.
Protective “blankets” were placed on top of the dam to insulate the new concrete, so it does not fully cure over the cold, winter months. Photo credit: Denver Water.
Once that work is complete, the dam will be 471 feet tall, which is 131 feet higher than the original. The completed dam also will be longer across its crest, or top. The original crest was 1,050 feet long; the higher dam will have a crest that stretches 2,040 feet from one side of the canyon to the other.
This year marked the second year of dam raising construction work at Gross.
As of December 2025, workers had placed more than 730,000 cubic yards of concrete. To put that in perspective, Empower Stadium at Mile High, where the Denver Broncos play their home football games, required just 29,000 cubic yards of concrete to build, about 4% of the concrete placed so far on Gross Dam.
Protective “blankets” were placed on top of the dam to insulate the new concrete, so it does not fully cure over the cold, winter months. Photo credit: Denver Water.
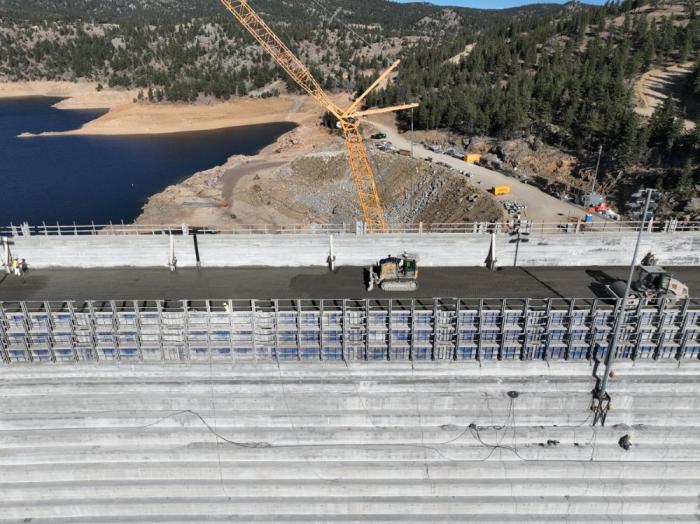
Roller-compacted concrete is a special mix of concrete that allows crews to place it on the dam and then spread it out. The concrete is firm enough to be able to drive machinery on top of it. The process is a fast and efficient method of raising the dam. During the construction work, crews raised the height of the dam by about 1 foot per day.
Construction crews use GPS technology and survey equipment to keep track of how high they’ve raised the dam.
“The way we keep track of the elevation gain is that the bulldozers are equipped with GPS-grade control technology, which ensures that each layer of concrete is spread to the correct thickness,” Dick said.
“Once the concrete is rolled and vibrated into place, each layer ends up being 1 foot thick. It’s then checked by surveyors with their equipment to verify the exact elevation.”
The bulldozers are equipped with GPS-grade control technology to monitor the height of the concrete as it is spread across the top of the dam and keep track of the elevation. Photo credit: Denver Water.
Work won’t completely stop over the winter.
Mechanical and pipe work will be done inside the dam, and crews will build a stilling basin at the base of the dam. The basin’s function is to slow the speed of water coming down the dam’s spillway and safely redirect the water into South Boulder Creek.
Work on the stilling basin at the base of the dam will continue over the winter. The stilling basin is designed to slow the flow of water coming down the spillway and channel it into the creek. Photo credit: Denver Water.
“This season was a huge success, and our team met a ton of challenges in raising Gross Dam,” Martin said. “We had legal challenges and adverse weather challenges. We also had wildfire safety operation challenges that shut down our power supply up here. Despite all those setbacks, the dedicated team of 500 men and women rose to the challenge. I’d just like to thank everybody who committed themselves to this project and helped us make 2025 a success.”
Jeff Martin, Denver Water’s program manager for the Gross Reservoir Expansion Project, stands at the south side of the dam. Once completed, the dam will reach up to white line on the rock wall. Photo credit: Denver Water.
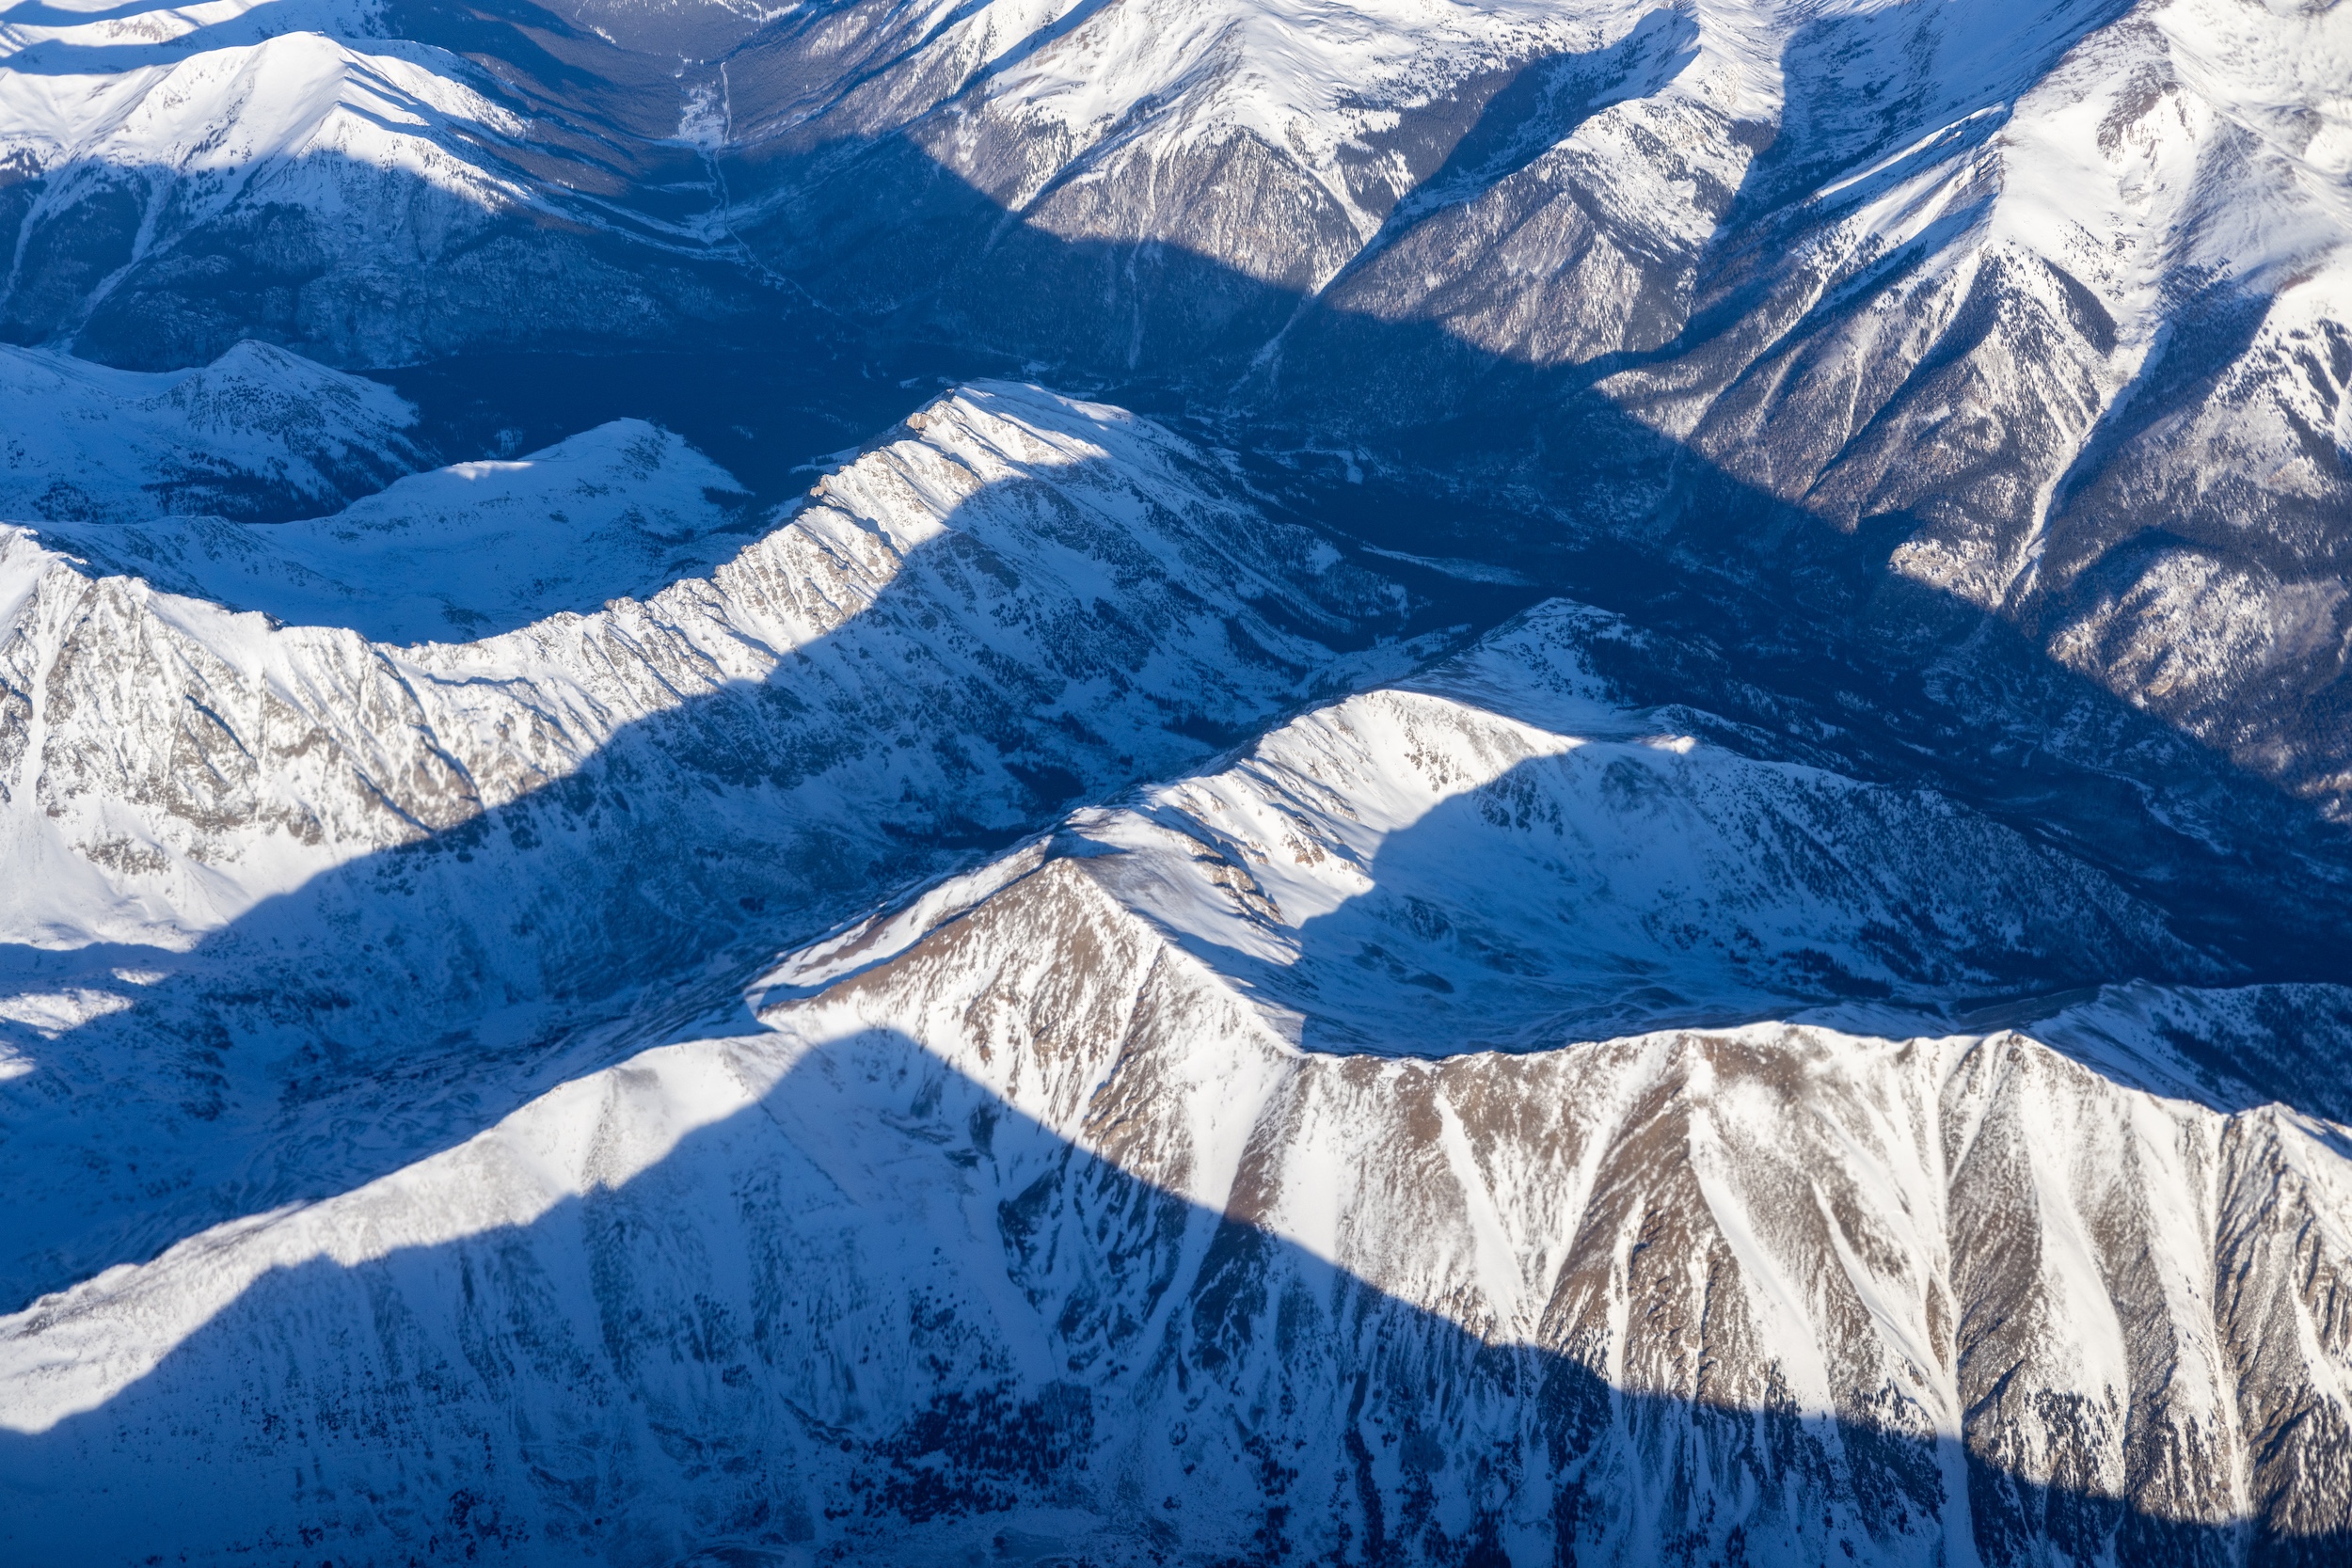
Aerial view of the snowpack in the San Juan Mountains of southwest Colorado on Dec. 3, 2021. Scientists and water managers use a variety of methods to monitor the snowpack, which supplies most of the water flowing in many Western streams and rivers. Photo by Mitch Tobin/The Water Desk.
A controversial recent study highlights an old truth about the American West’s snowpack: it’s difficult to measure—and just as hard to forecast how much of its water will ultimately reach tens of millions of people and vast swaths of farmland.
Water managers have increasingly turned to aircraft that use lasers to gauge the snowpack across entire basins. But the Aug. 15 scientific paper argues for a less expensive strategy: focusing new monitoring efforts on a select number of locations known as “hotspots” that excel at predicting how much water will run off from the snowpack—a frozen reservoir that can change dramatically over short distances.
Snowfall rates vary widely with elevation, and the amount of water locked in falling snowflakes shifts from storm to storm.
On the ground, snow accumulation depends on the wind, the forest canopy overhead, the exposure to the sun and the amount of dust that lands on the snowpack. Even a homeowner armed with a ruler can find very different snow depths depending on where they poke in their backyard.
For water providers, knowing how much water is stored in the snowpack is essential. In much of the West, snowmelt supplies most of the runoff that flows through streams, rivers, reservoirs, irrigation canals and household faucets.
If water managers overestimate the snowpack, their customers can be left high and dry later in the year. But if analysts underestimate streamflows, reservoirs can fill faster than expected—raising the risk of disastrous flooding.
With climate change making the snowpack less reliable and redefining what “normal” means, the pressure on forecasters is intensifying in a rapidly growing region with a well-documented gap between water supply and demand. Even a perfect knowledge of the snowpack’s water content doesn’t guarantee accurate streamflow projections because factors such as soil moisture, groundwater levels and late-season weather cloud the picture.
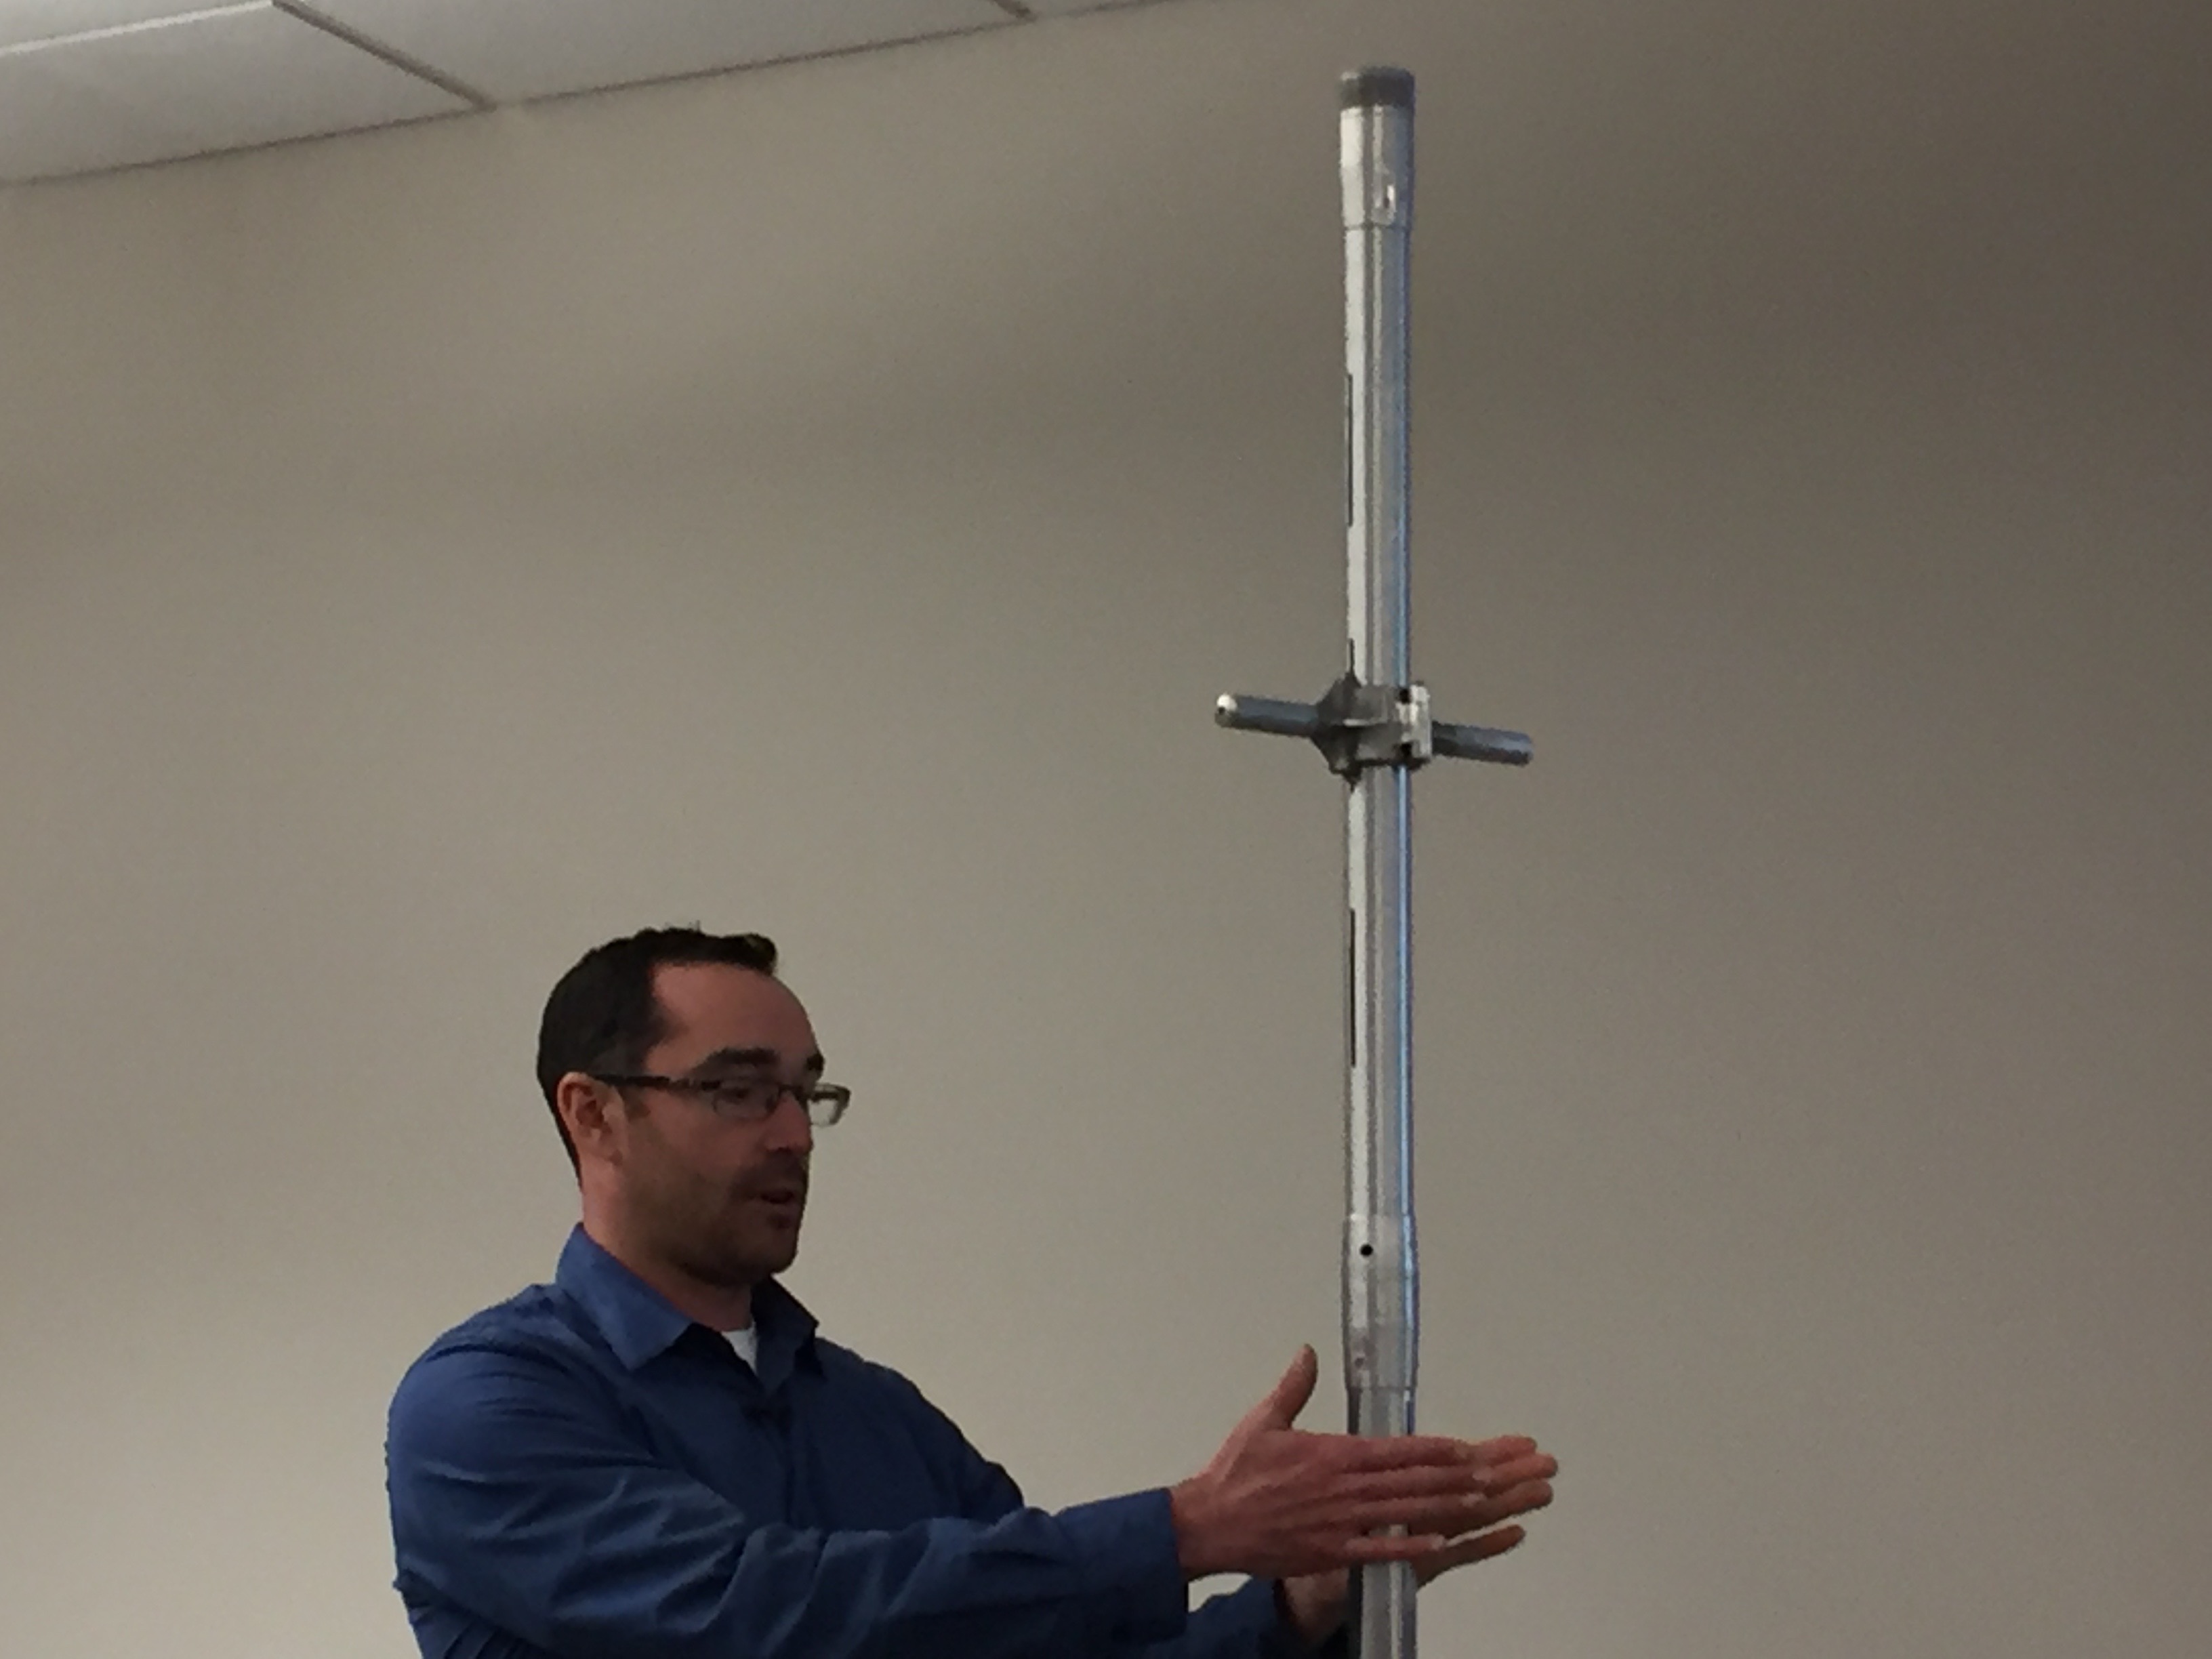
Karl Wetlaufer (NRCS), explaining the use of a Federal Snow Sampler, SnowEx, February 17, 2017.
Scientists and water managers, aware of the high stakes, began formally measuring the snowpack to make water forecasts more than a century ago. They selected key locations in the high country, plunged hollow metal tubes into the snow and weighed the extracted cores to calculate the water content—a technique still used extensively today.
During the late 20th century, officials installed hundreds of automated stations across the West’s watersheds as part of the SNOTEL network. These sites use “snow pillows” to measure the weight of the overlying snow and estimate its water content. Forecasters then correlate these long-term snow records with historical streamflows to predict a basin’s water supply.
In the 21st century, airborne snow surveys have expanded rapidly. Aircraft equipped with lidar—a laser-based technology—precisely map the snow depth across entire watersheds while an onboard spectrometer scans the snowpack’s reflectivity. Snow depth is determined by subtracting lidar readings taken when snow is absent from those taken when snow is present. Scientists combine those measurements with estimates and observations of snow density to calculate the water content, known as the snow water equivalent.
Satellites also provide valuable data on the snowpack, especially its extent on the ground, but reliably measuring snow water equivalent from space remains elusive. Clouds and forests can also obscure or complicate a satellite’s view.
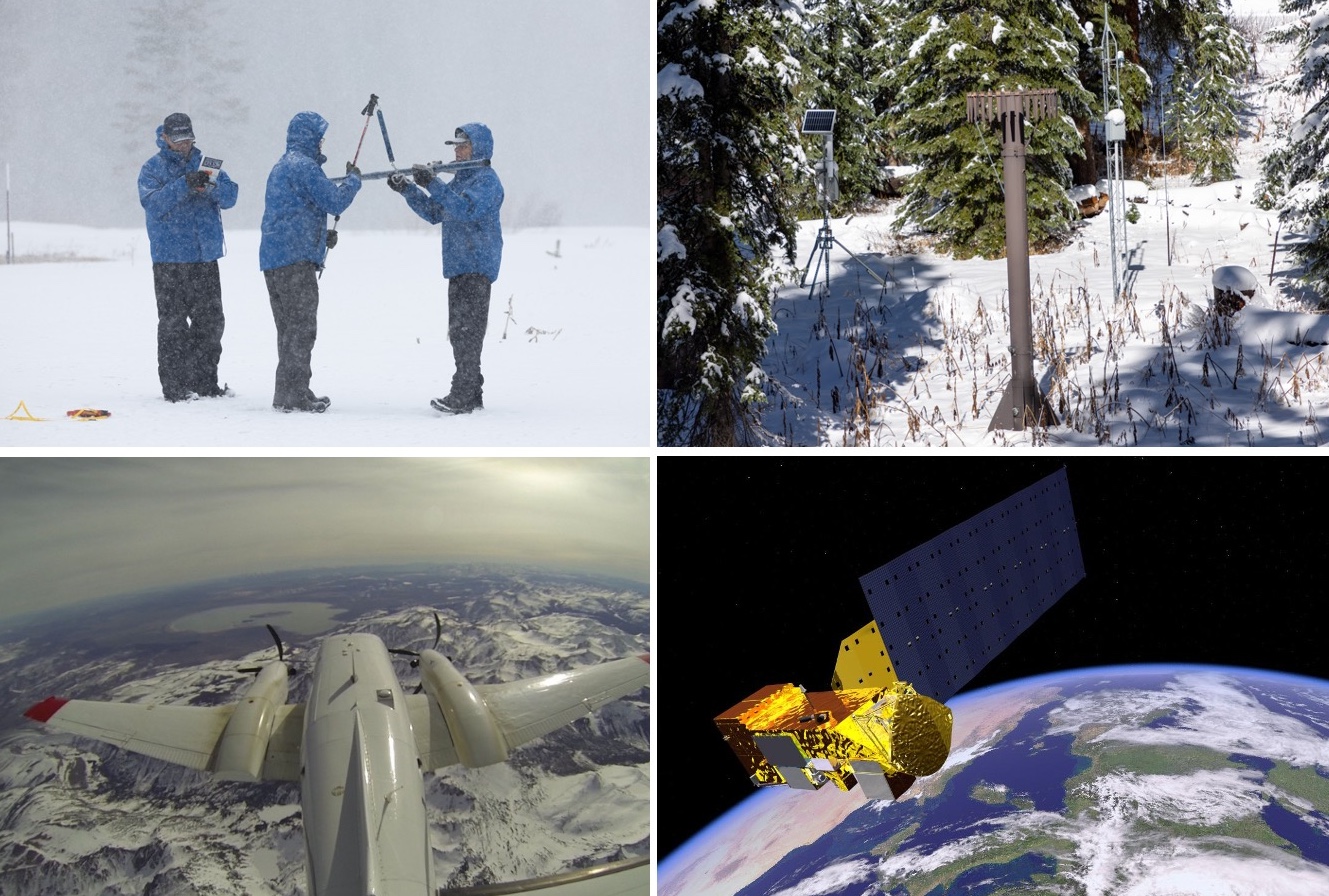
Four ways scientists monitor the snowpack. Clockwise from upper left: a manual snow-course survey (California Department of Water Resources); an automated SNOTEL station (Mitch Tobin/The Water Desk); an illustration of a satellite carrying the MODIS instrument (NASA); and airborne mapping (NASA).
While technologies that estimate an entire watershed’s snowpack are on the rise, the recent hotspots study argues that water forecasters could gain crucial insights by targeting future monitoring at a limited set of locations.
The authors say these 62-acre hotspots not only are strong predictors of how much water will run off in the spring and summer, but also could be more cost-effective than mapping the snowpack across a whole watershed using aircraft. That approach has become more common due to the work of Airborne Snow Observatories, Inc. (ASO), a company that spun out of research at NASA’s Jet Propulsion Laboratory.
“The greatest gains in water supply prediction come from leveraging existing stations and expanding snow measurements to the right places, rather than everywhere,” the authors write in Communications Earth & Environment.
But in the tight-knit world of Western snow science, the paper has sparked pushback from supporters of airborne snow monitoring.
Jeff Deems, a co-founder of ASO, said the paper is a “statistical curiosity” and criticized both its methodology and the conclusions it draws about snowpack monitoring.
“Our datasets have become the gold standard, the benchmark against which others are evaluated,” Deems said.
The Colorado Airborne Snow Measurement (CASM) program produced a strongly worded critique of the study, which used a proxy for the ASO data, rather than actual measurements from aircraft.
“Although this paper is published in a well-known journal, it makes unsupported, misleading and editorialized claims about the cost, value, and performance of airborne lidar for streamflow forecasting,” said the rebuttal from CASM, a group of stakeholders whose planning team includes ASO, water providers, the Colorado Water Conservation Board (CWCB) and other organizations. “The authors make a series of critical logic and analysis errors which when combined with their over-broad conclusions result in a very misleading paper.”
But study co-author Cam Wobus wrote in an email that the paper “might have struck a nerve” because “it showed that wall to wall measurement of snow may not be needed to create more accurate water supply forecasts, which ASO could have perceived as a threat to their business model.”
Despite the sharp differences among snow researchers, experts agree there’s no silver bullet for monitoring the snowpack or predicting streamflows. As warming temperatures and evolving storm patterns continue to transform the snowpack, both old-school methods and newer technologies will be needed to better manage the region’s scarce water resources.
“Snowpack estimation and streamflow forecasting is a vast and unsolved field of research,” the CWCB wrote in response to questions from The Water Desk.
Although CWCB’s logo was included at the bottom of CASM’s rebuttal, the agency said in an email that the document “should not be misconstrued as an official position statement” and that “CWCB has acted as a funding and coordination partner” to CASM.
An airborne survey created this map of snow depth for Colorado’s Maroon Bells on April 9, 2024. Source: ASO.
Searching for snowpack hotspots
The hotspots study set out to test an intuitive idea: in high-elevation watersheds, the snowpack in certain locations can be especially useful for predicting streamflow.
“There are places within drainage basins that, if you train your water-supply forecast on the snow record in those locations, you’ll have a better forecast than if you use the basin average,” said co-author Eric Small, a professor of geological sciences at the University of Colorado Boulder.
“If you think about a drainage basin, there’s going to be places in that drainage basin where there’s not a lot of snow, or there’s not much connection between the snowmelt and the runoff,” Small said. “There’s going to be other places in the basin where there is a lot of snow and a lot of connectivity between the snowmelt and the runoff. So it should not be a surprise that there’s locations within a basin that are more predictive of this seasonal water supply.”
In general, locations with the deepest, most persistent snow are more likely to be hotspots.
“Anyone who’s seen a basin in Colorado and sees the south-facing slopes that are bare of snow and the north-facing slopes that have snow three feet deep in the springtime recognizes that once you take an average across all of that, the stuff on the south-facing slopes isn’t going to matter at all,” said Wobus, a principal at CK Blueshift, LLC, a consulting firm that works on water and climate issues.
“It’s silly to fly an entire basin if 30% of that basin doesn’t have any snow on it, so that’s an easy fix right there,” Wobus said.
While hotspots typically accumulate lots of snow, what’s happening beneath the snowpack is just as important. “The hotspots are locations where there’s both a lot of water, and when it melts, a large fraction of that water would get into the stream,” Small said.
Hotspots tend to have shallow or relatively stable groundwater storage and soil moisture levels that don’t vary year to year.
“The hotspots are places where there’s either enough snow or minimal enough variations in storage that the water is getting to the stream and the water is getting to the stream at the right timescale,” Small said.
Each basin may have numerous hotspots. “The hotspots weren’t unicorns,” Small said. “There were many possible hotspots. We had an objective measure to choose the official hotspot in the paper, but you could have chosen many other locations that were also predictive.”
Once a hotspot is identified, the authors outline several potential ways to tap its predictive power. One option is to add a new SNOTEL station at the site, although that may not be feasible because of the terrain or land protections. Another possibility is to use remote sensing from a plane or a drone. The authors write that one or two flight paths that observe the hotspot could gather data “at a substantially lower cost than more conventional wall-to-wall basin coverage.”
Even recreationists could help gather data from snowpack hotspots. “You could use citizen science to do it. You could send a bunch of backcountry skiers out to your location for fun, give them an app,” Small said. “They’re probably already going there. If you saw where people were skiing, they would probably have mapped out the hotspots already.”
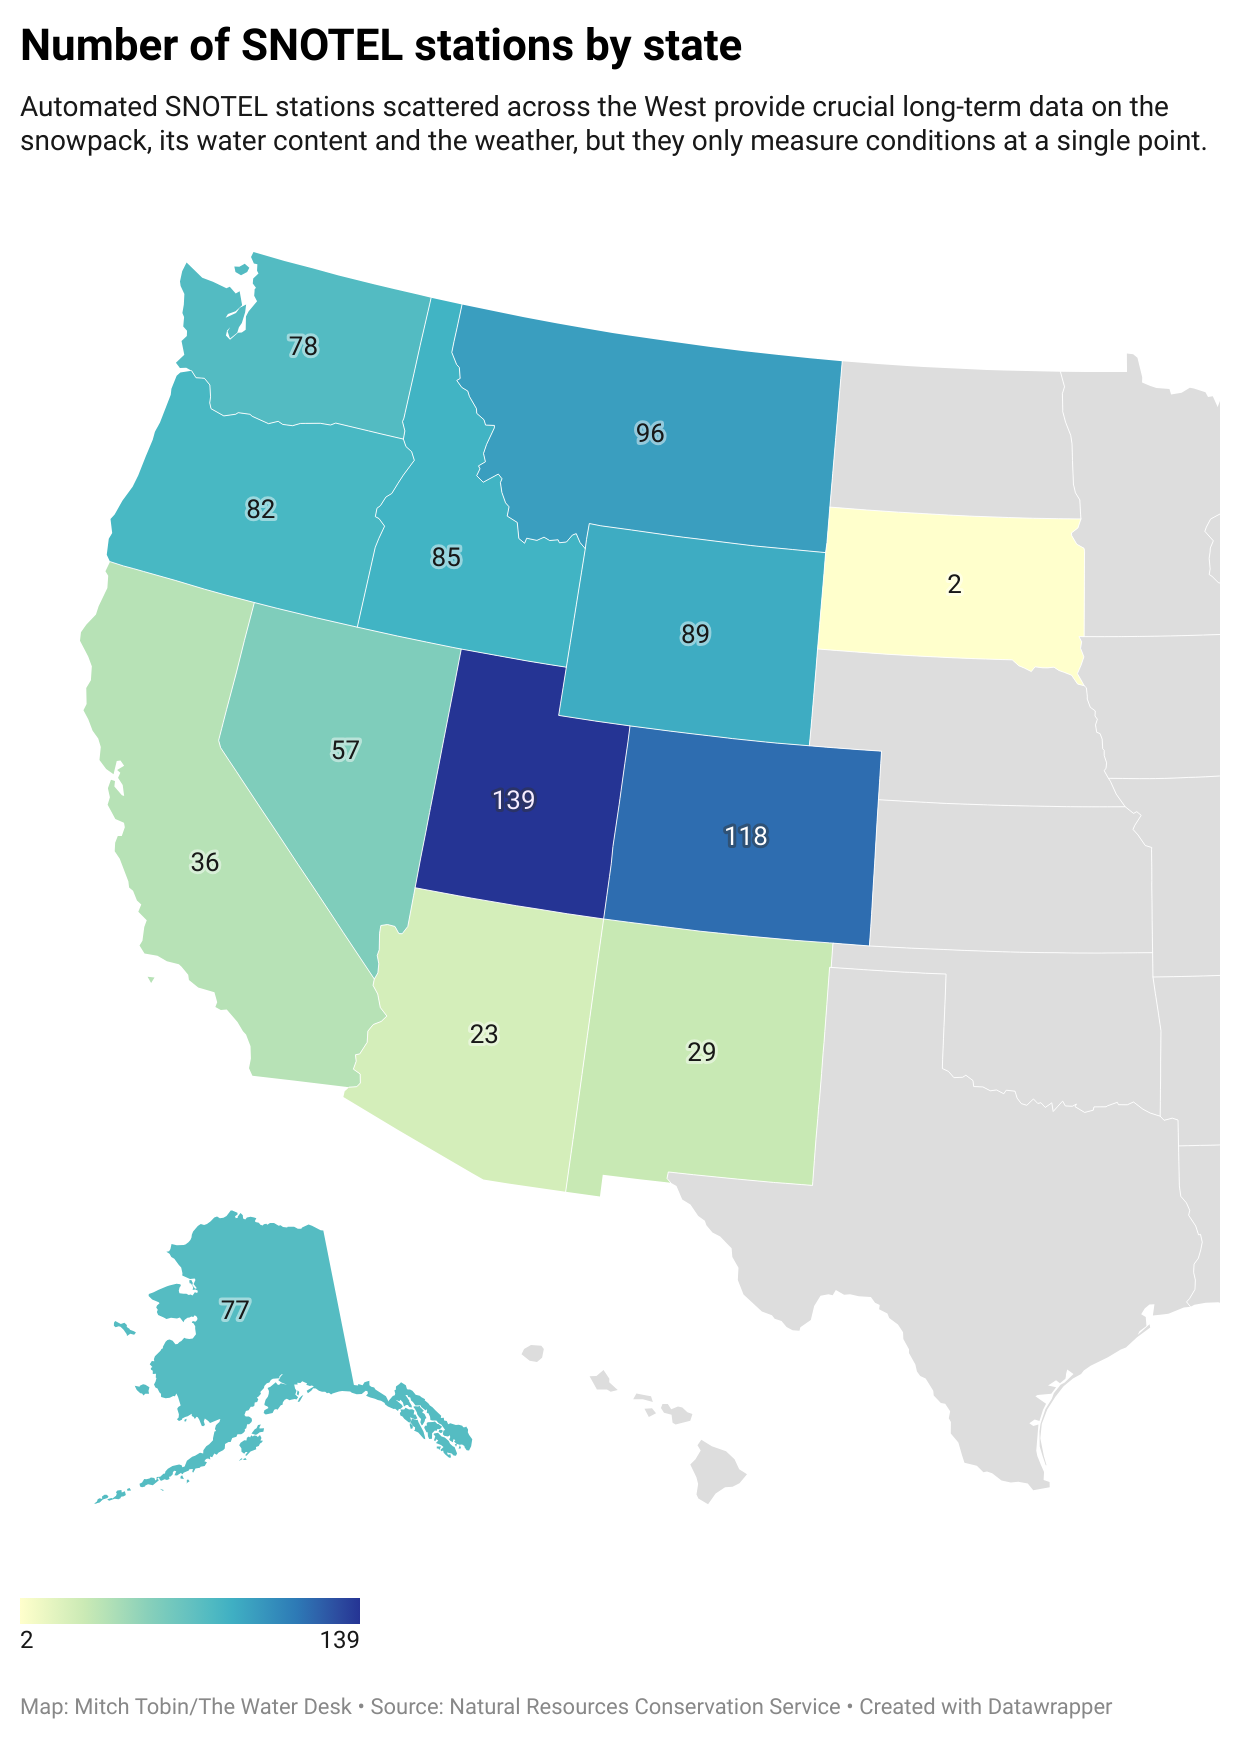
Map: Mitch Tobin/The Water Desk • Source: Natural Resources Conservation Service • Created with Datawrapper
A shortcut, or a statistical trap?
Critics of the hotspots paper agree that some parts of a watershed can carry more predictive weight for streamflows than others.
“It’s not a new concept, and it’s a very seductive one. It’s essentially the premise behind the SNOTEL network,” Deems said.
But to some scientists who dispute the study, hotspots can hide as much as they reveal—and potentially mislead water managers as the West’s climate evolves and as the hydrology of high-country landscapes is reshaped by disturbances, such as the increasing frequency of wildfires.
“Even if they did everything right—found these hotspots—the likelihood of them retaining the same statistical predictive power going forward is essentially nil,” Deems said.
The rebuttals to the paper have challenged both its analysis and the real-world implications the authors infer from their results.
Noah Molotch, a professor of geography at the University of Colorado Boulder and director of the Mountain Hydrology Group at the Institute of Arctic and Alpine Research, said “the study doesn’t accurately portray the direction that water managers have been moving for a couple of decades now.”
“My concern there is that it takes us further down the path of being blind to the spatial patterns that govern water supply and that can lead to surprises for water managers,” Molotch said.
Although the hotspots study has implications for airborne snowpack monitoring, the paper didn’t analyze data gathered by aircraft, which has been collected only in select watersheds and over a shorter time period than the authors examined.
Instead, one of the ways the researchers probed the snowpack in 390 basins in the West was to combine satellite data from 2001 to 2023 with historical weather data. The satellite images, collected by the MODIS instruments aboard two NASA spacecraft, show the fraction of each pixel covered by snow and the reflectivity of the snowpack, among other metrics. Each pixel is a square with 500-meter (1,640-foot) edges.
The authors argue that this type of data serves as a reasonable “proxy” for the basin-wide estimates that could be obtained from prospective satellite missions and current airborne monitoring. Small said five different datasets were examined, and all showed similar results.
But the CASM critique argues that the proxy dataset has “a demonstrated average error of 35% (ranging from 20-60%)” when compared to airborne lidar, and its much coarser resolution further limits its utility.
The paper’s authors “make the assertion that that dataset has been shown to be accurate and, in their language, therefore serves as a reliable proxy for airborne lidar,” Deems said. “That assertion is incorrect, and that undercuts the entire rest of the paper, sadly.”
Deems said the study used the date of snow disappearance to back-calculate how much snow was there while also “blending in an atmospheric model precipitation product, which is highly uncertain.”
By contrast, Deems said, ASO creates “a highly accurate map of snow depth throughout the watershed,” which is then paired with estimates of snow density informed by SNOTEL measurements and hand-dug snow pits. What emerges, he said, is a basin-scale estimate of snow water equivalent that’s within about 1% of the actual volume.
“That’s better than we can measure streamflow,” Deems said.
A video from Colorado’s Northern Water explains how the utility uses ASO data.
Clashes over the merits of datasets are grist for the academic mill, but critics raise a broader concern: the paper takes a retrospective look at snowpack-streamflow relationships in an age of extreme weather and shifting baselines.
Scientists have an awkward name for this pivotal issue: “stationarity.” In simple terms, it’s the assumption that the past is a reliable guide to the future. But just as mutual-fund disclaimers warn that past performance is no guarantee of future returns, climate change is making historical patterns less trustworthy.
Storm tracks are migrating. Warmer temperatures mean more winter rain and less snow. Rising evaporation rates are drying out soils. And both the timing and volume of runoff are in flux as the weather changes and high-elevation wildfires remake watersheds.
The hotspots strategy, according to the CASM rebuttal, “does not test whether those sites remain predictive under shifting climate conditions or extreme events” and “what looks like a hotspot in the historical record may fail under current or future conditions.”
What to do with hotspots?
On a practical level, the hotspots paper argues that snow researchers and water managers could mine these locations for essential data by installing additional SNOTEL stations or using remote sensing. But critics say several big hurdles stand in the way of implementation, many of which are acknowledged in the study.
First, a hotspot with 500-meter edges covers nearly 2.7 million square feet, but the snowpack may vary greatly within that footprint. Where in that area should a new SNOTEL monitoring station go? Cost is another concern. “Installing and maintaining a station is not cheap either—$100,000 easily between gear and personnel time and maintenance,” Deems said.
Second, terrain and land-use rules can make installation impractical or illegal. “In many cases, it’s going to be impossible to put a station there, either because it’s sloped and the snow pillows don’t work on slopes, or because it’s in the wilderness or in avalanche terrain or something like that,” Deems said. Drone flights—another potential monitoring tool—are also prohibited in federal wilderness and face their own logistical challenges.
Third, any new station only generates data going forward. It doesn’t provide the long historical record that water managers need to train their models and make streamflow predictions. “It’s not going to be useful until you probably get about 30 years of data,” Molotch said, “and then let’s think about how much the climate may have changed over those three decades.”
The components in a typical SNOTEL station. Source: Natural Resources Conservation Service.
At its core, the dispute over hotspots reflects a long-standing divide in hydrology. One camp relies on statistically based approaches, such as using a select number of “index” sites to measure the snowpack and predict streamflow based on historical records. Another paradigm favors physically based methods that employ the laws of physics to account for the coming and going of water molecules in a basin, such as using aircraft to map the snowpack.
“Historically, we’ve increasingly been moving toward physically based approaches in hydrology,” Molotch said. “At some point, we may have a complete passing of the baton toward physically based approaches. I don’t know if and when that will be in our future, but I think that that is the way that things are migrating over time.”
Small said that ASO data “will give you the total number of water molecules in a basin” if you accept their snow density model, but that’s only part of the story. To predict streamflow, forecasters must account for other factors, including how much water is lost to the atmosphere when it evaporates, transpires from plants or converts directly from ice to water vapor, a process known as sublimation. Soil moisture and groundwater levels also shape the hydrologic cycle.
“The total volume of water in the snowpack is not hugely predictive of streamflow compared to what you get from the hotspots, and that has to be the case,” Small said. “If you have any variations in the basin from evapotranspiration or soil moisture storage or groundwater storage—that has to be the outcome. And I think we probably should have said that in the first sentence of the paper.”
Using an “all of the above” approach
Denver Water describes the snowpack in the mountains west of the city as the utility’s biggest reservoir. To supply its 1.5 million customers, Denver Water uses a variety of techniques to track the snowpack, including manual measurements, automated SNOTEL stations, ASO flights above key watersheds and satellite data that is blended into reports that Molotch and colleagues generate at the University of Colorado Boulder.
“We take an all of the above approach,” said Taylor Winchell, climate change adaptation program lead at Denver Water. “We think that all of these systems really have their place and are all important in giving us the full picture of the snowpack that we’re hoping to gather to help us make confident decisions.”
Each type of snow monitoring has its benefits and limitations. “They each fill a gap that the other doesn’t,” Winchell said.
The SNOTEL system, for example, can provide hourly or daily readings of the snowpack and offers long historical records, but it only measures conditions at a single point. The stations also tend to sit in mid-elevation clearings that are easy to access, so they don’t necessarily reflect the diversity of the West’s terrain and overlying snowpack.
“We often don’t have measurements at those higher elevations, and it kind of leaves a blind spot in our understanding of the snowpack,” Winchell said.
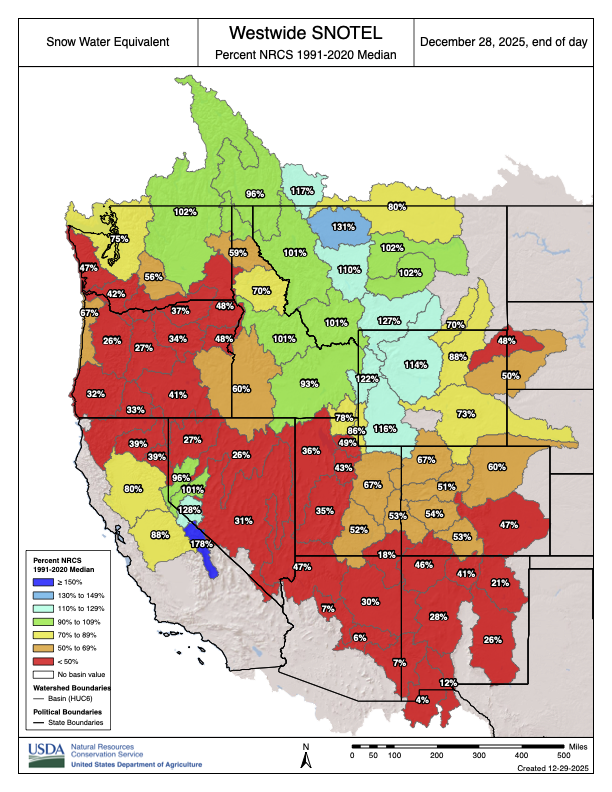
Westwide SNOTEL basin-filled map December 28, 2025.
Like many water providers in the West, Denver Water has been grappling with a growing mismatch between snowpack levels and the amount of water that eventually reaches streams and rivers in the spring and summer.
“We just don’t quite expect the same amount of streamflow production nowadays as we would’ve historically with similar levels of snowpack,” Winchell said, noting the influence of soil moisture levels, evaporation and sublimation. “We can’t go off the same assumptions that we might’ve had in the past, and so every year it creates this kind of new and intensified challenge to understand how the snowpack is going to translate into streamflow.”
Denver Water has used ASO data since 2019 and spent an average of about $200,000 per year on the airborne surveys. That first year, ASO surveyed the watershed around Dillon Reservoir—a linchpin in the utility’s supply that collects runoff west of the Continental Divide so that it can be pumped through a 23-mile tunnel bored beneath the Rocky Mountains and reach the east side of the Divide, where most of Colorado’s population lives.
“With those flights, we saw kind of immediately the high value of this information for our decision-making processes,” Winchell said. ASO found the snowpack was bigger than what Denver Water expected, Winchell said, so the utility “immediately increased outflows from Dillon Reservoir so that we’d be able to capture that snowpack without flooding downstream of the reservoir.”
ASO’s high-resolution data is valuable for Denver Water because it “fills in the gaps between those station measurements,” Winchell said.
In the large watersheds that supply the utility, “you can have storms and snow patterns that are quite different from one side of the watershed to the other, and you might have different diversion systems in each part of that watershed,” Winchell said. “You might have had a forest fire in one part of the watershed that impacts the snowmelt within that sub-watershed. So really being able to have that detailed picture of the full watershed, we do find value in that.”
But the cost of airborne surveys remains a critical issue.
“It’s still been a struggle year over year to get the funding needed even to fly what we see as the baseline number of useful flights,” Winchell said. “There’s still a lot of room for both adding additional flights in watersheds that are already being flown, as well as conducting ASO flights in watersheds throughout the state that don’t currently have ASO flights.”
Costs versus benefits
In Colorado, CASM was formed in part to secure additional funding to expand ASO flights above the state. CASM’s annual budget in 2025 was $4.5 million, with state funding accounting for 52% and the rest from federal, local and other sources.
The U.S. House of Representatives recently passed bipartisan legislation that would reauthorize and update the federal Snow Water Supply Forecasting Program “to incorporate modern technologies, including LiDAR and satellite imagery, to improve the accuracy of snowpack and water-supply predictions,” according to sponsor Jeff Hurd, R-Colo.
Backers of airborne surveys acknowledge that flights aren’t cheap—two flights over a basin can cost a couple of hundred thousand dollars per year—but they say the data can generate far greater benefits. A more precise read on the snowpack can prevent flooding and allow water managers to devote excess supplies to groundwater recharge. Conversely, advance warning of shortages can help avoid disruptions for both agricultural and urban water users.
“The value of these data can be off the charts,” Deems said, with some case studies from California showing a return on investment between 50 and 200 to one.
In the headwaters of Northern California’s Feather River, which supplies the California State Water Project, Deems said ASO’s data improved water management. In 2021, the year before ASO’s flights began, water managers “thought they had a decent snowpack,” Deems said, but they had to dramatically scale back allocations, eventually to zero, “because the water just didn’t show up,” causing significant impacts to farmers and other water users.
“The following year, we started flying in the Feather River,” Deems said. “Our February flight showed that they had half the water they thought they had, so it looked like essentially a repeat of the prior year, except this time they knew about it in February, rather than finding out about it when the water didn’t show up at the stream gauge in July.”
Dillon Reservoir supplies water to Denver and releases water into the Blue River which feeds into the Colorado River.
The future of snowpack monitoring
Looking ahead, the stakes are only growing for snowpack monitoring and streamflow forecasting as the climate warms and the West continues to add new water users.
Despite their varying views, snow experts agree that a diversity of approaches will be needed in the foreseeable future. The hotspots study authors see value in the ASO flights, and backers of airborne surveys would like to see more SNOTEL stations.
“We are first in line to advocate for more observations, especially if they can be in environments that are different than the current set of observations covers,” Deems said.
The question, Wobus said, is “how do we use combinations of advanced monitoring technologies like lidar and satellite observations and things like that in a framework that will help you improve water supply forecasts without having to measure everything?”
“There’s a lot of room to improve the economics of snow monitoring,” Wobus said. “If we’re talking about the difference between flying every basin once a year and getting total coverage at a cost of, let’s say $10 million a year for the state of Colorado, versus adding a few more SNOTEL stations in a few places where you really need it—there’s a lot of real estate in between those two things.”
Left to right, Jack Hannaford, Robert Miller, Chief of the Snow Survey Office for the California Department of Water Resources and helicopter pilot Harry Rodgers conduct the monthly snow survey near Loon Lake reservoir in the Eldorado National Forest in El Dorado County. A helicopter was used to access the remote location in the Sierra Nevada Mountains. Photo taken March 9, 1960. Vince R. Arrant / California Department of Water Resources
When ASO maps the snowpack in an entire basin, its aircraft flies back and forth in a pattern often likened to mowing a lawn. Small and Wobus said that one way to save money would be to do more limited flights and use machine learning—a type of artificial intelligence—to extrapolate the results.
“If you fly one strip and combine that with a machine-learning model, you can get like 98% of the way there, and you can save a whole boatload of money,” Wobus said. “You could just fly a straight line across the state of Colorado and then turn around and fly back and get almost as much information as you’re getting by flying like a lawnmower back and forth across the basin.”
But some backers of airborne mapping are skeptical.
“That would be bringing a lack of confidence back into the system, and that’s a difficult thing to ask a water manager to accept, especially after we’ve shown what’s possible,” Deems said.
Drones have also become part of snow hydrologists’ toolbox. While the hotspots paper argues that using lidar technology mounted on drones would be less costly than flying large aircraft, that approach “does not reflect the logistical and financial realities of operating such a program in Colorado’s mountain environments,” according to CWCB.
“Drone-based lidar systems require extensive permitting, frequent flights due to limited range and battery life, and highly trained operators to meet accuracy standards comparable to crewed aircraft,” CWCB wrote. “No program currently exists with the resources, planning, or data management structure to deploy drone surveys at the basin scale needed for operational water forecasting.”
For many snow hydrologists, the holy grail would be to launch a dedicated satellite that could look down from space and estimate the water content of the snowpack around the planet using, for example, microwave sensors. But that’s literally a heavy lift.
“There’s lots in the works,” Deems said. “But the global solution is pretty elusive, and folks have been trying to do this for decades.”
The technology exists today to measure snow water equivalent with a satellite, “but not everywhere and not all the time,” Molotch said. One major obstacle is that satellite monitoring may not work when the snowpack is wet, which is especially vexing in the warmer, maritime snowpacks near the West Coast.
“Snowpack conditions in the Sierra Nevada of California can be wet at any time of year between storms when the sun’s out and it starts to warm up,” Molotch said. “As the climate warms, we would expect that snow wetness will be increasingly problematic for microwave remote-sensing techniques. But I think on the positive side, if we’re able to make snow water equivalent measurements in some locations, that helps us provide information for models that can fill in the gaps.”
In July, NASA and India’s space agency launched NISAR, a new radar satellite built to track how Earth’s surface is evolving. While not dedicated to monitoring the snowpack, the mission will measure changes in snow, glaciers, sea ice, ice sheets and permafrost. Operating day or night, NISAR’s signals can penetrate clouds, and the satellite will observe nearly the entire Earth’s surface twice every 12 days.
Illustration of the new NISAR satellite. Spacecraft hold promise for measuring the West’s snowpack but face challenges of their own. Source: NASA.
The NISAR mission “introduces a promising avenue for cost-effective, large-scale snow depth and snow water equivalent” estimates, according to a January study in Frontiers in Remote Sensing. A 2024 paper in Geophysical Research Letters concluded that NISAR offers a “promising path toward global snowpack monitoring.” While errors increase in forests with a denser canopy, the 2024 study said the satellite “may be feasible for snowpack monitoring in sparse to moderate forest cover.”
What research and data would deepen understanding of the snowpack in the future?
“Where to begin?” Winchell said with a laugh.
In addition to having more manual measurements, more SNOTEL stations, more ASO flights and even a citizen-science effort, Winchell said better knowledge of snowpack temperatures would be helpful to Denver Water because that “provides a really strong indication of when the snowpack is ready to melt.” Additional soil moisture data could also improve the utility’s forecasts of how the snowpack translates into streamflows.
“The field of snowpack research is just a crucial field with really lots of exciting work ahead, especially as these new, really high-value, high-accuracy datasets are coming into play,” Winchell said. “I think decades into the future we’ll wonder how people really went about managing the snowpack water supplies without this information.”
Aerial view of the Rocky Mountain snowpack over central Colorado on Dec. 3, 2024. Photo by Mitch Tobin/The Water Desk.
This story was produced and distributed by The Water Desk at the University of Colorado Boulder’s Center for Environmental Journalism.
Editor’s note: Two of the co-authors of the hotspots paper and one of the critics of the study are affiliated with the University of Colorado Boulder. The Water Desk is also based at the University of Colorado Boulder but operates as an editorially independent journalism initiativeand is solely responsible for its content.