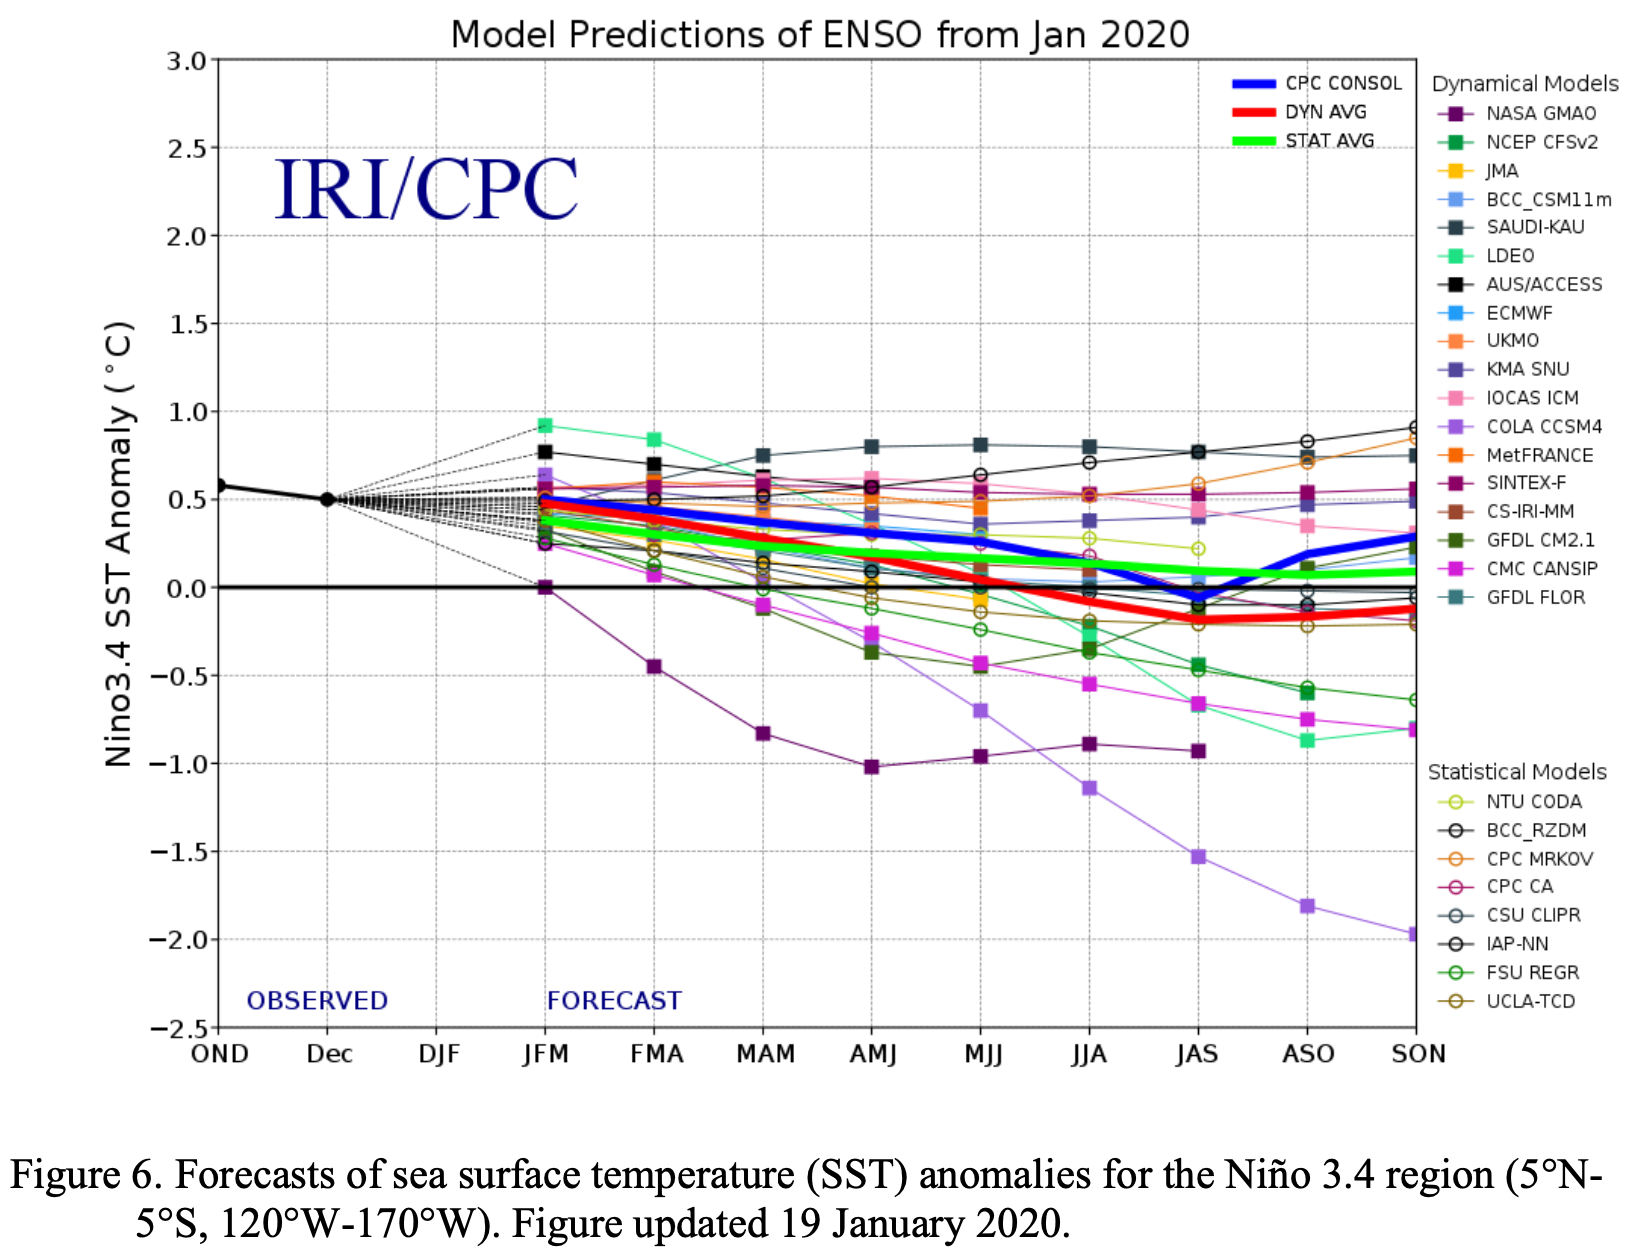
Click here to read the discussion. Here’s an excerpt:
ENSO Alert System Status: Not Active
Synopsis: ENSO-neutral is favored through Northern Hemisphere spring 2020 (~60% chance), continuing through summer 2020 (~50% chance).
During January 2020, near- to above-average sea surface temperatures (SSTs) were evident across most of the equatorial Pacific Ocean. The latest weekly Niño-3.4 and Niño-3 indices were near average (+0.2°C to 0.0°C), while the Niño-4 and Niño-1+2 indices were warmer at +1.2°C and +0.8°C, respectively. After decreasing in early to mid January, positive equatorial subsurface temperature anomalies (averaged across 180°-100°W) slightly increased during the latter part of the month. Temperatures remained above average across most of the subsurface ocean, reaching ~150m depth in the central Pacific. During the month, westerly wind anomalies persisted over the western equatorial Pacific Ocean, while upper-level winds were mostly westerly over the east-central and eastern equatorial Pacific. Tropical convection remained suppressed over Indonesia and was enhanced around the Date Line. The traditional and equatorial Southern Oscillation indices were near zero. Overall, the combined oceanic and atmospheric system remained consistent with ENSO-neutral.
The majority of models in the IRI/CPC plume continue to mostly favor ENSO-neutral (Niño-3.4 index between -0.5°C and +0.5°C) through the Northern Hemisphere summer. The forecaster consensus predicts the Niño-3.4 index will be at or slightly above +0.5°C for the January – March 2020 season, but then slightly favors ENSO-neutral for the February – April 2020 season. While it is expected that oceanic temperatures will remain elevated in the near term, particularly in the western and central equatorial Pacific Ocean, most models predict a gradual decrease in Niño-3.4 SST anomalies into the spring and summer. In summary, ENSO-neutral is favored through Northern Hemisphere spring 2020 (~60% chance), continuing through summer 2020 (~50% chance; click CPC/IRI consensus forecast for the chance of each outcome for each 3-month period).
Public lands lovers have been up in arms since the Trump administration issued the final management plans for what’s left of Bears Ears National Monument. And the outrage is sowing confusion, along with headlines that imply that the plans “invite polluters into” the national monument, or that the “US plans to open millions of acres of public lands to cattle, drilling.”
That’s not quite right.
Every day, Trump and his plutocrats and sycophants give us plenty to be disgusted about. The new Bears Ears management plan, however, isn’t all that worthy of outrage. What is outrageous is this: The removal of lands from national monument status in the first place, along with the evisceration of dozens of regulations that were put in place to protect those public lands.
President Barack Obama established the Bears Ears National Monument on 1.35 million acres of federal land in 2016 using the Antiquities Act. The designation immediately halted all new oil and gas leasing and the staking of new mining claims (existing mineral rights remained in place, however, as did the ability to file for new grazing rights). Obama left office before the management planning process began.
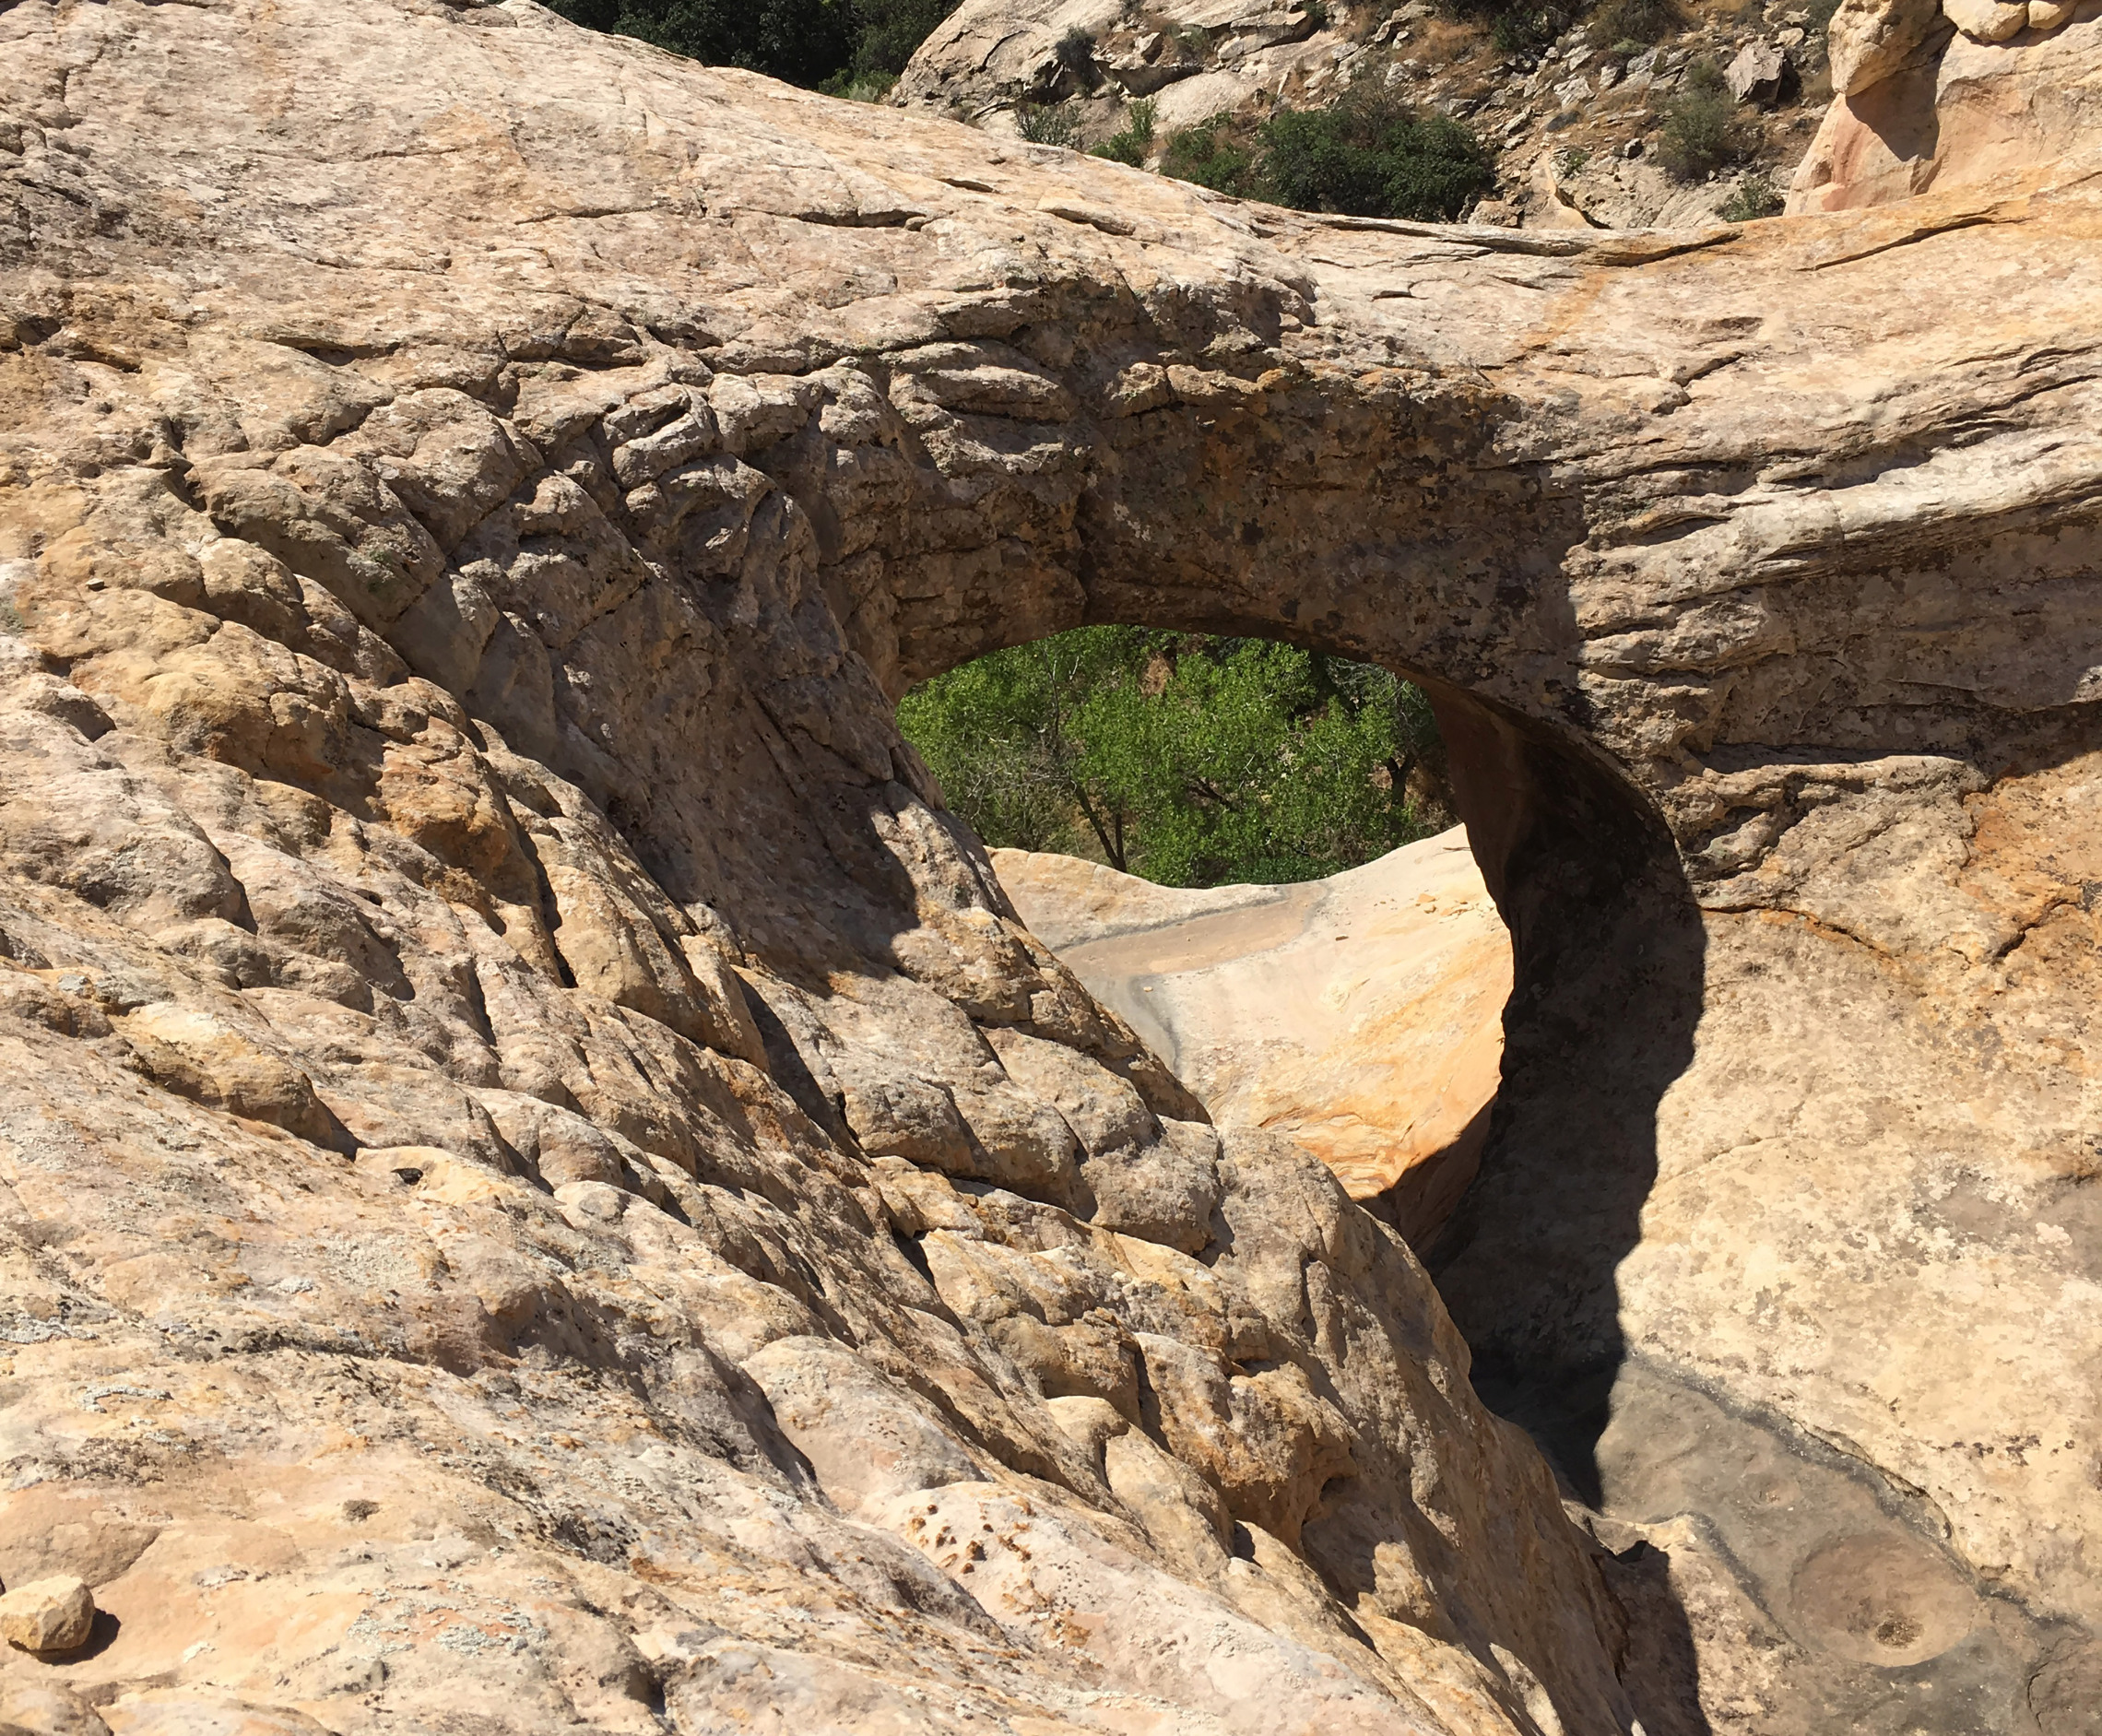
From Bears Ears National Monument. Photo credit: Jonathan Thompson
A year later, in December 2017, Trump signed the proclamation that shrunk the original monument by about 85%. That re-opened 1.1 million acres to oil and gas leasing and mining claims. The 201,876 acres that remained of the monument remain off-limits to drilling and mining.
The shrinkage immediately faced legal challenges from the tribal nations that proposed the monument in the first place, as well as from environmental groups. Unlike an executive order, the Antiquities Act, passed by Congress in 1906, is a one-way law: A president can use it to protect antiquities, but not to take those protections away. In 1976, Congress passed the Federal Land Management Policy Act, which further strengthened the one-way nature of the Act. Prior to FLPMA, presidents did modify the boundaries of monuments established by their predecessors. However, the actions were never tested in the courts.
Despite the fact that the status of the monument and its boundaries were in legal limbo, the Bureau of Land Management in 2018 started the process of creating a management plan for what remained of the diminished monument. The move was not only premature, but it was also like tossing salt in the gaping wound left by the original shrinkage. And, assuming the courts reverse the shrinkage, it will likely turn out to be a big waste of effort and resources.
In early February, the process was completed when the BLM handed down its approved management plans for the Indian Creek and Shash Jáa units, which make up the post-shrinkage Bears Ears National Monument. The plans do not apply to or affect the 1.1 million acres that were removed from the original monument.
As is typically the case in the crafting of such plans, the BLM put forward several alternatives, from “no action,” which mostly would have kept the status quo on monument lands, to the “environmentally preferred alternative,” which was more restrictive and prescriptive.
In the end, the BLM chose a mash-up of all the alternatives, leaning heavily in the “no action” direction, which the agency says has “fewer land and resource use restrictions” and allows for “review of management actions on a case-by-case basis at the site-specific implementation level.” In other words, while there are slightly more protections than there were prior to monument designation, the plans generally retain the status quo.
Highlights/lowlights include:
Off-highway vehicles will continue to be allowed on designated routes — which are plentiful — but there will be no OHV free-for-all areas. Mountain biking will be limited to designated OHV routes, which are plentiful. OHVs will continue to be allowed in Arch Canyon.
Heavily visited, fragile cultural sites will remain open to the public, but visitor numbers will continue to be limited at Moon House.
Target shooting will be prohibited near rock art sites, but not in other parts of the monument.
The plan puts stricter restrictions on collection of petrified wood and fossils, and puts a few places off-limits to camping and OHV use.
Arch, Mule, Fish, and Owl Canyons, as well as nine tributaries to Butler Wash, will be closed to grazing, but the plan also “facilitates economic opportunities in the local communities supported by tourism, which includes guided tours and dispersed recreation, as well as economic opportunities provided by grazing.” In other words, grazing will continue on most of what remains of the monument.
The plans “maintain or increase existing level of vegetation treatments” for fire management, which could be a justification to do more chaining (which is where a swath of land is cleared of vegetation by dragging a huge chain behind bulldozers, often to convert forests into grazing land).
More specifics will be ironed out in the cultural resource, recreation area/business, and travel management plans, to be formulated over the next several years.
But those particulars are less relevant than the fact that they only apply to a mere fraction of the lands that were protected under the Obama monument designation. The 1.1 million acres taken out of the original monument contain some of the most sensitive, spectacular, and culturally rich areas.
Those who opposed monument designation in the first place argue that the protections afforded by a monument are unnecessary since several layers of regulations already limit or mitigate development on public lands. Yet the Trump administration has gone on a regulatory rollback frenzy, stripping away the rules that were put in place to protect the nation’s land, water, air, workers, and human health. Those 1.1 million acres are all the more vulnerable as a result.
These new management plans don’t change that in any way. They do, however, provide a look at what we can expect if the courts overturn Trump’s monument shrinkage and Trump is re-elected: Most likely, a similar, minimally protective plan will be extended to the restored monument, rendering it little more than a monument in name, only, while attracting more visitors and more damage.
If a Democrat is elected in November, however, they could use the Antiquities Act as it was intended, and re-designate the monument within its original boundaries. Even better, they could designate a bigger monument, one that follows the boundaries originally proposed by the inter-tribal coalition. Then they could toss out the inadequate management plans and start from scratch.
A trail of wolf tracks observed by Colorado Parks and Wildlife officers in Northwest Colorado on January 19, 2020. Photo credit: Colorado Parks & Wildlife
Here’s the release from Colorado Parks & Wildlife:
Colorado Parks and Wildlife (CPW) biologists have received notification back from a genetics lab confirming that four scat samples collected near a scavenged elk carcass in Moffat County in early January came from wolves. This is the first official documentation of a pack of wolves in the state since the 1940s.
Of the four samples, DNA results indicate three are female and one is male. The testing was also able to determine that all the wolves were related, likely as full siblings.
“The DNA doesn’t tell us the age,” said CPW Species Conservation Program Manager Eric Odell. “We don’t know where or when they were born. We can’t say. But that there are closely related wolves is a pretty significant finding.”
Odell also noted that “although previous reports had mentioned sightings of up to six wolves, this doesn’t do anything to alter that estimate. Just because we only collected four scat samples doesn’t mean there were only four animals.”
CPW is still waiting to receive results back from scat samples collected at a potential wolf sighting in Moffat County on January 19.
CPW would like to remind the public that wolves are a federally endangered species and fall under the jurisdiction of the U.S. Fish and Wildlife Service. According to the US Fish and Wildlife Service, killing a wolf can result in federal charges, including a $100,000 fine and a year in prison, per offense.
The public is urged to contact CPW immediately if they see or hear wolves or find evidence of any wolf activity. The Wolf Sighting Form can be found on the CPW website.
Click on a thumbnail graphic to view a gallery of drought data from the US Drought Monitor.
US Drought Monitor February 11, 2020.
West Drought Monitor February 11, 2020.
Colorado Drought Monitor February 11, 2020.
Click here to go to the US Drought Monitor website. Here’s an excerpt:
This Week’s Drought Summary
Heavy precipitation affected large parts of the Nation last week, with heavy snow in the central Rockies bringing some relief to the dry areas there. The broadest area of heavy precipitation stretched from the Middle Atlantic States southwestward into the Lower Mississippi Valley and the Southeast. At least 2 inches fell from the Ohio River to near the Gulf and southern Atlantic Coasts, with 7 to 10 inches measured across the much of the interior Southeast. On the other side of the 48 states, heavy precipitation covered parts of the Northwest. Near the coast in Washington and northern Oregon, most locations recorded at least 4 inches of precipitation, with isolated amounts to 10 inches in higher elevations. Just to the east, along the Cascade Range from central Oregon northward, a broad swath received at least 5 inches of precipitation, and most of a strip through central Washington reported 10 to locally 15 inches. Well inland, in the central and northern Rockies, precipitation was largely elevation-dependent,. The more elevated regions observed 2 to 5 inches, with lesser amounts in adjacent areas of lower elevation. Heavier amounts more broadly covered central Idaho and adjacent areas in Washington and Oregon, with totals of 4 to locally 8 inches common. It was another week of above-normal temperatures in the East and part of the interior Northwest, while subnormal readings were recorded in the central Rockies where the heavy snowfall dominated the week. Temperatures were 10 to 15 degrees F warmer than normal in the east-central States and part of the interior Southeast, and most sites east of the Mississippi River were at least 4 degrees F above normal. Many locations across the Country averaged 2 to as much as 5 degrees F above normal since mid-November 2019, especially east of the Mississippi River and the interior Rockies and Far West…
Most of the region saw little to no precipitation this past week, leaving the Drought Monitor unchanged in south-central Kansas, and prompting some limited expansion of the D0 to D2 conditions in western Kansas and eastern Colorado. Farther west, most lowland areas received only light precipitation, but heavy snows blanketed the higher elevations from central Colorado into western Wyoming. Snowpack is now near to above normal for this time of year in western Wyoming, and considerably above normal from central Wyoming southward through most of the higher elevations in central Colorado. This prompted removal of the D0 area that had covered southwestern Wyoming. More limited improvement was noted in the D0 and D1 areas in central and western Colorado, where dryness is more entrenched…
Moderate to heavy precipitation in the Northwest and parts of the northern Intermountain West boosted snowpack enough improve drought designations in parts of the region. In Idaho, D0 was retracted to cover only the central part of the state, with some D1 remaining across the interior where snowpack remained unfavorably low (10th to 20th percentile historically for this time of year). A bit of abnormal dryness was also pulled out south-central New Mexico and northwestern Utah, but an unremarkable week kept dry conditions essentially unchanged across the rest of the Four Corners States outside Colorado. Across Nevada and California, however, dryness and drought intensification prevailed. On the 60-day time scale, markedly low precipitation totals (among the driest 5 percent of historical occurrences) covered most of a swath across central sections of California and Nevada, and 30-day amounts were less remarkable but still significantly below normal across most of the 2 states, outside the far northern and southern tiers. Since mid-December, less than half or normal precipitation has fallen from central and southern Nevada westward across most of California, with less than 25 percent of normal observed in the southern Sierra Nevada and adjacent central valleys. Central and southern sections of coastal California accumulated 3 to 8 inches less precipitation than normal during this period while deficits of 5 to 12 inches piled up in the Sierra Nevada. Precipitation summed over the past 6 months is notably below normal over most of both states. In particular, central and southern parts of the Sierra Nevada accumulated a deficit of 9 to locally near 20 inches of precipitation (about half of normal), and snowpack is less than 60 percent of normal for the date in the central and southern Sierra Nevada. The confluence of all these factors led to the introduction of moderate drought in the central and southern Sierra Nevada, and the adjacent central valleys. The state had been drought free since the first few days of December. Farther east, D0 was broadly expanded to cover part of northeastern California and a broad swath across much of interior Nevada. The last 6 months brought less than half of normal precipitation to this region, but with lower normals than farther west, accumulated deficits were less dramatic (generally 3 to locally 6 inches)…
Abundant rainfall eliminated D0 in relatively small parts of southeastern Louisiana and southernmost Mississippi, but most areas of dryness along the central Gulf Coast missed the bulk of the precipitation, keeping most of the D0 area unchanged. Farther west, moderate to heavy precipitation (1 to locally 4 inches) eliminated almost all dryness across western Louisiana and southwestern Arkansas, and induced improvement across the D0 to D2 conditions in eastern Texas as well. In addition, moderate rains in north-central Texas as well as the Red River Valley removed D0 from those regions, but left moderate drought largely intact across southwestern Oklahoma. But farther south, most areas of dryness and drought across central and southern Texas received little if any precipitation, prompting areas of drought intensification and expansion. Severe drought now covers large portions of central and southwestern Texas, and the D3 along parts of the Rio Grande Valley expanded into neighboring counties. Over the last 90 days, precipitation deficits reached 5 to 7 inches across interior eastern Texas, and less than 25 percent of normal has fallen around the areas of extreme drought in southwestern Texas…
Looking Ahead
During the next 5 days (February 13 to 17), the pattern is expected to be similar to last week, but with less extreme precipitation amounts. Still, over an inch is expected in a swath from southeast Louisiana to the upper Ohio River Valley, with a stripe of 1.5 to 2.5 inches expected from east-central Mississippi through northwest Alabama, central Tennessee, and southeast Kentucky. This, however, will be enough to exacerbate and already-soggy situation there. To the west, precipitation should again be orographically dependent. The higher elevations from central Colorado northwestward through the northern Intermountain West are expecting 1 to locally near 3 inches of precipitation, with the higher amounts most prevalent in the lower Idaho Panhandle. Farther west, moderate to heavy precipitation is expected along both the Pacific Coast and Cascade Mountains from central Oregon northward. Between 1.5 and 4.0 inches will douse many areas along the coast, and a strip through the middle of the Cascades can expect 2 to 5 inches. Meanwhile, nearly all areas of dryness and drought from the southern half of the Plains to the Pacific Coast will see less than 0.2 inch, with most sites recording little or none. Areas from the northern Plains and western Great Lakes southward into the middle Mississippi Valley should average colder than normal during this period, and subnormal daytime highs are expected along most of the northern tier of states. Across most of the western, southern, and eastern parts of the country, daytime highs should average near normal but nighttime lows are expected to remain above normal.
In the extended range forecast for the ensuing 5 days (February 17 to 21), odds favor surplus precipitation across the southern half of the Plains and from the Mississippi Valley eastward to the Atlantic Coast. Florida is an exception, with slightly enhanced chances for subnormal precipitation noted on northern and central parts of the Panhandle. Wetter than normal weather is also favored in much of the Pacific Northwest and Idaho, but enhanced chances for subnormal precipitation exist in the dry areas from Wyoming and the western Four Corners region to the Pacific Coast. The largest tilt of the odds toward dryness will be centered across California. Meanwhile, the mild winter is expected to continue from the lower Mississippi River, lower Ohio Valley, and eastern Great Lakes to the Atlantic Seaboard, except northern New England. Meanwhile, colder than normal conditions seem more likely through the southern half of the Plains, and most of the Rockies and Intermountain West. Wetter than normal weather is favored across the south-central and southeastern parts of Alaska, with odds tilting toward colder than normal weather in south-central parts of the state.
US Drought Monitor one week change map ending February 11, 2020.
SB20-008, sponsored by Sen. Faith Winter, D-Westminster, would increase penalties for polluting state waters from $12,500 currently to $25,000 per day for “criminal negligence” violations, as well as a year in jail, and from $25,000 currently to $50,000 per day for “knowing and intentional” violations, as well as up to three years behind bars.
Knowing or intentional pollution would be prosecuted as a class 5 felony.
While testifying to the Senate Agricultural & Natural Resources Committee on Feb. 6, Winter said the bill aligns Colorado’s own pollution laws under the Water Quality Control Act with the federal Clean Water Act governing the same crimes.
“Federal action has been going down in recent years to protect our waterways,” Winter testified, saying that recent reports showed the number of new cases prosecuted by the federal Environmental Protection Agency are at a 20-year low, and that the agency was too short-staffed to adequately police pollution.
No water pollution crimes have been prosecuted under Colorado law, while only two have been prosecuted under federal law in the past 10 years, Jason King testified on behalf of the Colorado Department of Law, which supports the bill.
Click here to read the White Paper (Jian Wang, David E. Rosenberg, Kevin G. Wheeler, and John C. Schmidt). Here’s the executive summary:
Colorado River managers and stakeholders face many uncertainties—issues like climate change, future water demand, and evolving ecological priorities. Managers and stakeholders are looking for new ways to communicate about uncertain future conditions, help cope with an uncertain future, and develop public policy when future conditions are highly uncertain. Historically, Colorado River managers have operated Lake Powell and Lake Mead under the assumption that the future natural flow regime of the Colorado River at Lee Ferry will resemble the previously observed regime, but most climate scientists believe that the flow regime is changing, and that future flows will be lower, more variable, and more uncertain.
• It is also difficult to predict future demand for Colorado River water, future river ecosystem conditions, or the values that future generations will attach to those ecosystem conditions. These uncertainties present immense challenges when developing river management policies to enhance water supplies and ecosystem condition.
• To help Colorado River stakeholders think about, talk about, and better manage the river in the face of these unknowns, this white paper distinguishes four levels of uncertainty. Future conditions can be described by point estimates with small ranges (Level 1), probabilities (Level 2), scenarios of possible future conditions (Level 3), or a level of complete unknown (Level 4).
• We represent each level with day-to-day and Colorado River examples. These examples illustrate how the further a stakeholder attempts to peer into the future, the greater the level of uncertainty.
• Managers and stakeholders can classify the uncertainty level of each key system factor to guide decisions about which modeling tools and public policies to use. Tools include defining alternative scenarios, Many Objective Robust Decision Making (MORDM), Decision Scaling (DS), and Dynamic Adaptive Policy Pathways (DAPP) for uncertain future conditions that can only be described by scenarios (Level 3).
• There is need to expand the discussion about how to renegotiate the Interim Guidelines and the Lower Basin Drought Contingency Plan (DCP). This discussion should consider uncertainties in future hydrology, demands, and river ecosystem conditions that can only be described by scenarios (Level 3). Revisions to the Interim Guidelines should (1) include more information about future conditions as new information becomes available, (2) define interim decision points (called signposts) when existing policies should be reconsidered, and (3) allow more flexibility in day-to-day management decisions that respond to unforeseen conditions.
• This white paper suggests that new guidelines designed to adapt to uncertain future hydrology, water demand, and river ecosystem conditions are likely to look quite different than the current guidelines, which seek to provide certainty about the amount of water managers can divert.
• New guidelines that acknowledge different levels of uncertainty levels will be more adaptable, more flexible, and will be better able to anticipate and respond to a wider range of future Colorado River conditions. This adaptability and flexibility can help avert future crises.
Here’s the release from the Bureau of Reclamation (Peter Soeth):
The Bureau of Reclamation selected 19 projects to receive $3.5 million in WaterSMART Applied Science Grants to develop tools and information that will inform and support water management decisions. These projects will be matched by more than $4.5 million, non-federal cost-match, supporting a total project cost of $8 million.
“Water managers need the most updated information to ensure they are making the best water management decisions,” said Reclamation Commissioner Brenda Burman. “Applied Science Grants fund tool development and studies that help make western water more reliable.”
The projects selected are as follows:
City of Sierra Vista (Arizona), Web-based Hydrologic Information Portal for the Upper San Pedro Basin, $99,000
Mojave Water Agency (California), Integrated Model Development and Alternatives Evaluation, $150,000
Pala Band of Mission Indians (California), Pala Tribe Innovative Practices in Hydrologic Data Acquisition and Use for Water Management, $55,120
Point Blue Conservation Science (California), California Central Valley Wetlands Water Budget Tool Development, $150,000
Rancho California Water District (California), Groundwater Modeling Enhancement for the Murrietta-Temecula Groundwater Basin, $195,000
University of California Agriculture and Natural Resources (California), A California Crop Coefficient Database to Enhance Agricultural Water Demand Estimations and Irrigation Scheduling, $299,627
University of California, Merced (California), Defining the Rain-Snow Transition Zone in the Northern Sierra Nevada, $299,976
Colorado Water Conservation Board (Colorado), Arkansas River Colors of Water and Forecasting Tool, $150,000
The Henry’s Fork Foundation (Idaho), Predictive Hydrologic Modeling and Real-Time Data Access to Support Water Resources Management, $273,211
Idaho Power Company (Idaho), Precipitation Modeling Tools to Improve Water Supply Reliability, $300,000
Desert Research Institute (Nevada), Quantifying Environmental Water Requirements for Groundwater Dependent Ecosystems, $296,740
New Mexico Institute of Mining and Technology, New Mexico Water Data Initiative and Regional Pilot Project for Improved Data Management and Decision Support Tool in the Lower Pecos Valley, $300,000
Office of the State Engineer/Interstate Stream Commission (New Mexico), Developing a Projection Tool for Rio Grande Compact Compliance, $141,272
Oklahoma State University (Oklahoma), Improving Seasonal Streamflow Forecasts for Irrigation Districts by Incorporating Soil Moisture Information Derived from Remote Sensing, $88,476
Oklahoma State University (Oklahoma), Applying Unmanned Systems for Water Quality Monitoring, $150,000
Texas Water Trade (Texas), Modeling Aquifer Properties in the Contributing Zone of Comanche Springs, $150,000
Gulf Coast Water Authority (Texas), Enhancement of Water Availability Models of the Lower Brazos Basin $30,000
Utah State University (Utah), A Platform Toward an Early Warning System for Shortages in Colorado River Water Supply, $91,078
Washington State University (Washington), Quantifying the State of Groundwater in the Columbia Basin with Stakeholder-Driven Monitoring, $299,940