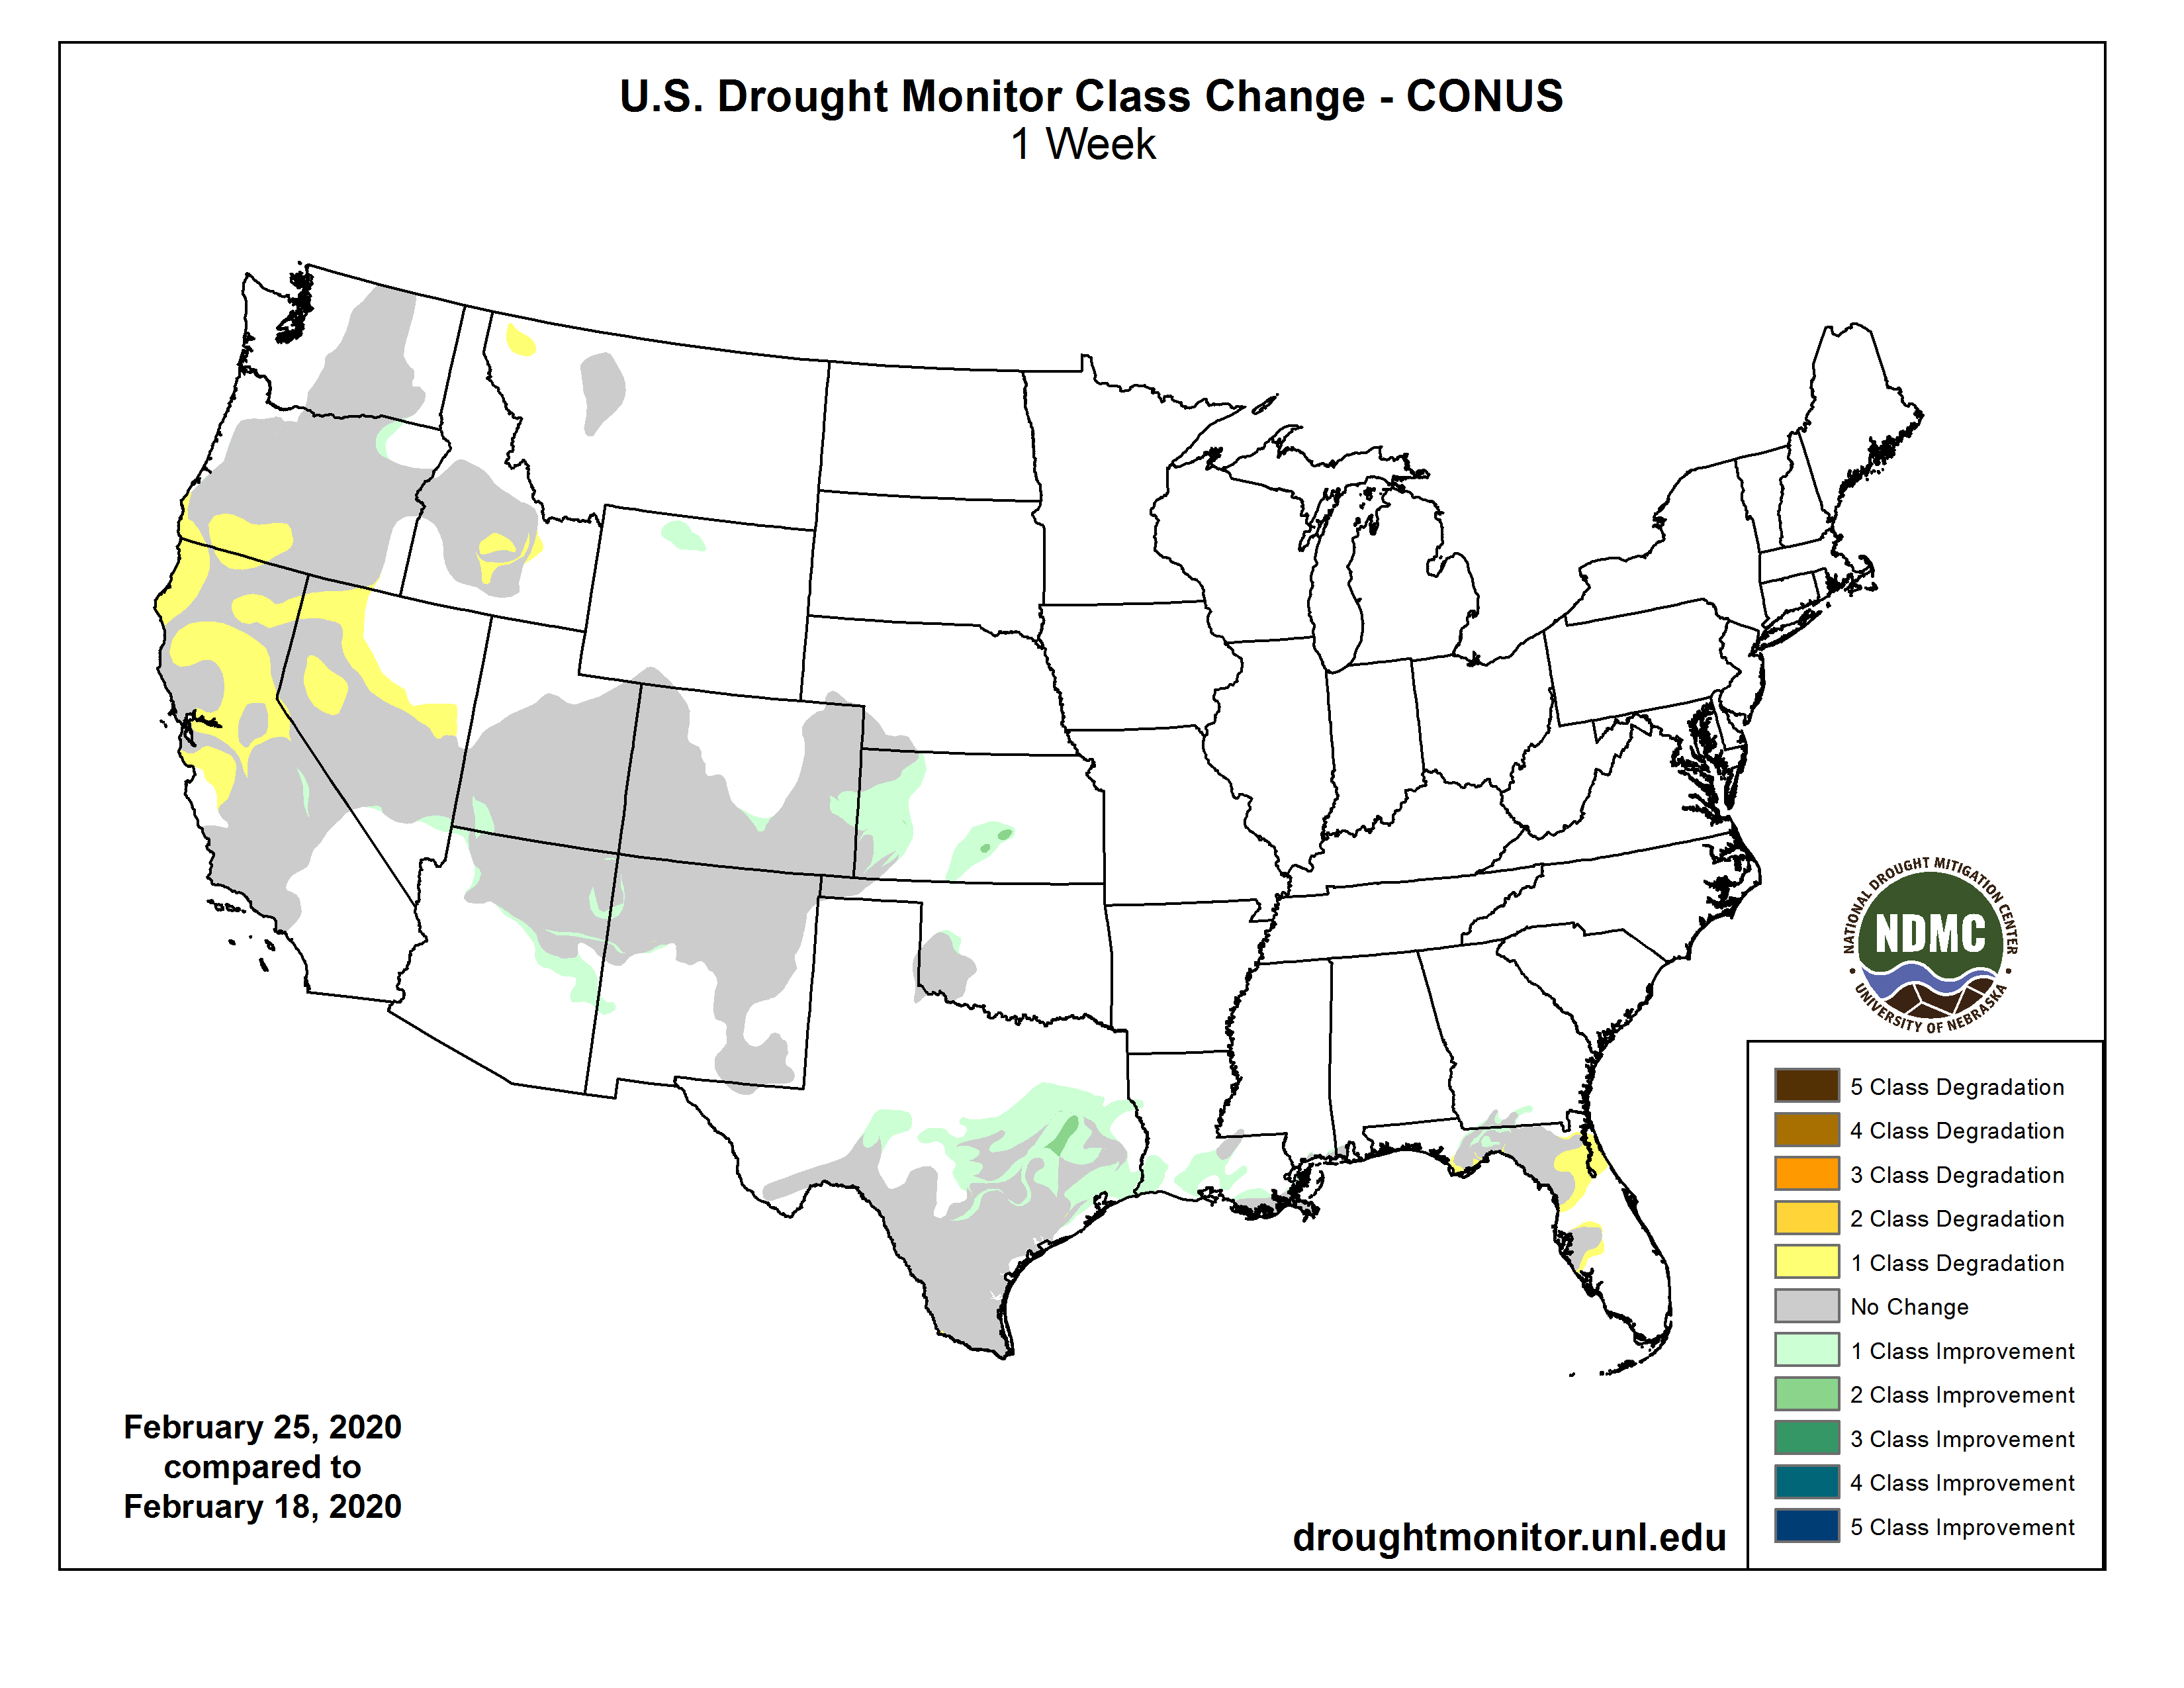
Click on a thumbnail graphic to view a gallery of drought data from the US Drought Monitor.
This Week’s Drought Summary
High pressure continued to persist over the eastern Pacific Ocean, forcing a split in the normal west to east upper-air flow for Pacific storm systems. As a result, storms bypassed the central West (e.g. California and the Great Basin), instead tracking northward into the Pacific Northwest and British Columbia, and southward across Baja California and the Southwest. This pattern has produced a very dry January and February in California, normally the two wettest months of the year, resulting in an expansion of short-term D0 and D1 that are impacting non-irrigated land and non-managed rivers. Fortunately, the statewide reservoir storage stood at 104% of average for this time of year. Farther to the east, once these systems reached the Plains, Gulf moisture was entrained into them, generating widespread precipitation across the South and Southeast and mixed or frozen precipitation in more northern locations. The week’s greatest precipitation (1-4 inches) fell on the northern Cascades, parts of the Southwest (mostly Arizona), the central Plains (mainly Kansas), and from central Texas eastward across the lower Mississippi, Tennessee, and Ohio Valleys, the Southeast, and southern Appalachians. Little or no precipitation, however, fell on most of California, the Great Basin, and Intermountain West, northern Plains and upper Midwest, parts of the southern Plains, most of Florida, and the mid-Atlantic. Weekly temperatures averaged below normal in southwestern Alaska, the Northwest, Rockies, Plains, upper Midwest, Southeast, and New England. In contrast, above-normal readings were observed in eastern and southern Alaska, the Southwest, eastern Great Lakes region, mid-Atlantic, and along the eastern Gulf and southern Atlantic Coasts…
High Plains
Much of the region was saw little or no precipitation with the exception of Kansas and eastern Colorado. Unseasonably heavy precipitation (1-3 inches) fell across much of Kansas and into Missouri, effectively erasing the two small D1 areas and D0 in south-central Kansas as surpluses now replaced deficits out to 90-days. Likewise, moderate precipitation (0.5-1.5 inches) in western Kansas and eastern Colorado (where February normally contributes to only 2-3% of the annual total) removed shortages out to 90-days, improving the D0-D2 by 1-category. In central Colorado, 0.5-1 inch of precipitation was enough to improve most indices to the normal range, thus D0 was removed in parts of Pueblo and Custer Counties. For D0 changes in Wyoming and Montana, please refer to the West write-up…
West
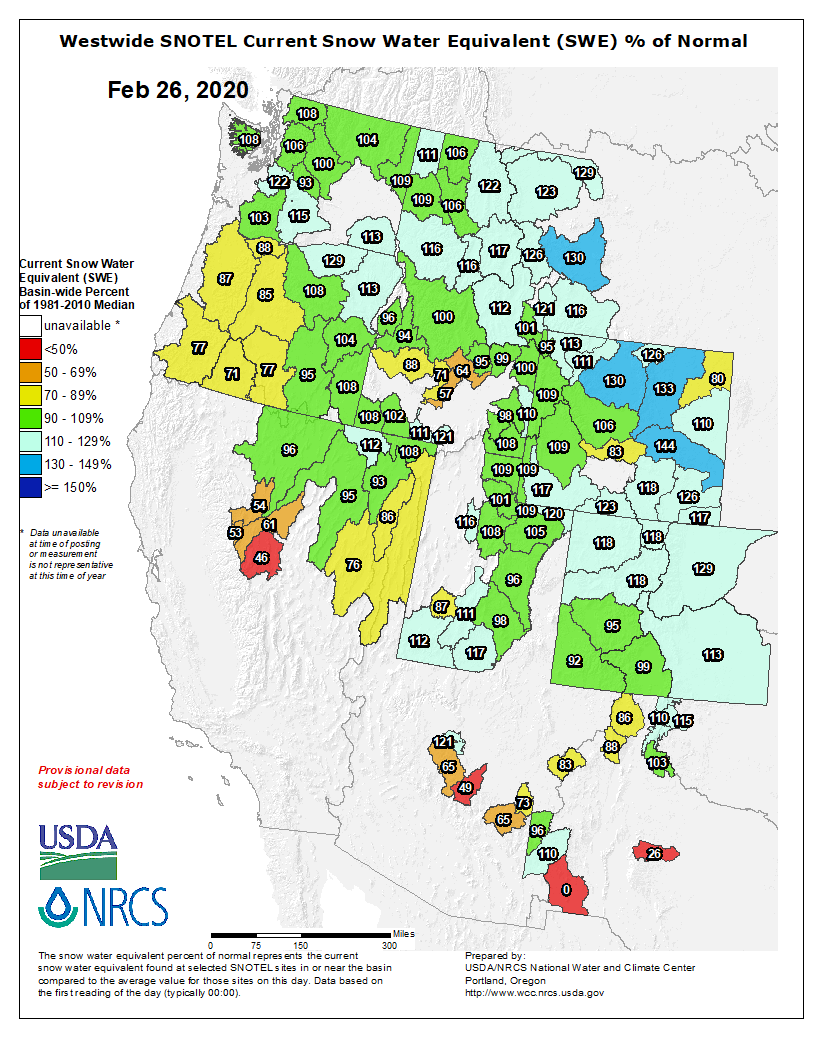
As a large ridge of high pressure off the California Coast remained entrenched, Pacific storm systems were deflected farther north or south of the ridge, affecting the Pacific Northwest and southwestern Canada, or Baja California and the Southwest, but keeping most of California, Nevada, northern Utah, and southern sections of Oregon and Idaho mostly dry. Unfortunately, this pattern has remained entrenched during much of January and February, normally the two wettest months of the year for California, and has greatly diminished the good (wet) start to the Water Year (Oct. 1). After above-normal precipitation during November and December in the Southwest and most of California (and below-normal precipitation in the Northwest), 2020 brought a flip to the weather pattern as California and parts of the Southwest dried out while the Northwest observed surplus precipitation. During the past 60-days, less than 25% of normal precipitation had fallen on much of California and western Nevada, creating deficits exceeding a foot in parts of the Sierra Nevada, and 4-8 inches along the coast. SNOTEL basin average WYTD precipitation has dropped to between 45-54% of normal in the Sierra Nevada while Feb. 25 SWC stood between 46-61%. In southern Oregon, although the past 60-days were somewhat better than California, a dry November and December started their Water Year off to a slow start. Their SNOTEL basin average WYTD precipitation and Feb. 25 SWC was between 67-69% and 71-77%, respectively. In southern Idaho, the Big Lost, Big Wood, and Little Wood basins were mostly dry this week, and the Feb. 25 SWC dropped to between 57-71% while WYTD precipitation held steady, ranging from 55 to 64%.
Although the California statewide average reservoirs were 104% of normal for this time of year, the timing of the precipitation deficiencies are just as important as the magnitude in California. According to California State Climatologist Michael Anderson, February is an important month as temperatures begin to warm and rangeland comes out of winter stasis. With late rains, germination was delayed, and now with little or no rain in February, it will be difficult for rangeland to develop the nutrients necessary for good forage. Expectations are that rangeland conditions will be poor or very poor, and supplemental feeding required. Reports from the field have already mentioned that some rangeland and pastures have already headed out, meaning that they completed their annual life cycle and won’t produce any more biomass, something that normally happens in late April or May. A report from northern California mentioned blowing dust when checking their herd – while blowing snow would be the norm. The latest USDA/NASS February report for California had topsoil moisture 25% very short, 40% short, and 35% adequate. Subsoil moisture was 10% very short, 50% short, and 40% adequate. Some areas are considering irrigation due to the dry weather, and cattle continued to be provided supplemental feed. With numerous non-managed 7-day averaged USGS stream flows in the lower tenth percentile (much below normal) in southwestern Oregon and the northern half of California, and non-irrigated lands already being impacted, D0(S) was expanded into northwestern and west-central California and northwestern and central Nevada. Where short-term conditions (60-days; SPIs at D2-D4) and WYTD conditions (120-days; SPIs at D1-D2) were the worst, D1(S) was added in central California and the Sierra Nevada, southern Oregon, and west-central Nevada. Fortunately, the long-term hydrologic conditions were much better, with California statewide reservoirs at 104% of normal as of Feb. 25. In southern Idaho, D2(SL) was added to the Big Wood, Little Wood, and Lost River basins. In northwestern Montana, a small D0 was introduced from Kalispell to Eureka based upon 90-day indices as SWC and WYTD precipitation is below normal, possibly due to a precipitation shadow effect from this winter’s dominant flow patterns.
In contrast, a southern storm system dropped light to moderate totals (0.5-2.5 inches) on the Southwest, mainly Arizona, but enough precipitation fell elsewhere on southern Nevada, southwestern Utah, northeastern Arizona, and central and eastern Colorado to slightly improve D0-D2 in these areas. In addition, 0.5-1 inch fell on the eastern side of the southern Sierra Nevada (western Inyo and eastern Fresno counties) that the eastern edge of the D1(S) was adjusted (improved) slightly westward. In northeastern Oregon (central Umatilla county), D0 was trimmed back as stream flows, SWC, WYTD precipitation, and soil moisture indicators were much improved. In northern Wyoming, although it was a quiet week, a re-evaluation of the tools showed that all indicators at all time periods were normal or wet, thus the D0 was erased there. Washington was left unchanged…
South
Similar to last week, another storm system dropped moderate to heavy rain (1-4 inches, locally to 7) from central Texas eastward across northern Louisiana, central Mississippi, and into central Alabama and Georgia. Decent totals (0.5-2 inches) also fell on southwestern and northern Oklahoma, central and eastern Texas, and much of Arkansas, Louisiana, Tennessee, and Mississippi. Little or no precipitation was reported in far western and southern Texas, the eastern half of Oklahoma, and extreme northwestern Arkansas. And like last week, 1- and a few 2-category improvements were made in central and southeastern Texas, while most of the D0 in southern Louisiana was alleviated. USGS stream flows have responded, with 7-day averaged values in the 75th to 90th percentiles in eastern Texas eastward. In contrast, where weekly totals were lower (less than 1.5 inches) and decent 60- to 90-day deficits remained, D0 was left. This included southeastern Louisiana and extreme southern Mississippi. A small portion of the D0 was removed in southwestern Oklahoma where 1-1.5 inches fell. Status-quo was decided for southern Texas even though it was mostly dry since major degradations were made last week there. The only change was the removal (downgrade) of a small D1area (to D2) in southwestern Starr County. USGS stream flows have also responded here, but the opposite way as 7-day averages were in the 10th to 25th percentiles. If it remains dry this week with low humidity and gusty winds (red flag warnings), potential deterioration is possible next week as reported impacts were on the rise…
Looking Ahead
During the next 5 days (February 27-March 2) in the West, light to moderate precipitation is expected in the Cascades, Sierra Nevada, Great Basin, and northern and central Rockies later in the 5-day period. Dry weather should prevail across the Plains, while a departing storm system early in the period brings light to moderate totals to the Northeast, Ohio Valley, and central Florida.
In the extended range forecast for the ensuing 5 days (March 3-7), odds are tilted toward above-normal precipitation east of the Rockies, especially from the lower Missouri and Tennessee Valleys northeastward into western New England, and across most of Alaska. Subnormal precipitation is favored in the Far West, especially California, Nevada, and Utah, and in extreme southern Texas. Above-normal temperatures are likely east of the Mississippi River, the Far West (mainly California), and northern High Plains. Enhanced probabilities for subnormal temperatures were found across Alaska, and in the central and southern Rockies.