
Click the link to read the article on the Eos website (Mariana Mastache-Maldonado). Here’s an excerpt:
October 5, 2025
The outlook for our planet’s water future is anything but reassuring. Across much of the world, communities are already confronting prolonged drought, shrinking reservoirs, and the growing struggle to secure reliable access. Now, a new study in Nature Communicationssuggests that so-called day zero droughts (DZDs)—moments when water levels in reservoirs fall so low that water may no longer reach homes—could become common as early as this decade and the 2030s. To find out where and when DZDs are most likely to occur, scientists at the Center for Climate Physics in Busan, South Korea, ran a series of large-scale climate simulations. They considered the imbalance between decreasing natural supply (such as years of below-average rainfall and depleted river flows) and increasing human demand (including surging economic and demographic growth)…
“Most studies tend to focus on supply alone, not on the interplay between supply and demand,” explained Christian L. E. Franzke, a climate scientist and coauthor of the study. “But even without global warming, if water demand continues to rise steadily, scarcity is inevitable.”
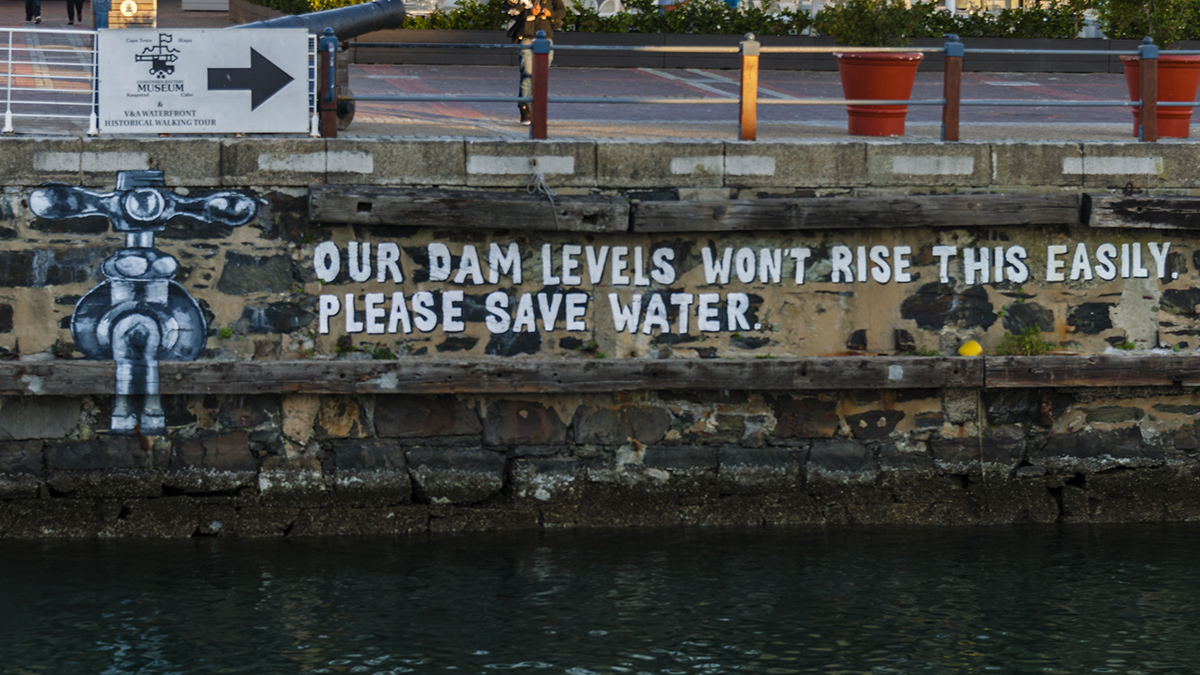
The team found that urban areas face the highest risk of DZDs. As cities expand, their thirst for water often exceeds what local systems can provide, leaving them exposed to shortages and instability. The near catastrophe in Cape Town in 2018, when water was rationed to avoid a complete shutdown, remains a stark warning for cities worldwide. “I remember the measures that had to be taken,” Franzke said. “There were severe restrictions—people had to limit their use to just a few liters a day.”
The human toll of DZDs goes beyond empty taps. It deepens existing inequalities, hitting low-income communities hardest because they are generally less able to endure rising costs of accessing clean water while also being more reliant on public utilities that are slower to secure alternate water sources. Urban DZDs also threaten public health by disrupting sanitation. Overall, a DZD weakens economies and undermines social stability—especially in developing regions where physical, economic, and institutional vulnerabilities overlap.
