Click the link to access the report on the National Laboratory of the Rockies website. Here’s the executive summary:
January 23, 2026
The 2025 U.S. Geothermal Market Report updates and expands on the 2021 U.S. Geothermal Power Production and District Heating Market Report, also referred to as the 2021 Geothermal Market Report (Robins et al., 2021). This report was developed by the National Laboratory of the Rockies (NLR), formerly known as NREL, a national laboratory supporting the U.S. Department of Energy (DOE), and Geothermal Rising, a professional and trade association for the geothermal industry, with support from the International Ground Source Heat Pump Association (IGSHPA), a professional organization for advancing geothermal heat pump technologies. The intent of this work is to provide policymakers, developers, researchers, engineers, financiers, and other stakeholders with an update on the U.S. geothermal market.
This report discusses updates since 2020 regarding technology, cost trends, and market activities for both geothermal power production as well as geothermal heating and cooling systems. A notable difference since the 2021 Geothermal Market Report is the inclusion of geothermal heat pumps (GHPs) for both single building and district heating and cooling applications. This section provides a summary of key findings—first for geothermal power generation, then for geothermal heating and cooling systems, and finally for emerging opportunities.
Geothermal Power Generation Market: Key Findings, Steady Increase in Installed Capacity
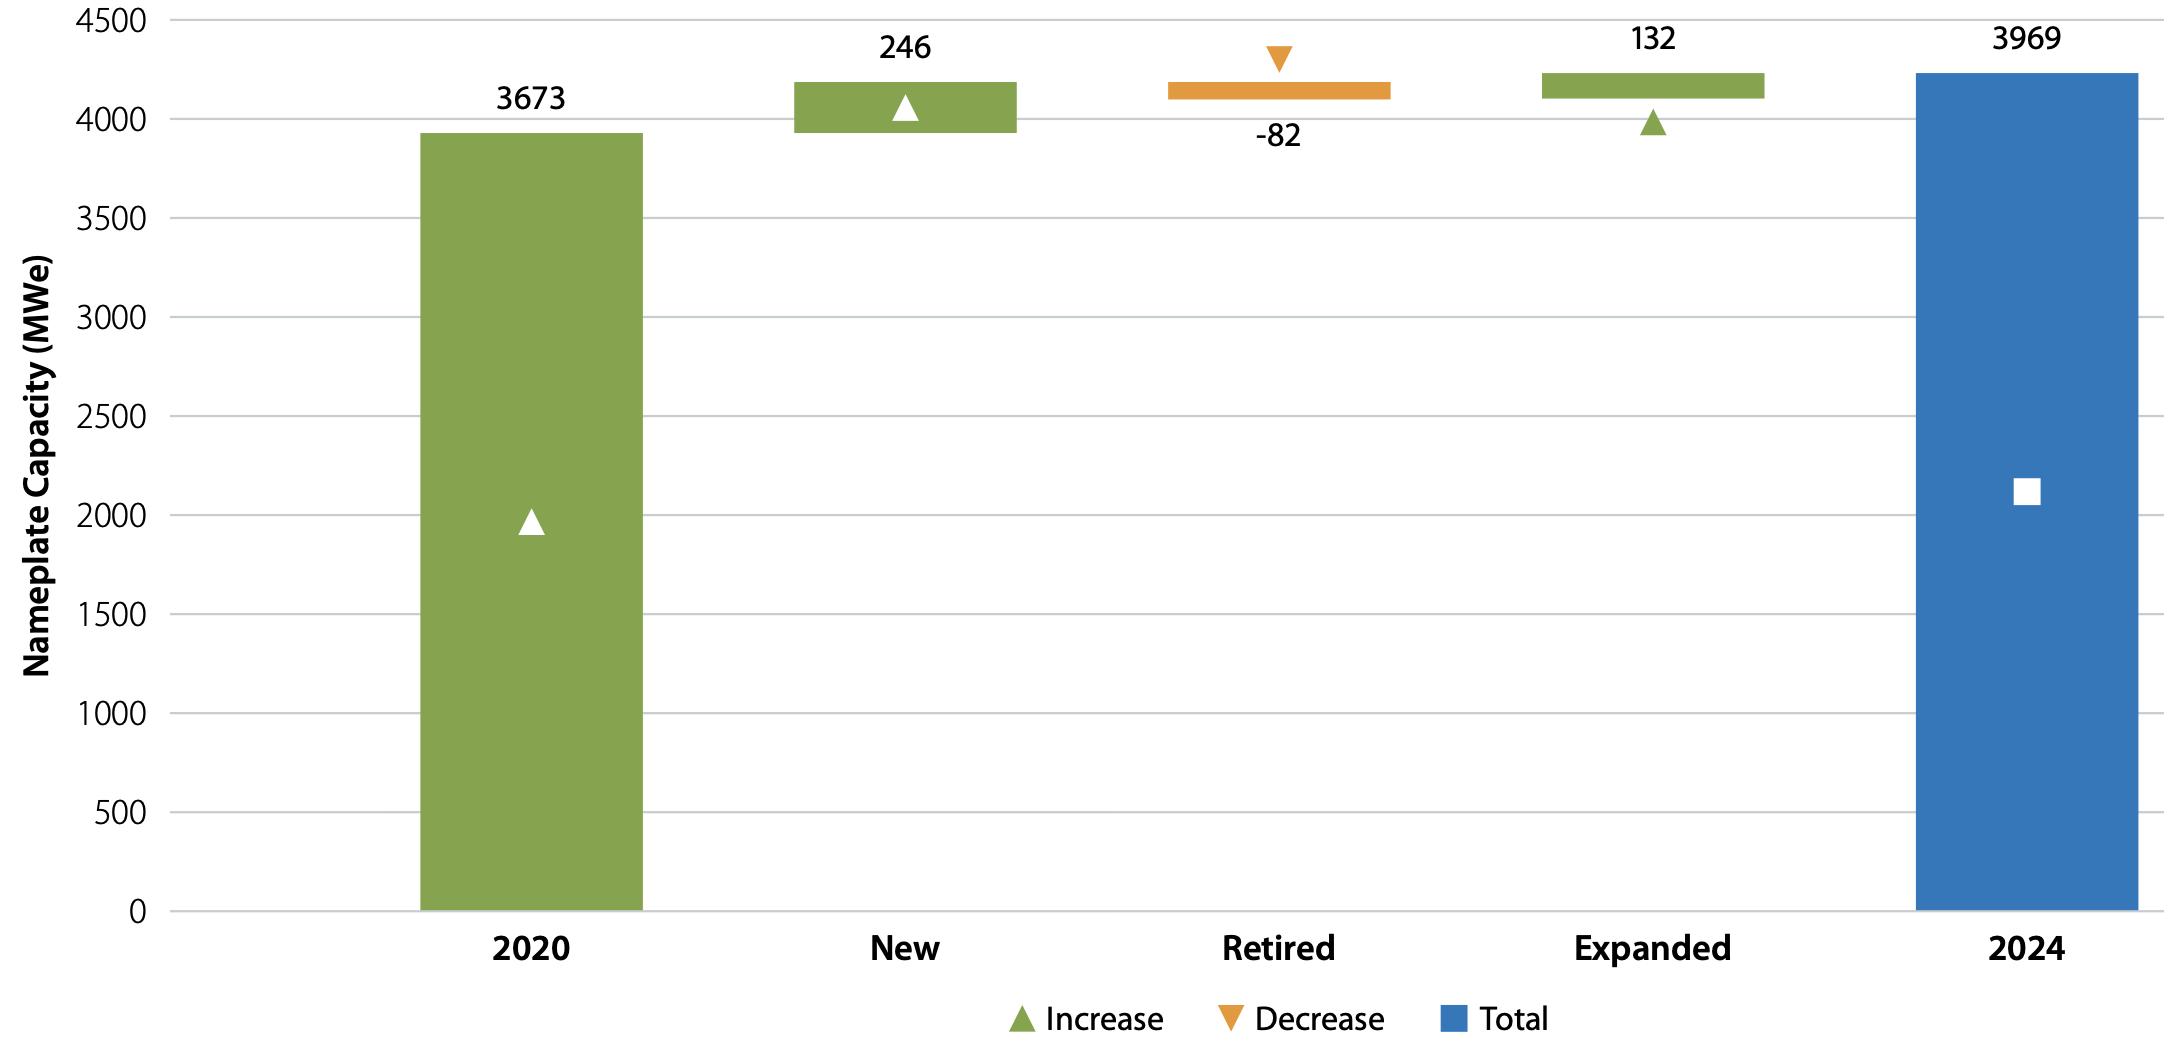
Concentrated in Western States Geothermal power installed nameplate capacity as of 2024 is 3.969 gigawatts-electric (GWe) (3,969 megawatts-electric [MWe]), an 8% increase from 3.673 GWe (3,673 MWe) in 2020. This net increase comprises 246 MWe of new installed capacity, 132 MWe of capacity expansions/additions, and 82 MWe in plant retirements between 2020 and June 2024 (Figure ES-1). Correspondingly, summer and winter net capacities have also risen from 2.56 GWe and 2.96 GWe in 2019 to 2.69 GWe and 3.12 GWe in 2023, respectively. Two operators, Ormat and Calpine, continue to comprise the majority of U.S. geothermal power plant ownership and operation. Together they account for 69% of total installed capacity and 61% of all operating geothermal plants in the United States.
Geothermal power plants are almost entirely concentrated in the western United States (see Figure ES-2). This geographical region consists of several Known Geothermal Resource Areas (e.g., The Geysers), with high thermal gradients, heat flow, and permeability, that have been historically explored and developed for power production. California hosts 53 of the 99 geothermal power plants1 in the country, with a total installed nameplate capacity of 2.87 GWe (2,868 MWe, 72% of the U.S. total). Nevada, with significant resource potential, is second with 32 power plants and an installed nameplate capacity of 892 MWe. Other states with geothermal power installed include Oregon and Utah with four plants each, Hawai‘i and Alaska with two plants each, and Idaho and New Mexico with a single plant each.2

power plants in the United States as of June 2024. Data from EIA (2024a, 2024d).
In the power plant totals for each state, a single plant is described by the installation
year (Appendix B) as it can consist of one or more generating units installed over
years. Some plants (e.g., Puna in Hawai‘i and McGinness Hills in Nevada) have been
expanded in subsequent years after the first unit was installed. These are treated as
separate plants as shown in Appendix B. This does not include planned plants that
are not yet operational.
New Power Purchase Agreements and Projects Under Development Indicate Accelerated Interest by Utilities, Corporations
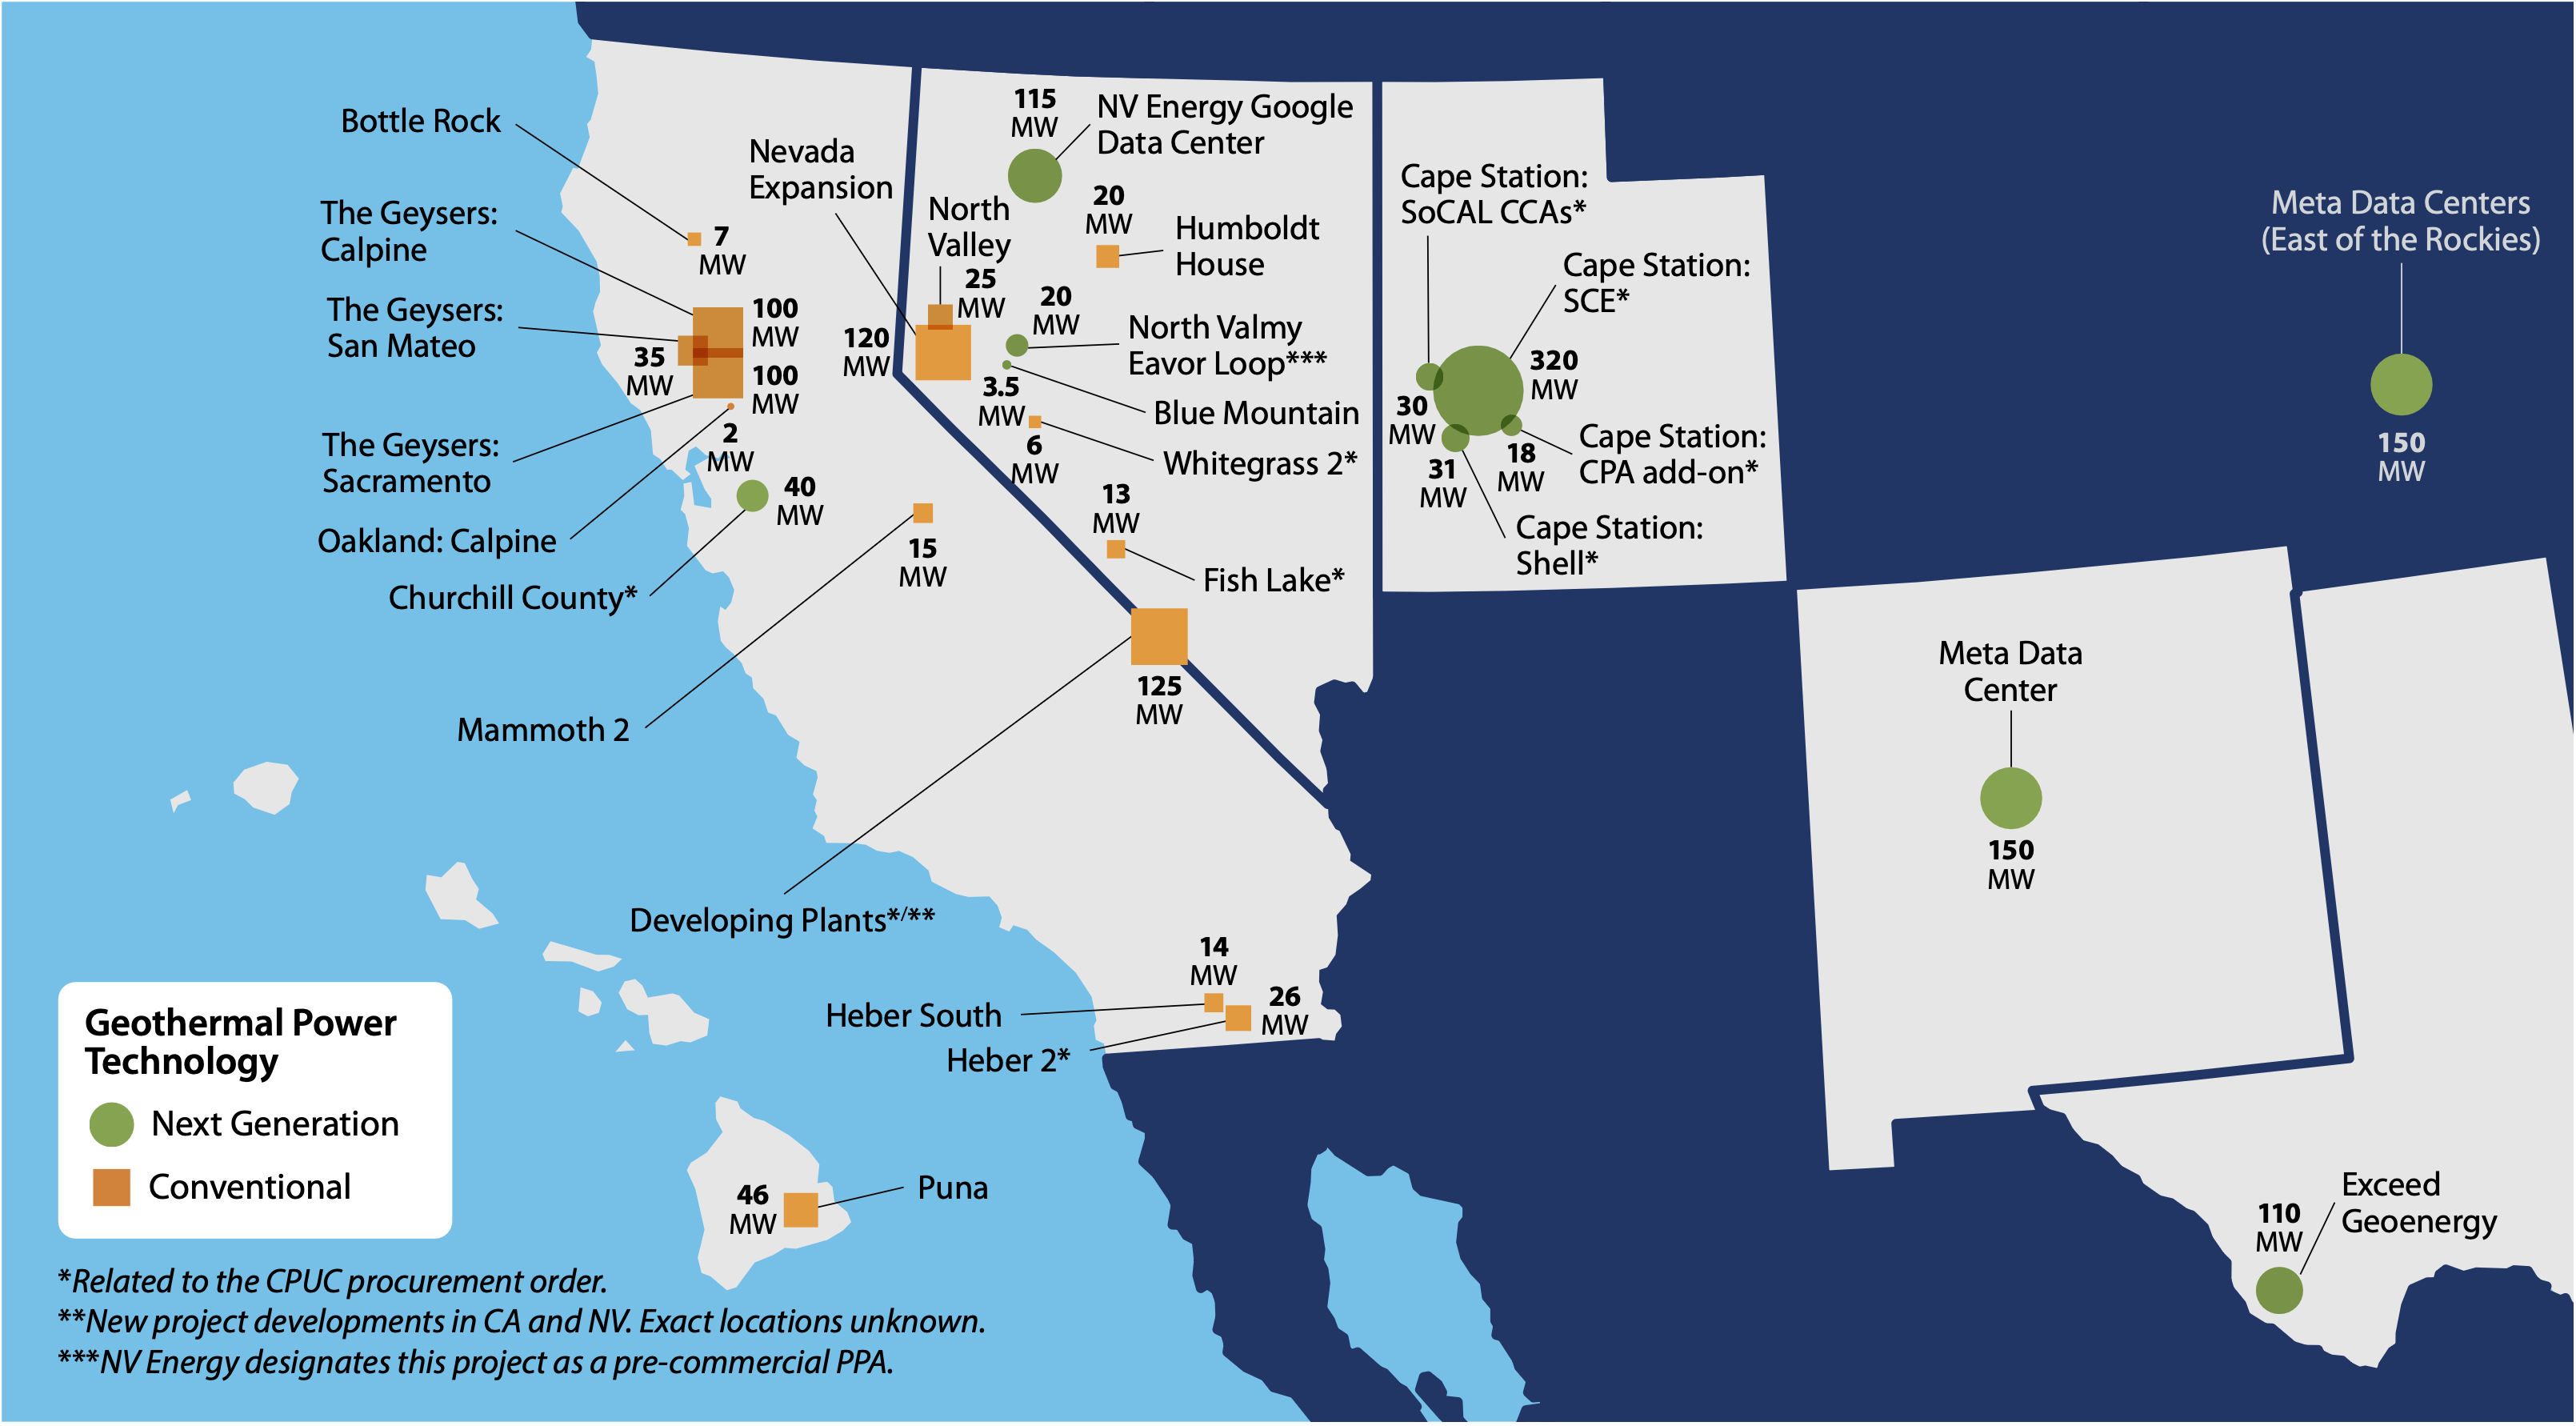
The rise in recent power purchase agreements (PPAs)—26 since the 2021 Geothermal Market Report, as of June 2025—is an indicator that the geothermal power sector is primed for substantial growth. In total, these represent more than 1.6 GWe (1,642 MWe) of new capacity commitments to be developed in the near term (see Figure ES-3 for a map of new developments). The California Public Utilities Commission (CPUC) released a procurement order in 2021 that contributed to the increase in PPAs (CPUC, 2021). NLR analysis in this report shows that the order has led to the signing of at least 616 MWe in PPAs between geothermal developers and load-serving entities in California as of June 2025. This order also awarded credits to imports of firm (i.e., “always on”) power from other states, resulting in PPAs signed between California purchasers and geothermal developers in Nevada and Utah.
Next-generation geothermal systems3 account for 60% of geothermal PPAs signed between 2021 and July 2025. The first of these PPAs was signed in 2022 between Fervo Energy and Google, through NV Energy, for 3.5 MWe of power produced from an enhanced geothermal system (EGS) project. As of June 2025, utilities have procured (or agreed to procure) 984 MWe of next-generation geothermal power capacity across California (439 MWe), Nevada (135 MWe), New Mexico (150 MWe), Texas (110 MWe), and an undisclosed location east of the Rocky Mountains (150 MWe) through 11 PPAs.
Overall, the number of geothermal power projects under development has increased from 54 to 64 since 2020. This is based on data gathered through industry survey respondents as of June 2024 from major geothermal developers and operators, and compares data from companies that existed in both 2020 and 2024. Ormat continues to lead in conventional commercial geothermal development, with 37 projects under development. Fervo Energy, with four developing projects, and Sage Geosystems and Eavor, with two projects each, are spearheading commercial next-generation geothermal.
Major R&D and Commercial Advancements in Next-Generation Power Technologies
DOE’s Frontier Observatory for Research in Geothermal Energy (FORGE) site near Milford, in Beaver County, Utah, has been largely successful in showing a replicable process for developing EGS reservoirs. FORGE has drilled seven wells, and has achieved notable improvements in drilling performance, including reduction in on-bottom drilling hours—110 hours for a well in 2023 compared to 310 hours for a well in 2020 (Dupriest and Noynaert, 2024).
In 2023, Fervo Energy recorded the first commercial-scale EGS drilling and reservoir development pilot in the United States adjacent to the Blue Mountain Geothermal Plant in Nevada (Norbeck and Latimer, 2023). Fervo Energy has an additional four projects in development, including a first-of-a-kind large-scale 500-MWe (100 MWe Phase 1 and 400 MWe Phase 2) commercial EGS project underway at their Cape Station site near Utah FORGE in Beaver County, Utah (Fervo Energy, 2024a).
The development of closed-loop geothermal (CLG) systems is steadily advancing. In 2022, Eavor Technologies drilled the first two-leg multilateral deep geothermal well in the U.S. in New Mexico. In that project, Eavor drilled a single vertical well with a sidetrack to a true vertical depth of 18,000 ft and rock temperature of 250°C, a first in the U.S. geothermal industry (Brown et al., 2023).
EGS Costs Decreasing, Conventional Hydrothermal Costs Holding Steady
The levelized cost of energy (LCOE) for EGS is declining (Figure ES-4) and is projected to hit levels of 2024 flash hydrothermal LCOE within the next decade based on the 2024 Annual Technology Baseline (ATB) Moderate Scenario (NLR, 2024). The latest outcomes from Fervo’s drilling, stimulation, and well testing activities at its Cape Station site have bolstered this developing projection. As seen in Figure ES-4, the LCOE for conventional hydrothermal systems has been relatively flat since the 2021 Geothermal Market Report and has hovered between $63–74 per megawatt-hour (MWh) for flash-based plants and $90–110 per MWh for binary plants. However, these LCOEs are competitive with the geothermal PPA prices compiled in this report.
Investment in Next-Generation Geothermal Technologies Is Accelerating
Companies at the forefront of developing and commercializing next-generation geothermal technologies have raised more than $1.5 billion in private capital since 2021. According to recent data gathered by NLR, EGS and CLG technology companies and startups have brought in $990 million and $604 million, respectively, in capital investment between 2021 and mid-2025. Within this period, Fervo Energy and Eavor Technologies raised additional amounts—$642 million and $387 million in equity investments, respectively (Fervo Energy, 2024a, 2024b, 2024c, 2025; Eavor Technologies, 2024a). Technology advances are helping to increase attractiveness of next-generation geothermal for debt financing. Fervo has secured $331 million in debt financing through various loan facilities to finance their Cape Station project in Utah, and Eavor received $142 million in loans in 2024 (Fervo Energy, 2024b, 2025; Eavor Technologies, 2024a; 2024b).

Domestic Geothermal Potential Is Abundant, Including on Public Lands
Based on recent NLR analysis, the estimated average EGS resource potential is 27 terawatt-electric (TWe) to 57 TWe within 1- to 7-km depth across the continental United States (Menon et al., 2025). NLR also estimates 4.35 TWe of EGS resources are within Bureau of Land Management (BLM) and United States Forest Service (USFS) land (Martinez Smith et al., 2024). Further analysis of these results indicates a smaller amount of resource potential that is considered economically developable, including 1.1% (47.8 GWe) of EGS resources. As of June 2025, geothermal projects on public lands (managed by the BLM as part of the Federal mineral estate) total 2,600 MWe of nameplate capacity, with 756 MWe added since 2000 (EIA, 2024a; Ormat, 2024a). As of 2023, 51 geothermal power plants are in operation on BLM-managed lands (BLM, 2023b). In 2022, geothermal power plants on BLM-managed lands generated 11.1 terawatt-hours (TWh) of electricity (EIA, 2024a, 2024b, 2024c).

developers between 2021 and June 2025. Sources: Fervo Energy (2024a, 2024b,
2024c, 2025), Business Wire (2024a; 2024b; 2025a), Eavor Technologies (2024a; 2024b), and Pitchbook (2025).
States Incentivize Geothermal Power Projects
As of December 2025, there were 29 U.S. states with incentive policies for geothermal power including grants, rebates, tax incentives, and other financial incentives (e.g., reduced cost and/or free application fees for permit processing). A total of 17 states and D.C. have policies that encourage geothermal electricity production, including tax credits. Furthermore, 42 states and D.C. have existing regulatory policies that include geothermal power, which include energy and efficiency standards, net metering, and/or interconnection standards.
Geothermal Heating and Cooling Market: Key Findings
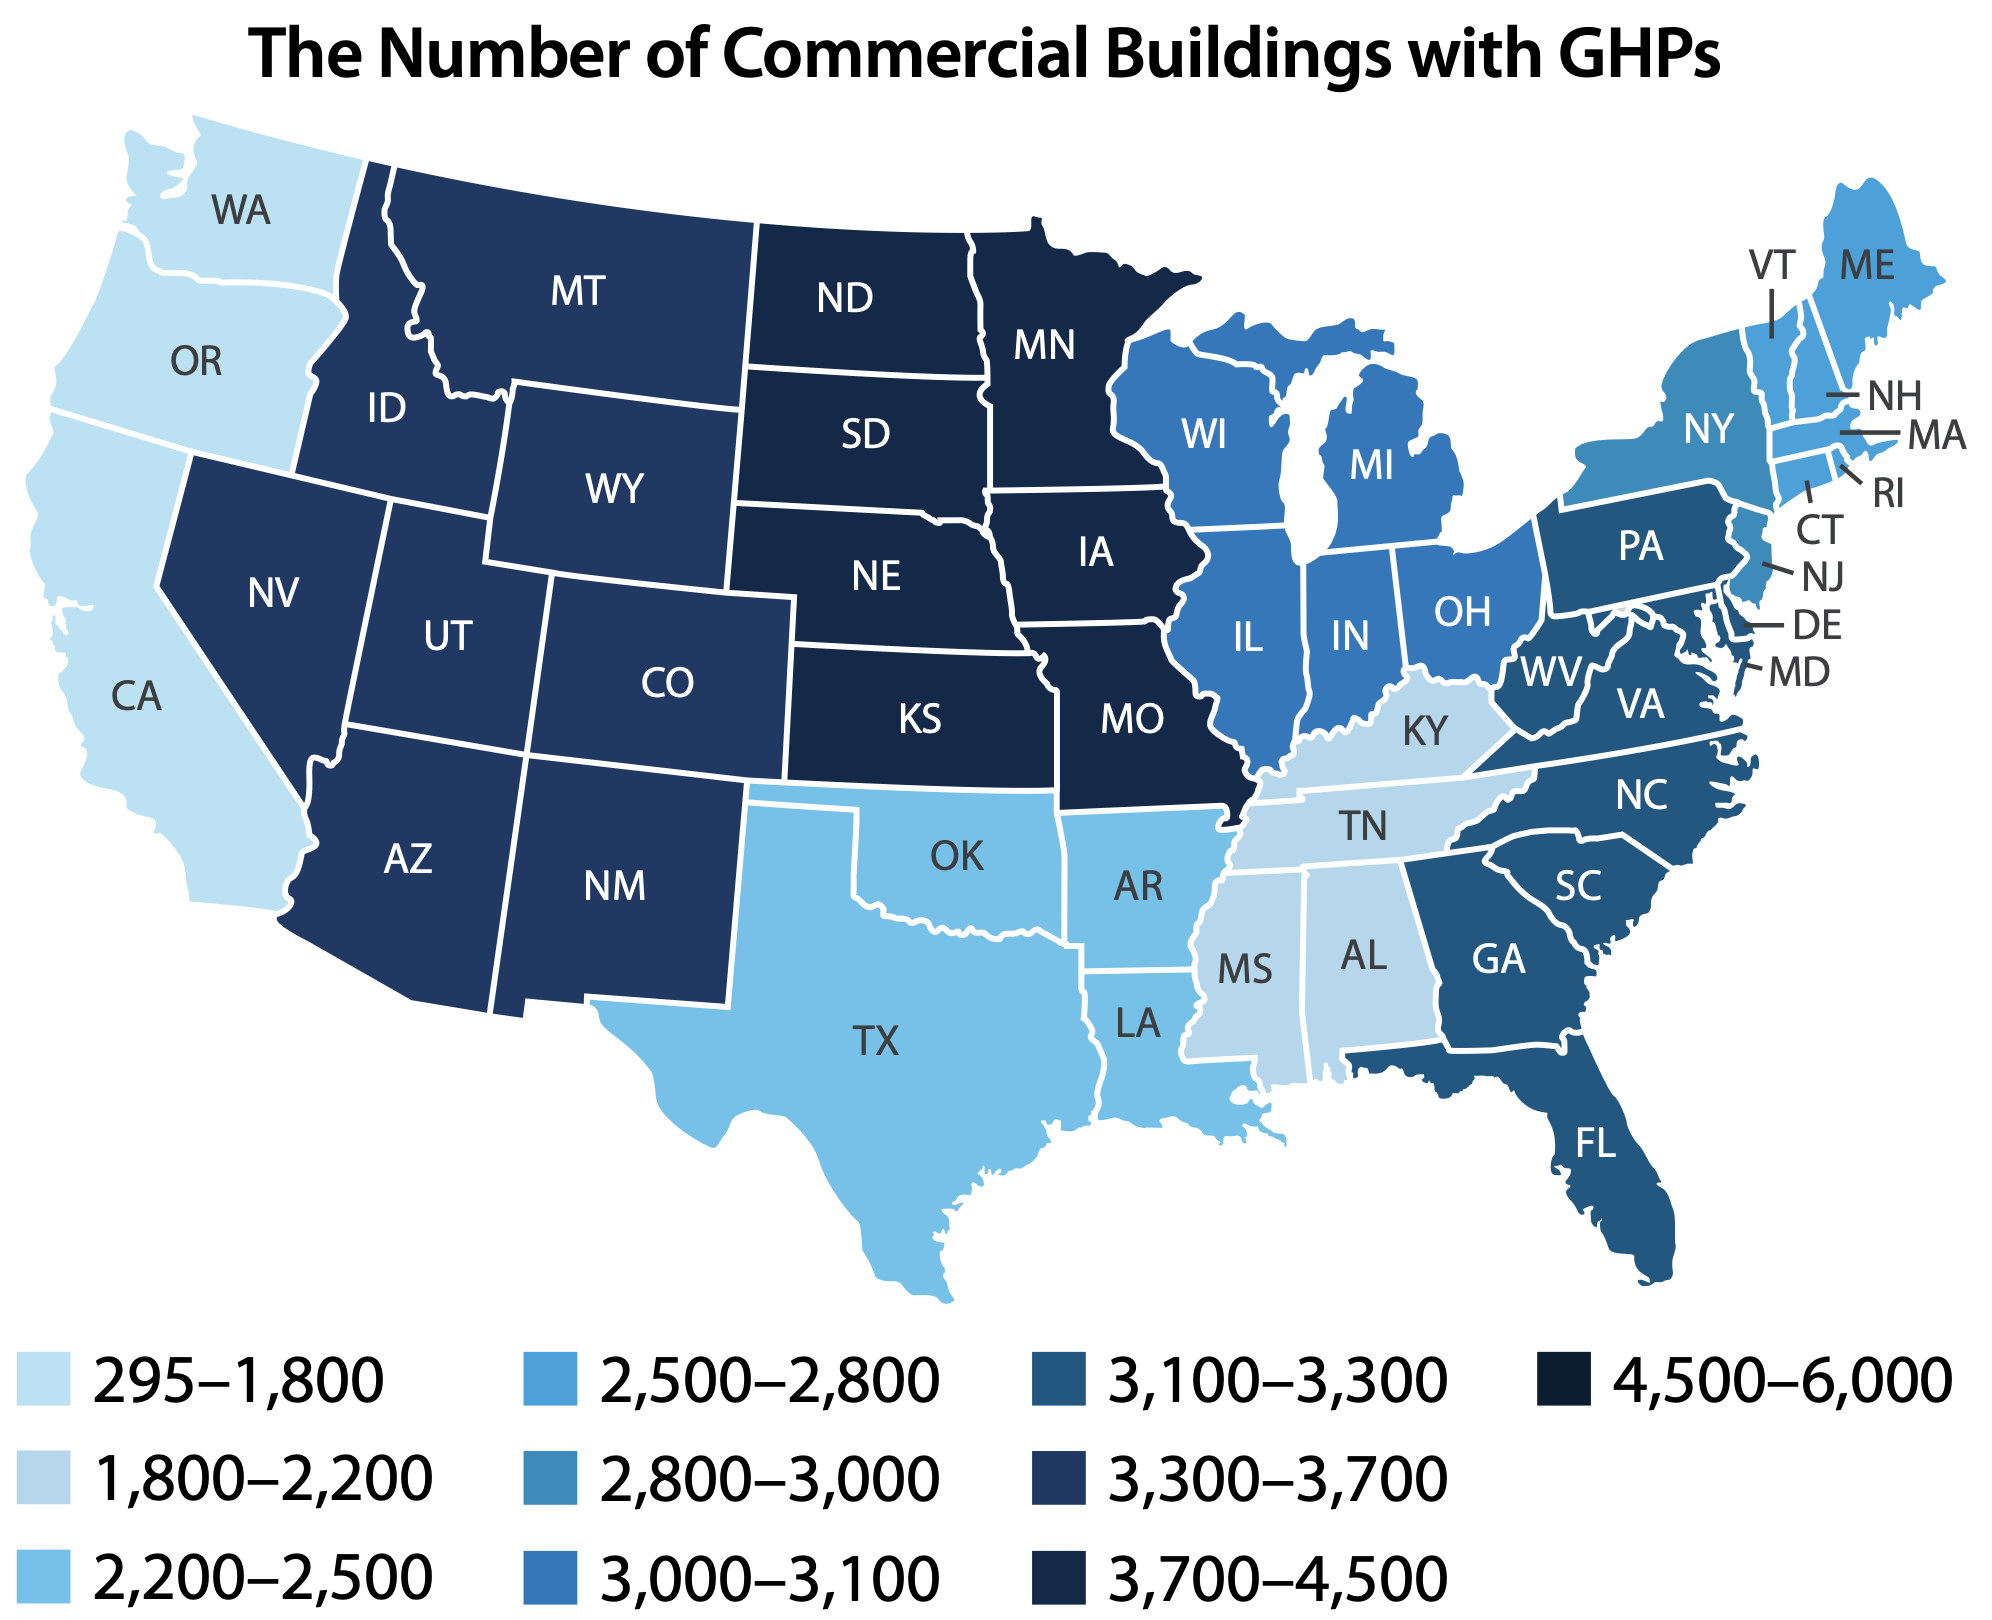
Geothermal Heat Pumps Are Reliable, Highly Efficient, and Available Across the Country The GHP market is an established energy market for residential and commercial building heating and cooling. GHPs are used across all geographical and climatic regions in the United States, according to census track data from the Energy Information Administration (EIA) (Figure ES-6) and corroborated by historical well permit data collected by NLR for single building GHP installations (Pauling, Podgorny, and Akindipe, 2025).4
GHP systems have seeen increased adoption across various sectors, including residential, commercial, and industrial applications. Residential use has been a major focus as homeowners seek energy-efficient options. Based on extrapolation of data from the Residential Energy Consumption Survey (RECS) and the Commercial Building Energy Consumption Survey (CBECS), an estimated 1.27 million residential housing units and 27,300 commercial buildings across the United States have GHP installations. In the residential sector, Florida, Tennessee, and North Carolina are estimated to have the highest number of housing units with GHPs.
Incentives Help Offer Consumers Energy Options
As of December 2025, 34 states and D.C. have incentive policies for GHPs. These include grants, rebates, tax incentives, and other financial incentives. In addition, eight states have policies that encourage GHP adoption. 23 states and D.C. have existing regulatory policies for GHPs. As of July 2025, at the federal level, homeowners were eligible for a 30% tax credit on GHPs as part of the Inflation Reduction Act (IRA) Residential Energy Credit (Section 25D of U.S. Code 2025a), however, the property must have been placed in service prior to December 31, 2025. As of July 4, 2025, an exemption to the IRS policy of limited-use property doctrine was created for geothermal systems where they may now be leased by a third-party, including to residential customers (Section 50 of U.S. Code, 2025c). The IRA also includes a base 6% tax credit for commercial building owners installing GHPs (Section 48 of U.S. Code, 2025b).
GHPs Offer Secure, Reliable Support
for U.S. Grid Infrastructure GHPs can offer up to $1 trillion in value in the form of avoided grid infrastructure build-out costs to the future U.S. grid. Oak Ridge National Laboratory estimates that GHP deployment in 68% of the total existing and new building floor space in single-family homes in the continental United States by 2050 would provide multiple benefits to the electric grid, including up to $306 billion reduction in electric power system costs and up to $606 billion savings in wholesale electricity marginal costs (Liu et al., 2023). Mass GHP deployment is estimated to have the potential to reduce required additional annual generation by 585–937 TWh and power and storage capacity by 173–410 GW. Mass GHP deployment is also expected to alleviate the need for transmission build outs by 3.3–65.3 TW-miles.

Thermal Energy Networks Are a Growing Market for District Heating and Cooling
Accelerating interest in energy efficiency in buildings from neighborhood to city scale has spurred the rise of Thermal Energy Networks (TENs). A geothermal TEN is a fifth- generation geothermal district heating and cooling system with decentralized GHPs connected to a shared distribution loop. States like California, Colorado, Maryland, Massachusetts, Minnesota, New York, Vermont, and Washington have enacted regulations and announced programs that specifically address the need for geothermal TENs within energy utility service territories (Varela and Magavi, 2024).
In 2024, the natural gas utility Eversource Energy commissioned a first-of-its-kind U.S. utility-owned geothermal TEN pilot in Framingham, Massachusetts. The Framingham project consists of an ambient temperature loop that connects decentralized GHPs in 36 buildings—including 24 residential and five commercial buildings—to three borehole fields (Eversource, 2025). The Framingham pilot project serves as a first example and path forward for the rapidly growing national interest by natural gas utilities and state regulatory agencies in developing TEN projects within their service territories and jurisdictions.
Geothermal Direct Use in the United States Cuts Across Multiple End Uses
Based on updated data compiled by NLR beyond the 2021 Market Report (Robins et al., 2021), there were close to 500 geothermal direct-use (GDU) installations (by end-use application) in the United States as of October 2024. Of these, GDU for heating resorts and pools accounts for the largest portion (59%) with 281 installations, followed by space heating (77), aquaculture (47), greenhouse (37), district heating (25), and other (15) applications, including dehydration, snow melting, irrigation, and gardening. With 89 installations, California has the most GDU installations in the United States.
Emerging Opportunities: Key Findings
Geothermal As Part of U.S. Energy Security and Independence
From a power generation perspective, geothermal energy can strengthen the electric grid and provide resilience against extreme weather, power outages, and cyberattacks. These benefits likely contributed to the greenlighting of geothermal energy projects within multiple U.S. Department of Defense (DoD) installations. Specifically, DoD awarded six projects between September 2023 and April 2024 to explore the potential of conventional and next-generation geothermal technologies in a total of seven installations. The DoD locations (and awardees) include Joint Base San Antonio in Texas (Eavor), Fort Wainwright in Alaska (Teverra), Mountain Home Air Force Base in Idaho (Zanskar), Fort Irwin in California (Zanskar), Naval Air Station Fallon in Nevada (Fervo), Naval Air Facility El Centro in California (GreenFire Energy), and Fort Bliss in Texas (Sage Geosystems) (Defense Innovation Unit, 2023, 2024). In August 2025, the DoD installations were expanded to include the Marine Corps Air Ground Combat Center Twenty-Nine Palms and the Sierra Army Depot, both in California (GreenFire Energy), the Naval Air Station Corpus Christi in Texas (Sage Geosystems), and the Army’s White Sands Missile Range in New Mexico (Teverra) (Defense Innovation Unit, 2025). In a separate effort, the U.S. Department of the Air Force awarded Sage Geosystems a $1.9-million grant in September 2024 for a pilot demonstration of their next-generation technology at an off-site test well in Starr County, Texas (Bela, 2024).
Among heating and cooling technologies, geothermal is a resilient and reliable option. As a resilient energy source, it is not affected by supply chain disruptions and energy price fluctuations like conventional heating fuels. As a reliable energy source, the resource capacity of geothermal for heating and cooling through GHPs is not directly affected by changes in surface weather conditions. These uniqueattributes have been found useful for various building types across the U.S., including federal buildings. Based on recent analysis, 24 separate GHP projects were awarded in federal buildings between 2001 and 2014 across the country, leading to energy and maintenance cost savings (Shonder and Walker, 2024).
Data Center Support Is a Key Opportunity Area for Geothermal Power
Data center load growth has tripled over the past decade and is projected to double or triple by 2028 (Shehabi et al., 2024). Geothermal energy has the potential to play a key role in meeting the rapidly growing power demands of artificial intelligence (AI)-driven data centers by providing firm, reliable energy as well as critical opportunities to significantly reduce peak data center cooling demands through underground thermal energy storage. Major technology companies have already turned to geothermal energy to power their operations—Meta signed a PPA in 2024 with Sage Geosystems for up to 150 MWe of geothermal power to support its U.S. data centers (Meta, 2024) and another 150 MWe PPA with XGS to support data centers in New Mexico (Business Wire, 2025b). Similarly, Google expanded its partnership with Fervo Energy and NV Energy in 2024 beyond the initial 3.5 MWe agreement, securing 115 MWe of geothermal energy to supply its Nevada data centers (Hanley, 2024).
Superhot Geothermal Could Boost Geothermal Well Output
Superhot/supercritical geothermal has the potential to deliver 5–10 times the thermal energy output per well compared to conventional geothermal systems (CATF, 2025). Estimates suggest that harnessing heat from superhot resources shallower than 10 kilometers (km)—accessible with existing drilling technology—could supply up to 50% of current global electricity demand (Kiran et al., 2024). DOE’s Geothermal Technologies Office (GTO) funded research in this area, including a project to de-risk superhot exploration and one to demonstrate superhot EGS on the western flank of Oregon’s Newberry Volcano (GTO, 2024a).
Hybrid Plants, Geological Thermal Energy Storage, and Co-Production Could Offer Additional Avenues for Flexible Generation and Grid Stability
In addition to providing flexible generation and grid stability, geothermal can be used as a balancing resource. For instance, hybrid plants integrating geothermal with solar photovoltaic or concentrating solar thermal technologies can provide baseload capacity and peaking power. Examples of this include Cyrq Energy’s Patua project, Ormat’s Tungsten Mountain project, and Ormat’s (formerly Enel’s) Stillwater project.
Another growing application of geothermal is geological thermal energy storage (GeoTES). GeoTES converts sedimentary reservoirs (e.g., depleted oil and gas reservoirs) to long-duration energy storage systems. There are not yet any active GeoTES plants in the United States, but GTO and DOE’s Solar Energy Technologies Office previously separately selected for negotiation two demonstration projects in this space. The first project aims to develop a 100-kilowatt-electric (kWe) demonstration power plant with more than 12 hours of GeoTES in depleted oil reservoirs in Kern County, California (Partida, 2024; Umbro et al., 2025), while the second will feature a GeoTES demonstration project at Kern Front Oil Field in the same county (Cariaga, 2024c).
Co-production of geothermal energy from oil and gas reservoirs is an approach that harnesses the thermal energy present in the fluids produced during oil and gas extraction. In January 2022, DOE awarded $8.4 million to four projects as part of the Wells of Opportunity initiative. These projects—led by Geothermix, ICE Thermal Harvesting, Gradient Geothermal (formerly Transitional Energy), and University of Oklahoma—aim to repurpose inactive or idle hydrocarbon wells for geothermal energy use (GTO, 2025c).
Mineral Extraction From Geothermal Brines Could Help Address U.S. Critical Materials Competitiveness
Another emerging opportunity for geothermal is mineral extraction from geothermal brines, particularly lithium. Findings from Lawrence Berkeley National Laboratory indicate the Salton Sea lithium resource is estimated to be close to 3,400 kilotons, offering the potential to create a domestic lithium industry in the United States (Dobson et al., 2023). Technological innovations in mineral extraction technologies like direct lithium extraction continue to advance. Work to continue these advances includes GTO-funded national laboratory projects for research and development on lithium extraction in Known Geothermal Resource Areas within and beyond the Salton Sea, California, and additional projects targeting the Smackover Formation and other areas of the U.S. with mineral and geothermal potential, previously funded by GTO in collaboration with DOE’s Advanced Manufacturing and Materials Office and DOE’s Office of Fossil Energy (GTO, 2024c).

Footnotes
1 Multiple geothermal power plants can be situated in a Known Geothermal Resource Area. For example, 17 of the 53 plants in California are within The Geysers Known Geothermal Resource Area.
2 A single plant is described by the installation year (Appendix B) as it can consist of one or more generating units installed over years. Some plants (e.g., Puna in Hawai‘i and McGinness Hills in Nevada) have been expanded in subsequent years after the first unit was installed. These are treated as separate plants as shown in Appendix B
3 The term “next-generation geothermal systems” refers to technologies that enable geothermal energy to be harnessed in low to ultra-low permeability formations through advanced drilling and/or stimulation techniques. This technology category currently includes enhanced geothermal systems and closed-loop geothermal systems.