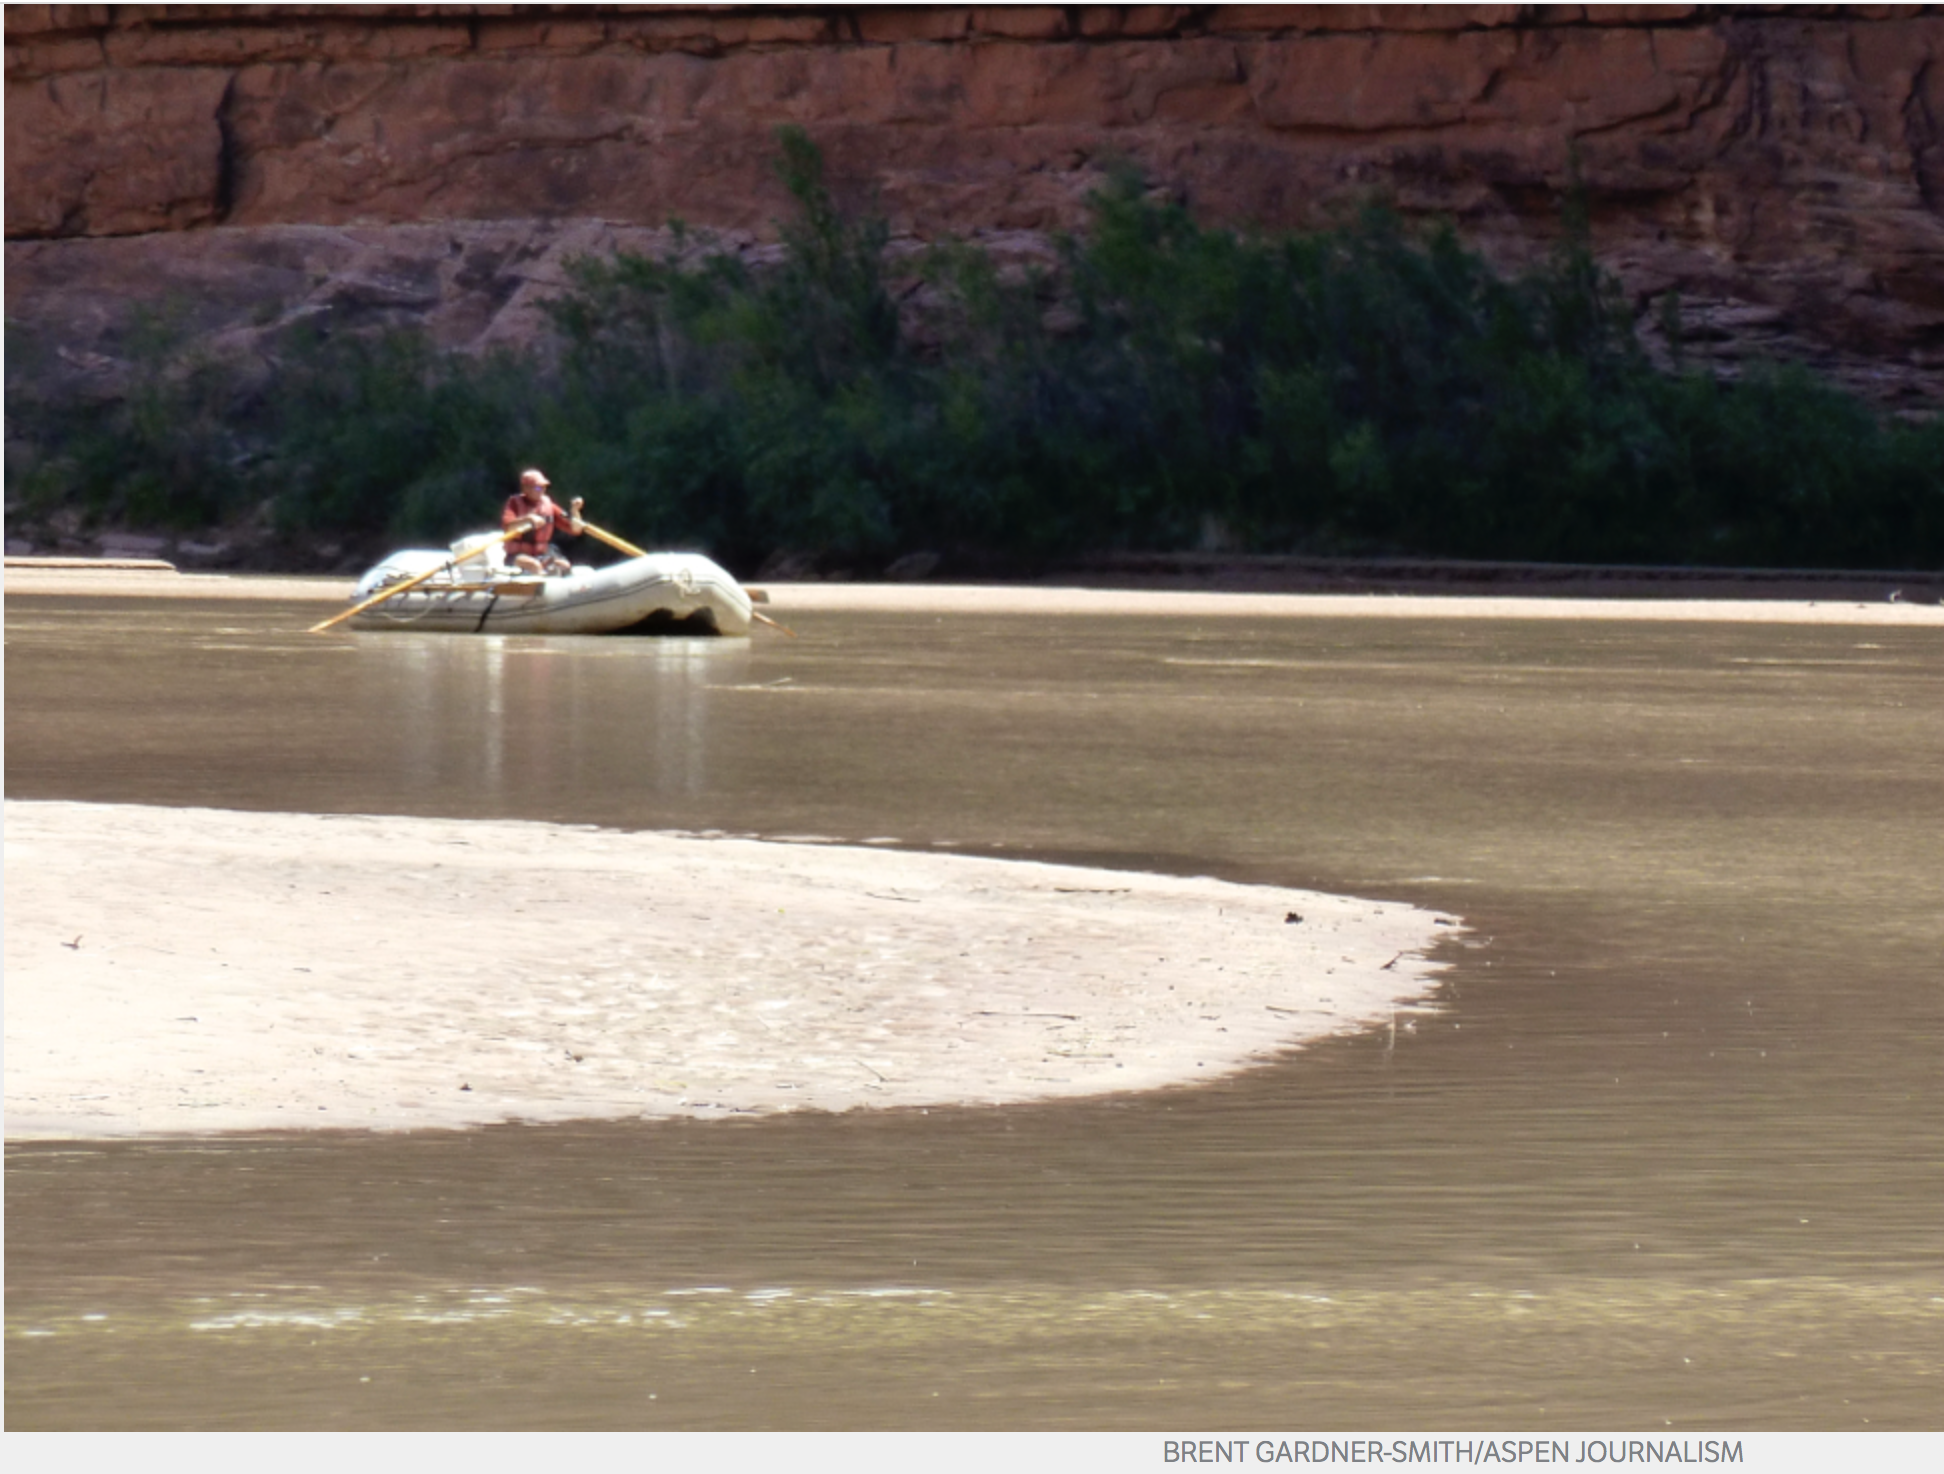
A boater, John Dufficy, makes his way down the lower end of the San Juan River toward the take-out, in 2014. Low flows on the San Juan can make exiting the river a tricky proposition due to the growing sandbars, but it’s not clear if potential releases of water from Navajo Reservoir to boost flows in Lake Powell will do much to change that. Photo Credit: Aspen Journalism/Brent Gardner-Smith
Tell experienced river runners that 2 million acre-feet of water — as much water as in 20 Ruedi Reservoirs — is going to be released from reservoirs and sent down the Green, Gunnison and San Juan rivers to boost falling water levels in Lake Powell, and they will likely have some good questions.
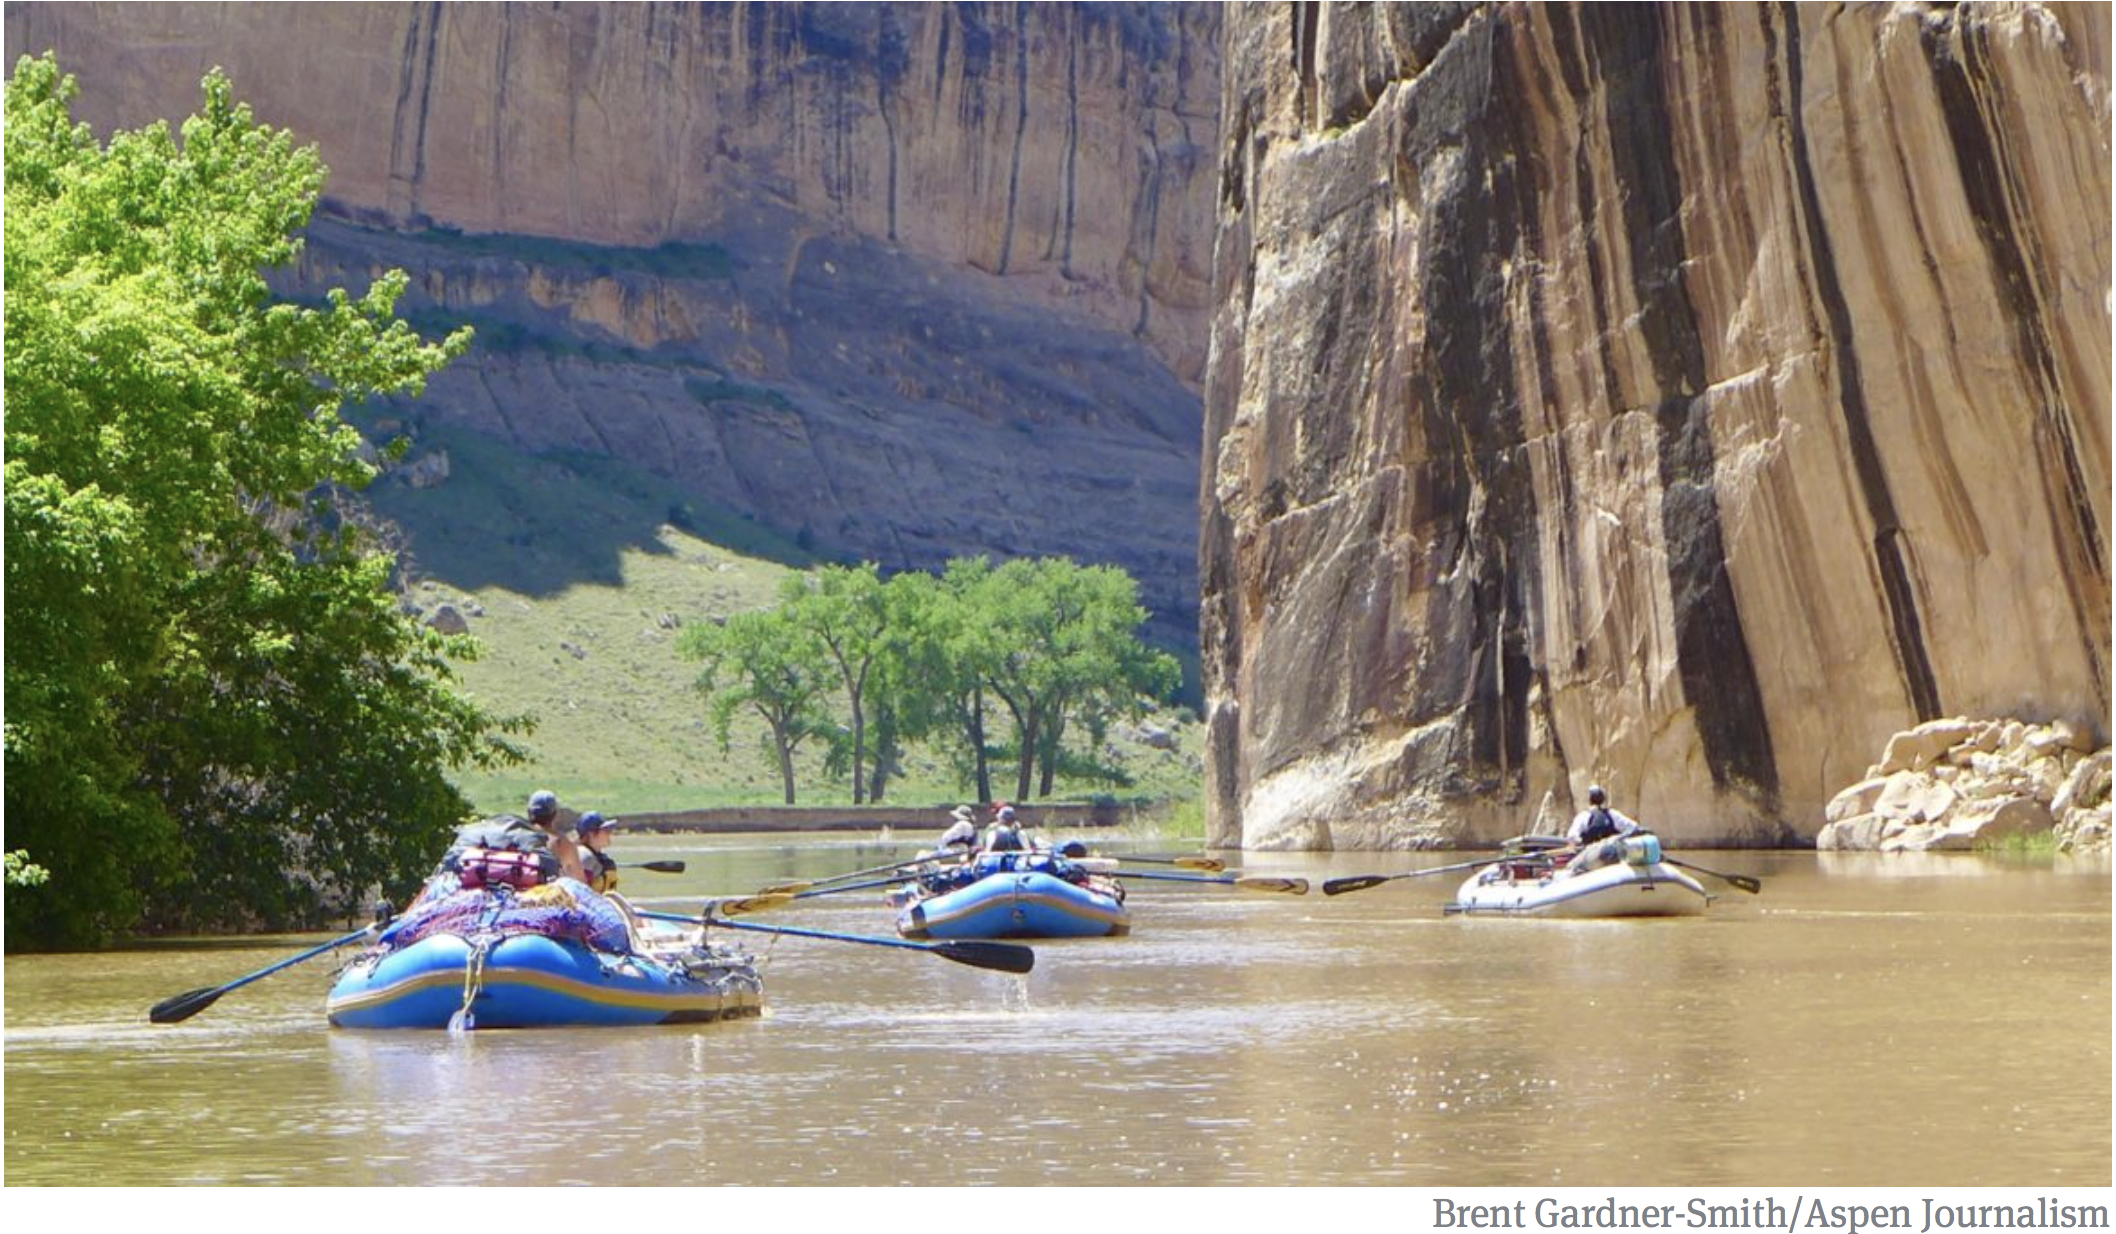
Will peak spring releases from Flaming Gorge Reservoir down the Green River turn Hell’s Half Mile in the Gates of Lodore into a raging maelstrom?
Will early-spring and late-summer releases out of Navajo Reservoir on the upper San Juan River make it easier to float over the growing sandbars in the river below Grand Gulch?
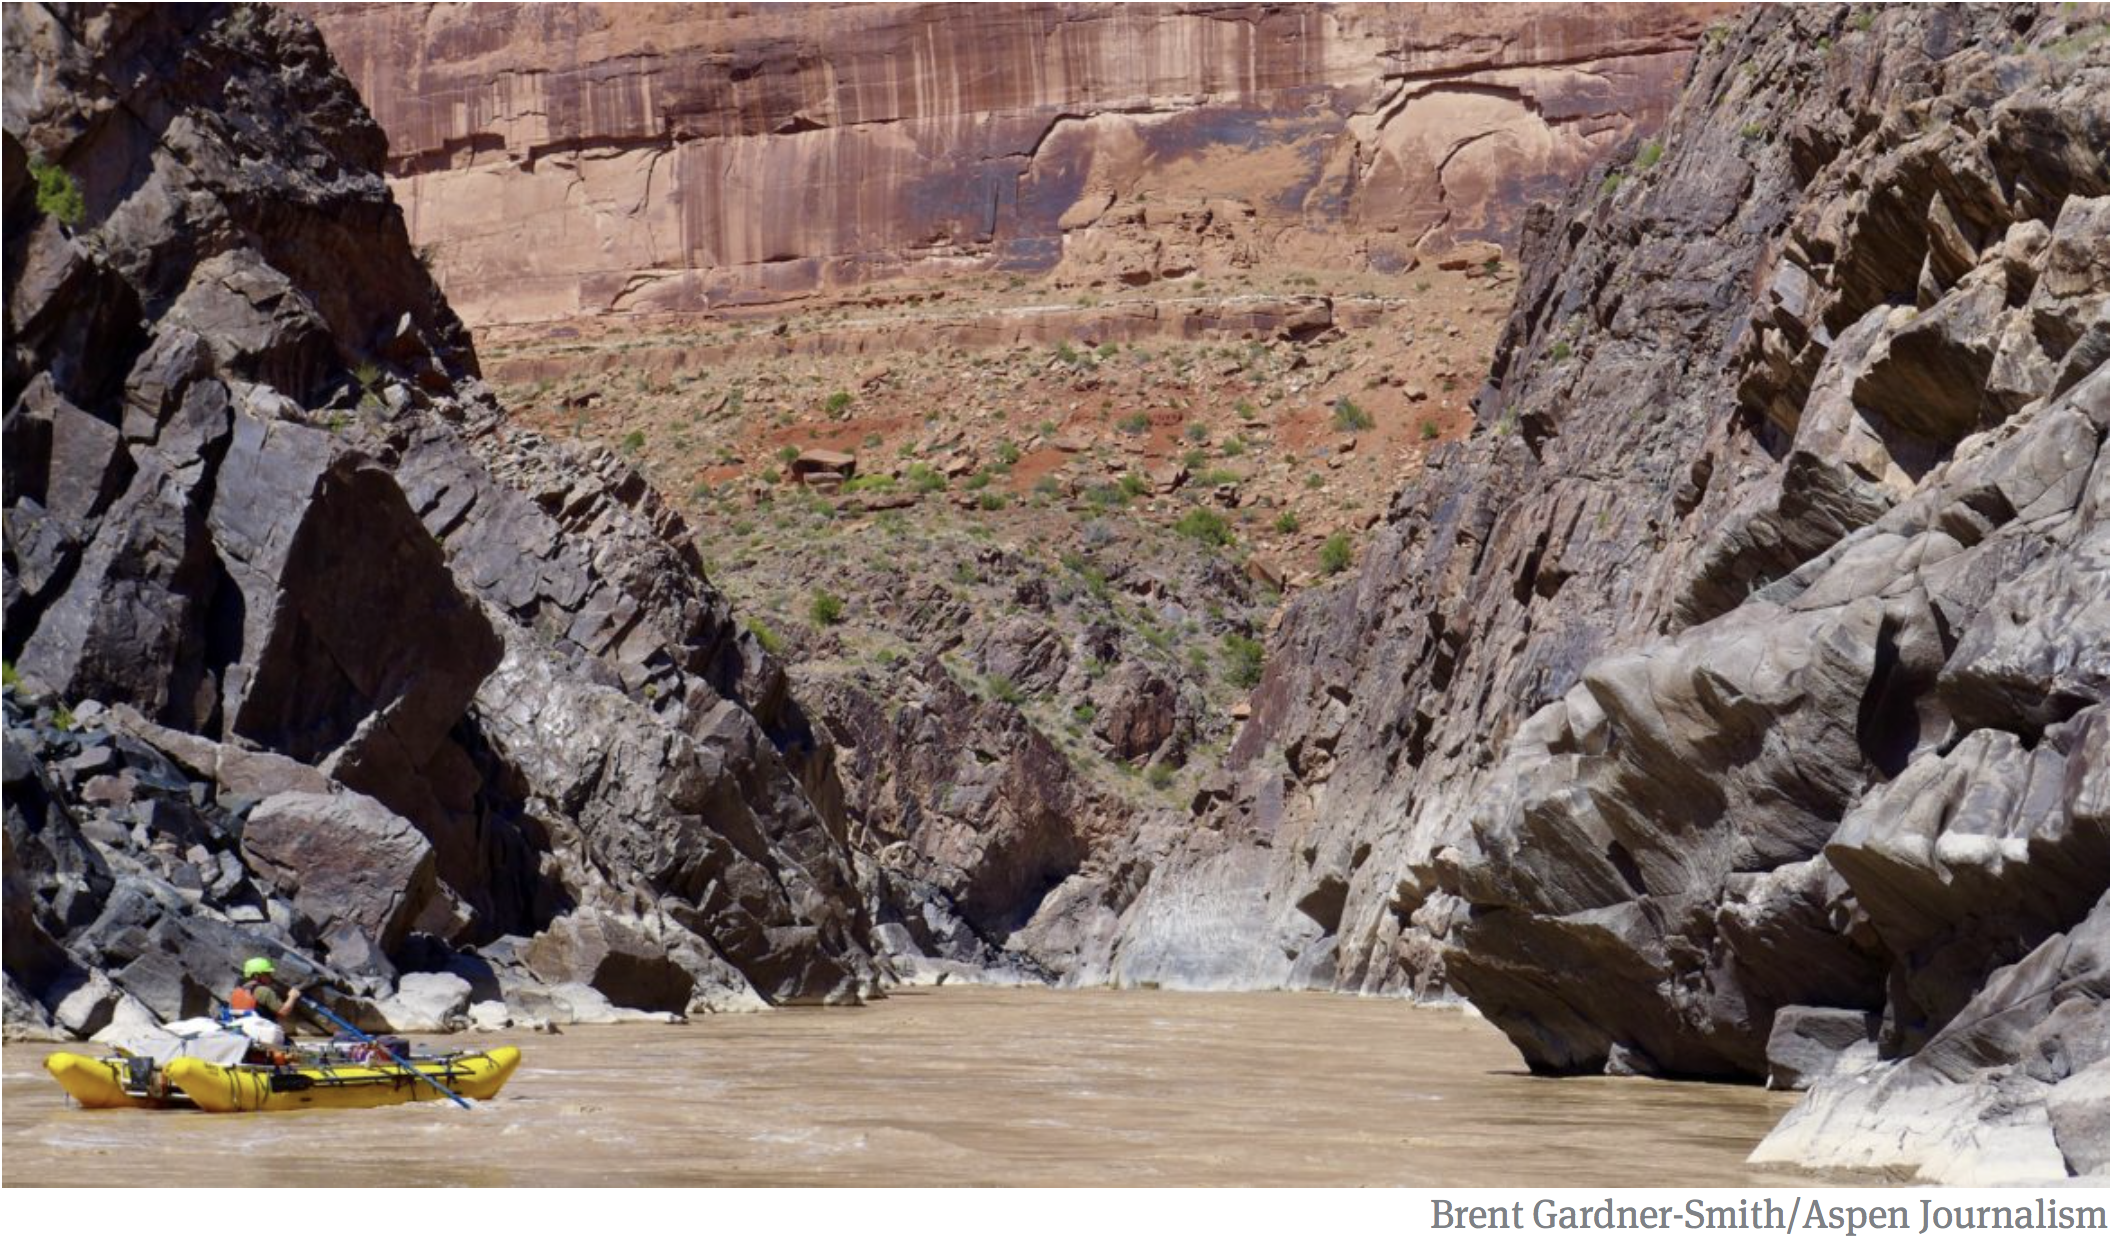
Will releases from Blue Mesa Reservoir run down the Gunnison River and into the Colorado River and make it likelier that flows past Skull Rapid in Westwater will stay longer in the “terrible teens,” or at flows over 13,000 cubic feet per second?
For now, there are no definitive answers to such questions, but one federal official suggests boaters may hardly notice the release of water from the three reservoirs.
An agreement was approved last week in Las Vegas by the Upper Colorado River Commission that sets up a process for Colorado, Utah, Wyoming and New Mexico, and the federal Bureau of Reclamation, to develop a plan to release about two million acre-feet of water from the three reservoirs, but it is, at this point, only an agreement to make a “drought operations” plan, when necessary.
“The agreement, importantly, doesn’t itself include a plan. Rather, it sets forth a process for establishing a plan based on modeling projections of Powell elevations,” Amy Haas, the director of the UCRC said during a presentation here last week at a meeting of the Colorado River Water Users Association.
Still, boaters want to know, where might the water come from under such a plan. When it will come? And will it make a difference on the river?
The answer to the last question, at least, is something akin to “no, not really.”
“I really don’t think it is going to be noticeable, because we see quite a bit of fluctuation in the upper basin in all of these systems, when we have abundance and when we have drought, and this fits within those bands,” said Brent Rhees, the regional director in the upper Colorado River basin for the Bureau of Reclamation, which operates Flaming Gorge, Blue Mesa and Navajo reservoirs, as well as Lake Powell.
It also says water will be released from all three reservoirs, though not necessarily at the same time, and an effort will also be made to balance hydropower needs.
The agreement gives regional water managers “sufficient flexibility to begin, end or adjust operations as needed based on actual hydrologic conditions” and retains Reclamation’s current authority to release water as it sees fit, within existing approvals, if there is an “imminent need to protect the target elevation at Lake Powell.”
A boater, Steve Skinner, makes his way toward Skull Rapid in Westwater Canyon. Future potential releases of water from Blue Mesa Reservoir down the Gunnison River and into the Colorado River could alter flows in Westwater, and boost water levels in Lake Powell. Photo credit: Aspen Journalism/Brent Gardner-Smith
Back-up buckets
Flaming Gorge, Navajo and Blue Mesa reservoirs were built, in large part, to serve as backup buckets to Lake Powell, but they have yet to be called upon for such duty.
Of the three reservoirs, Flaming Gorge is the largest, with a capacity to hold 3.8 million acre-feet of water behind its dam, which is in Utah near the Wyoming border.
Navajo Reservoir, which is in northern New Mexico, on the San Juan River, holds 1.7 million acre-feet.
And Blue Mesa Reservoir, one of three dams on the Gunnison River that make up what’s called the Aspinall Unit, holds 940,800 acre-feet.
Of course, before water can be released from reservoirs, they must have water in them — and that’s no longer a given.
Today, according to the Bureau of Reclamation, Blue Mesa is only 30 percent full, holding 248,220 acre-feet of water; Navajo is 52 percent full, holding 883,737 acre-feet; and Flaming Gorge is 88 percent full, holding 3.3 million acre-feet. (Please see “teacup” graphic, with current reservoir levels).
The water to be released, if needed, from the three reservoirs is meant to help maintain a target elevation for the surface of Lake Powell — as measured at the upstream face of Glen Canyon Dam — of 3,525 feet above sea level.
Today, Lake Powell is at 3,584 feet, or 59 feet above the target elevation. A year ago, the lake was at 3,623 feet, or 39 feet higher than it is today. (Lake Powell is 42 percent full, holding about 10.4 million acre-feet of water.)
So, if very dry conditions persist in the upper basin and the reservoir level keeps falling more than 30 feet a year, it’s possible that the critical elevation of 3,525 could be reached within two dry years.
A fleet of rafts makes its way down the Green River toward its confluence with the Yampa River. Future potential releases of water out of Flaming Gorge Reservoir to boost levels in Lake Powell shape the flows on the Green River, although it’s not clear how the releases may change flow levels. Photo credit: Aspen Journalism/Brent Gardner-Smity
Scary hydrology
The most recent 24-month forecast — issued by the Bureau of Reclamation on Wednesday — “projects Lake Powell elevation will end water year 2019 (at the end of September) near 3,571.23 feet with approximately 9.21 million acre-feet in storage,” or at 38 percent of capacity.
That means by October, Lake Powell is already projected to be 13 feet lower than it is today and only 46 feet above the target elevation of 3,525 feet.
Nothing physically occurs at Glen Canyon Dam at 3,525 feet, but it’s seen by regional water managers as an alarm bell on the way to the reservoir falling to 3,490 feet, or minimum power pool, which is when water can no longer be sent down intake tubes to the turbines in the dam.
At elevations below 3,490, when the reservoir is heading toward “dead pool,” it becomes ever harder to release water downstream through the dam’s outlets, which could mean the upper-basin states would fail to meet their collective obligation to send enough water to the lower-basin states (California, Arizona and Nevada) under the 1922 Colorado River Compact.
Although violating the compact was once seen as a far-off, distant possibility, it’s not seen that way anymore.
“In water year 2018, unregulated inflow volume to Lake Powell was 4.6 million acre-feet (43 percent of average), the third-driest year on record above 2002 and 1977,” says the Bureau of Reclamation’s latest forecast, issued Wednesday.
It also says that inflows into Lake Powell have been above average in only four of the past 19 years.
“The latest hydrology is sobering,” Bureau of Reclamation Commissioner Brenda Burman said last week during remarks at the water conference. “It is time for us to pay attention. We are quickly running out of time.”
Editor’s note: Aspen Journalism covers water and rivers with The Aspen Times. The Times published this story on Monday, Dec. 17, 2018.
Here’s the release from the University of Arizona (Mari N. Jensen):
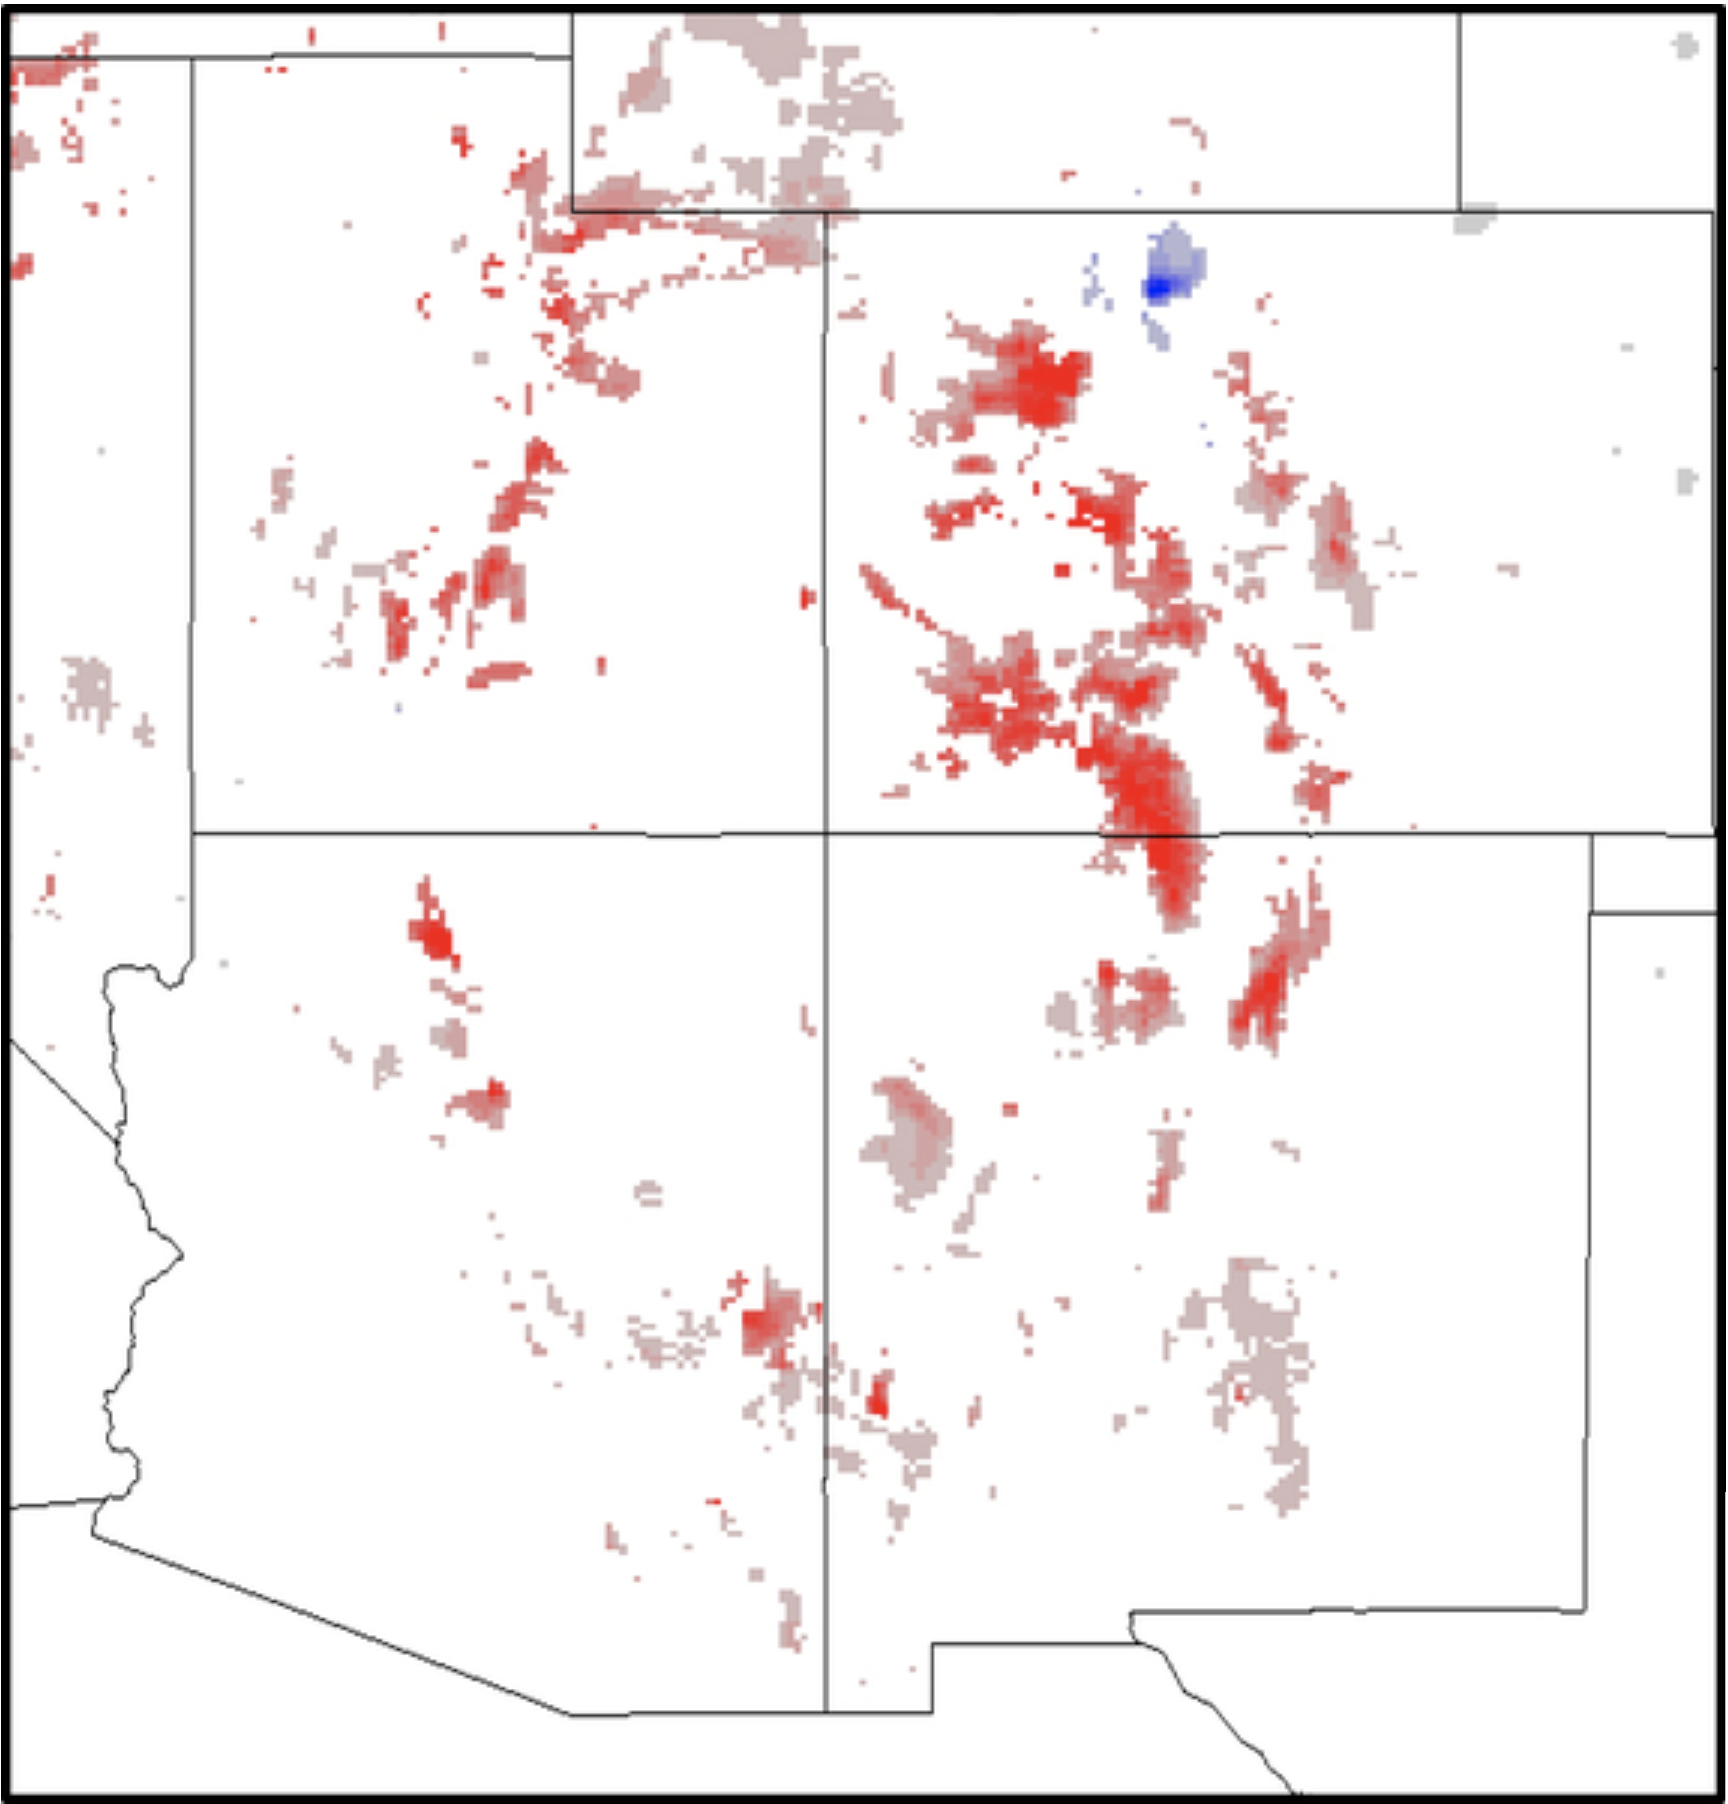
Researchers have now mapped exactly where in the Western U.S. snow mass has declined since 1982.
A University of Arizona-led research team mapped the changes in snow mass from 1982 to 2016 onto a grid of squares 2.5-miles on a side over the entire contiguous U.S.
A person could practically find the trend for their neighborhood, said first author Xubin Zeng, a UA professor of hydrology and atmospheric sciences. Grid size for previous studies was about 40 miles on a side, he said.
“This is the first time anyone has assessed the trend over the U.S. at the 2.5-mile by 2.5-mile pixel level over the 35-year period from 1982 to 2016,” Zeng said. “The annual maximum snow mass over the Western U.S. is decreasing.”
In the Eastern U.S., the researchers found very little decrease in snow mass.
Even in snowy regions of the West, most of the squares did not have a significant decrease in snow. However, some parts of the Western U.S. have had a 41 percent reduction in the yearly maximum mass of snow since 1982.
UA co-author Patrick Broxton said, “The big decreases are more often in the mountainous areas that are important for water supplies in the West.”
Snow mass is how much water it contains, which is important in regions where winter snows and subsequent snow melt contribute substantially to water resources. Snow melt contributes to groundwater and to surface water sources such as the Colorado River.
Snow is also important for winter sports and the associated tourism, which is a multi-billion-dollar industry in the U.S.
If all the squares in the Western U.S. that had a 41 percent reduction in snow mass were added up, the combined area would be equal in size to South Carolina, said Zeng, who holds the Agnese N. Haury Chair in Environment. He and his team looked at the interannual and multidecadal changes in snow mass for the contiguous U.S.
Zeng’s team also found over the period 1982-2016, the snow season shrank by 34 days on average for squares that, if combined, would equal the size of Virginia.
“The shortening of the snow season can be a late start or early ending or both,” Zeng said. “Over the Western U.S. an early ending is the primary reason. In contrast, in the Eastern U.S. the primary driver is a late beginning.”
Temperature and precipitation during the snow season also have different effects in the West compared with the East, the researchers found.
In the West, the multidecadal changes in snow mass are driven by the average temperature and accumulated precipitation for the season. The changes in the Eastern U.S. are driven primarily by temperature.
Previous estimates of interannual-to-multidecadal changes in snow mass used on-the-ground, or point, measurements of snow height and snow mass at specific stations throughout the contiguous U.S.
One such network of data is the National Weather Service Cooperative Observer Program (COOP), in which more than 10,000 volunteers take daily weather observations at specific sites throughout the U.S.
The other is the U.S. Department of Agriculture’s Snowpack Telemetry, or SNOTEL, network, an automated system that collects snowpack and other climatic data in the mountains of the Western U.S. However, for many locations, such measurements are unavailable.
Zeng and his colleagues used an innovative method to combine data collected by COOP and SNOTEL with a third data set called PRISM that gives temperature and precipitation data over all of the lower 48 states and is also based on on-the-ground measurements.
The result is a new data set that provides daily information about snow mass and snow depth from 1982 to the present for the entire contiguous U.S.
Developing the new dataset has allowed the UA-led research team to examine the changes in temperature, precipitation and snow mass from 1982 to 2016 for every 2.5-mile by 2.5-mile square in the contiguous U.S, as well as to study how snow can affect weather and climate.
“Snow is so reflective that it reflects a lot of the sunlight away from the ground. That affects air temperature and heat and moisture exchanges between the ground and the atmosphere,” said Broxton, an associate research scientist in the UA School of Natural Resources and the Environment.
Zeng is now working with NASA to figure out a way to use satellite measurements to estimate snow mass and snow depth.
Here’s the release from the Western Governors’ Association:
Western Governors formally approved four policy resolutions at the Western Governors’ Association 2018 Winter Meeting in Hawaii: Foreign Visitor Preclearance; Cybersecurity; Compensatory Mitigation; and Health Care in Western States.
WGA Policy Resolution 2019-01 Foreign Visitor Preclearance: In 2016, Western Governors adopted Policy Resolution 2016-02 Foreign Visitor Preclearance. It noted Governors’ support for expanded use of air preclearance operations at foreign airports to streamline legitimate international travel, further protect the safety and security of American citizens and international travelers, and ease burdens placed on small or rural airports that accept a significant number of international travelers. The updated resolution includes updated estimates of airport wait times and locations where preclearance agreements are in place. Read, download the resolution.
Policy Resolution 2019-02, Cybersecurity: The cybersecurity of their states and the nation is a high priority for Western Governors. In this new resolution, Western Governors encourage Congress and the Administration to fully fund state election security measures and to work cooperatively with states in developing election security legislation. The resolution also provides recommendations for increasing the cybersecurity workforce, addressing supply chain issues, improving cross-agency and cross-sector coordination, discouraging cyber intrusions of nation-state actors, incentivizing information-sharing and innovation, and preparing for attacks through real-world simulations. Read, download the resolution.
Policy Resolution 2019-03, Compensatory Mitigation: Mitigation plays an important role in wildlife management and conservation, and Western Governors utilize mitigation programs and policies in developing and executing species conservation strategies. In this new resolution, Western Governors call on federal agencies to adopt and implement state-supported compensatory mitigation programs and policies. This resolution also notes that mitigation of development impacts to habitat or natural resources must account for a level of risk and uncertainty that compensatory mitigation actions may fail to adequately offset adverse impacts to fish, wildlife and habitat and proposes several objectives to guide development of federal mitigation policy. Read, download the resolution.
Policy Resolution 2019-04, Health Care in Western States: Access to quality health care services is an important factor in maintaining and enhancing the quality of life in western states. This new resolution identifies health care challenges affecting western states, including health industry personnel shortages and access to behavioral health and substance use disorder services. It also outlines the Governors’ policy to address these challenges, including the deployment of broadband to promote telehealth and telemedicine access, and the importance of strong state-federal collaboration to ensure that all layers of government are working in the best interests of the West’s citizens. Read, download the resolution.
Western Governors enact new policy resolutions and amend existing resolutions on a bi-annual basis. All of WGA’s current resolutions can be found on our Resolutions Page.