Although it went down in Montrose County, statewide, voters lifted Prop DD to victory; 712,405 yes, to 692,377 no, according to unofficial results from the Colorado Secretary of State.
The revenue from taxing sports betting, estimated at about $30 million, is to be used to implement the Colorado Water Plan — a drop in the bucket, so to speak, of the billions implementation is expected to cost over the next few decades.
The Colorado River District, which supported Prop DD, viewed it as help with a “downpayment” for plan implementation. The water plan is a longer range strategy to balance water supply against growing needs; its provisions include more infrastructure for water storage, as well as conservation methods.
State Rep. Marc Catlin, R-Montrose, who represents House District 58, and who also represents Montrose County on the river district, left the county courthouse Tuesday night assuming DD was going down in defeat; after an initially favorable showing, the “no” votes began to dominate. But, by early Wednesday, the final unofficial results showed a win.
“We kind of raised the profile of water, but it had to come on gambling. I think people voted against gambling, rather than against water,” Catlin said.
“Now it’s up to the state of Colorado, and me — all of us in the state that have anything to do with this. Now is the time for a good project to be picked up in rural Colorado.”
Although to Catlin, urban areas seemed to support DD more than did voters in rural areas, a need for such projects is on the Western Slope and other non-metro areas, he said, and it’s time for the state to “square up” by offering feasible projects that will assure water plan success.
“It certainly is not going to fix all issues Colorado has with water, but it does prime the pump. That doesn’t mean the Legislature can now ignore it. Now is the time we really take it on in the state,” Catlin said.
He acknowledged the money DD is supposed to raise will not come close to fully funding the water plan.
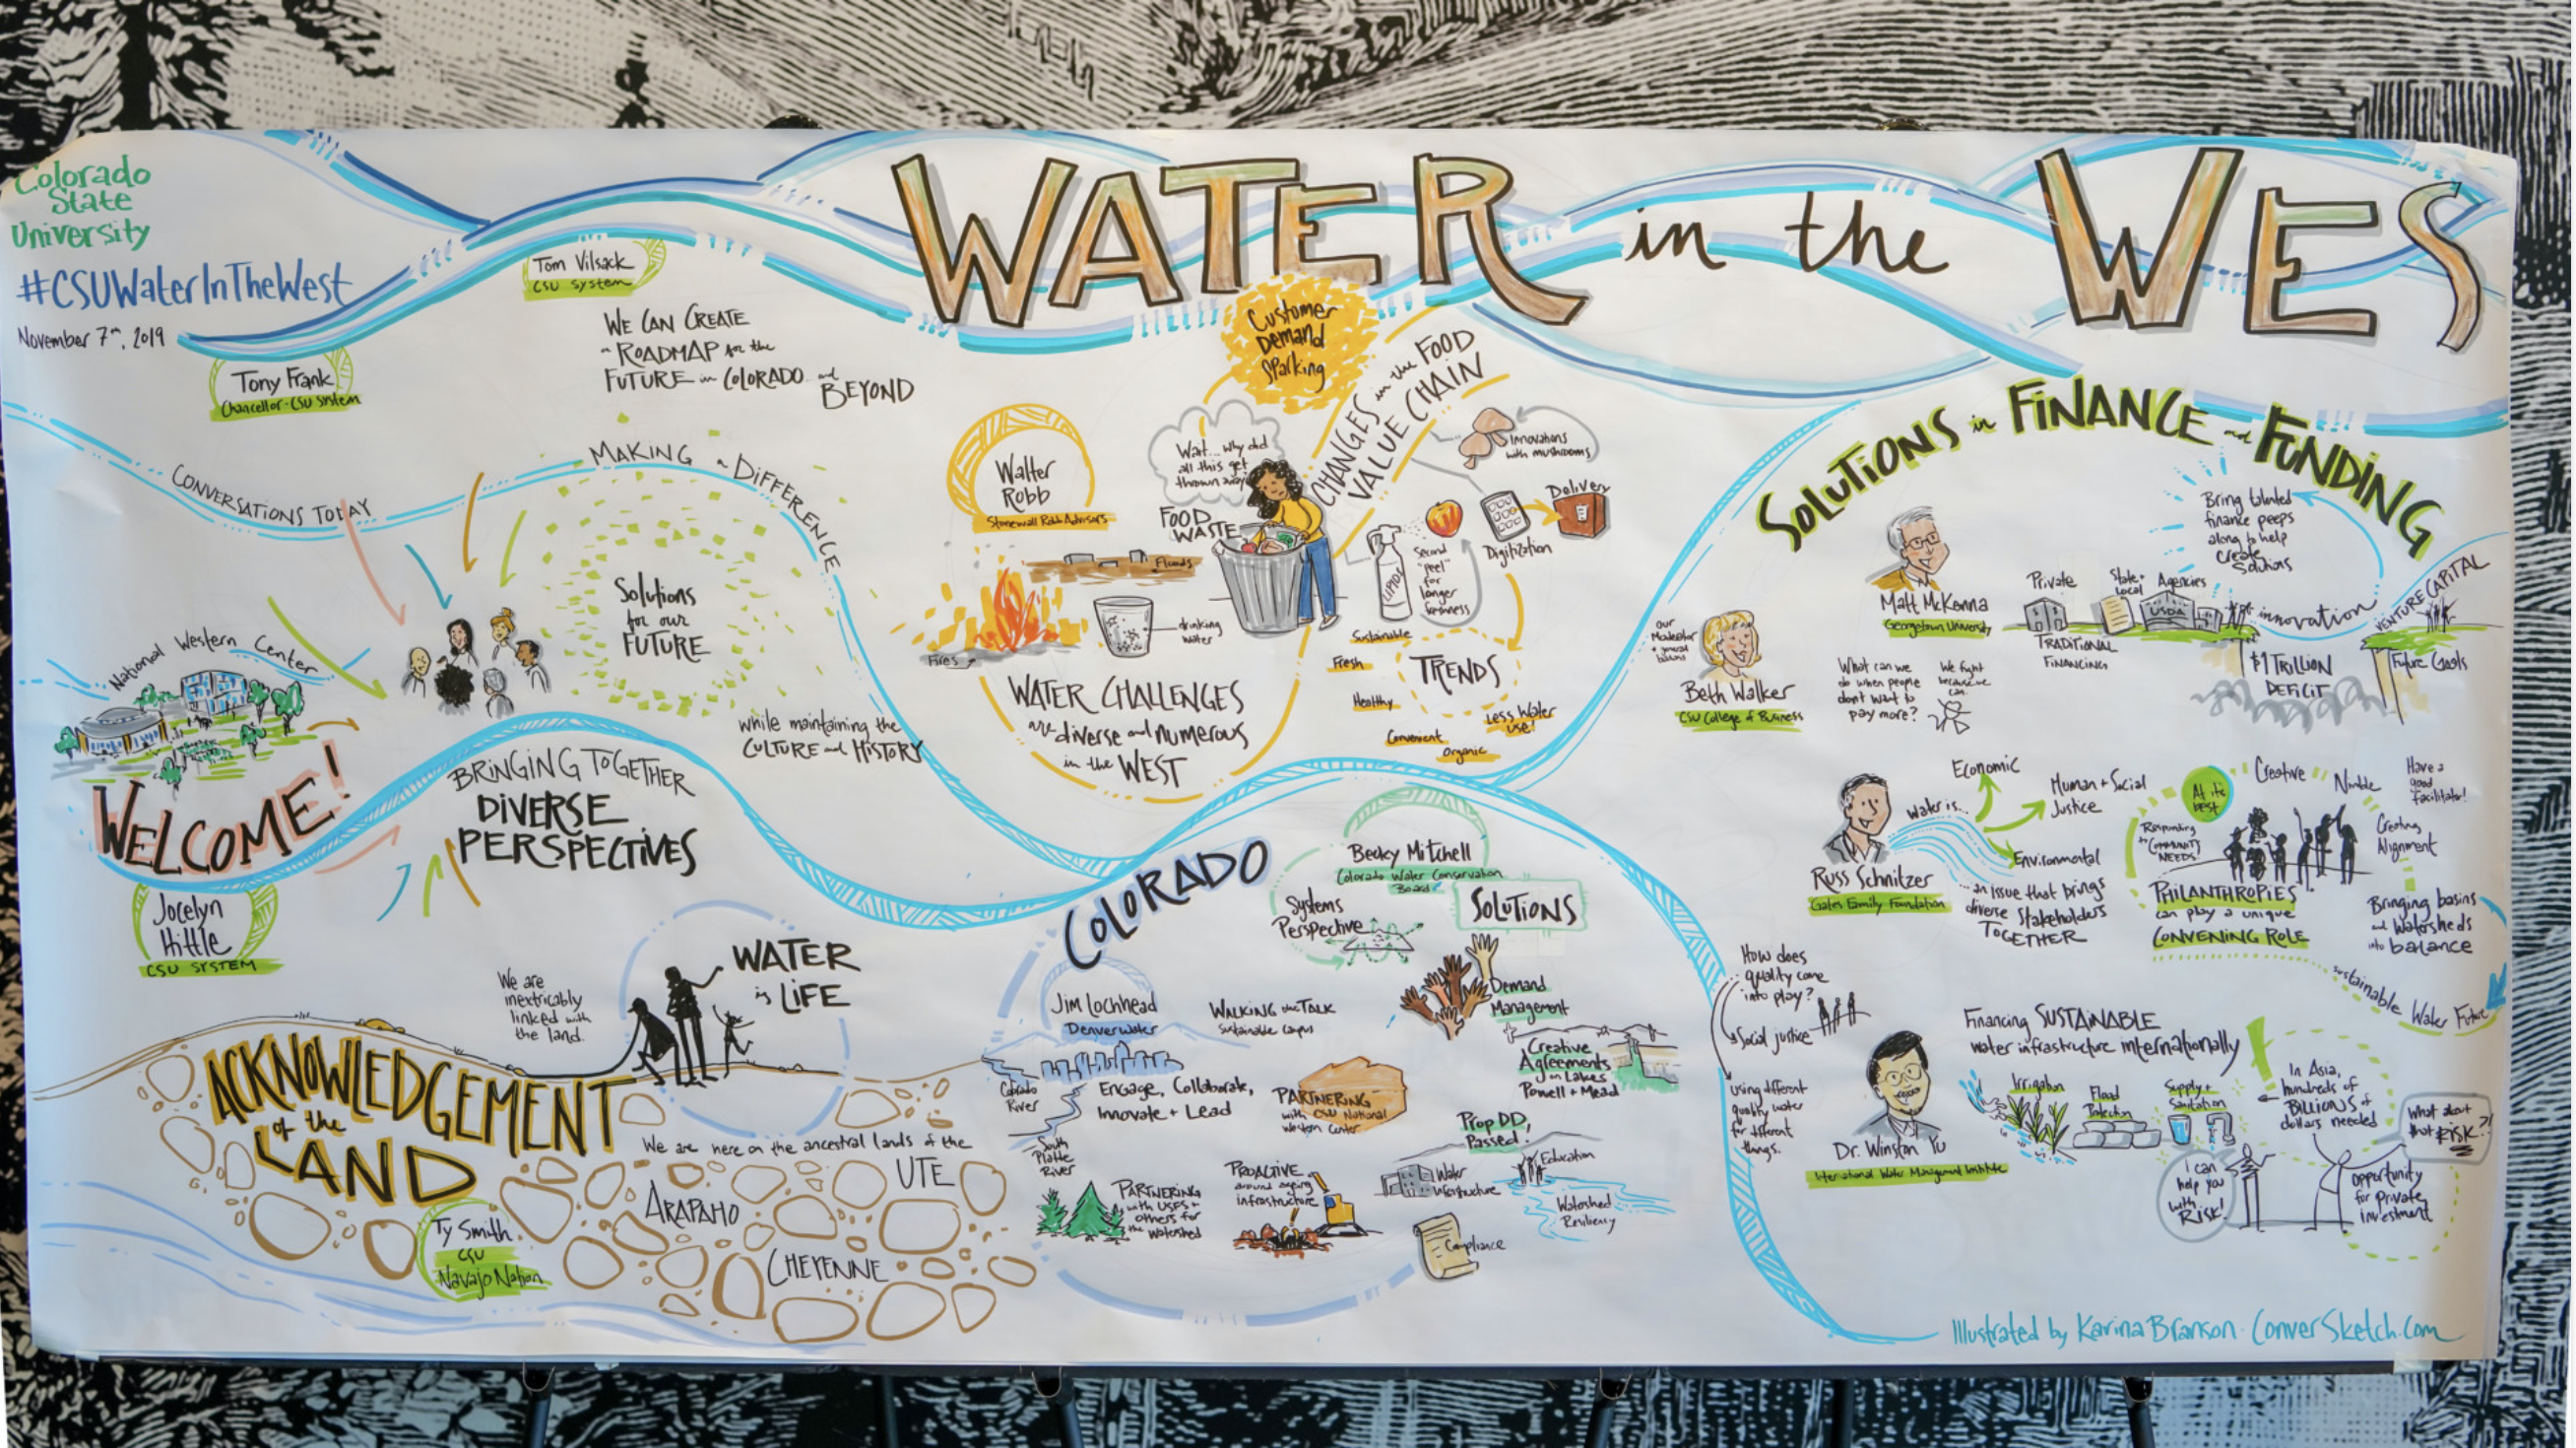
After a bomb cyclone postponed the 2019 Water in the West Symposium, the sold-out crowd convened today at the Gaylord Rockies Resort and Convention Center to discuss solutions to a broad range of water-related challenges.
The Symposium, a preliminary program offering of the Colorado State University System campus at the future National Western Center, drew more than 375 people from across sectors — from water management to conservation to agriculture — to hear from 26 expert speakers from across the country.
“Water issues are very difficult, but we’re confronting a very serious issue here. The work you do here today will impact not just this great state, region, and country – it will inform what happens in the rest of the U.S. and globally,” said Tom Vilsack, former U.S. Secretary of Agriculture and special advisor to the CSU System.
Walter Robb, former co-CEO of Whole Foods Market and founder of Stonewall Robb Advisors, was the event’s keynote speaker and largely focused on food trends, including the increasing consumer desire for sustainably sourced food. Data show that millennials lead the way in making sustainable buying choices, but overall consumer behavior indicates roughly one-quarter of consumers will purchase a product based on sustainability.
“Sustainability – however you define it – is increasingly a measure of success, and will continue to be,” Robb said. “The customer is driving this revolution.”
While about 80 percent of food currently comes from 12 plants and five animals, the future of food will be more diverse, more delicious, and more sustainable, Robb said.
“We’re seeing nothing short of a revolution in today’s food value chain… how do we continue to innovate across the supply chain?”
Symposium panels focused on solutions, with topics across finance, recreation and the environment, food, beverage, and agriculture, and data and technology.
In early 2020, the CSU System will break ground on three buildings as part of the National Western Center campus near the intersection of interstates 25 and 70, a 250-acre redevelopment project at and around the current National Western Stock Show facilities.
The CSU spaces will be open to the public for experiential education, as well as a convening space for world-class researchers to collaborate on solutions to global issues around food, water, and human and animal health.
The inaugural Water in the West Symposium was held in 2018, and showcases CSU System’s plans to convene the greatest minds around the most pressing challenges of today; similar programs and events will be hosted within the future CSU Campus at the National Western Center when the location opens in 2022.
“If there is one overarching goal that I have for this Symposium, it’s that it will make a difference,” said Dr. Tony Frank, chancellor of the CSU System. “CSU has long been an expert in water issues, and the CSU Campus at the National Western Center will place these conversations on an even larger stage.”
“The University has a responsibility to use its resources and position as a land-grant institution to take the lead in convening conversations and efforts around these important global issues.”
Colorado State University Campus at the National Western Center
Colorado State University has made a long-term commitment to the future National Western Center and its surrounding communities in north Denver.
The CSU Campus at the National Western Center will focus on research and educational programming in the areas of food, water, sustainability, and human and animal health within its three buildings: the CSU Water Building, CSU Animal Health Complex, and CSU Center for Food and Agriculture. What’s inside the buildings will bring together the brightest minds, inspire the next generation, and address global challenges.
The University is currently working to engage with the community and to partner with local schools, nonprofits, and businesses to create impactful research, collaboration, and year-round programming to this unique project.
It was an informative and thought-provoking program. Good speakers and I loved the focus on solutions. Click here to view the hash tag #CSUWaterInTheWest (click on the “Latest” tab). It was a pretty good Twitter fest yesterday.
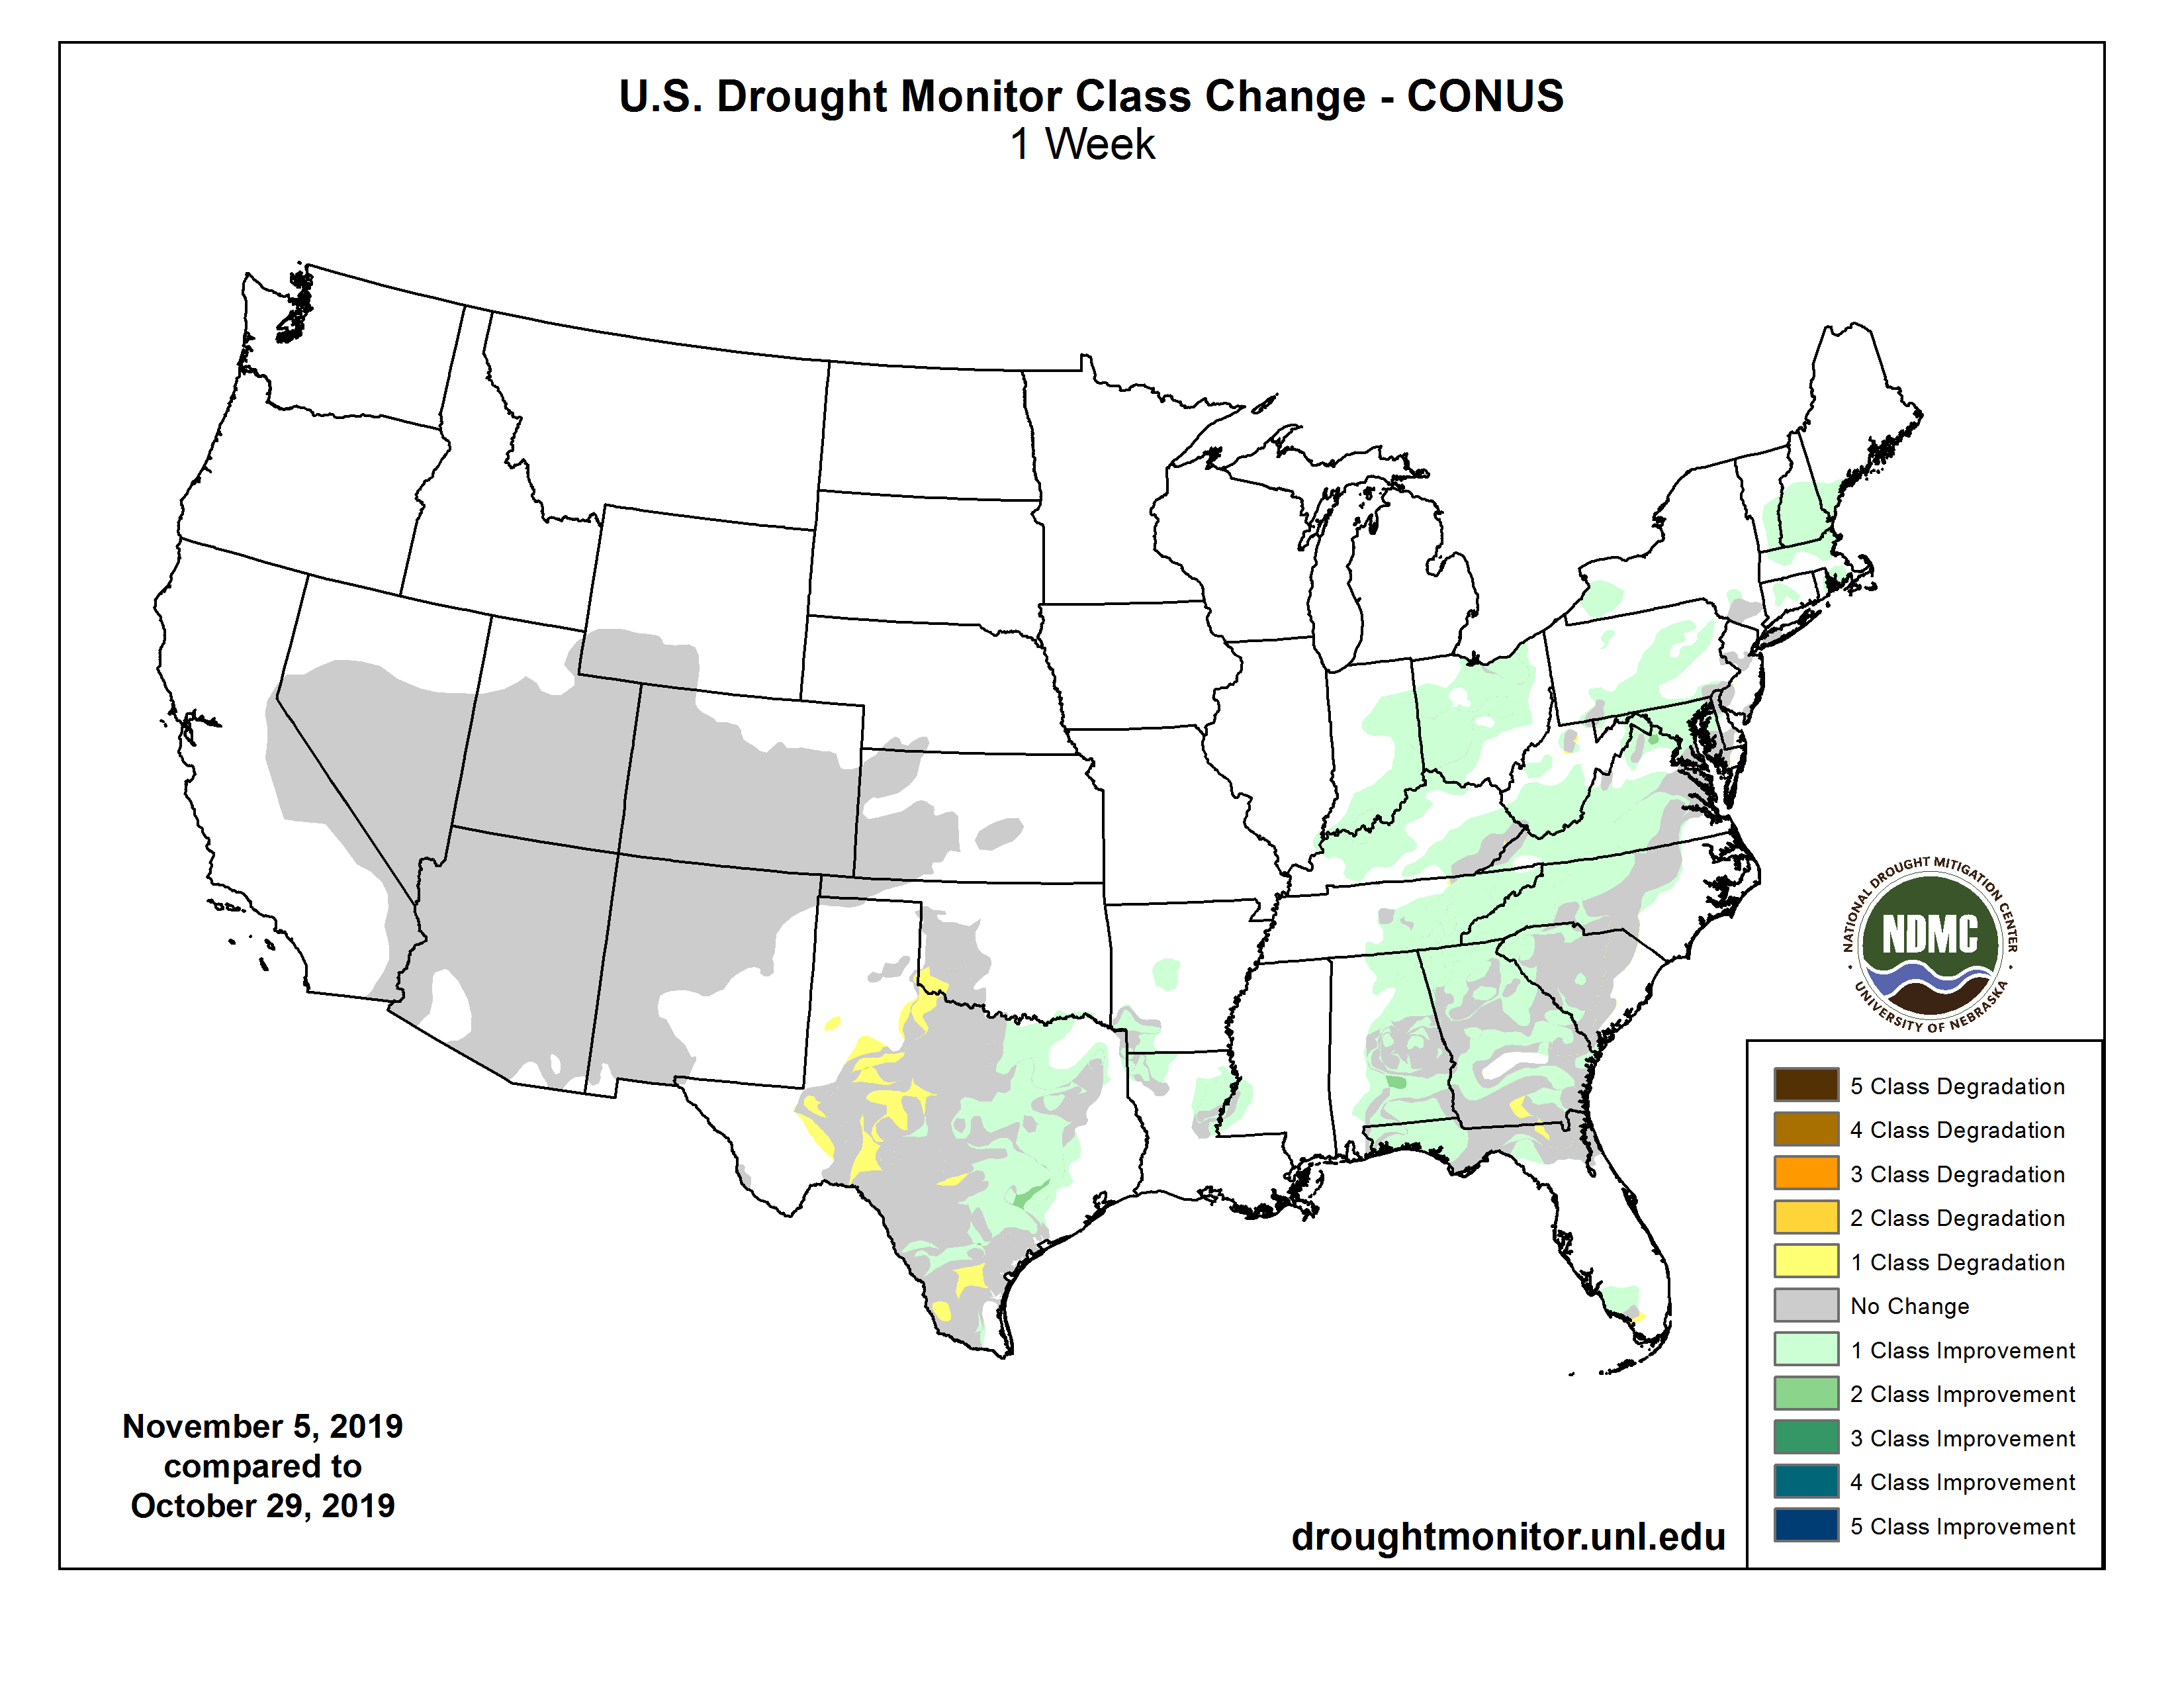
Click on a thumbnail graphic to view a gallery of drought data from the US Drought Monitor.
US Drought Monitor November 5, 2019.
West Drought Monitor November 5, 2019.
Colorado Drought Monitor November 5, 2019.
Click here to go to the US Drought Monitor website. Here’s an excerpt:
This Week’s Drought Summary
This U.S. Drought Monitor week saw continued improvements in drought conditions as a large-scale, low-pressure system last week delivered moderate-to-heavy precipitation accumulations ranging from 2 to 7 inches leading to widespread improvements across portions of the South, Southeast, Mid-Atlantic, and the lower Midwest. For October, these regions saw well-above-normal precipitation that has helped alleviate drought conditions, especially in the Southeast. Out West, generally dry conditions prevailed with the exception of some mountain snow showers in the central and northern Rockies of Montana, Wyoming, and Colorado. In California, fire-weather conditions improved allowing firefighters in southern and northern California to help contain several large wildfires. According to the NOAA National Centers for Environmental Information (NCEI), the contiguous U.S. experienced its 21st coolest and 8th wettest October on record…
On this week’s map, no changes were made across the region. For the week, the entire region was relatively dry with below-normal temperatures. Average temperatures ranged from 2-to-20 degrees below normal with the greatest negative anomalies observed in north-central and eastern Wyoming as well as eastern Colorado. According to NOAA NCEI, the Northern Rockies and Plains Climate Region experienced its 4th coolest and 26th wettest October on record. Additionally, the region had its wettest 3-month (Aug-Oct 2019), 9-month (Feb-Oct 2019), and 12-month (Nov 2018-Oct-2019) periods on record…
On this week’s map, no changes were made in the region. An on-going assessment of the abnormally dry conditions in California (since the beginning of the wet season) is currently underway by the U.S. Drought Monitor and the California Drought Coordination Team in order to ascertain the spatial extent and possible impacts being observed across the state. From a hydrologic perspective, despite below-normal precipitation during the past 60 days, nearly all of California’s major reservoirs are currently at or above historical averages for this time of year. Elsewhere in the region, portions of the central and northern Rockies received some snow shower activity during this past week. According the NWS NOHRSC’s regional snow analyses, 68.8% of the Northern Rockies and 59.7% of the Central Rockies are currently covered by snow. Additionally, the NRCS SNOTEL network is showing above-normal Water Year to Date (Since Oct 1) precipitation (liquid and frozen) in the mountains of northeastern Oregon, central Idaho, western Montana, northern Wyoming, and north-central Colorado. Elsewhere, stations are reporting below-normal precipitation for the same period. According to NOAA NCEI, the West Climate Region experienced its 11th driest and 19th coolest October on record while the Northwest Climate Region had its 49th driest and 2nd coolest October…
One this week’s map, recent rainfall across eastern portions of Texas, Arkansas, Louisiana, Mississippi, and Tennessee led to continued widespread improvement in conditions. Rainfall accumulations across the region ranged from 1 to 8 inches with the heaviest accumulations observed in Mississippi. This week’s precipitation improved soil moisture and streamflows leading to one-category improvements in areas of Severe Drought (D2), Moderate Drought (D1), and Abnormally Dry (D0). In portions of southern, central, and western Texas, dry conditions prevailed leading to some minor expansion of drought. As a region, the South experienced its 23rd wettest October on record, while at a state level Mississippi experienced its wettest October on record. For the week, average temperatures were below normal across the entire region with the greatest negative anomalies observed across the northern half of Texas and western Oklahoma where temperatures were 10-to-20 degrees below normal. As a region, the South Climate Region had its 36th coolest on record for October…
Looking Ahead
The NWS WPC 7-Day Quantitative Precipitation Forecast (QPF) calls for moderate-to-heavy accumulations ranging from 1 to 4 inches across a swath extending from northern Texas to Kentucky later this week. Further south, light-to-moderate accumulations (1-to-2 inches) are expected along the Gulf Coast and in south Texas. Along the Great Lakes and the Northeast, periods of precipitation (accumulations generally <1 inch liquid), including some heavy lake-effect snowfall, are expected. Out West, primarily warm and dry conditions will prevail with the exception of northern portions of the Pacific Northwest and northern Rockies that may see periods of mountain snow. The CPC 6–10-day Outlook calls for a high probability of above-normal temperatures west of the Rockies while areas east of the Rockies are expected to be below normal. In terms of precipitation, there is a moderate-to-high probability of below-normal levels across most of the West including the Intermountain West, Great Basin, California, and the Pacific Northwest while there is a moderate probability of above-normal precipitation in eastern Montana and western portions of the northern Plains. Likewise, above-normal precipitation (moderate probability) is expected in the southern tier from Texas to Florida and extending up the Eastern Seaboard.
US Drought Monitor one week change map ending November 5. 2019.
Colorado voters have narrowly passed a measure that will legalize sports betting and use the taxes raised to fund projects outlined in the Colorado Water Plan.
As votes trickled in Tuesday night, the measure remained too close to call; at some points, the margin was just a few hundred votes. But by Wednesday evening the “yes” votes had decisively pulled ahead.
The unofficial results from the Colorado Secretary of State website show that 50.81 percent of voters supported Proposition DD and 49.19 percent were against it — a difference of more than 23,000 votes.
Pitkin, Eagle and Summit counties passed the measure, with 61 percent, 59 percent and 58 percent of voters, respectively, supporting it. Fifty-two percent of voters in Garfield County voted against Proposition DD.
Beginning May 1, 2020, the state is authorized to collect a 10 percent tax up to $29 million (but probably closer to $15 million) a year from casino’s sports-betting proceeds. The money will go toward funding projects that align with the goals outlined in the water plan, as well as toward meeting interstate obligations such as the Colorado River Compact.
The funds would be administered by the Colorado Water Conservation Board, a statewide agency charged with managing Colorado’s water supply.
District 5 State Sen. Kerry Donovan, who was a sponsor of the legislation behind Proposition DD, said going into Election Day she wasn’t sure whether it would pass. With Colorado’s growing population and the looming threat of climate change, the Western Slope will see an increasingly large burden when it comes to water supply, she said.
“As a rancher and a Western Slope native, I am really excited the state has decided to invest in the future of water in Colorado,” she said.
Wolford Mountain Reservoir. An aerial view of Wolford Reservoir, formed by Ritschard Dam. The Colorado Water Plan outlines many different types of projects, including reservoirs and dams, that need funding.
Water Plan funding
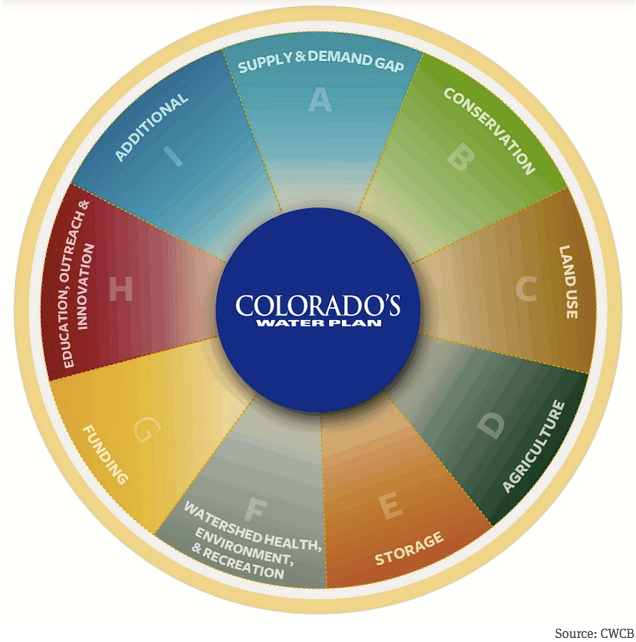
Funding the water plan could mean a number of things. Outlined in a 567-page policy document, the water plan does not prescribe or endorse specific projects, but, instead, sets Colorado’s water values, goals and measurable objectives. According to the water plan, there is an estimated funding gap of $100 million per year over 30 years, but CWCB officials have said that number is an estimate and not precise.
Some of the projects outlined in the water plan stand in opposition to one another — for example, stream-restoration projects with an emphasis on environmental health and building or expanding dams and reservoirs that would divert and impound more Colorado River water.
CWCB director Becky Mitchell highlighted that the money could indeed go toward many different types of projects.
“I think the most exciting thing for us is that we will have a more permanent pool of funding and it will support all types of projects,” Mitchell said. “So, whether it’s a watershed health or agricultural project or storage project or recreational project, the benefit of a more permanent source of funding is to have secure funding for all types of projects.”
In addition to being distributed in the form of water-plan grants, the revenue could also be spent to ensure compliance with interstate compacts and to pay water users for temporary and voluntary reductions in consumptive use. That could mean a demand-management program — the feasibility of which the state is currently studying — in which agricultural water users would be paid to leave more water in the river.
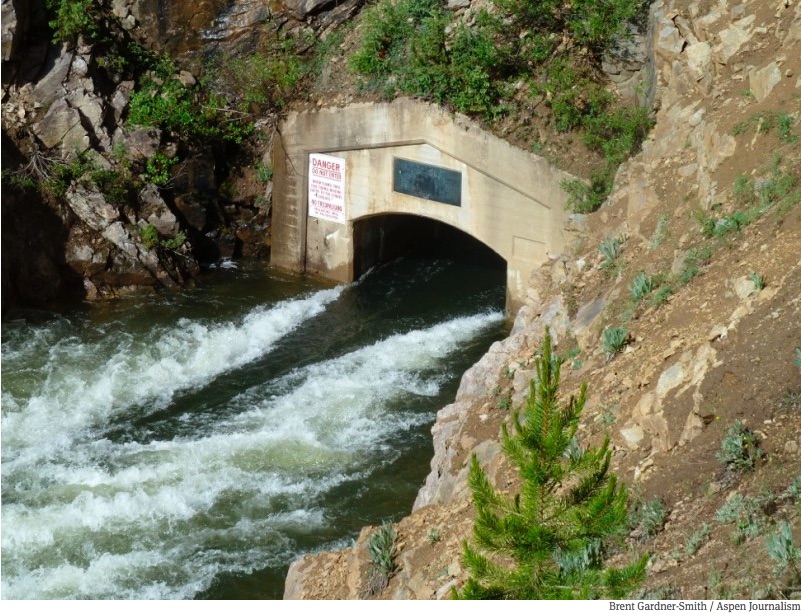
Pitkin County is using this irrigation system to grow potatoes for vodka on county open space land. The state is exploring how a voluntary, temporary and compensated water-use reduction plan, known as demand management, could incentivize irrigators to leave more water in the river. Photo credit: Brent Gardner-Smith/Aspen Journalism
Broad support
The measure had received broad support from environmental organizations, agriculture interests, water-conservation districts and even Aspen Skiing Company.
Glenwood Springs-based Colorado River Water Conservation District also supported Proposition DD. While the estimated $15 million a year is a good start, river district community affairs director Jim Pokrandt stressed it’s not enough to implement all the projects outlined in the water plan.
“What this does is creates a funding stream,” he said. “And it’s really only a down payment. What we don’t want to see is the other funding streams diminish because everybody will say ‘Oh, you got (Proposition DD).’”
Although there wasn’t much organized opposition to Proposition DD, the measure asked voters to consider three complex topics in one question: a new tax, legalizing sports betting and funding the water plan.
Political Action Committee Yes on Proposition DD spent more than $2.3 million, which came mostly from casino and gaming interests, on its campaign. The only registered group in opposition was small-scale issue committee Coloradans for Climate Justice, which argued that fossil-fuel companies should pay for the damage to water-supply systems caused by climate change.
Editor’s note: Aspen Journalism collaborates with The Aspen Times and other Swift Communications newspapers on coverage of rivers and water. This story appeared in the Times Nov. 6 edition.
From email from the Colorado Water Conservation Board (Sara Leonard):
Colorado voters have officially passed ballot measure Prop DD (50.71% Yes to 49.29% No), which will legalize sports betting in the state and create a tax of 10% on proceeds to fund the Colorado Water Plan Grant Program.
Official statement from Colorado Water Conservation Board Director Rebecca Mitchell:
“Thanks to Colorado voters’ approval of Proposition DD, the Colorado Water Plan will have a permanent, dedicated funding source. Sports betting tax revenue for the Water Plan will support critical environmental, agriculture, and storage projects as well as promote outdoor recreation opportunities across the state.”
The South Platte River runs by a utility plant near I-25 in Denver.
It took until Wednesday afternoon, but Colorado’s Water Plan is getting a significant financial boost.
Proposition DD, the statutory measure that institutes a 10%, $29 million tax on recently legalized casino sports betting, was still too close to call Tuesday night, but by Wednesday afternoon around 2:30 p.m., the ayes had it. DD won a 50.7% approval with about 12% of the vote left to count.
A yes vote means the water plan, a multi-faceted, highly complex living document that seeks to implement measures to conserve and protect Colorado’s precious water resources, would receive some much-needed funding.
Proposition DD received broad bi-partisan support across the state, from the Colorado Farm Bureau and the Colorado Cattlemen’s Association to Democratic and Republican legislators and environmental groups.
But there were detractors. Some Weld County farmers felt the water plan left them out, and at least one local state senator, Jerry Sonnenberg, didn’t feel gamblers should have to pay for a tax that benefited all Coloradans.
Proponents admitted that the water plan isn’t perfect, and that there are some crucial compromises made in the implementation, but said that the nature of its construction, which uses local roundtables to build and develop the plan for the sake of each distinct basin in the state, is the best way to achieve the kind of broad and dynamic action needed to save the resource in the growing state long-term.
Bill Jerke, a former Weld County commissioner and former statehouse representative, has said that Proposition DD is a win for bipartisanship. Cattlemen’s Association executive vice president Terry Frankhauser invited those concerned to get involved.
It was a nail-biter, but Proposition DD has passed, ushering in the state’s first legal sports bets.
Colorado has joined 19 other states in jumping on the bandwagon after the U.S. Supreme Court threw out the near-nationwide ban on sports gambling in 2018…
Where do the taxes for sports gambling go?
Casinos will essentially pay a 10 percent tax on profits from sports gambling wagers. That is expected to raise about $15 million annually by the second full year of taking wagers. The bulk of the collections will go to the Colorado Water Plan, a long list of projects agreed to by lawmakers to help prepare for future population growth and make the state more resilient to climate change. It’s not a lot of tax revenue, but advocates say it’s a start to handling some of the $3 billion shortfall for the plan. Some of the money will also go to behavioral health services and addiction hotlines for gamblers.
Click here to read the current assessment. Click here to go to the NIDIS website hosted by the Colorado Climate Center. Here’s the summary:
It was a colder than normal year for trick-or-treaters across most all of the Intermountain West, as an early cold season arctic airmass dug into the region. Weekly temperature anomalies were more than 15 degrees below normal for much of Utah, Wyoming, and Colorado. October temperatures were a sharp contrast from the much warmer than average September. Utah, Wyoming, and Colorado October temperatures were among the top ten coldest on record going back to 1895.
Last week’s deep cold frontal passage did lead to some decent moisture totals east of the Continental Divide, and some more modest moisture west of the Continental Divide. Headwaters of the South Platte and Arkansas Basins recorded 0.50-1.00″ of precipitation. Most of this moisture fell as snow. Snowpack levels for major river basins across Wyoming, northern Utah, and most of Colorado are above normal to start the season. However, southern Utah and southwest Colorado are still behind on snow. Furthermore, it’s still early. Two weeks of dry weather would erase existing snowpack surpluses.
The Intermountain West continues to balance the impacts of short-term dryness against the impacts of a great 2019 snow season. Surface water supplies in stream and reservoirs are still, by and large, healthy. 7-day average streamflows are beginning to lean dry in the Four Corners area. Meanwhile, southest Colorado is reporting precipitation defictis of 5-10″ since the beginning of July. It will likely take more than a couple storms to close these deficits. Impacts from short-term drought include dry soils, stressed vegetation, difficult winter wheat planting conditions, and stunted late season grass growth for ranchers.
Recent cold weather and snow in the high country has at least mitigated fire concerns. The Decker Fire south of Salida, CO is now 100% contained. As the temperatures cool and the snow settles, we say “farewell” to the 2019 growing season (and hopefully fire season as well). We now play the waiting game to see how WY 2020 snowpack will build across the UCRB. The southern portion of the UCRB will be disadvantaged come springtime by the dry soils in place now. The Variable Infiltration Capacity model is indicating bottom 10th percentile soil moisture storage for southern Utah and western Colorado.
The near-term weather outlook shows dry conditions prevailing across most of the Intermountain West. A large high pressure ridge off the West Coast is blocking Western US access to some much needed Pacific moisture. Models are suggesting 0.25-0.50″ of moisture is likely for southern New Mexico this week, and that another cold front or two may clip eastern Wyoming and northern Colorado. Relief is not currently in sight for the drought-stricken Four Corners area.
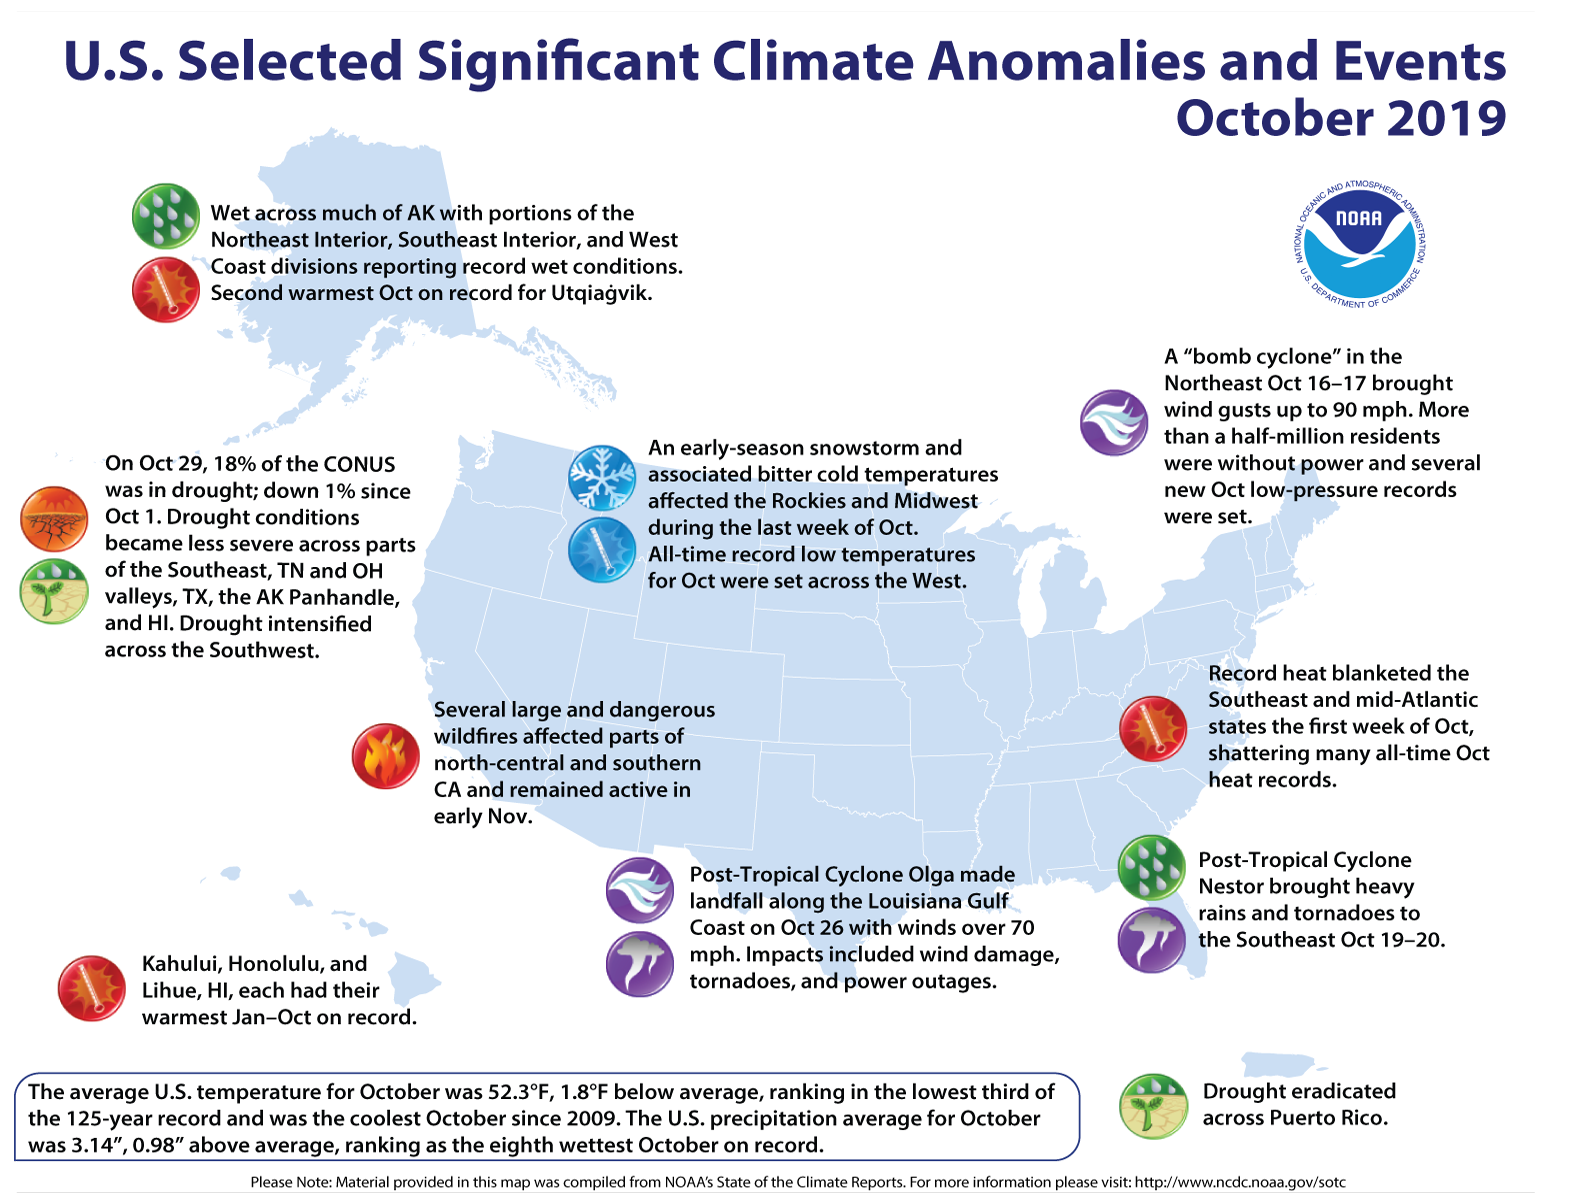
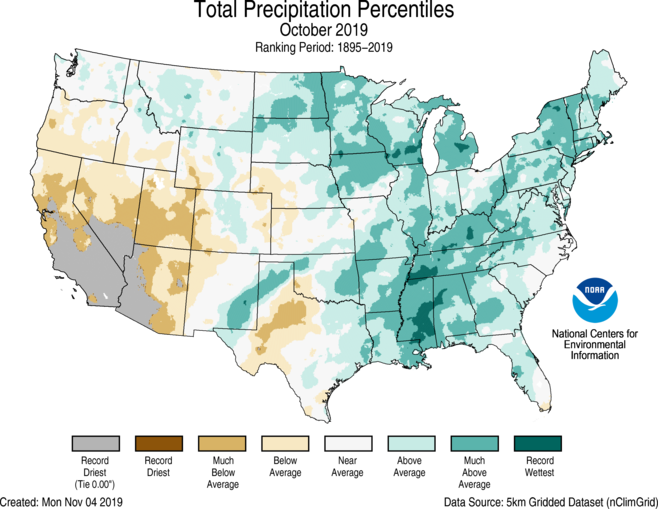
Extremes in both temperature and precipitation characterize October across the contiguous U.S.
For October, the average contiguous U.S. temperature was 52.3°F, 1.8°F below the 20th century average. This ranked in the lowest third of the 125-year period of record and was the coolest October since 2009. Below-average temperatures were observed from the High Plains to the Pacific Coast, while above-average temperatures blanketed the eastern third of the contiguous U.S. Parts of southern Florida were record warm. For the year-to-date, the contiguous U.S. average temperature was 55.5°F, 0.5°F above average, and ranked in the warmest third of the historical record.
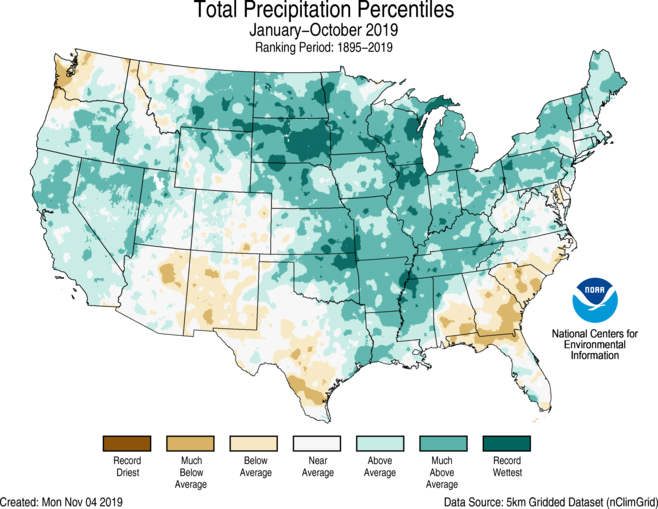
The October precipitation total for the contiguous U.S. was 3.14 inches, 0.98 inch above average, and ranked as the eighth wettest October in the historical record. Above-average precipitation fell across much of the eastern half of the contiguous U.S., with record precipitation occurring across portions of the Great Lakes and the Mississippi Valley. Below-average precipitation fell across parts of the West, as well as the central and southern Plains. For the year-to-date, the contiguous U.S. precipitation total was 30.25 inches, 4.89 inches above average, and was the wettest January–October on record. Average precipitation across the contiguous U.S. for the 12-month period November 2018–October 2019 was 36.21 inches, 6.28 inches above average, exceeding the previous November–October record set in 1972–73 by nearly 1.5 inches.
This monthly summary from NOAA National Centers for Environmental Information is part of the suite of climate services NOAA provides to government, business, academia, and the public to support informed decision-making.
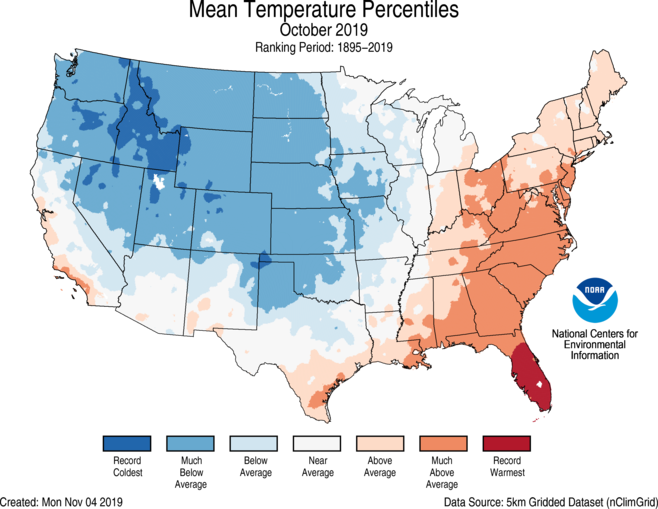
October Temperature
Above- to much-above-average temperatures dominated across the East Coast, southern Great Lakes, Ohio Valley, and southern Plains. Florida ranked second warmest during October, while Georgia and South Carolina ranked third warmest.
Record heat blanketed the Southeast and mid-Atlantic states the first week of October, shattering many all-time October heat records.
Below- to much-below-average October temperatures were observed across the Northwest, Intermountain West, Great Plains, and western Great Lakes. Idaho ranked coldest for the month, breaking the 1919 record by 0.8°F. The states of Washington, Utah, and Wyoming ranked second coldest during October.
Great Falls, MT, reported a low of 9°F on October 1 — the coldest temperature on record in Great Falls so early in the fall season.
An early-season snowstorm across the Rockies and Midwest was accompanied by bitter cold temperatures during the last week of October. All-time record low temperature records for October were set across the West with some temperatures dipping well below zero. Peter Sinks, UT, often one of the nation’s coldest locations, dropped to −46°F early on October 30, according to the Utah Climate Center. This temperature may be the coldest October temperature on record across the contiguous U.S.
Alaska ranked in the warmest third of the October record with a statewide average temperature of 30.8°F, 5.3°F above the long-term average. Parts of the North Slope experienced temperatures averaging at least 9°F warmer than the historical average, while much of the Panhandle experienced a mild October. It was the second warmest October for Utqiaġvik (Barrow).
October Precipitation
Above- to much-above-average precipitation was observed across much of the eastern half of the contiguous U.S. Mississippi ranked wettest during October, while 11 additional states ranked among their 10 wettest Octobers on record.
Below- to much-below-average precipitation occurred across the West, with Arizona and California ranking among their 10 driest Octobers on record.
An upper-level trough and an associated cold front brought the northern Rockies and Plains their first significant snowstorm of the season. From October 9–13, one to two feet of snow accumulated across portions of Montana and North Dakota, with several locations noting their snowiest start to the season. Great Falls, MT, reported 27 inches of snow while Bismark, ND, measured 17.1 inches for the season-to-date.
Another early-season snow storm impacted the central Rockies and parts of the Plains and Midwest. Denver reported 6.6 inches of snow on October 29 — the largest one-day October snowfall for Denver since 2011. Snow from this system also fell across portions of the central Plains and Great Lakes.
October was wet across much of Alaska with portions of the Northeast Interior, Southeast Interior, and West Coast divisions reporting record wet conditions for the month.
According to the October 29 U.S. Drought Monitor report, approximately 18 percent of the contiguous U.S. was in drought, down slightly from 19 percent at the beginning of October. Drought conditions became less severe across parts of the Southeast, Tennessee and Ohio valleys, Texas, the Alaska Panhandle, Hawaii, and Puerto Rico. Drought intensified across the Four Corners region of the Southwest.
Extremes
Subtropical Storm Melissa formed from a slow-moving East Coast nor’easter on October 11 with sustained winds of 65 mph. Impacts from Melissa included coastal flooding from Virginia to New York. Less than a week later, a mid-latitude cyclone, moving across the central and eastern United States, developed into a “Bomb Cyclone” (a storm whose central pressure drops by at least 24 millibars in 24 hours or less). This storm packed wind gusts up to 90 mph in southern New England on October 17 and left over 500,000 residents without power. New October low-pressure records were reported for various locations across Massachusetts, Rhode Island, and New Hampshire. Precipitation accumulations from this storm system measured between two and four inches across portions of New England.
Post-Tropical Cyclone Nestor made landfall on October 19 near Apalachicola, FL, with top sustained winds of 45 mph. The system brought between three and five inches of rainfall as well as tornadoes to the Florida Panhandle. Beneficial rains from the remnants of Nestor fell across parts of Georgia, South Carolina, North Carolina, and Virginia, which had been impacted by severe drought conditions.
Tropical Storm Olga merged with a cold front in the Gulf of Mexico on October 25 and made landfall as a post-tropical storm along the central Louisiana coast early the next morning. Many residents lost power across Louisiana as winds exceeded 70 mph, while tornadoes and wind damage impacted both Mississippi and Alabama.
Several large and dangerous wildfires impacted parts of north-central and southern California during October and remained active at the beginning of November. The Kincade Fire, located in north-central California, burned through nearly 78,000 acres and destroyed almost 350 structures by the end of October. The Tick, Saddleridge, and Getty fires in southern California consumed more than 14,000 acres as well as 60 structures. The Easy Fire, also located in southern California, consumed more than 1,700 acres by the end of October. These large and dangerous fires were fanned by powerful winds, with some gusts topping 100 mph in the Sierra Nevada range. Across southern California, unusually strong Santa Ana winds made it difficult for fire crews to keep these fires from spreading.
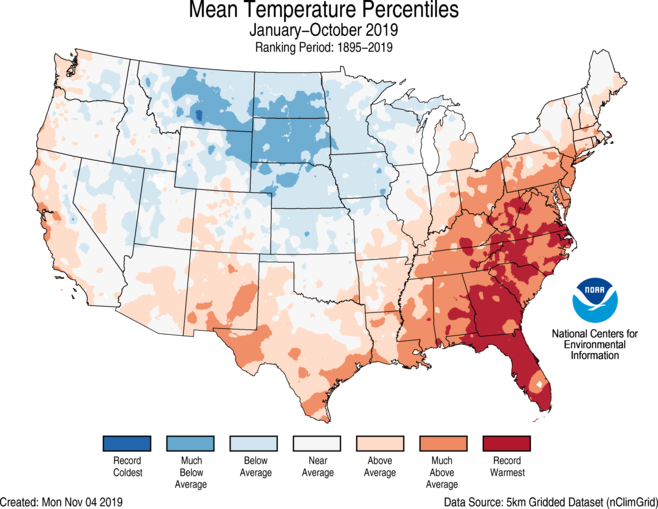
Year-to-date (January–October) Temperature
Above- to much-above-average year-to-date temperatures were observed from California to the southern Plains and from the Southeast to New England. Record warm temperatures were scattered throughout much of the Southeast and mid-Atlantic states. Thirteen states had a top 10 warm year-to-date period with Florida, Georgia, South Carolina, North Carolina, Virginia, and West Virginia reporting their warmest January–October on record.
Below-average temperatures occurred across the northern Plains and parts of the Midwest with South Dakota having its seventh coldest year-to-date period on record.
Alaska had its second warmest January–October on record. Record heat blanketed much of the North Slope and northern West Coast with portions of the Aleutians, the Northeast Interior, and Central interior also reporting record warm conditions. The rest of the state had above- to much-above-average temperatures for this 10-month period.
Year-to-date (January–October) Precipitation
Above-average January–October precipitation dominated much of the country with record wet statewide ranks occurring in South Dakota, Minnesota, Wisconsin, Illinois, and Michigan. Below-average precipitation fell across the Pacific Northwest, parts of the Southwest and Southeast.
Surface air temperature anomaly for October 2019 relative to the October average for the period 1981-2010. Data source: ERA5. Credit: Copernicus Climate Change Service/ECMWF. From the Copernicus Program Climate Change Service:
Globally, October was 0.69°C warmer than the average October from 1981-2010, making it by a narrow margin the warmest October in this data record. Europe generally saw above-average temperatures, with the exception of most of the north and north-west of the continent. Temperatures were much above average in large parts of the Arctic, while much of western USA and Canada experienced much below average temperatures.
October temperatures in 2019 were above the 1981-2010 average for most of Europe, especially so in the east and south-east. Below-average temperatures occurred over most of the north and north-west of the continent.
Elsewhere, temperatures over the northern hemispheric land masses were markedly above average over parts of the Arctic, over the eastern USA and Canada, and over the Middle East and much of North Africa and Russia. Temperatures were likewise well above average over southern Brazil, southern Africa, western and southern Australia, and most of eastern Antarctica.
Temperatures over land were substantially below average over a region encompassing much of the western USA and Canada. They were also below average in parts of tropical Africa and Antarctica, and to a lesser degree over several other regions.
Regions of below-average temperature occurred over all major oceans, including the tropical eastern Pacific and the ice-covered Weddell Sea. Air temperatures over sea were nevertheless predominantly higher than average, especially so over several Arctic and Antarctic seas and over the north-eastern Pacific Ocean.
Monthly global-mean and European-mean surface air temperature anomalies relative to 1981-2010, from January 1979 to October 2019. The darker coloured bars denote the October values. Data source: ERA5. Credit: Copernicus Climate Change Service/ECMWF.
Global temperatures were substantially above average in October 2019. The month was:
0.69°C warmer than the average October from 1981-2010, making it by a narrow margin the warmest October in this data record;
an insignificant 0.01°C warmer than October 2015, the second warmest October;
0.09°C warmer than October 2017, the third warmest October.
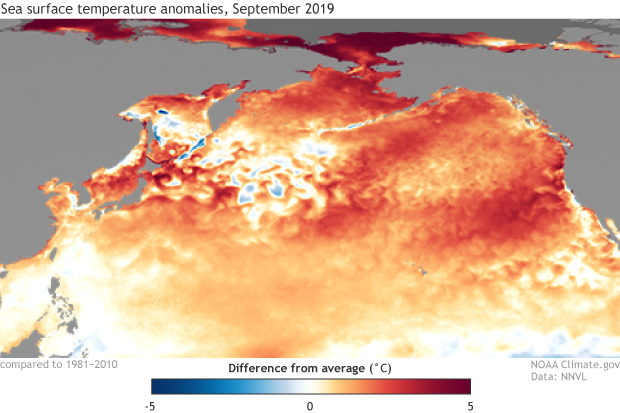
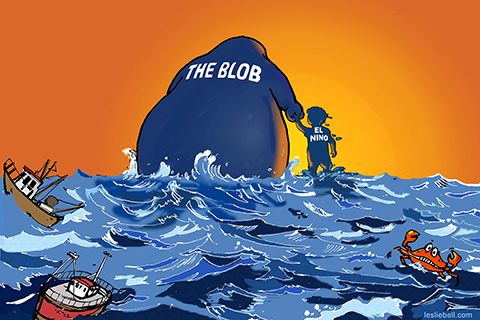
The Pacific Ocean is throwing a bit of a temper tantrum these days, but it’s not where you think it might be. Often we focus on the tropical Pacific Ocean because it’s where ENSO takes center stage, but currently temperature departures across the Tropics are pretty blah. Instead, for the past few months, it’s the North Pacific Ocean that pops out at you—a gigantic red sore that covers much of the eastern basin.
Sea surface temperature anomalies during September 2019. Red/orange shading indicates above-average temperatures and blue shading indicates below-average temperatures. Climate.gov image based on NOAA NNVL and NCEI.
As our colleagues over at NOAA Fisheries explained last month, this feature is a Marine Heatwave. Marine heatwaves are considered prolonged, large-scale warm water events (1). Back in 2014-16, people started calling a very prominent North Pacific marine heatwave THE BLOB. Now, some people are saying this current event could be a return of the Blob. Blob is fun to say and simply rolls off the tongue, so we understand why it’s caught on.
BUT! The problem is “Blob” is not that useful of a description. There’s no single fixed Blob. As Michael Jacox points out, it would be like if we called every single hurricane, “Hurricane Dave.” Obviously hurricanes, like marine heatwaves, don’t always occur in the same place, at the same time, have the same magnitude, or even have the same areal coverage. In fact, an El Niño can result in conditions that would be considered a marine heatwave in the Tropics, but we would not call that area of warmth a “Blob.”
Marine heatwaves can be a bit tricky to categorize because, like most phenomena in weather and climate, there are shades of grey. While marine heatwaves can be defined by many different physical properties (e.g. size, intensity, duration), there are no fixed set of impacts that will always result. At this point, it is too early to say if this heatwave might have major impacts on marine life and fisheries the way the last one did (2).
To learn more, I convened an expert panel to ask some questions. The interviewees are Michael Alexander at NOAA Earth Systems Research Lab and Michael Jacox and Nate Mantua, who are with NOAA Southwest Fisheries Science Center. They had a lot of great information to share —so much in fact that we’re well over our length limits (for those who want the “extended interview” keep scrolling!).
Q: So far, how different is the current marine heatwave (Blob Redux) from the one we saw in 2014-16 (The Original Blob)? Alexander: Marine heatwaves are usually identified by temperatures at the sea surface, which can be measured by satellites. Based on sea surface temperatures, the general pattern of the current heatwave does resemble the Original Blob. However, generally, it is important to determine how deep the temperature anomalies (how much warmer or colder the temperature is relative to average) extend into the ocean. As Nate points out below, these anomalies are just near the surface off the US West Coast, so strong storms, which often begin this time of year, can quickly wipe out a heatwave. In fact, we may have just started seeing this.
Mantua: The biggest differences so far are in the depth and duration of the two events. The Original Blob lasted for multiple years and the warming eventually extended to more than 300 meters (~1,000 feet) below the surface across much of the Northeast Pacific. In contrast, the current event has been with us for only a few months, and the extreme warming is confined to the top 30 to 50 meters (~100-150 feet).
Subsurface temperature anomalies averaged in the North Pacific Ocean (150°W-130°W, 40°N-50°N). Data from 1980 to present using an ensemble of ocean reanalysis from various agencies. Climate.gov image based on figure provided by Caihong Wen using datasets shown in the CPC monthly ocean briefing.
Q: Around the time the marine heatwave emerged in the North Pacific Ocean in 2014, there was an El Niño Watch. How significant is ENSO in helping fuel marine heatwaves (or vice versa)? Alexander: The 2014 marine heatwave (Original Blob) started in the northeast Pacific. Recent studies suggest that air-sea interactions allow ocean temperature anomalies near Hawaii to move towards the equator. When warm temperature anomalies, including marine heatwaves, reach the equator they enhance the chance of an El Niño event in the following year (Dan Vimont talked about this in an earlier blog post). So the Blob may have contributed to the strong El Niño event that occurred in 2015-16.
While El Niño events occur in the tropical Pacific they influence the ocean and atmosphere in the North Pacific including sea surface temperatures. Generally, the winds are from the southwest near the US West Coast during El Niño which warms the underlying ocean, while ocean processes push the deeper cold water farther down, warming a very narrow region right near the coast. A full blown El Niño did not happen in 2014 but one did in the following winter, which likely contributed to the continuation of the marine heatwave when it was strongest near the West Coast.
Jacox: In general, El Niño is a very prevalent cause of marine heatwaves in much of the Pacific. Off the U.S. West Coast, El Niño events tend to produce warming by changing the wind patterns that typically cool the coastal ocean, and through an “oceanic teleconnection” where coastal trapped waves propagate northward along the North American west coast. The Original Blob wasn’t caused by El Niño, but the tropical warmth during the 2014-15 winter likely helped that heatwave persist and then the strong 2015-16 El Niño contributed to the extended warming as well.
Illustration by Leslie Bell (talented mom of Michael Jacox).
Mantua: Georgia Tech Professor Emanuel Di Lorenzo and I published a study showing that the evolution and persistence of the Original Blob involved long-distance teleconnections between the North Pacific and Tropical Pacific that involved two flavors of El Niño. As Mike J. points out, the initial warming off the coast of the Pacific Northwest that first earned the “Blob” label wasn’t caused by El Niño. Instead, the atmospheric forcing that started The Blob in winter 2013/14 also contributed to the tropical warming in 2014, which persisted into 2015.
Q: There are research studies that indicate that that marine heatwaves will become more frequent with climate change. How certain is this? Could there be a human-caused thumbprint in recent events? Alexander: Most of the ocean has warmed over the past 50 years. This warming is projected to continue through the 21stcentury, especially off the northeast US coast. Nearly all computer model simulations of the future indicate the oceans will warm. So relative to the present, marine heatwaves will become more frequent. However, if one thinks of a heatwave as a short-term event relative to the mean temperature at that time, the frequency of marine heat could stay about the same but just happen in an overall warmer climate.
Jacox: What those studies show is that in a warming ocean, historical temperature thresholds will be exceeded more often. In other words, temperatures we currently consider extreme will become more common. But that doesn’t mean marine heatwaves will necessarily change. One could think of it like sea level rise – just because the water gets higher doesn’t mean the waves are getting bigger. How marine heatwaves will change relative to the increasingly warmer temperatures is still an open question, and the answer will likely be different in different parts of the ocean. For marine species, both the warmer temperature and future marine heatwaves will be important. Their relative and combined impacts will vary among species depending on their exposure to warmer temperatures, their sensitivities, and their adaptive capacity.
Q: Perhaps the most important question of all: If you got the Blob, Polar Vortex, and Godzilla El Niño into the ring, which one would win? Alexander: My dog, which can eat just about anything and drink vast quantities of warm water.
Jacox: Trick question, it turned out that the Blob and Godzilla El Niño were on the same team.
Mantua: I’m with Mike and Mike on this one.
Q: Right now we’re ENSO-neutral, so it doesn’t seem like ENSO would be a contributor to the current heatwave. I know the heatwave is ongoing and in-depth study of it will have to wait, but, at this point, can you point at some leading suspects? Alexander: The Blob formed under a strong stationary “blocking” atmospheric high-pressure system. The associated weak winds and warm air temperatures allowed the near-surface ocean to heat rapidly. Surprisingly, blocking events over the North Pacific are actually more common during La Niña (the cold phase of ENSO) then during El Niño. Other processes can influence weather patterns over the North Pacific including the Madden-Julian Oscillation. Changes in ocean currents, such as the Gulf Stream in the Atlantic and Kuroshio current in the Pacific may influence marine heatwaves over longer periods of time.
It is important to always keep in mind that weather patterns, like blocking, can occur randomly due to the chaotic nature of the atmosphere. Thus, while ENSO might influence the types of weather patterns it does not control them outright– think of asking your 2-year-old son or 12-year-old daughter to do something, they might listen to you, what maybe 60% of the time (if you’re lucky).
Mantua: My short list of suspects includes (1) teleconnections from the tropical Indo-Pacific region, which this summer had persistently high ocean temperatures around the International Dateline, cool temperatures in the eastern Indian Ocean, and persistent tropical rainfall anomalies in southeast Asia/Indonesia; (2) the extraordinarily warm Arctic, and (3) bad luck – due to the random nature of our climate. This year’s marine heatwave formed under a strong stationary “blocking” atmospheric high over Alaska in spring and summer, and a persistent area of lower-than-normal sea level pressure between Hawaii and the mainland for most of summer. These pressure patterns weakened the normal wind systems over the North Pacific and Bering Sea that are important for the upper ocean’s heat balance. Another interesting feature of summer 2019’s climate has been a circumpolar teleconnection in the jet stream that included persistent high pressure ridges over Alaska, Greenland and the Russian Arctic. And finally, there may be positive feedbacks between the warming of the North Pacific and the weak wind patterns that caused the warming in the first place. Part of the bad luck behind this event may be the combination of some or all of these different factors.
Q: Can some of the factors we’ve discussed above help us predict marine heatwaves? How far out do you think they can be predicted? Alexander: The Blob was not well forecasted. We might only be able to predict the actual pattern and strength of marine heatwaves a few weeks out, but given the large-scale factors that influence them we may be able to predict the probability of an event occurring, like the percent chance of rain you see when you check the weather on your cell phone.
Jacox: It really depends on what’s driving the heatwave. The initial formation of the Blob wasn’t predicted even a month or two in advance, and neither was the ongoing heatwave in the northeast Pacific. But a marine heatwave that results from a strong El Niño event has much greater potential to be predicted, even 6 months or more in advance. There may also be predictability for the evolution of heatwaves like the Blob after they form, even if they weren’t predicted initially.
Q: Back in 2014-15, there was some concern that the Blob was causing an atmospheric ridge over the eastern North Pacific Ocean and this was leading to more drought on the West Coast. Now that the data is in, how likely was it that Blob was causing the ridge? Can you discuss the interplay between these marine heatwaves and the large-scale circulation above them? Mantua: My read of the latest research is that it is not likely that the Blob caused the ridge. Several studies (this blog post) point to some atmospheric changes caused by the combined influence of the warm SST anomalies in the western tropical Pacific and cold SST anomalies in the eastern tropical Pacific. However, there is also some published modeling work showing a modest wintertime mid-latitude ridge response to the Blob in winter 2013-14. It may be that warming in the Northeast Pacific Ocean does not cause, but may help persist the ridge pattern (and persistence of the warming), at least in winter.
For low-elevation areas exposed to the atmosphere’s marine boundary layer on the West Coast this summer, there appears to be a direct connection between elevated SSTs and higher dew point temperatures and higher nighttime low temperatures. Cliff Mass at the University of Washington has a nice blog post that includes high-resolution modeling results showing this. Additionally, Nick Bond has shown that February SSTs in the Original Blob region are positively correlated with spring time air temperature in Washington.
From the Center for Biological Diversity (Michael Robinson):
The U.S. Fish and Wildlife Service removed the Colorado butterfly plant from the list of threatened species today. The delisting is the result of protection of the species’ habitat through the Endangered Species Act, and represents a victory for a prairie flower that, just 20 years ago, was headed toward extinction.
“I’m grateful that the Colorado butterfly plant is out of danger,” said Michael Robinson of the Center for Biological Diversity. “This beautiful flower’s pink petals will draw pollinating moths on summer evenings for decades, and maybe even millennia, to come. It’s a testament to the power of people working together through the science-based protocols of the Endangered Species Act.”
For more than a century, livestock grazing, mowing and haying, water diversions and development had eliminated Colorado butterfly plants from the high plains streams of north-central Colorado, southeastern Wyoming and western Nebraska.
Federal protection began in 2000, followed by the protection of 3,500 acres of critical habitat along 51 miles of streams in southeastern Wyoming in 2005.
In addition 11 land owners agreed to conserve their own populations of the Colorado butterfly plant. Fort Collins also protected the plants on city-owned land. And the Defense Department protected the plants on Francis E. Warren Air Force Base near Cheyenne, Wyoming. Many if not all of those voluntary protections are expected to continue.
The Colorado butterfly plant is the 45th species to be delisted for recovery in the United States, including 21 in the past five years.
The Colorado butterfly plant’s delisting comes months after the Trump administration finalized rollbacks to key Endangered Species Act regulations. The changes could lead to extinction for hundreds of animals and plants.
Background
The Colorado butterfly plant is in the evening primrose family and grows 2 feet tall. It lives along streams between 5,000 and 6,400 feet in elevation in Boulder, Douglas, Larimer and Weld counties in Colorado. In Wyoming it lives in Laramie and Platte counties, and in Nebraska it may be found in Kimball County.
Protecting a plant or animal as endangered or threatened under the Endangered Species Act leads to science-based measures tailored to prevent its extinction. And critical habitat designated under the Act has been found to correlate closely with conservation success. The Act has been successful in saving more than 99 percent of species placed under its care, despite significant underfunding of the law’s vital measures.
Colorado butterfly plant Credit: USFWS via the Center for Biological Diversity
Photo shows the Brackish Groundwater National Desalination Research Facility – BGNDRF, in Alamogordo, NM. Credit: Reclamation
Here’s the release from the Bureau of Reclamation (Marlon Duke):
Goals are to reduce costs, energy requirements, environmental impact for treating unusable water
The Bureau of Reclamation has awarded nearly $1 million for projects under an innovative pilot-scale water treatment technologies and desalination program. The selected projects will receive funding through cooperative agreements and will include a period of pilot testing at the Brackish Groundwater National Desalination Research Facility in Alamogordo, New Mexico, and other sites across the country.
On April 30, 2019, Reclamation announced that it was seeking applicants looking for innovative technologies for reducing the cost, energy requirements and environmental impacts for water purification and desalination technologies. Innovative and promising technologies would be supported to move from the theoretical stage towards a practical application.
“In June, we received 29 eligible applications for review that included $4 million in requests for federal funding. Top applicants were invited to pitch their pilot studies in August,” said Yuliana Porras-Mendoza, advanced water treatment research coordinator. “We awarded grants to seven projects focused on innovative and disruptive water treatment technologies ready for pilot testing to accelerate knowledge transfer and provide new products that serve the water treatment community and attract commercial interest.”
Funded Pilot Studies
Garver, LLC: Innovative electro-coagulation membrane pretreatment with vacuum-assisted electro-distillation concentrate management for cooling tower blowdown recovery
Project goal: improve water quality, reduce chemical consumption, reduce the potable water demand of a water treatment system and eliminate dissolved solids loading to the local sewershed.
State: Colorado
AdEdge Water Technologies: Innovative high recovery flow-reversal RO desalination process for potable reuse providing essential physical barrier with higher recovery rate & reduction in concentrate flow
Project goal: test a flow-reversal reverse osmosis technology with the purpose to introduce this technology to the US market.
State: Georgia
WIST, Inc: The first affordable, easy-to-use silica pretreatment solution: Pilot scale validation of SiSorb-Nano
Project goal: scale up and test a new resin for silica removal from water that is less expensive, more efficient, and environmentally friendly.
State: New York
Eastern Shore Microbes: H.E.A.T A biologically, sustainable solar powered system to eliminate RO concentrate in order to improve the water supply for inland communities
Project goal: test the ability for a selected group of microbes to enhance evaporation of reverse osmosis concentrate, potentially reducing the size of current evaporation ponds and increasing the rate of evaporation.
State: Virginia
University of Arizona: Electrochemically enhanced high efficiency reverse osmosis (EE-HERO) for brackish water treatment
Project goal: test an electrochemically enhanced high efficiency reverse osmosis process for treating brackish groundwater for potable use.
State: Arizona
University of Utah: Disruptive transport/sand filtration pretreatment system for uninterrupted desalination water supply during harmful algal blooms
Project goal: test an innovative system as a last defense during a harmful algal bloom (HAB) before it reaches water treatment systems that are severely impacted and, in some cases, not able to operate during a HAB event.
State: Utah
EcoVAP: Enhanced evaporation using biomimicry for brine concentrate disposal
Project goal: minimize the cost and environmental impact of inland desalination.
State: Utah
The funding provided supports the Presidential Memorandum on Promoting the Reliable Supply and Delivery of Water in the West, including the goal of improving use of technology to increase water reliability and enabling broader scale deployment of desalination and recycled water technologies.
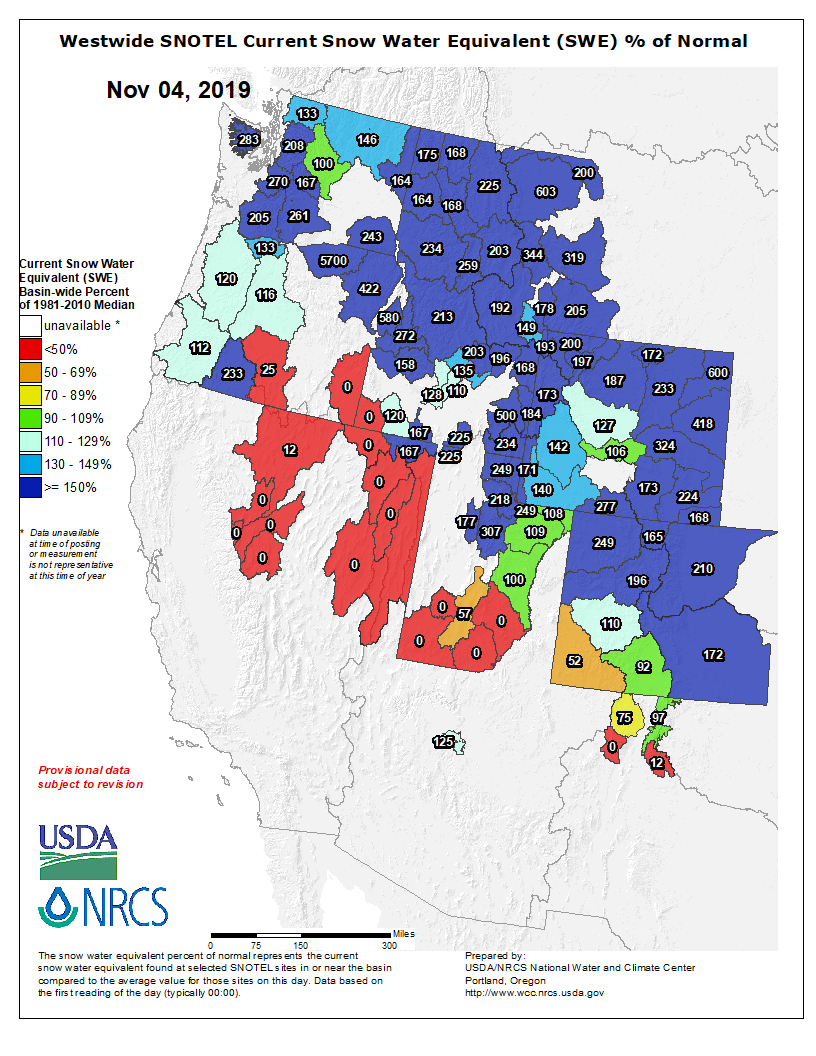
The highest snowpack levels are in northern Colorado, where some areas are more than three times above where they should be for early November. Most of the snowfall came over the past two weeks, as a series of strong and exceptionally cold storm systems moved through the state, dumping feet of snow across the northern mountains. Because most of October’s snow events arrived from the north, Colorado’s northern mountains — the Park, Medicine Bow and Front Ranges — saw the most overall snowfall.
Because of that, though, some parts of southern Colorado are running a tick behind average snowpack levels, as of Friday’s update.
Of course, all of that snow also has ski resorts reporting record snow levels and opening earlier than usual. It’s also has forced the earliest closure of Independence Pass in nearly a decade.
That said, October statewide precipitation — a measure of the overall moisture — was only 82% of average, based on NRCS data. Because colder air can hold less water than warm air, there is typically a correlation between a colder-than-average month and lower precipitation amounts.
That means the majority of the state officially remains in a drought, according to the United States Drought Monitor’s most recent update. More than 80% of the state is considered to be abnormally dry.
After all of the recent snow, though, no significant snowfall appears to be in the near-term forecast. A generally dry pattern will limit snow chances for most of the state over the next week to 10 days.
Denver finished with an official total of 12.5 inches of snowfall last month, making it the city’s snowiest October at Denver International Airport since 2009. However, at the city’s more centrally-located Stapleton Airport observation site, Denver finished with 15.7 inches of snowfall, making it the snowiest October there since 1997. It was also Stapleton’s second-snowiest October in the last 50 years.
Temperature-wise, Denver finished with an average reading of 43.7 degrees over the full month of October, Denver’s fourth-coldest October on record. It was Denver’s coldest October overall since 2009…
Colorado Springs tied its third-coldest October on record, and Pueblo saw its second-coldest. Those were just one of dozens of record cold temperature readings statewide in October.
Westwide basin-filled snowpack map November 4, 2019 via the NRCS.
Coyote Gulch’s new bicycle arrives home November 2, 2019.
Woo hoo! I was able to pick up my new bicycle last Saturday! The expert bicycle builders at Queen City Cycle did a great job meeting my requirements with stylish and functional components.
Some of you know that I started riding a bicycle to cut my carbon footprint back in 2008 reprising my college days in downtown Denver and Missoula when I rode year around. I’ve kept thousands of pounds of CO2 out of the atmosphere over the years. I hope you’ll be inspired to visit Queen City Cycle and get out of your planet-killing death machine.
A big thank you to Ethan and Michelle.
Michelle and Ethan — Master bicycle builders at Queen City Cycle.
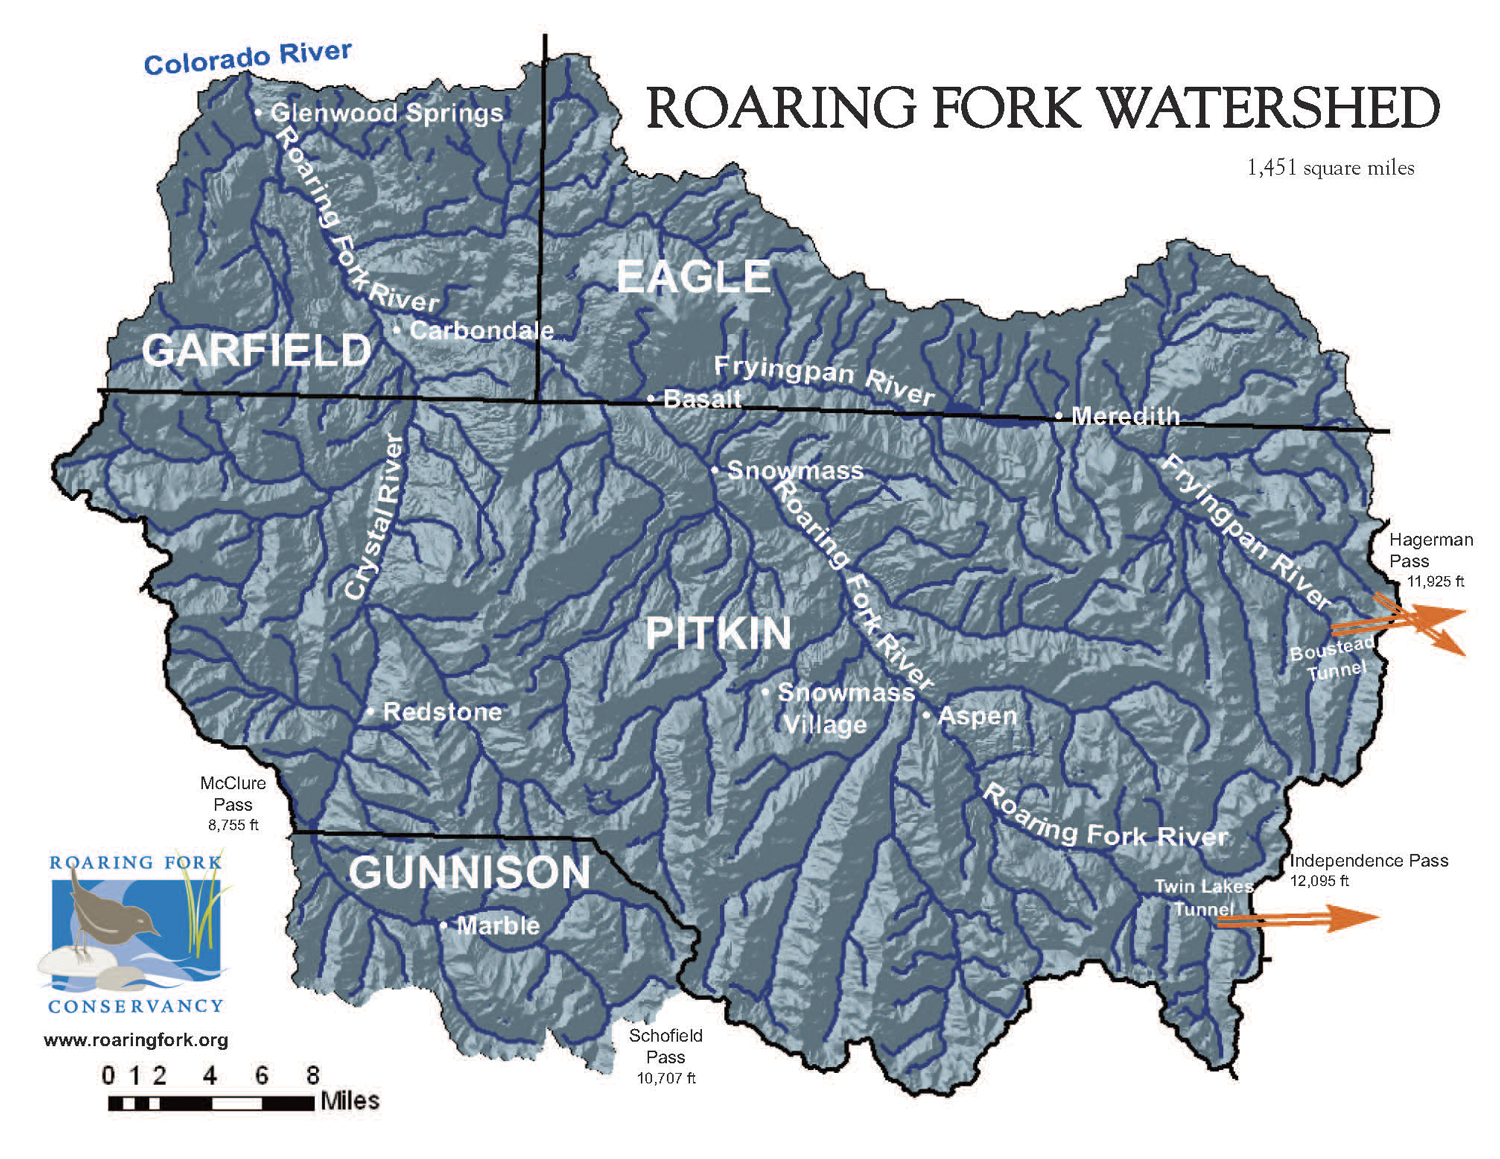
The blue expanse of Ruedi Reservoir as seen from the air. Students with the Carbondale-based Youth Water Leadership Program took to the air with EcoFlight to see how people have modified water in the Roaring Fork watershed. Photo credit: Heather Sackett/Aspen Journalism
On a recent, clear, cold Saturday morning, local students from Carbondale-based Youth Water Leadership Program packed into a six-seat, single-engine Cessna 210 piloted by Gary Kraft of EcoFlight.
From the cockpit and high above the Roaring Fork watershed, certain features jumped out — the long, straight line of Red Mountain Ditch cutting across the hillside; infrastructure of the Twin Lakes Reservoir and Canal Co. siphoning water to the Front Range; the ponds that feed Aspen Skiing Co.’s snowmaking system; and the glittering surface of Ruedi Reservoir.
One goal of the flight was to give students a firsthand experience of natural resources — in this case, rivers and water. Aspen-based EcoFlight flies policymakers, students and journalists over Western landscapes to highlight man-made impacts to the natural world.
“The best way to teach people about places is to get them in the places,” said Sarah Johnson, watershed-education specialist and founder of the Youth Water Leadership Program.
The plane took off from the Aspen airport, gaining altitude as it flew up Independence Pass to the headwaters of the Roaring Fork, down the Fryingpan River valley, around the white flanks of Mount Sopris and up the Crystal River valley before cruising past the Maroon Bells and Aspen Mountain back to the airport.
This snowmaking pond on the east side of Aspen Mountain as seen from the air with EcoFlight. Students from Carbondale-based Youth Water Leadership Program got a tour of water infrastructure in the Roaring Fork Valley. Photo credit: Heather Sackett/Aspen Journalism
How humans modify water
Also evident from the air were the burn scars from 2018’s Lake Christine Fire on Basalt Mountain, as well as the many large homes near Aspen with ponds on the property. For Coal Ridge High School senior and youth-water program leader Aidan Boyd, it was striking to see the patterns of land use in the valley.
“It is really interesting to compare the remote mountains that seem completely untouched to as you get more into the towns it’s just a very different feeling,” he said. “We’ve talked a little bit about how a lot of really wealthy houses will modify water — houses with lakes and pools. It was really interesting to see that.”
From 13,000 feet, it also became apparent just how near to one another are the headwaters of the watershed’s three main tributaries: the Roaring Fork, Fryingpan and Crystal rivers — something that isn’t evident when one travels the region by car. All three begin as trickles in close proximity, high among the 14,000-foot peaks of the Elk and Sawatch ranges.
“I never really realized how close everything is to each other because I’ve always driven up to Aspen and Basalt,” said Isla Brumby-Nelson, an eighth-grader at the Waldorf School on the Roaring Fork.
From left, youth water student leaders Aidan Boyd, Isla Brumly-Nelson and water education specialist and program founder Sarah Johnson in EcoFlight’s Cessna 210. Students got a bird’s-eye view of how humans have modified water in the Roaring Fork watershed. Photo credit: Heather Sackett/Aspen Journalism
Youth Water Leadership Program
The goal of the Youth Water Leadership Program is not only to increase students’ knowledge of their local watershed and Colorado River issues, but also to create student-driven, call-to-action projects. Students will present these projects — on topics that range from how drought affects small farmers to microplastics and desalination — at the annual Youth Water Leadership Summit in December.
The invitation-only event is sponsored by Pitkin County Healthy Rivers and Streams. Representatives from the Colorado Water Conservation Board, the Colorado River Water Conservation District, Colorado Parks and Wildlife, and Sen. Michael Bennet’s office have already confirmed they will attend.
“The program is about teaching young people how to participate in public life,” Johnson said.
The Saturday field trip culminated with a tour of the Snowmass Water and Sanitation District and Zeigler Reservoir. But the bird’s-eye view of the watershed that students experienced with EcoFlight is the experience that is most likely to stay with them, Johnson said.
“I think that perspective is eye-opening,” she said, “when you start to see all the ditches and diversions, man-made lakes versus natural lakes and how many more water-storage structures there were than we thought. … They are going to have this reference point and bring that into the conversation, and I think that is powerful.”
Editor’s note: Aspen Journalism collaborates with The Aspen Times and other Swift Communications newspapers on coverage of rivers and water. This story ran in the Nov. 2 edition of The Aspen Times.
Map of the Roaring Fork River watershed via the Roaring Fork Conservancy
From the Minneapolis Star-Tribune (Matt McKinney):
A rail company’s proposal to ship Minnesota groundwater in bulk to the Southwest appeared to die a swift death Friday when Department of Natural Resources Commissioner Sarah Strommen said she saw “virtually no scenario” in which she would approve it [ed. emphasis mine].
Her response came amid widespread shock and concern over the water shipment plan proposed by Empire Building Investments Inc., the real estate arm of Lakeville-based Progressive Rail…
“We’re long past the days of thinking of our water supplies as infinite, and we shouldn’t be considering any activities that could leave public and private drinking water wells high and dry,” said Trevor Russell, water program director for Friends of the Mississippi River…
Hansen said Empire Building’s request may end up galvanizing legislative efforts to strengthen protections for Minnesota’s groundwater.
Strommen directed the DNR on Friday to send a letter to Empire Building’s chief executive, David Fellon, advising him that he wasn’t likely to get approval.
FromThe Grand Junction Daily Sentinel (Duffy Hayes):
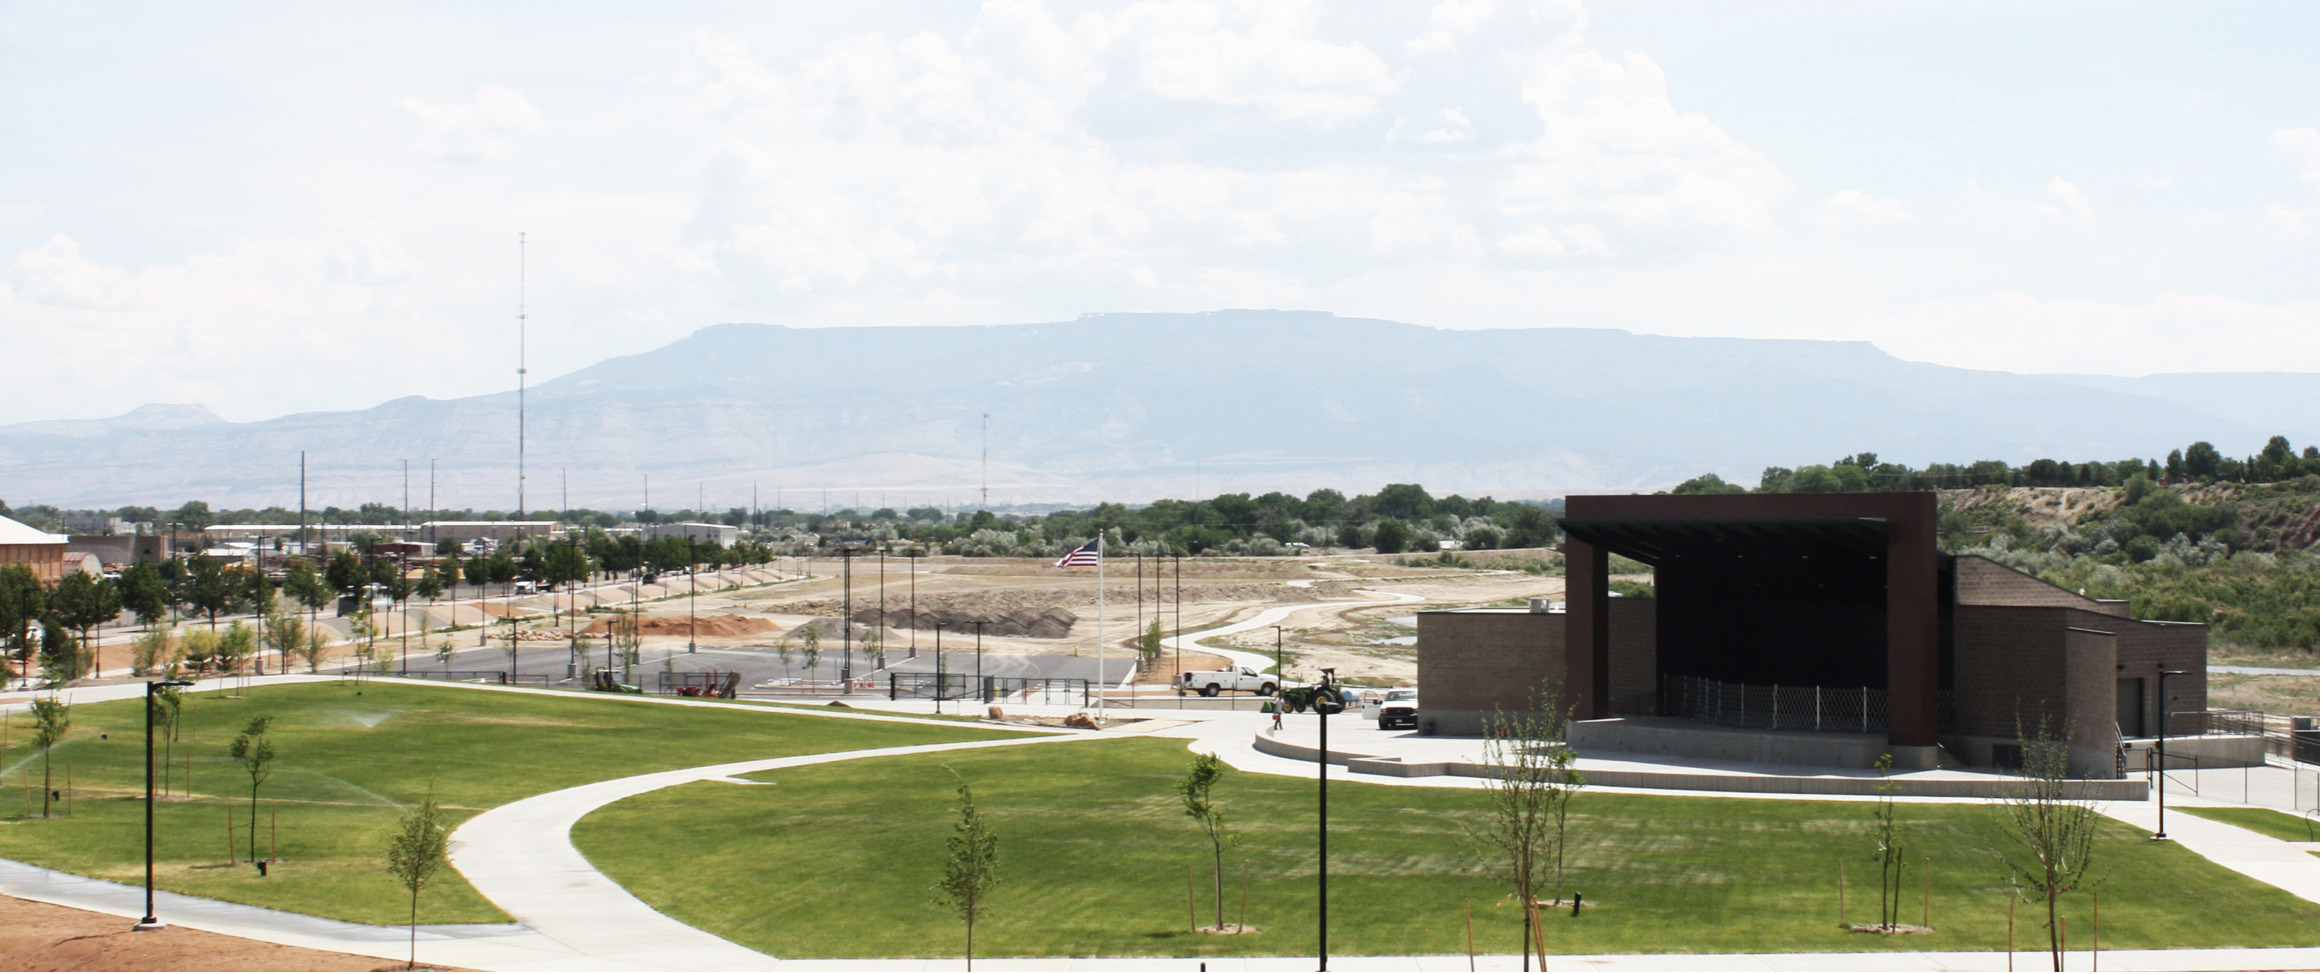
Since the River Park at Las Colonias now under construction is intended as a true collective asset — it’s not a raging whitewater course on some far-flung stretch of river, where only ardent and expert paddlers could realize the benefits — it certainly fits the community bill.
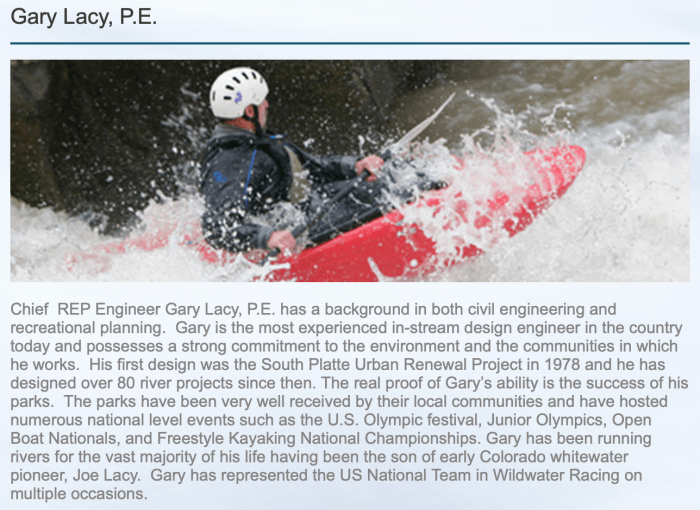
“Having done these projects for years around the country, you always think, what makes them popular, what makes them successful, what are all the ingredients that go into these?” Lacy said. “And location is extremely important.”
Even though previous efforts targeted other Grand Valley locations — Lacy still has concept drawings for projects that never got off the ground in Palisade and Fruita — he knew Las Colonias, where the city’s activation of the former uranium-tainted riverfront is front and center, is the right spot.
“I kept going, no, this Las Colonias thing — right there — and it’s developing, and it’s near downtown,” [Gary] Lacy recalled. “In the big scheme, all things being equal … that’s the best location.”
“You need infrastructure, and you need parking and restrooms. You need, ideally, restaurants — everybody gets hungry and thirsty and (wants to) get a beer and all that stuff,” he said.
“So in the heart of communities is by far the best.”
As Lacy puts it, river parks need two things — water and gradient. In the case of Las Colonias, you’ve got the biggest river in the state in the Colorado, and surveyors found that there was just enough gradient “for a good project,” Lacy said.
“We’re not talking world-class whitewater, but to be honest, you look back at the most successful ones, they (don’t have) the big, pounding whitewater that’s intimidating. Rivers and projects are for everyone,” he said. “I mean everyone, from a ducky to kayakers to stand-up boarders, or just people reading a book or having lunch along the river.”
“Those are the successful (projects), not the ones just for the 2% that are surfing,” he summarized…
TURNING TOWARD THE RIVER
It turns out lots of Gary Lacy’s projects are personal.
The office of his Boulder-based company, Recreation Engineering and Planning, fronts the whitewater park on Boulder Creek that he built in the ’80s.
The company is in the middle of a multiyear project to improve the river park in Salida, where his dad raced some of the first fiberglass boats in the ’40s and ’50s.
The Clear Creek Whitewater Park in Golden goes right by Colorado School of Mines, where Lacy’s dad encouraged him to enroll to become an engineer. He discovered his passion for civic and hydraulic engineering there, and built a unique-for-the-time business that initially focused on bike path construction a short time after.
A quick glance of the REP project list also includes Colorado river parks in Montrose, Buena Vista, Lyons, Steamboat Springs, Vail, Pueblo, Longmont, Florence, Breckenridge, Gunnison and Durango…
Many of the company’s projects in other parts of the country — like in Texas, Kansas, Wisconsin, Ohio and Oregon, among other states — involve taking dangerous dams out to create amenities where they were once liabilities. It’s a theme that also includes the rehabilitation involved at the previously tainted Las Colonias.
“All these communities are now turning toward the river, instead of turning their backs to the river,” Lacy observed.
Las Colonias Park. Photo credit: The City of Grand Junction
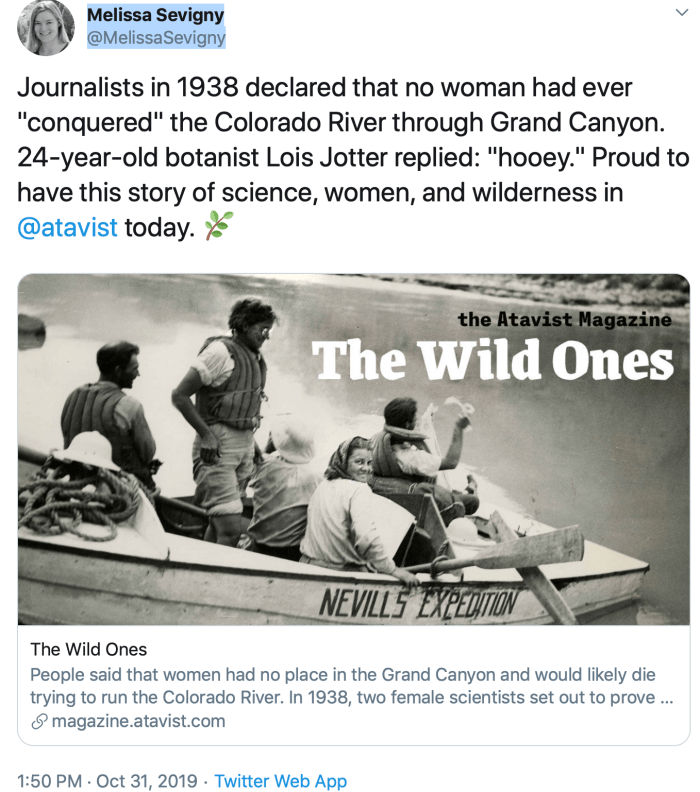
I’m running behind today because Heather Hansman (Downriver: Into the Future of Water in the West) highlighted this beautifully written article about two women who journeyed down the Green and Colorado rivers in 1938. She writes, “This piece, which feels Iike a love story about the river, is so very good.”
If you’ve ever taken a long wilderness trip the article will transport you back into your memories and if you’re like me you’ll end up daydreaming, remembering the jumps into canyon pools, the flora growing around the springs, the routine that you settle into, the hot dry parts, and the small worry — that something could go wrong, and how you will deal with it — that is ever-present . The Grand Canyon cuts through the most magical place I know, the Colorado Platueu.
Map of the greater Colorado River Basin which encompasses the Colorado Plateau. Credit: GotBooks.MiraCosta.edu
Put aside time this weekend to read, “The Wild Ones,” by Melissa Sevigny. Here’s an excerpt:
When an expedition arrived in the town of Green River, Utah, in the summer of 1938 with an ambitious itinerary in hand, local residents and veteran river runners were quick to shake their heads. The group planned to row the Green River 120 miles to its confluence with the Colorado, then drift through Cataract Canyon, the fabled graveyard of the Colorado, where whitewater and hidden rocks conspired to smash boats to smithereens. They would resupply at a landing site called Lees Ferry, near the Utah-Arizona border, and then enter the Grand Canyon, where the only way to communicate with the outside world would involve a long, grueling hike to the rim. Ninety miles downstream, they’d have one last chance to break—abandon the river—at Phantom Ranch. After that, there’d be no choice but to make the harrowing descent downstream to Lake Mead. If they did, they’d have traveled more than 600 miles by river.
“You couldn’t pay me to join them,” declared one river rat.
It was high summer, a season when broiling heat gave way to black, booming thunderstorms. The Green River was already muddy and swollen with rainwater. The Colorado ran at nearly full flood stage. In addition to terrifying rapids, the expedition’s members would face heat, hunger, and fatigue.
Not least among the journey’s many dangers, according to “experienced river men” who refused to give their names to the national newspapers covering the expedition, was the presence of women in the party. Only one woman had ever attempted the trip through the Grand Canyon. Her name was Bessie Hyde, and she’d vanished with her husband, Glen, on their honeymoon in 1928. Their boat was found empty. Their bodies were never recovered.
Unnamed sources told reporters that the two women in the crew were “one of the hazards, as they are ‘so much baggage’ and would probably need help in an emergency.” They were scientists—botanists, to be precise. “So they’re looking for flowers and Indian caves,” a river runner said. “Well, I don’t know about that, but I do know they’ll find a peck of trouble before they get through.”
In fact, Elzada Clover and Lois Jotter had come from Michigan with much hardier plants in mind. Tucked into side canyons, braving what Jotter called “barren and hellish” conditions, were tough, spiny things: species of cactus that no one had ever catalogued before. Clover and Jotter would become the first people to do so—if they survived.
But the newspapers didn’t much care about that. Journalists crowed that the women had come to “conquer” the Colorado, and they fixated on the likelihood of failure. In the privacy of her journal, 24-year-old Jotter had a one-word reply: “Hooey.”
I’ve trekked the canyons of the Colorado Platuea with two women in my life, Mrs. Gulch the horticulturist, and my daughter who is working in plant conservation genetics. I remember Mrs. Gulch calming me down one day when I missed the exit to Harris Wash from the Escalante River. I was panicked and worried about our location. She reminded me that I was pretty expert at map and compass and would probably figure out where we were in due time. Not even close to, “so much baggage.”
John and Mrs. Gulch in Coyote Gulch May 2000
Coyote Gulch, Hall’s Point Water Pocket Fold Glen Canyon Nation Recreation Area. Photo credit Joe Ruffert.
Coyote Gulch and Hellchild Mount Evans
Stevens Arch viewed from Coyote Gulch photo via Joe Ruffert
L to R: Zach Ruffert, Jeffrey, Emily, and Eric, at the top of the Crack in the Wall trail to Coyote Gulch with Stevens Arch in the Background. Photo credit: Joe Ruffert
Lowering backpack at Crack-In-The-Wall
Crack in the Wall route Coyote Gulch via WildBackpacker.com
Zach Ruffert on trumpet, Dance Hall Rock, May 2019.
Denver Water’s sustainability ethic shines in new Administration Building. The post The future’s so bright, we put up solar panels appeared first on News on TAP.
Early storms bump Denver Water’s snowpack to third-highest levels for October. The post Pre-Halloween storms deliver shivers and snow across Colorado appeared first on News on TAP.
Denver Water teams with key partners to tackle yet another major river improvement project benefiting West Slope habitat and anglers. The post Remodeling and restoring rivers — for trout and those who hook them appeared first on News on TAP.
View along Main Street in early Montrose (between 1905 and 1915). Shows a horse-drawn carriage, bicycles, and two men talking. Signs include: “The Humphries Mercantile Co. Dry Goods, Clothing, Hats & Shoes” “Montrose National Bank” and C. J. Getz, Pharmacist, Druggist.” via http://photoswest.org
While there is always noise from the Front Range about water, and there is always concern about a Front Range run on Western Slope water, Coram is less concerned about that than he is a threat from the other direction, specifically downstream on the Colorado River and the Rio Grande.
“I am not as worried about the Front Range, I am more nervous about the possibility that people will use fear (about drought) and Colorado will try to cut deals with the Lower Colorado Basin states,” Coram says. “But the water here doesn’t belong to the state, it belongs to the people. The people (who own the rights) need to be involved.”
The Colorado Water Plan is five years old. Is it functional?
“No,” says Coram. “And it won’t until it retains sustainable funding.”
The Colorado Water Plan names any number of sources for funding within the pages of the plan. One of the main sources should be the severance tax. Colorado severance tax is imposed on nonrenewable natural resources that are removed from the earth in Colorado. The tax is calculated on the gross income from oil and gas and carbon dioxide production. Anyone who receives taxable income from oil or gas produced in Colorado pays the tax.
“Water is supposed to get severance tax funds,” says Coram. “But the governor and legislators always seem to find other needs for the money. In the good years, some senator or assemblyman gets a good idea and they rob money from the severance tax.”
At this point in history Coram says the state legislature owes $300 million to the Water Plan. When the subject comes up in the halls of the Capitol, Coram says that since it appears that when water comes out of the tap, nobody seems to really care about the Water Plan funding.
Prospect Lake in Memorial Park. By Beverly & Pack – Colorado Ballon Classic 2009, Labor Day Weekend, Prospect Lake in Memorial Park in Colorado Springs, CO. Uploaded by Tomer T, CC BY 2.0, https://commons.wikimedia.org/w/index.php?curid=19191608
The City of Colorado Springs has finally reopened Prospect Lake after elevated levels of a microcystin toxin, or blue-green algae, prompted a 12-week closure…
So after three months, what exactly brought the levels down?
“Main reason is we’ve gotten the colder temperatures,” said Rodriguez. “The lower overnight lows and during the day the highs haven’t been as high so it’s really pushed that organism to stop growing.”
[…]
Now the question is: What will the city do to try to prevent this from happening again?
They’ll be trying a new water maintenance program.
Rodriquez said the maintenance will include several products that are “more food-safe, animal-safe, people-safe so that people recreating aren’t going to be exposed to anything that’s hazardous to them but it’s also going to keep our nutrient level in check and in line.”
Rodriguez also said that they are currently working on a protocol for when it comes to testing the water in the future.
From the Twin Cities Pioneer Press (Nick Ferraro):
In what is believed to be a first for Minnesota, the state has received a request from a small Lakeville railroad company asking what it would take for them to drill two wells in Dakota County and pull out up to 500 million gallons of groundwater a year. The water would then be shipped via rail to communities near the Colorado River in the arid Southwest.
“This request represents a new kind of water use in the State of Minnesota” Georg Fischer, the county’s environmental resources director, said in an email this week to the Dakota County Board of Commissioners.
Empire Building Investments, the real estate arm of Lakeville-based Progressive Rail, submitted an application for a preliminary well assessment to the Minnesota Department of Natural Resources this month proposing to build the wells on 6.2 acres the railroad owns north of Randolph.
The assessment is required before someone drills a well that would withdraw more than 1 million gallons of water a year and meant to provide information to a potential water use permit applicant to “help inform their decisions” before they purchase equipment and dig a well, said Jason Moeckel, a manager in the DNR’s ecological and water resources division…
The application indicates that two wells would be drilled to pump up to 500 million gallons of water a year, or about 3,000 gallons per minute within the Cannon River Watershed. The applicant has requested to use the Mount Simon Aquifer, the deepest aquifer in Dakota County.
The project would more than double the amount of water currently being extracted in the area right now, according to Fischer. The largest impact would likely be to the approximately 140 private drinking water wells in a 2-mile radius, with additional potential impacts to the 27 irrigation wells, he added.
Fischer said the DNR has confirmed that the venture would work with Water Train, a company currently providing water to municipal and government agencies in Colorado, Utah and Arizona. The two wells currently are the only wells the company is considering in Minnesota, he added…
Moeckel said the DNR has identified a “number of issues” with the request and that the agency is reviewing several state statutes relating to water use.
Among them, he said, state statute — passed as part of the 1989 Groundwater Protection Act — puts restrictions on new applications to use the Mount Simon aquifer within the seven-county metropolitan area. The restrictions require that the water must be used for drinking within a home or a business and cannot be used for irrigation or industrial processing.
The proposed volume of water would also trigger a mandatory environmental assessment worksheet. Water permits cannot be issued until an EAW is completed.
Dave Fellon, who owns Progressive Rail, is listed as the applicant. Reached by phone this week, Fellon said he could not comment on the proposal and that he would have someone who could return the call. No one did.