
Click the link to read the article on the NOAA website. Here’s an excerpt:
January 15, 2026
From the catastrophic wildfires in Southern California to historic low-water levels on the Mississippi River and record-low streamflow in the Northeast, drought and its impacts touched nearly every corner of the country. The year saw the unusual return of two La Niña events and devastating weather whiplash that brought historic floods to drought-stricken Texas. 2025 showed us that drought is even more devastating when compounded with other climate hazards, such as wildfire and flood. This list breaks down some significant drought-related events of 2025 that made 2025 a year of water extremes across the United States.
Our thoughts are with those who lost loved ones, homes, and livelihoods in the Texas flooding and California wildfires. We hope for healing and comfort for those dealing with significant losses from these events.
Most of the U.S. Experienced Some Drought Last Year
Much of the West started and ended 2025 in drought, according to the U.S. Drought Monitor. Drought impacted the Upper Missouri River Basin and Northeastern U.S. as winter turned into spring, just as Extreme and Exceptional Drought (D3-D4) emerged in Florida and the Southwest. By late summer, drought largely improved in the East, only to emerge again in force in the Northeast U.S. In fall, drought developed in the Midwest and Southeast, and expanded in the Southern Plains and West. New Year’s Eve found drought covering 35.8% of the Nation.
Below is a slideshow of US Drought Monitor maps for 2025.
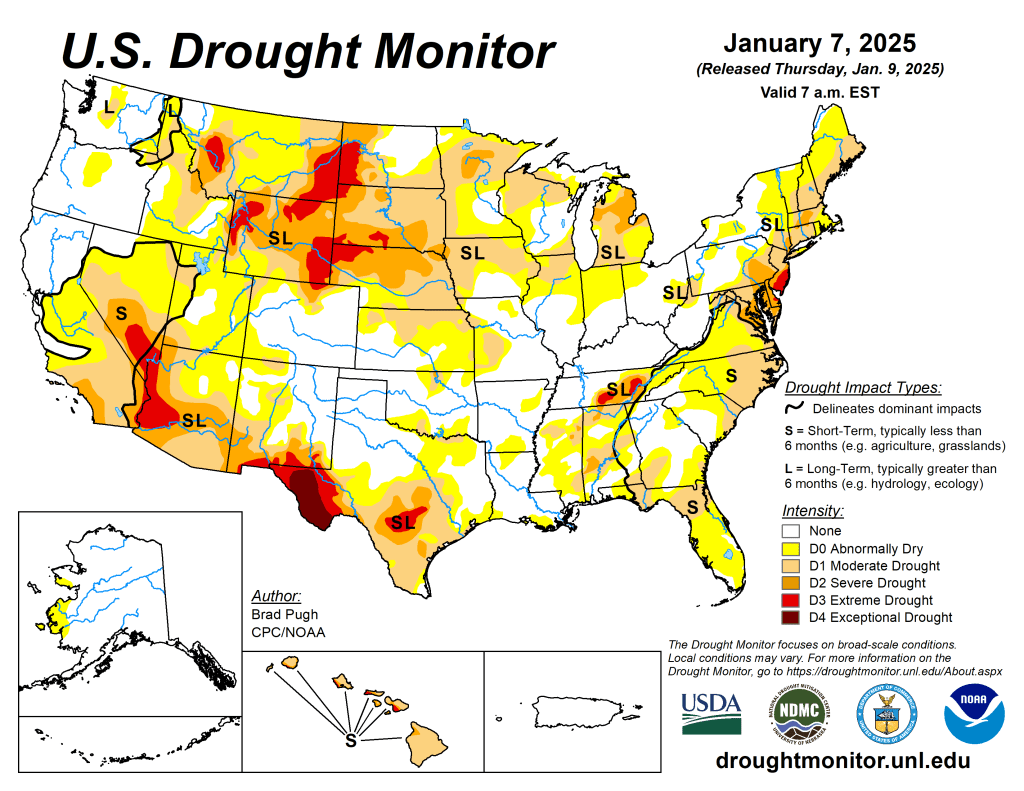
US Drought Monitor map January 7, 2025. 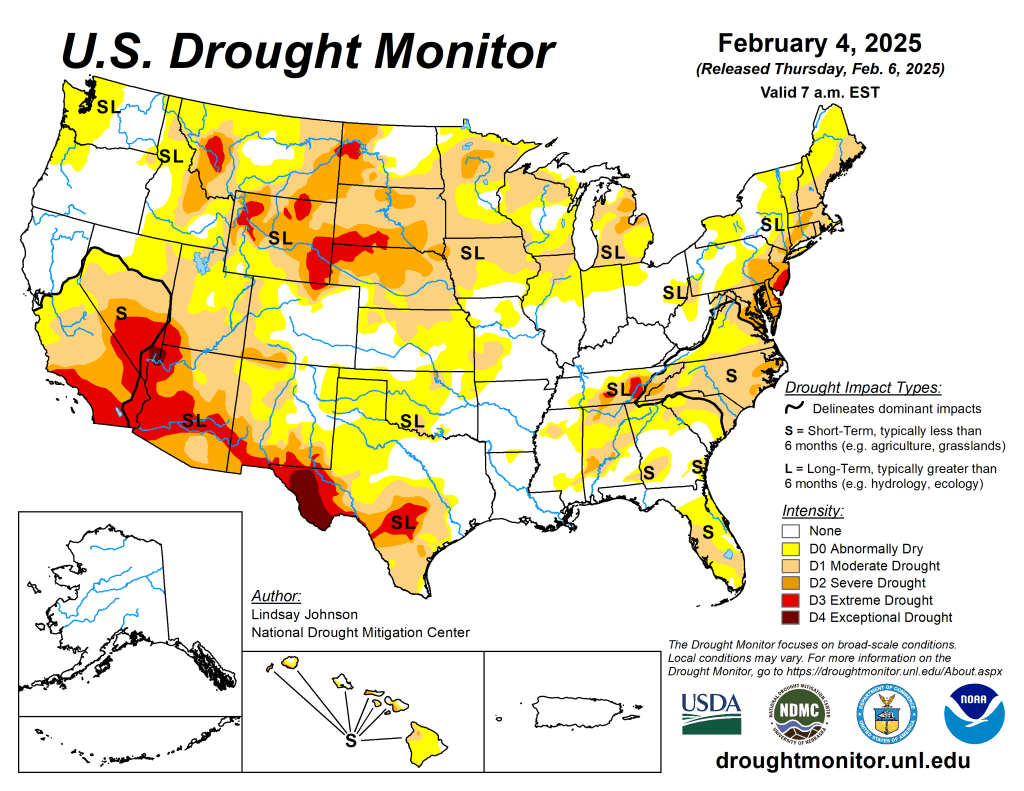
US Drought Monitor map February 4, 2025. 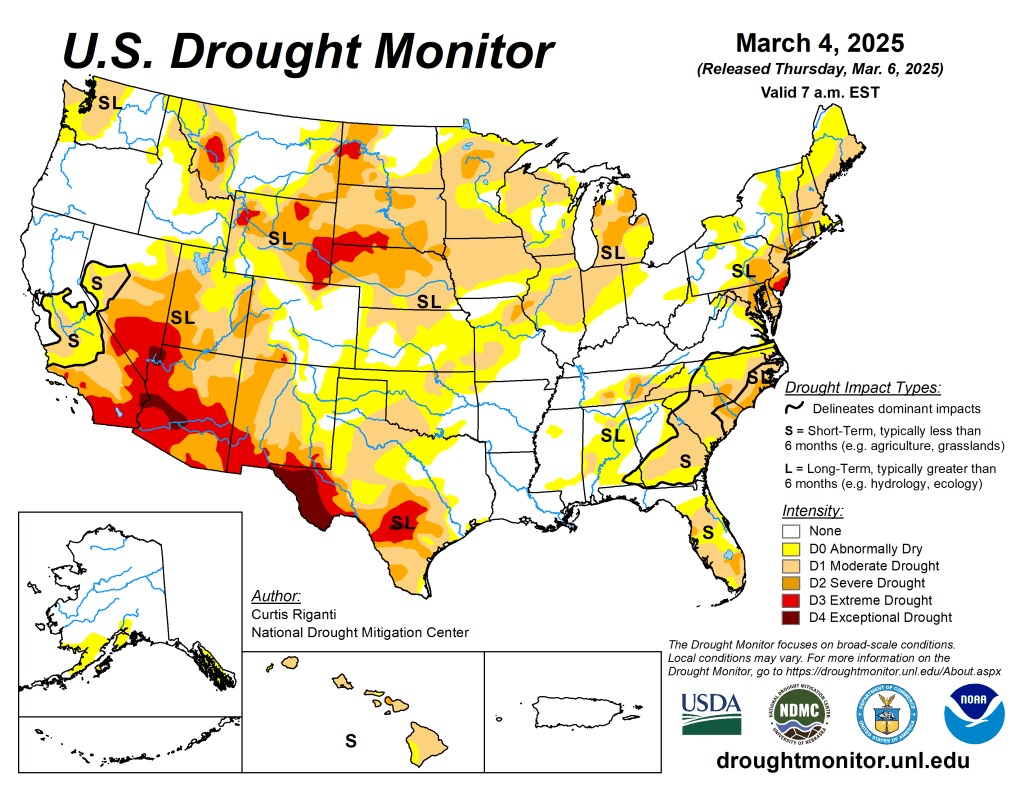
US Drought Monitor map March 4, 2025. 
US Drought Monitor map April 1, 2025. 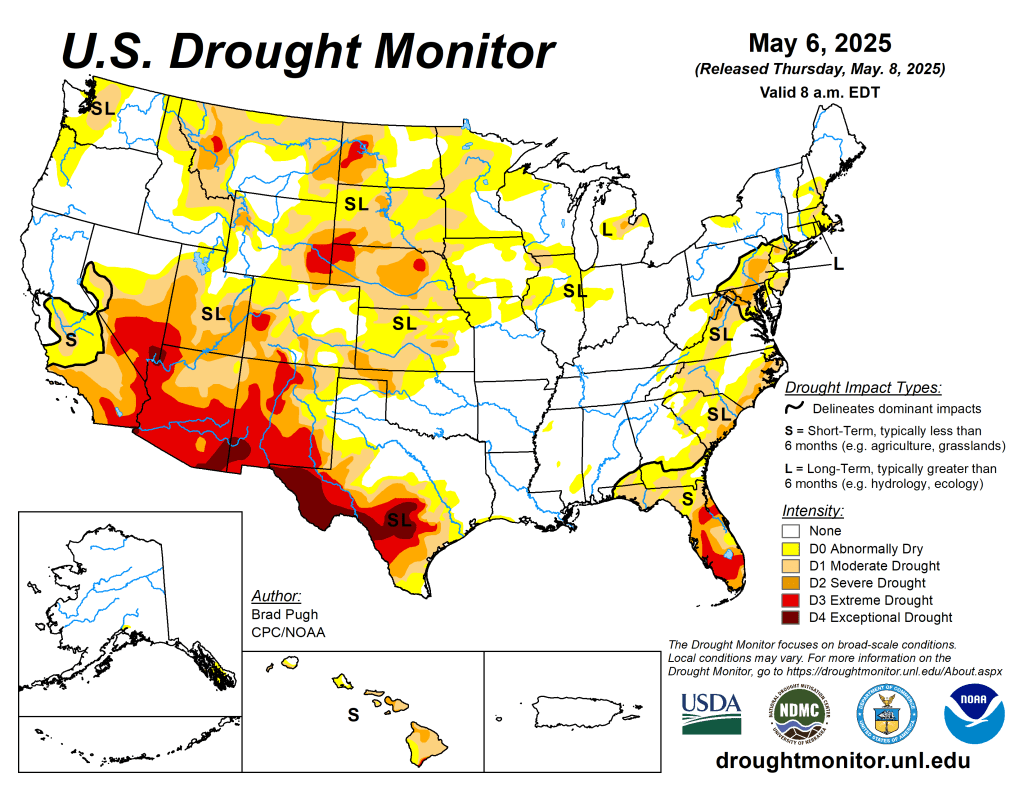
US Drought Monitor map May 6, 2025. 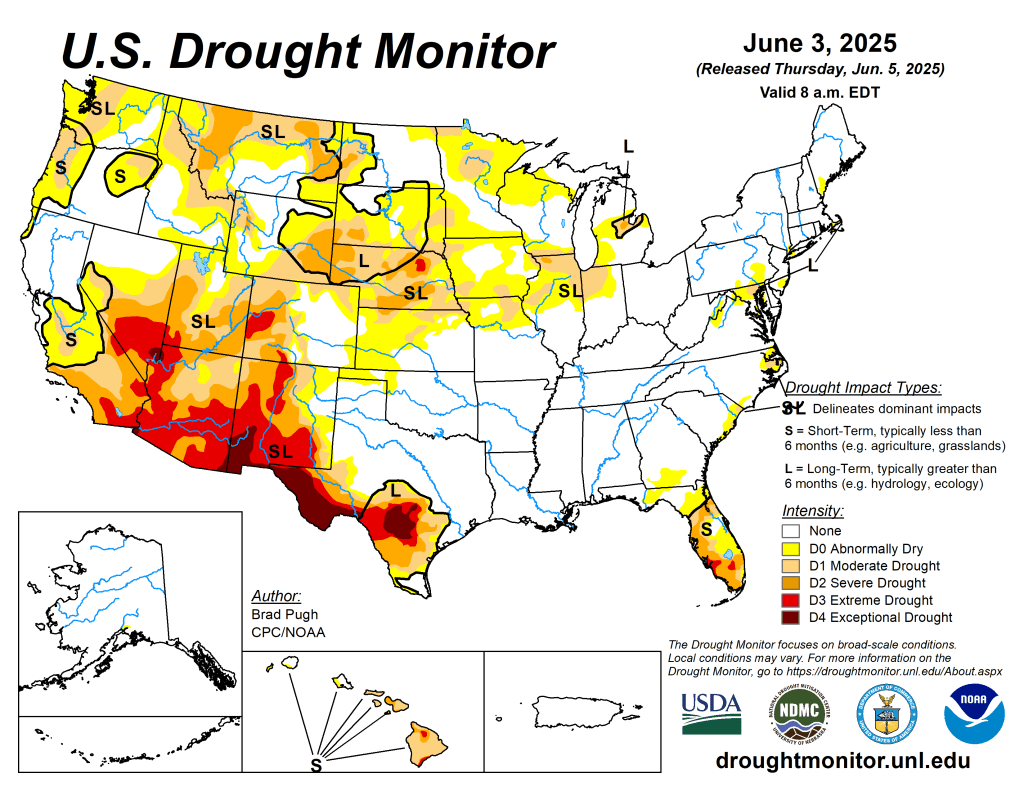
US Drought Monitor map June 3, 2025. 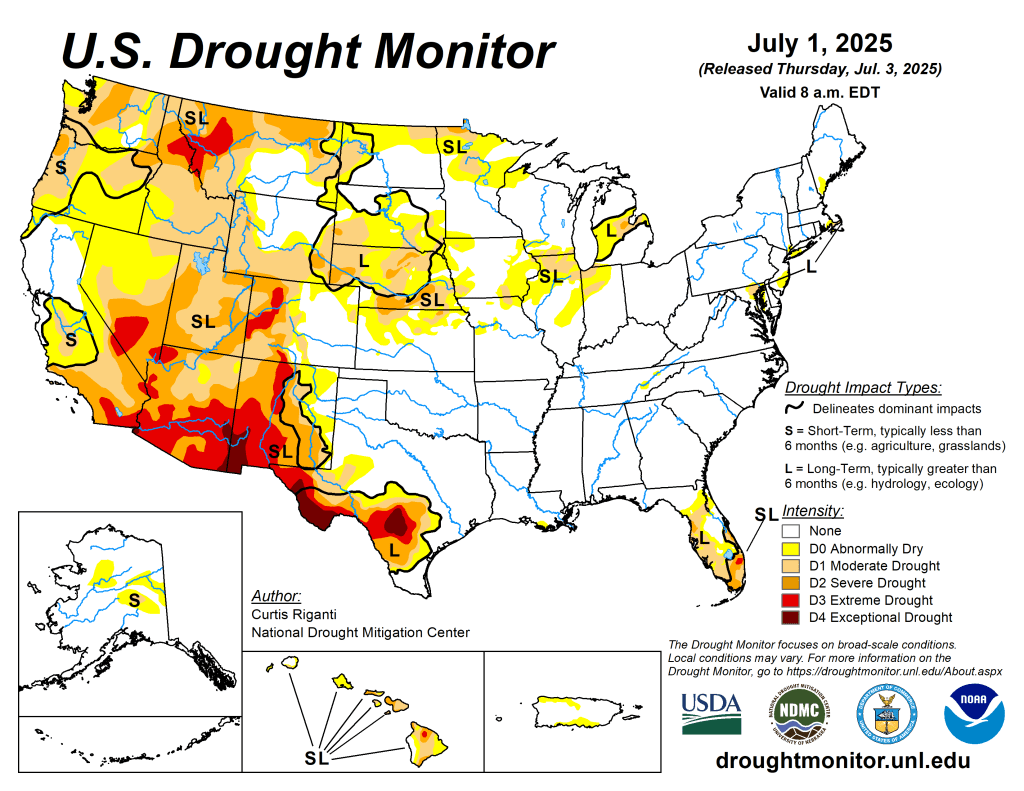
US Drought Monitor map July 1, 2025. 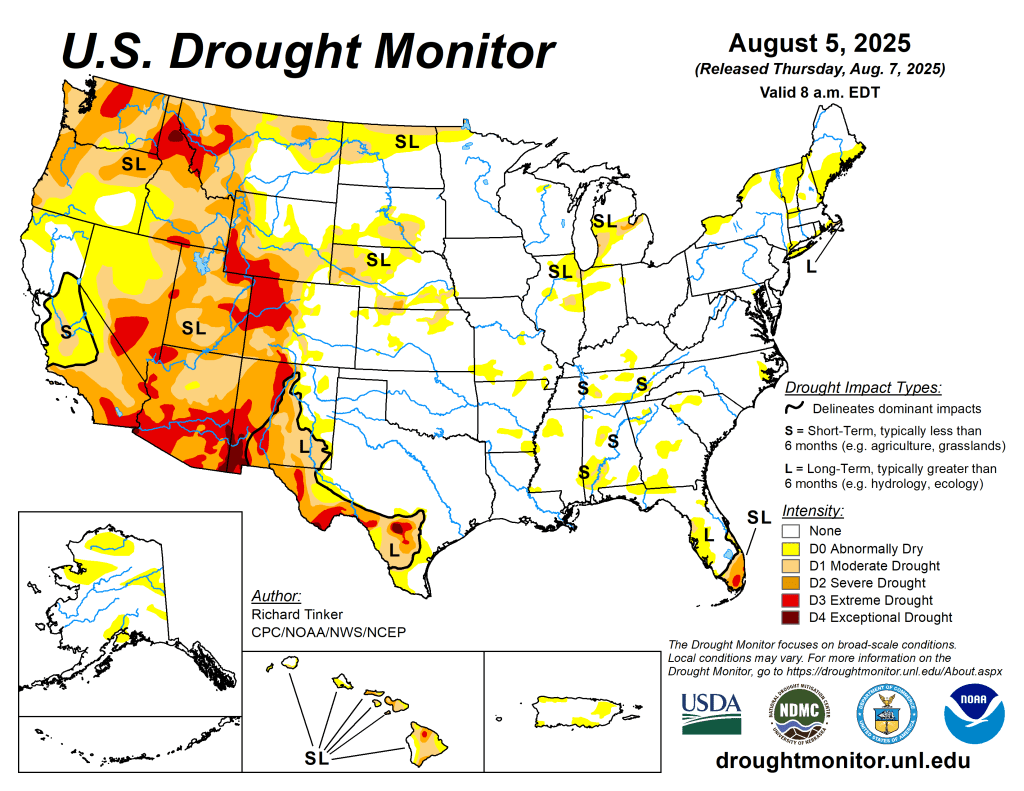
US Drought Monitor map August 5, 2025. 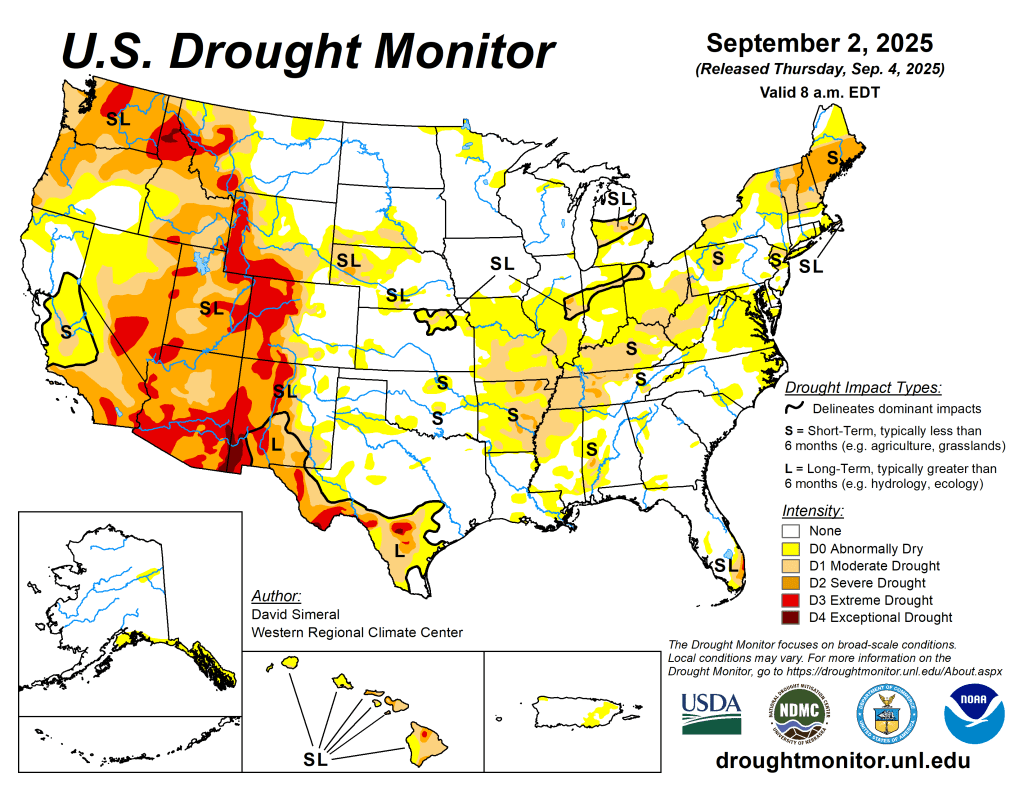
US Drought Monitor map September 2, 2025. 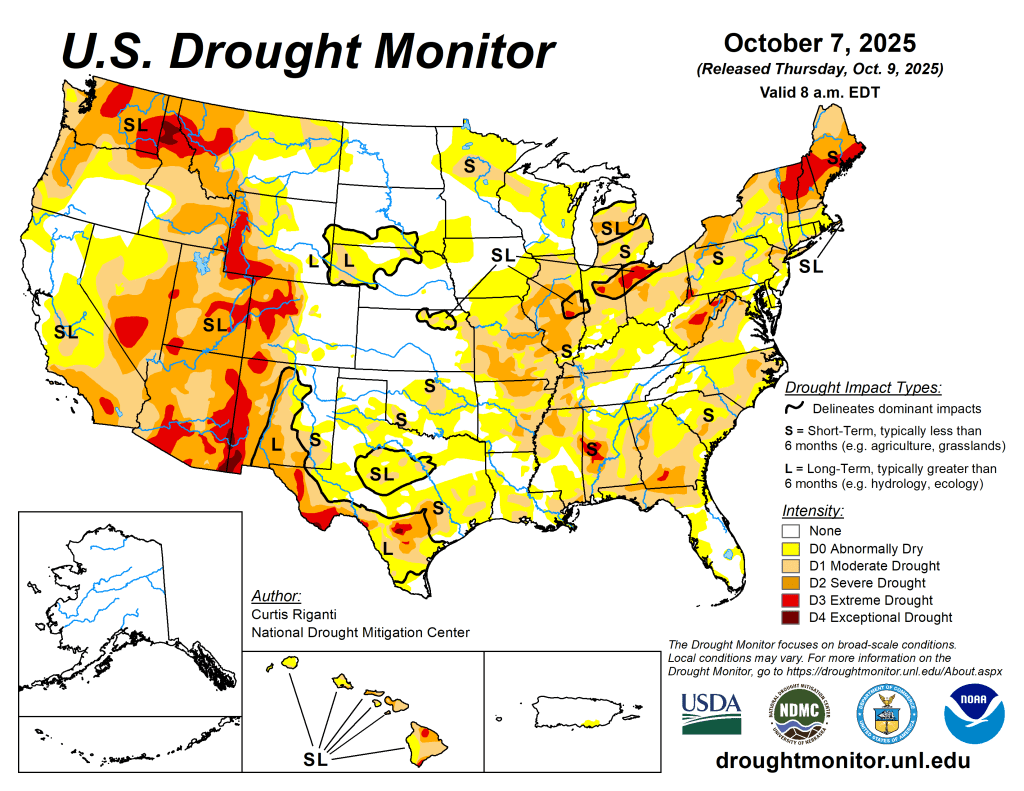
US Drought Monitor map October 7, 2025. 
US Drought Monitor map November 4, 2025. 
US Drought Monitor map December 2, 2025.
2025: A Warm Year Overall
Across much of the U.S., 2025 was a warm year, with annual temperature averages of up to 5° Fahrenheit (F) above normal in most areas. The greatest departures were in the Great Basin, Northern Rockies, and along the southern border. A few spotty areas around the Nation were slightly cooler than normal in 2025, particularly east of the Mississippi River.
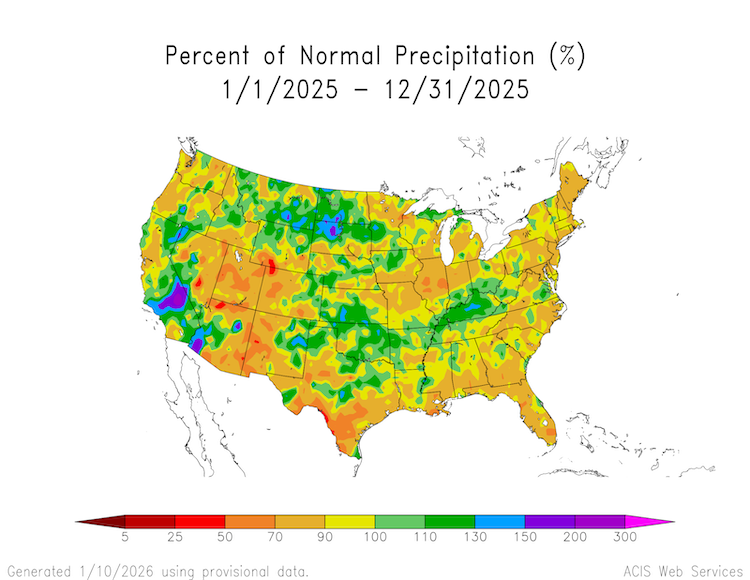
2025 brought a mix of precipitation to the U.S. The Pacific Northwest, Mountain West, Midwest, South, and Northeast were drier than normal. Conditions were particularly poor in the Mountain West and South Texas, where annual precipitation was 50-90% of normal. Southern California, the Dakotas, and southeastern Arizona were wetter than normal.

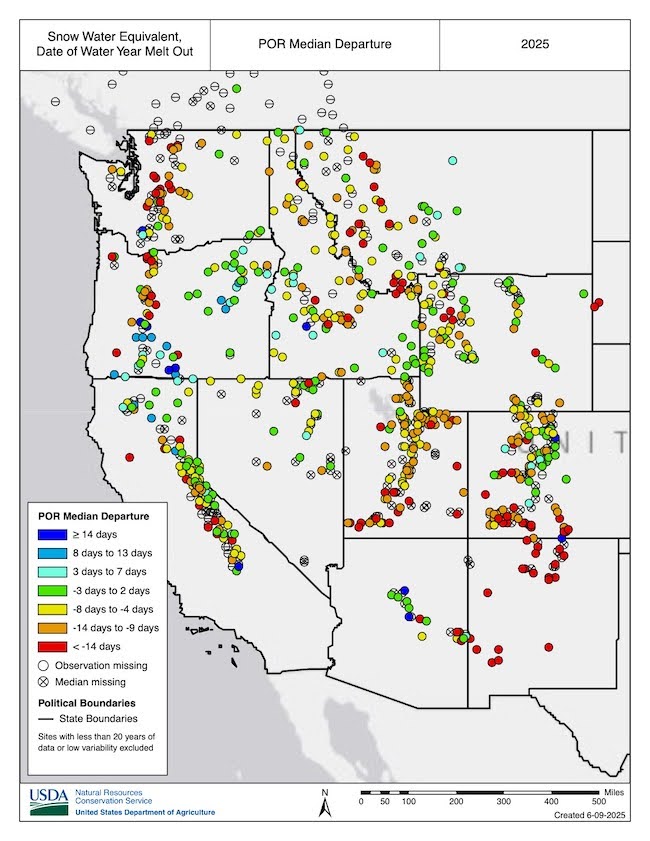
Heatwave Leads to Early Snowmelt, Runoff in Western U.S.
In the West, about 70% of the water supply comes from snow stored in the mountains. Across the West, snow water equivalent on April 1, 2025 was near-normal in most northern watersheds and below normal in watersheds south of the Central Rockies. But April and May brought heatwaves to the mountains, melting snow out much earlier than normal. Rapid melt out occurred across Utah, Colorado, and New Mexico, pushing some basins from above-average snowpack to snow drought conditions in under a month, with snow disappearing 1-4 weeks early.
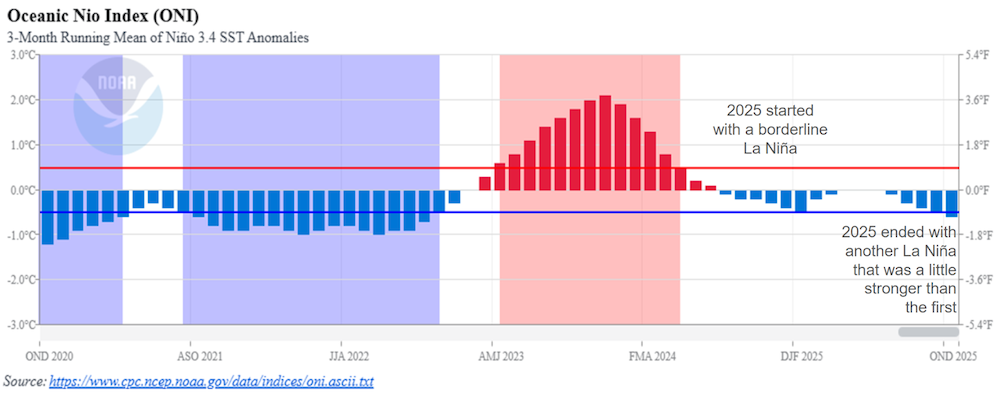
La Niña Double Dips
2025 was shaped by two La Niña events. La Niña is one of two phases of the El Niño-Southern Oscillation. La Niña typically brings cool, wet winter conditions to the Northwest U.S., and warm, dry winter conditions to the Southern U.S. The first La Niña was a borderline event, which peaked around January 2025, and then waned by the end of spring. The second was a little stronger, but still considered weak compared to most historical La Niña events. It began developing around August and continues through winter 2025-26.
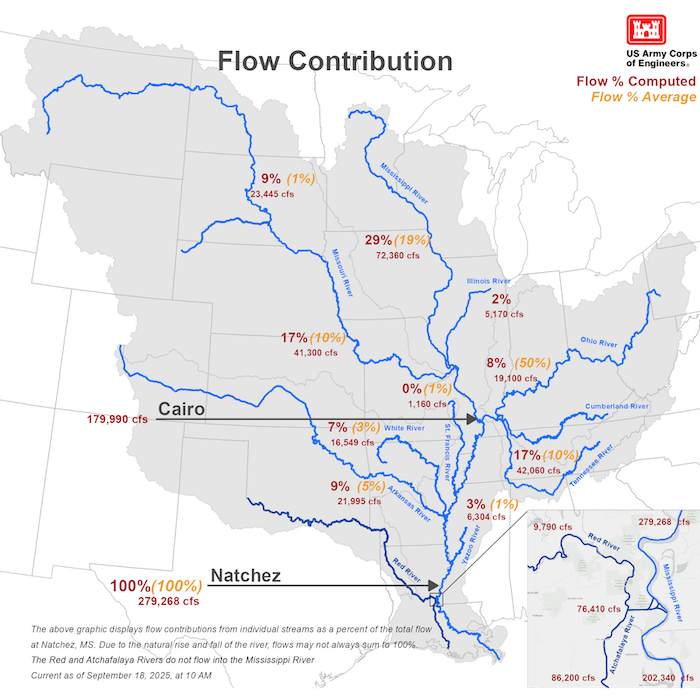
Low Water Levels on the Mighty Mississippi
Extremely dry conditions across the Ohio River Basin and southern portions of the Midwest in August and September led to the rapid expansion of drought and decreased flows on the Ohio River and portions of the Lower Mississippi River. In Mid-September, the Ohio River was contributing only 8% of the overall water flow in the Lower Mississippi River, compared to its typical 50% contribution. The Ohio River at Cairo, Illinois (where the Ohio meets the Mississippi River) fell below 10 feet.
Drought Peaked in November at 36%
In late November, the 2025 drought reached its national peak, with 36.65% of the U.S. in drought (D1-D4) according to the U.S. Drought Monitor. November 2025 temperatures were above to much above average throughout most of the Western and Central U.S. Idaho, Nevada, Oregon, Texas, and Utah set new statewide records for November average temperatures. Portions of the northern Great Basin, Northwest, and Rockies and much of the country east of the Mississippi River saw below-average precipitation.

.
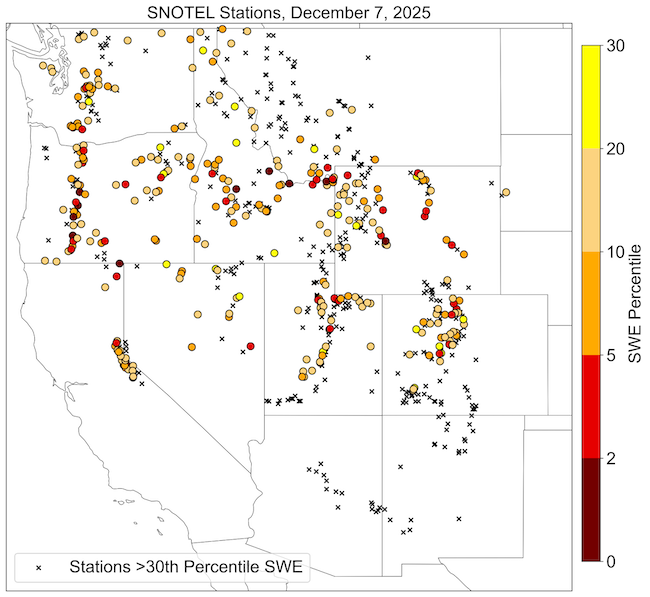
Winter Brings Rain Instead of Snow to the West
Winter 2025-2026 kicked off with warm weather and rain instead of snow. Nearly every major river basin in the West experienced a November among the top 5 warmest on record. On December 7, 2025, snow cover across the West was the lowest amount for that date in the MODIS satellite record (since 2001), at 90,646 square miles. Water Year 2026 (October 1, 2025–September 30, 2026) precipitation to date was near or above median for many parts of the West in late December. However, much warmer-than-normal temperatures caused precipitation to fall as rain instead of snow in many basins, leading to snow drought despite wetter-than-normal conditions across most of the West. At the end of 2025, snow drought was most severe across much of the Sierra Nevada in California, the Cascade Range in Washington and Oregon, the Blue Mountains of Oregon, and the Great Basin in Nevada.
Keep Up With the Latest Conditions and Outlooks
Find maps, publicly accessible data, and recent research about drought and wildfire on drought.gov. You can also subscribe to NIDIS emails for the latest regional drought updates, webinars, and news in our drought early warning system regions. To stay up to date on the latest drought conditions, sign up to receive drought alerts for your city/zip code when the National Weather Service updates their U.S. Drought Outlooks.