The tropical Pacific Ocean has been giving mixed signals recently, making a forecaster’s job even more difficult! In short, many of the computer models we use are predicting the development of El Niño over the next several months, but current conditions in the tropical Pacific aren’t showing many of the elements we’d expect ahead of a developing El Niño.
We’ve had neutral ENSO conditions since January, and forecasters predict that continued neutral is the most likely scenario through at least June. By September, chances of El Niño rise to about 50%, a slight edge over neutral (~40% chance) or La Niña (~10% chance).
What are forecasters seeing now?
We rely on prediction models because they provide the most likely evolution of the ENSO system better than we can compute on our own by eyeballing maps and charts and analyzing what has happened in the past under similar conditions.
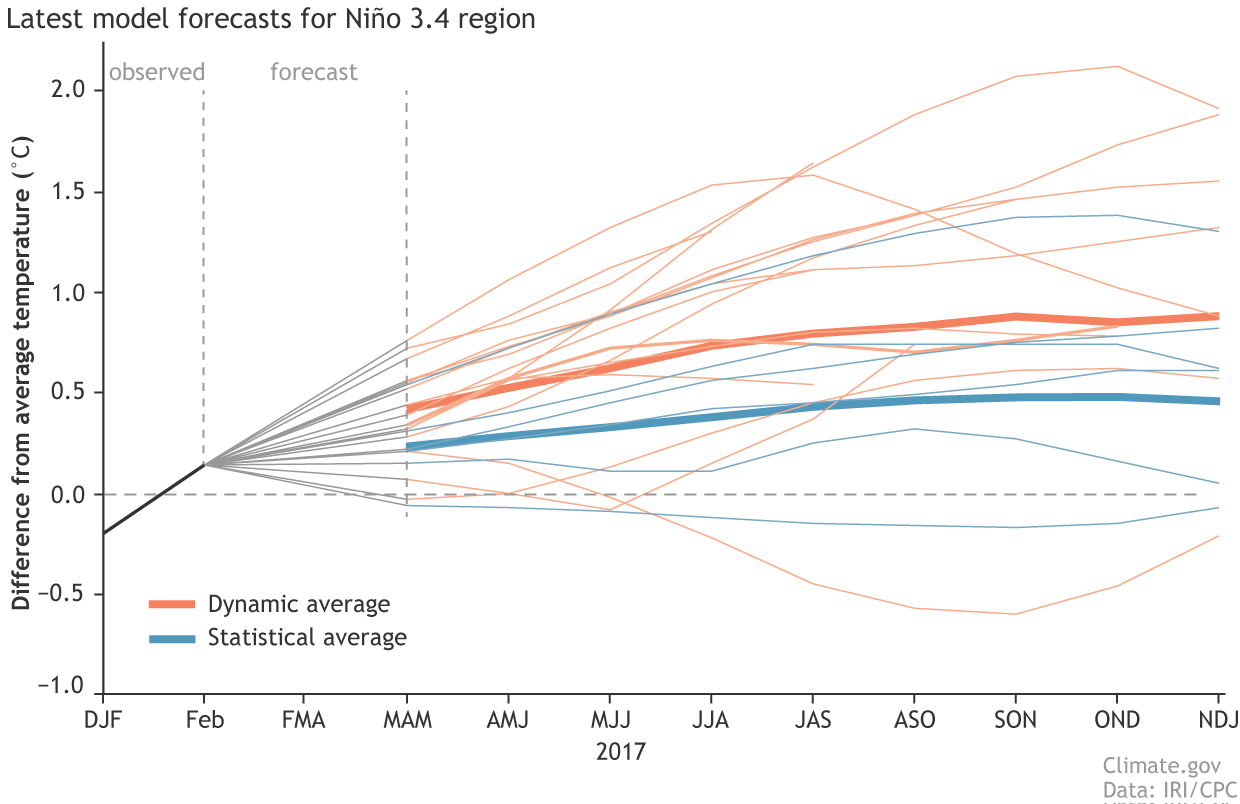
Right now, many climate forecast models do predict the development of a full-fledged El Niño during this summer or fall. It’s likely that these models are acting on the much warmer-than-average waters near the coast of South America—the “Coastal El Niño” that I’ll get to a little bit later in this post. Predictions for the Niño3.4 region in the east-central Pacific, shown in the figure below, show chances for El Niño ramping up over the next year.
Climate model forecasts for the Niño3.4 Index, from the IRI/CPC Prediction Plume. Orange lines indicate the dynamical models and blue lines show the statistical models, with thicker lines depicting the average of the models. Niño3.4 values in excess of +0.5C are reflective of El Niño conditions. Image modified by NOAA Climate.gov.
While nearly all of the available dynamical models are predicting an El Niño, only about half of the statistical models are, and those that do are predicting a weaker event than the average of the dynamical models. Statistical models are based on previous events, and right now the tropical Pacific does not look much like it has before past El Niños.
As we have discussed in the past on this blog, El Niño sets in when the ocean and the atmosphere show coupled behavior—that is, when a stronger link develops between the warming waters in the central and eastern tropical Pacific, and the slowing down of the Walker circulation, in which the westward-blowing trade winds near the surface weaken and the eastward-blowing upper level winds also weaken.
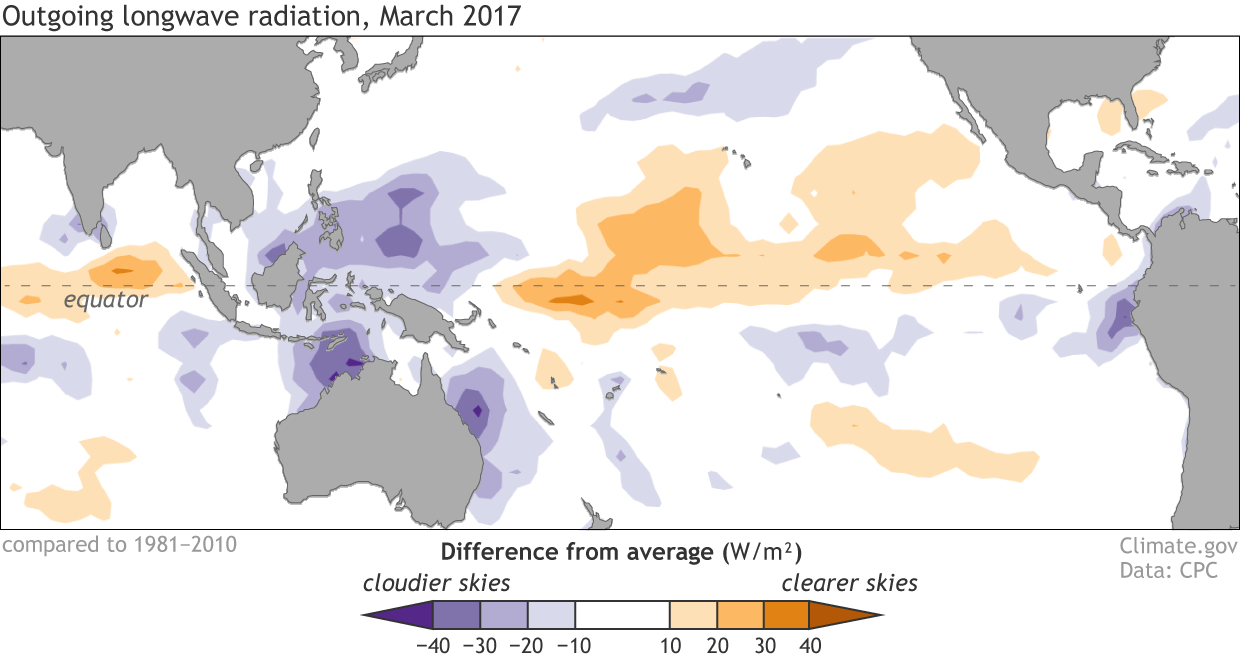
Right now, the tropical Pacific Ocean is split. There is warmth in the eastern Pacific Ocean (the Coastal El Niño—I’ll get to that, I promise). But the western and central Pacific Ocean actually look more reflective of cool, La Niña-like conditions! This is indicated by drier conditions near the Date Line and wetter conditions over Indonesia.
Places that were more (purple) or less (orange) cloudy than the 1981-2010 average during March 2017, based on satellite observations of outgoing longwave radiation (heat). Thick clouds block heat from radiating out to space, so less radiation equals more clouds, and more radiation equals clearer skies. Climate.gov map from CPC OLR data.
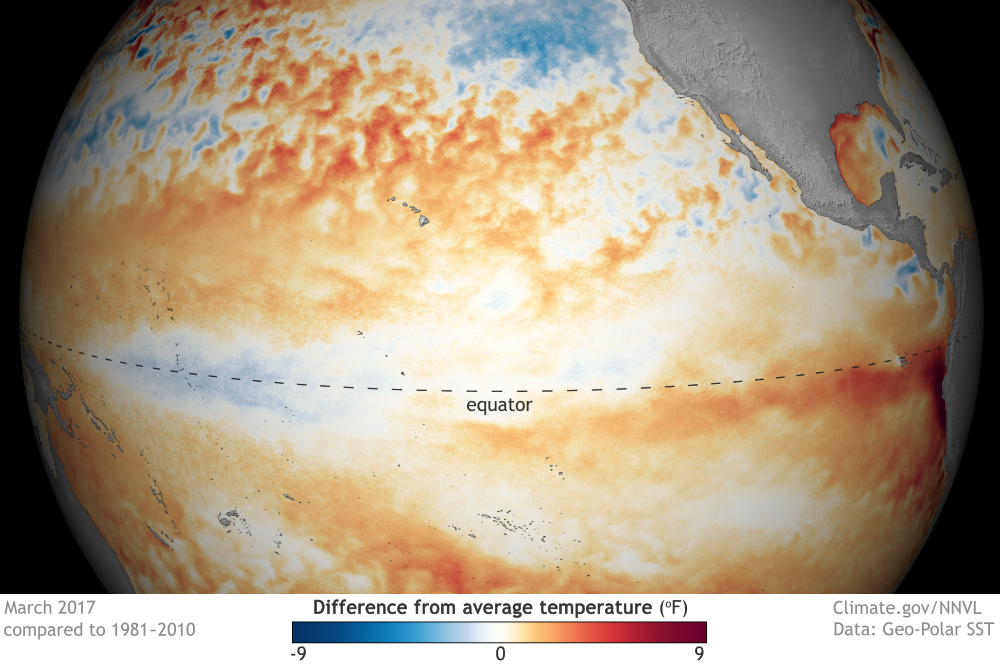
Also, surface winds over the west-central Pacific have been blowing stronger than average (a stronger Walker circulation, more like La Niña). Meanwhile, the surface temperatures in the central Pacific are cooler than average, also more like La Niña than El Niño. Even the sub-surface ocean temperatures are below average in the central Pacific over the past month. As Aaron pointed out, in advance of an El Niño, we would want to see heat content that is above average.
Sea surface temperature in March 2017 compared to the 1981-2010 average. Cooler-than-average SSTs are present in the central equatorial Pacific and warmer-than-average SSTs are present over the eastern equatorial Pacific. NOAA Climate.gov map, based on GEO-Polar data.
Finally! The coastal El Niño!
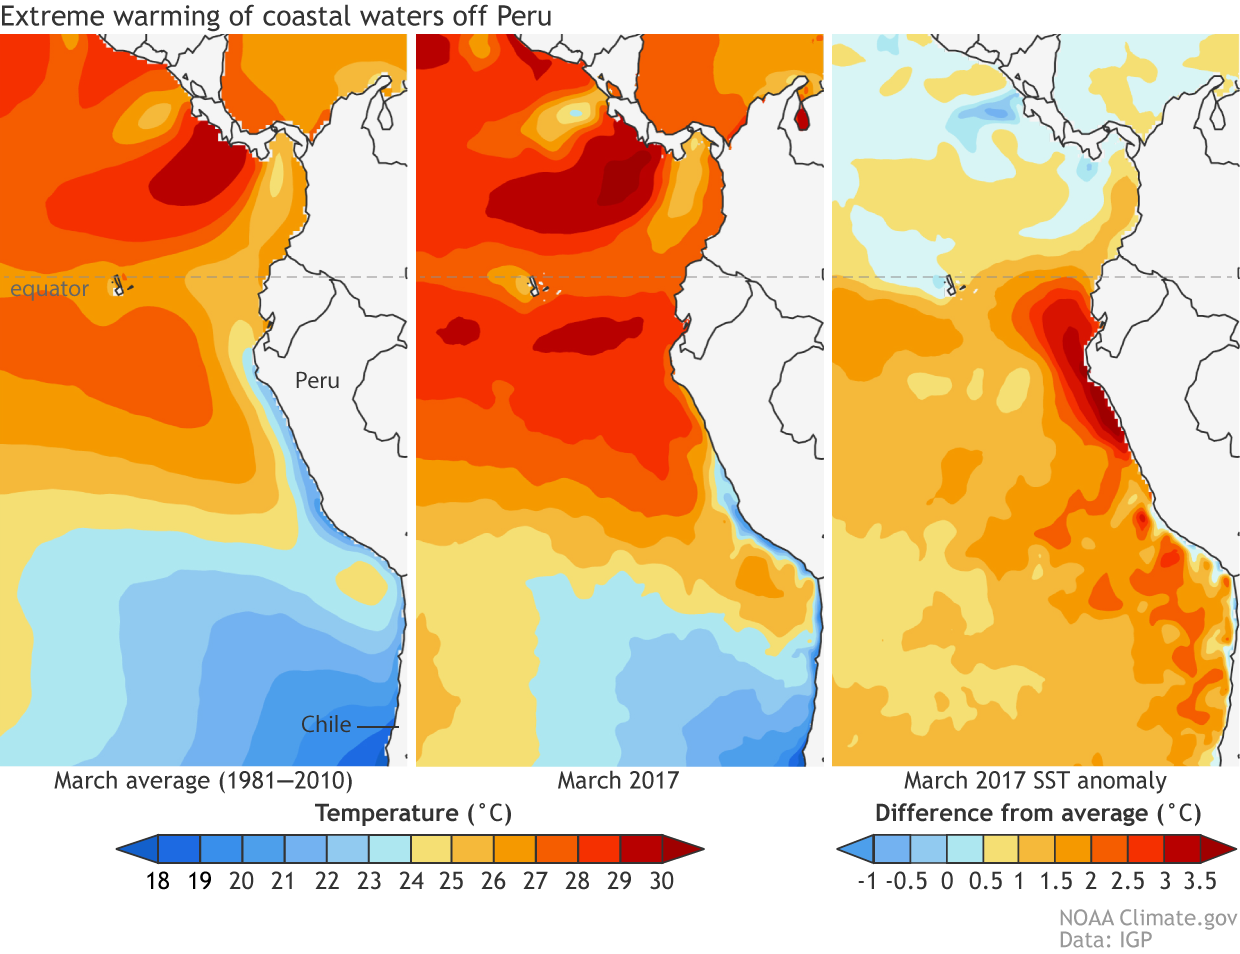
During the last two months, strong warming developed in the eastern tropical Pacific Ocean, hugging the western coast of South America. Emily noted back in early February that the Peruvians designated this abnormal warmth as a “coastal El Niño” and it has resulted in unusually heavy rainfall along the coast of Ecuador and northern Peru, rivaling the major El Niño events in 1997-98 and 1982-83.
This local event is different from the El Niño-Southern Oscillation (ENSO) we’ve come to know and love, which spans the width of the Pacific Ocean basin. Coastal events tend to arise during the February-April period because sea surface temperatures are typically near the warmest of the year. Heavy rainfall starts when surface temperatures exceed roughly 28˚C (82°F). Ken Takahashi (Instituto Geofisico del Peru) provided the data below showing this coastal event over the past month.
Average of sea surface temperatures (SST) in the eastern Pacific during March from 1981-2010 (left panel), for March 2017 (middle panel), and for the difference between the left and middle panels, showing the SST anomaly, or departure from average, during March 2017 (right panel). Climate.gov map from IGP using UKMet OSTIA data.
Does a coastal El Niño often turn into ENSO events?
Interestingly, it was Peruvian fishermen who first gave “El Niño” its name in the late 1800s, when they noted unusual oceanic warmth near their coast. Later researchers, most notably Jacob Bjerknes in 1969, realized that the El Niño—the cycle in ocean temperatures—was often connected to the atmosphere above it, the “Southern Oscillation.” The latter is more far-flung, and reflects the change in the tropical Pacific circulation (winds, convection) that overlies changes in the ocean. The basin-wide El Niño-Southern Oscillation (ENSO) phenomenon was corroborated in the early 1980s, when detailed information became available with the advent of satellites and advanced monitoring systems like the Tropical Atmosphere Ocean (TAO) buoy array.
Although basin-wide El Niño events were once thought to originate as coastal El Niño events (footnote 1), we’ve since learned that this is not always the case. Coastal warming sometimes precedes strong coupling between the ocean and atmosphere (ENSO events) that span the entire tropical Pacific Ocean, but not always.
In this war of East versus West, which will eventually win out?
Most of the dynamical models favor the eastern pattern “winning” with an expansion of the coastal El Niño into a full-blown El Niño event. Mind you, only once since 1950 have we seen a sequence of El Niño, La Niña, El Niño during three consecutive years—in 1963-66.
While many models have been quite persistent over the last few months in their predictions for El Niño, they carry fairly wide uncertainty envelopes that translate into tempered probabilities for El Niño. Plus, we are still in a period of less skillful forecasts associated with the spring ENSO predictability barrier. Given this low model skill in the past at this time of year, and the conflict between the warm eastern Pacific and the relatively cool western Pacific, forecasters find that the odds of development of El Niño in the next six months, while elevated, are not quite at the threshold for an El Niño Watch.
Click here to go to the US Drought Monitor website. Here’s an excerpt:
Summary
Moderate to heavy precipitation (generally 0.5-3.0 inches, locally greater) was widespread across the contiguous U.S. (CONUS) during the past 7-days, with the notable exception of the Southwest and the southern High Plains region. There were also numerous reports of severe weather over the central and eastern CONUS, and strong winds over portions of the Pacific Northwest and northern Rockies on April 7th…
The northern and central Plains
The dryness/drought area over the northern Plains was re-configured this week, after a regional reassessment of conditions. The moderate drought (D1) area was shifted a bit to the west into northeastern Wyoming. This re-configuration reflects the recent precipitation that has been beneficial at the start of the growing season, and is focused primarily on the past 30-60 days. In addition, D0 was expanded in southwestern North Dakota to include the counties of Hettinger, Grant, Adams, and western Sioux. In southwestern Kansas, where generous rains (4-7 inches) fell during the past 30-days, a one-category improvement was made to the depiction. In contrast, where 1.5-3.5 inches fell during the same period, a one-category degradation was rendered to the depiction in northwestern and north-central Kansas. Several small-scale improvements were also made in eastern Colorado this week, including the removal of severe drought (D2) in north-central portions of the state, and much of the nearby D1 area…
The southern Plains
A one-category improvement was made in the Oklahoma Panhandle this week, which resulted in the elimination of lingering severe drought (D2). ACIS PNPs out through at least the past 90-days are easily in excess of 100-percent of normal, and often 200-percent or higher. This past week, 4-inches or more of rain merited a one-category improvement for the extreme southeastern Oklahoma counties of McCurtain and eastern Choctaw. In the eastern portion of the state, D2 (S) was expanded, and connected with the D2 area in neighboring Arkansas. In Texas, minor revisions were rendered to the depiction, until the final precipitation numbers came in for rainfall received between 12z Monday and 12z Tuesday (the final 24 hours of the data inclusion period for the week). This rainfall (in some cases up to 8-inches) resulted in substantial one-category improvements across the northeastern part of the Lone Star state…
The West
No changes were made to the drought depiction this week across the West. Recent stats for California (taken from the California-Nevada Drought Monitor Discussion Call) show an incredible year for precipitation and runoff. In the Sacramento area, the precipitation percentages since October 1, 2016 range from 120-percent to 300-percent or more of normal. The Northern Sierra 8-station index is at 205-percent of normal, only 0.8-inch away from the 1982-83 El Nino record, and the Central Sierra 6-station index is at 195-percent of normal. Snowpack is equally impressive at 157-percent and 180-percent of normal for this date in the Northern and Central Sierra, respectively. The Sierra reservoirs have made an amazing recovery this winter, with all the reservoirs at or just above their Top of Conservation levels…
Looking Ahead
During the next five days (April 13-17), the Weather Prediction Center (WPC) predicts 1.0-2.5 inches of precipitation from the southern High Plains northeastward across the mid-upper Mississippi Valley and into the western Great Lakes region. Heavy precipitation (3-4 inches, liquid equivalent) is expected across the Coastal Ranges of the Pacific Northwest and northwestern California, the Cascades of the Pacific Northwest, and the California Sierras. However, these areas are no longer in drought or dryness.
For the ensuing five-day period (April 18-22), there are elevated odds for above-median precipitation across most of the northern and central thirds of the CONUS, while near- to below-median precipitation is favored across the southern tier of states. Below-median precipitation is also favored for all of Alaska.
Northern Water’s Board increased the Colorado-Big Thompson Project quota allocation to 80 percent at its April 13 Board meeting. With many farmers concerned about the lack of recent moisture and the hope that cities may be willing to provide some rental water to help the region’s agricultural economy, the Board chose to make available an additional 30 percent as supplemental quota for 2017.
The approval increased available C-BT water supplies by 93,000 acre-feet, from the initial 50 percent quota made available last November.
The Board considered snowpack totals, streamflow runoff projections and input from farmers and municipal and industrial water providers in setting the quota. C-BT supplements other sources of water for 33 cities and towns, 120 agricultural irrigation companies, various industries and other water users within Northern Water’s 1.6 million-acre service area.
Directors considered the general dearth of moisture in March as they discussed the quota options. March precipitation was 27 percent below normal and contributed to the Board’s decision to raise the quota.
“It’s dry, it really is,” said Board President Mike Applegate. “The C-BT Project was created to provide a supplemental supply and we have the reserves to do that.”
He echoed the Board’s consensus in making its 61st annual C-BT quota. “Let’s make the water available now so our allottees can make their plans.”
Directors base their decision on the region’s need for supplemental water, while balancing project operations and maintaining water in storage for future dry years.
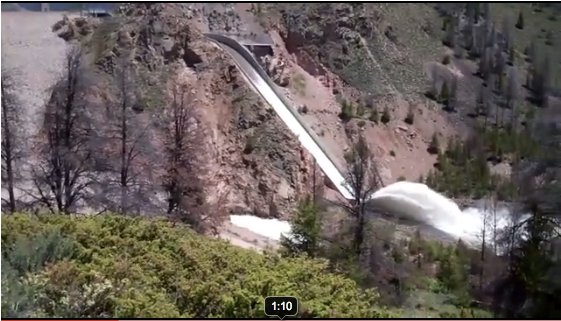
Lake Granby spill June 2011 via USBR. Granby Dam was retrofitted with a hydroelectric component and began producing electricity [in 2011] as water is released in the Colorado River.
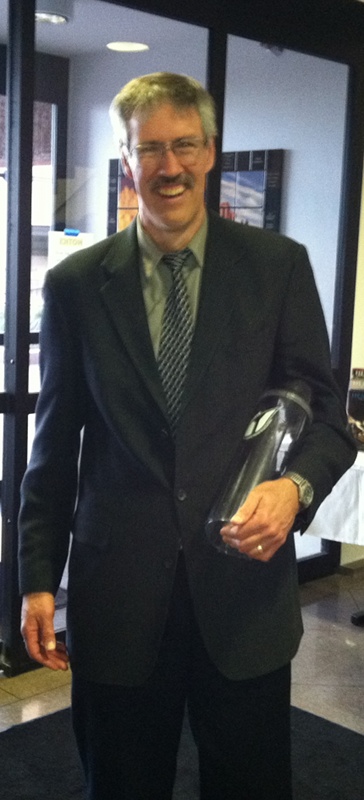
Steve Austin has been measuring the precipitation levels in his backyard every morning since 2005 at his home in Northglenn. Outside of a few weekend trips, he hasn’t missed a day.
“I’ve been doing it so long, it’s just part of what I do,” he said. “Get up, get washed, shaved and measure the rain.”
He doesn’t keep that data for his own amusement but sends it off to the Community Collaborative Rain, Hail and Snow Network, or CoCoRaHS, an international group of volunteers that use their rain gauges to help the National Weather Service and other environmental organizations.
“Moisture is so important,” the retired engineer said. “If you only get one-tenth of an inch, CoCoRaHS wants to know.”
[…]
“Rainfall is so variable,” Education Coordinator Noah Newman said. “A rainstorm could go right in between the official stations of the National Weather Service and they might not know how much rain fell.”
And that’s happened before.
“It all started from the Fort Collins flood in 1997,” Newman said. The weather service’s station was out by I-25 and hadn’t picked up on the dangerous incoming storm. As a result, the community never received a warning to evacuate and five people died.
Colorado State Climatologist Nolan Doesken realized that starting a community network of rain gauges could save some lives and the network was formed, according to Newman.
What began with a handful of people in Colorado now comprises 20,000 volunteers across the United States, Puerto Rico, Canada, the Virgin Islands and the Bahamas.
The nonprofit asks that observers report data every morning, but it’s not required. The only equipment necessary is a $35 rain gauge.
Recording the precipitation measurement is simple. There is a funnel to direct rainwater into a plastic pipe, called the measuring tube, that tells how much rain fell in the past 24 hours.
Measuring snow requires a few additional steps, like weighing the snow from your rain gauge to determine the precipitation amount and reporting the inches of snow in your backyard. Volunteers say it takes between 5 and 15 minutes a day.
The Urban Drainage and Flood Control District (UDFCD) uses this data regularly. They have an alert system of 200 automatic rain gauges across the Denver and Boulder areas to measure and identify when heavy rainstorms are happening and alert the public of appropriate safety measures. But the volunteer data makes this system more robust.
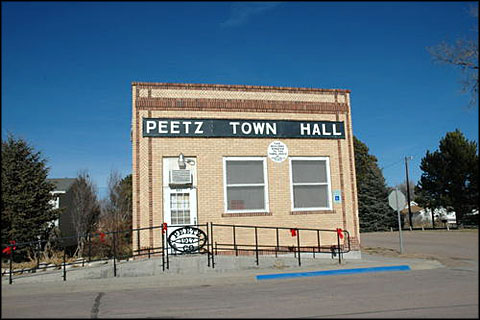
Like many small towns across Colorado, Peetz has been told by the Colorado Department of Public Health and Environment that their sewage lagoons are leaking contaminants into the groundwater and must be replaced or remediated. The decision is based on a calculation of how much wastewater flows into the lagoons, how much evaporation takes place on a monthly basis, and how much water is left in the lagoons. It’s clear from that calculation that more water is flowing in than is evaporating, so the water can only be leaking out the bottom.
The trustees don’t argue that their sewage lagoons are seeping water into the ground underneath them, but they want proof that it’s actually doing harm. They reason that, being more than 150 feet above groundwater, the seepage is cleaned adequately in the earth, sand, and gravel that it percolates through.
It’s not just a stubborn streak in small town folk that’s driving their argument. Although Peetz doesn’t yet have any real numbers on the cost of new lagoons, they know that Fleming has priced theirs at more than $2.5 million. With diminishing assistance from state and federal agencies to pay for that kind of project, Fleming officials already know they’ll have to at least double sewer rates for a population that is largely on fixed income.
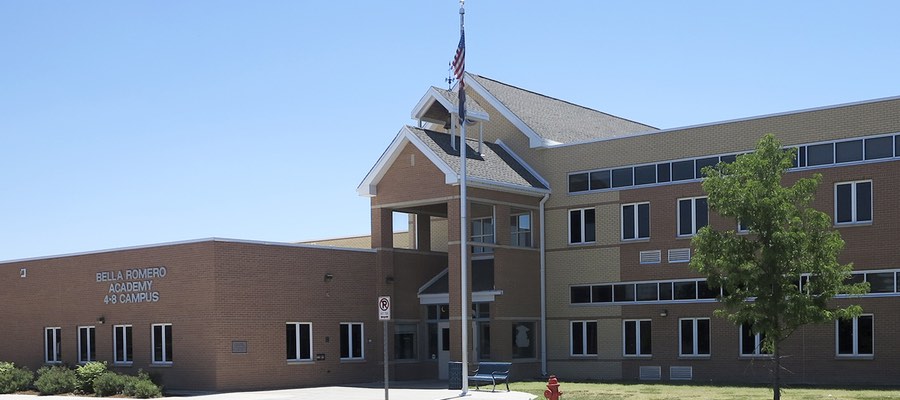
Environmental and civil rights groups filed a lawsuit against the Colorado Oil and Gas Conservation Commission Tuesday, alleging that the regulatory agency violated its responsibility to protect public health and the environment when it approved a 24-well fracking site near Bella Romero Middle School in Greeley.
The plaintiffs, which include the Sierra Club, Weld Air and Water, the NAACP Colorado State Conference and Wall of Women, also say that the COGCC failed to adequately assess whether the site in question was as far as possible from the school and from nearby homes.
Denver-based driller Extraction Oil and Gas is preparing to drill 24 new oil and gas wells in Greeley, located about 1,350 feet from the walls of Bella Romero. The project complies with state law requiring that drilling operations be at least 1,000 feet from schools. But critics say the COGCC did not sufficiently evaluate alternative locations for the development.
“The State of Colorado is failing to protect our children,” said resident and environmentalist Therese Gilbert. “We are subjecting children to conditions that are dangerous at their point in physical development, and then expecting them to actively play in those conditions.”
In an emailed statement, an Extraction spokesman wrote that the company “engaged in both an inclusive and very comprehensive process to obtain permits” for the site, and “that process was completed in compliance with all COGCC regulatory guidelines.” The location, he added, “was part of a series of alternative locations that were identified by Extraction to replace several older-vintage permitted locations, including the Gilbert, Sheep Draw and South Greeley sites.”
State Rep. Mike Foote of Denver proposed a bill that would have required oil and gas setbacks to be 1,000 feet from school property boundaries, not just school buildings. The Senate Committee on Agriculture, Natural Resources, & Energy postponed that bill indefinitely Wednesday afternoon.
Some critics are concerned that Extraction’s proposed project represents a threat to environmental justice, as it will significantly impact a low-income community of color. Bella Romero’s student body is 82 percent Hispanic or Latino.
“Communities of color are already disproportionately burdened by pollution and this is another example,” said Rosemary Lytle, State President of the NAACP Colorado State Conference. “No group of people should bear more than their share of impacts from industrial activities, yet it seems the COGCC does not even consider this.”
Todd Hartman, spokesman for the COGCC, says the agency is currently reviewing the lawsuit and does not yet have a comment.
Here’s the release from the Arkansas River Basin Water Forum (Jean Van-Peldt):
Denver Water lawyer to share message of cooperation
Water agreements are always tricky, a matter of give and take.
Most importantly, they require cooperation.
That’s the message Patricia Wells, general counsel for Denver Water, will bring to the Arkansas River Basin Water Forum when she kicks off the second day of the forum on April 27 at Hotel Elegante, 2886 S. Circle Drive, Colorado Springs. The two-day forum will feature panels and tours to discuss water issues of concern to the Arkansas River basin, and El Paso County in particular.
“We’ll be talking about examples of how, when you’re dealing with the supply gap, you need to deal with others,” said Wells, who is also a member of the Colorado Water Conservation Board. “Multiple parties can accomplish more.”
Wells has represented Denver Water since 1991, coming on board just after the EPA veto of Two Forks. It changed how the state’s largest water provider dealt with the growth of its system, as well as the way it treated its neighbors. Wells came superbly prepared for the job, with her background as Denver City Attorney and as a staff attorney for the Environmental Defense Fund.
“The Two Forks veto came as a result of the environmental laws in the 1970s and ‘80s and was a paradigm shift,” Wells said. “Most large water organizations have gone through a metamorphosis in the last 30 years.”
In the case of Denver Water, that has meant two of the most far-reaching agreements in the history of Colorado Water, both occurring during Wells’ tenure at the legal helm. They were very different types of negotiations.
The first was the Colorado River Cooperative Agreement, which brought together 40 parties, primarily on the Western Slope, which had fought for decades over Denver’s appropriation of Colorado River water. Denver sought the support, or at least lack of opposition, from the communities in order to enlarge Gross Reservoir, a key supply for Denver Water located in Boulder County.
“We did all the right things,” Wells said. “But we’re still in the 13th year of permitting on Gross Reservoir. If we can’t get Gross Reservoir done then water projects can’t be done in Colorado.”
The second was the WISE (Water Infrastructure and Supply Efficiency), which looked at how Denver, Aurora and water providers in the South Metro Water Supply Authority could pool resources.
They were far different negotiations, but the common thread was the need to work together for common interests and to overcome operational hurdles.
“The state Water Plan talks about CRCA and WISE as how projects should be developed,” Wells said. “But I don’t think there’s a single way to do things.”
The Upper Arkansas River Voluntary Flow Management Program, which will be discussed in one of the workshops at the forum, is an example of multiple parties working together in the Arkansas River basin. That program has been in effect since 1991.
“These agreements take a lot of time to put together and a long time to get organized,” Wells said. “It’s about how you work with other people and why you work with other people.”
Registrations and information about this year’s forum are available at http://www.ARBWF.org.
Arkansas River Basin — Graphic via the Colorado Geological Survey