@NOAA: Assessing the U.S. Climate in August 2017

Click here to read the whole report:

Summer was warmer and wetter than average for the United States

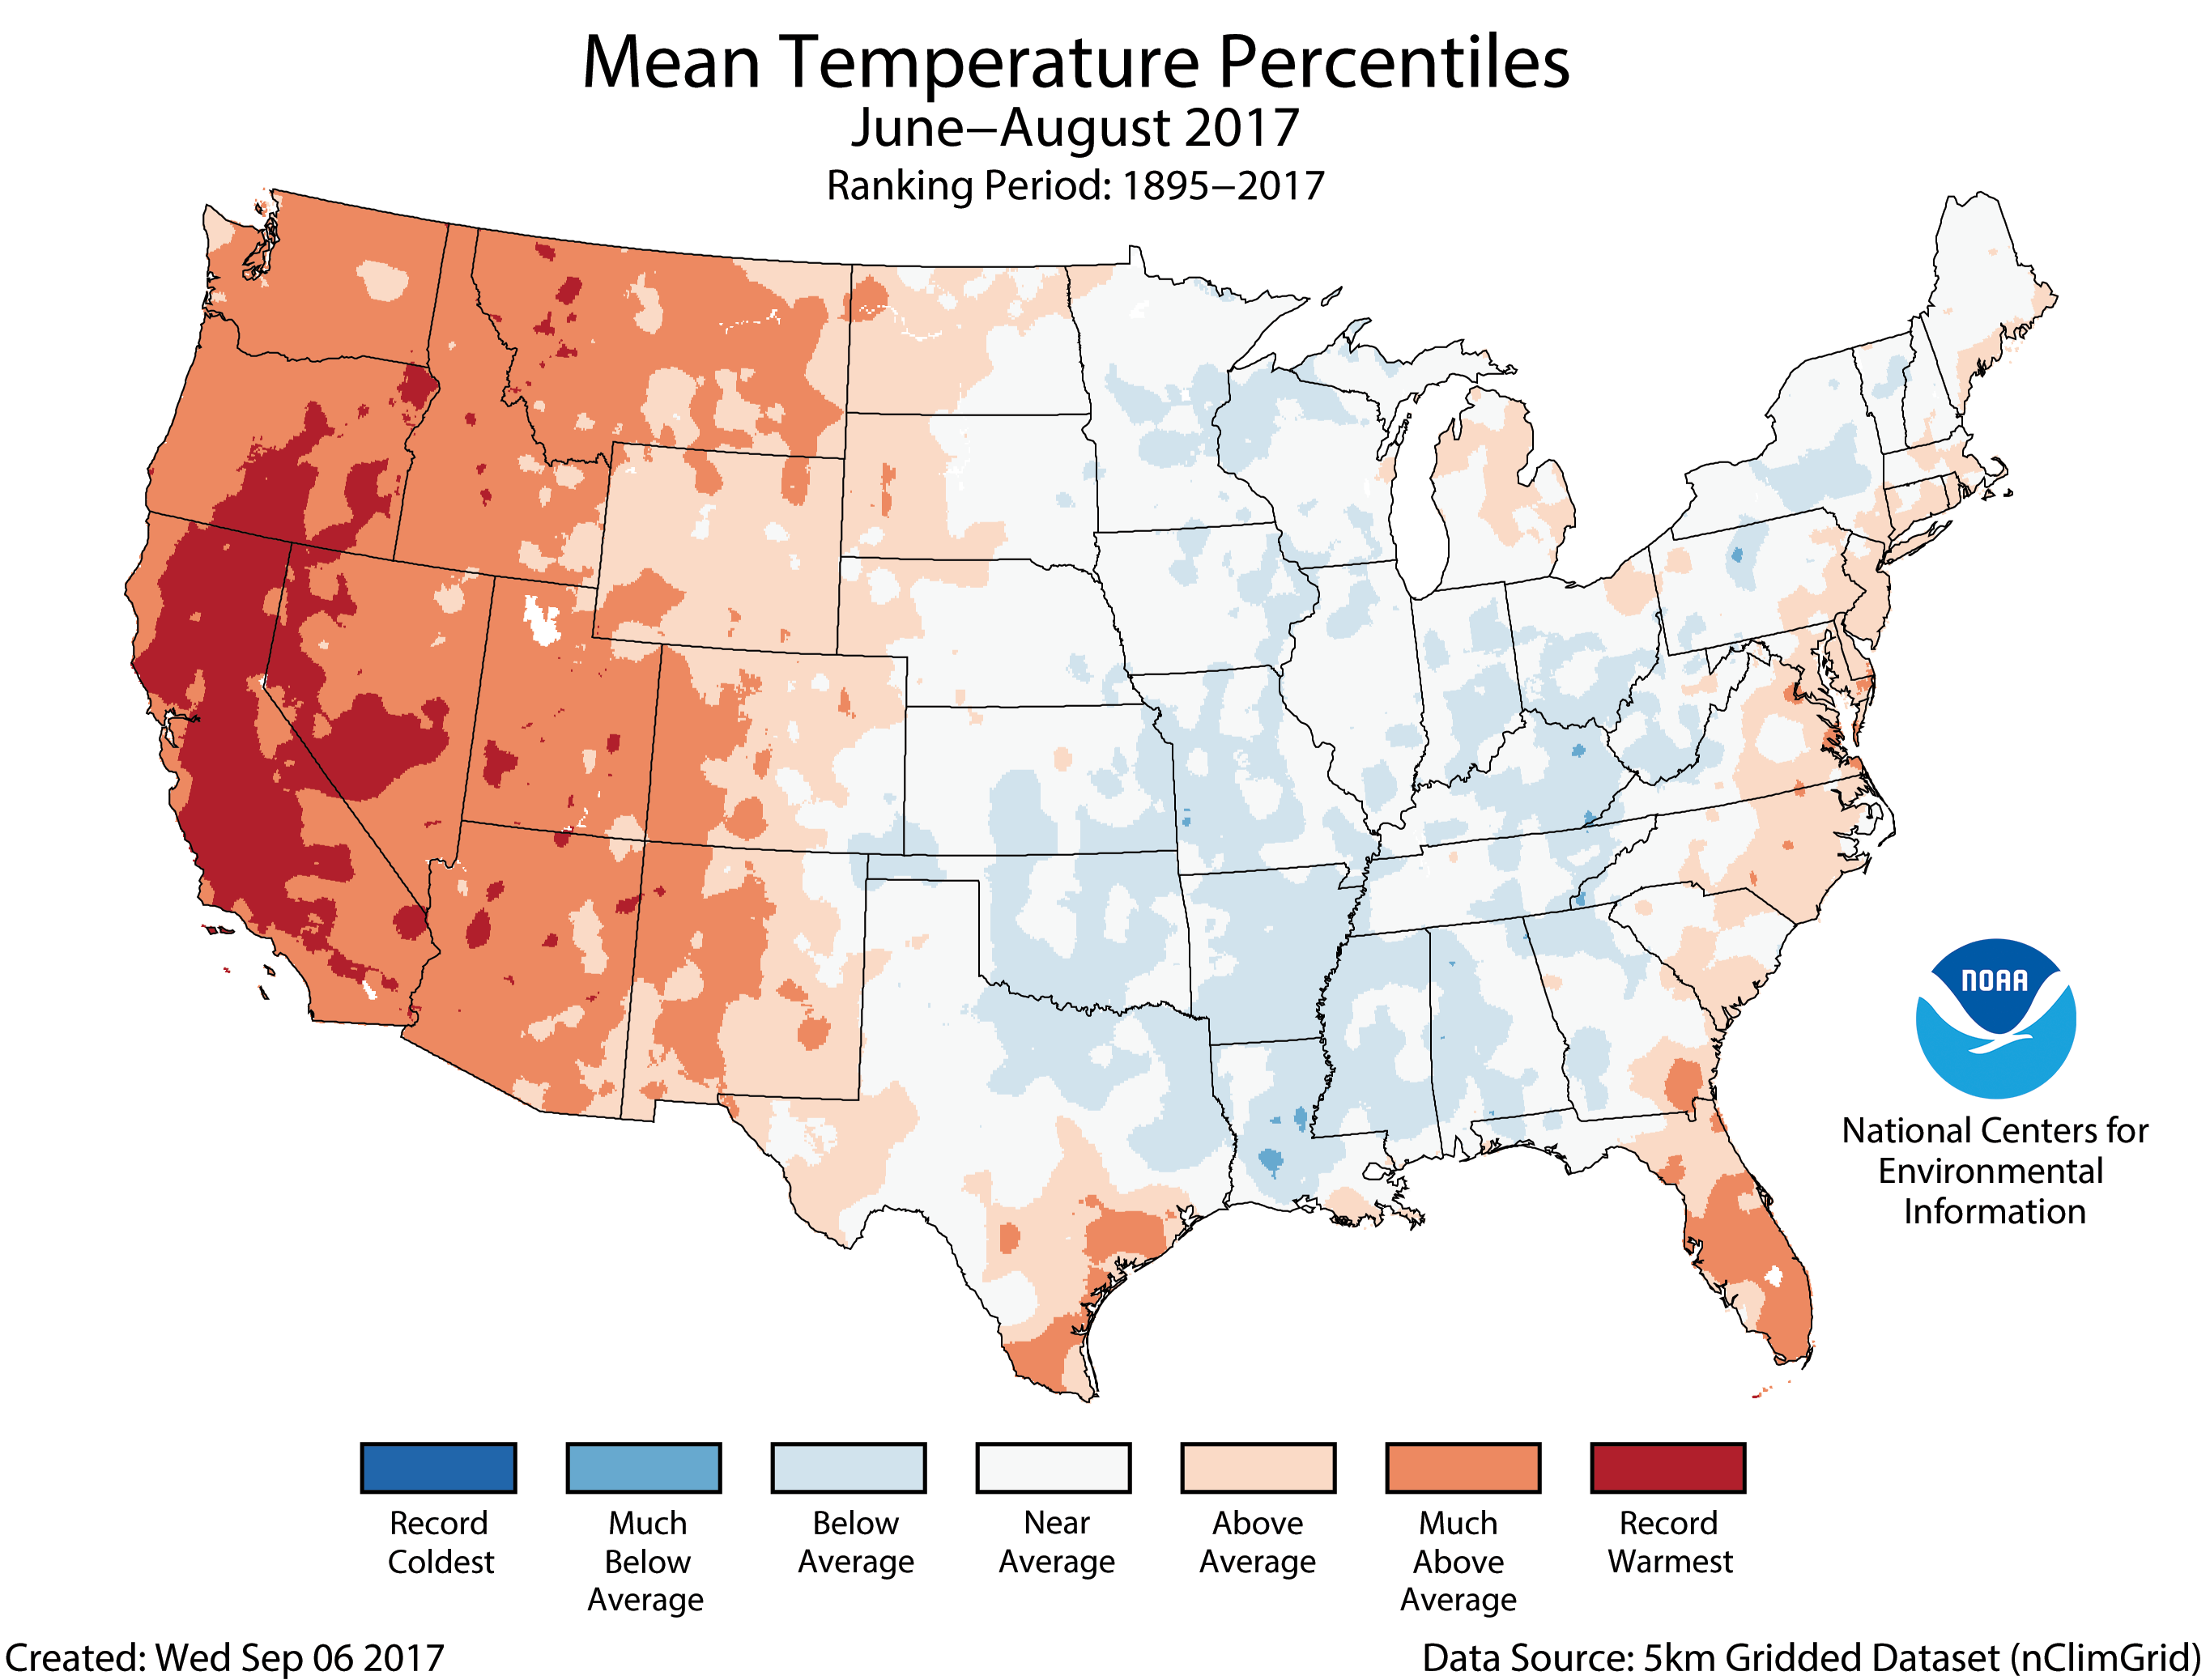
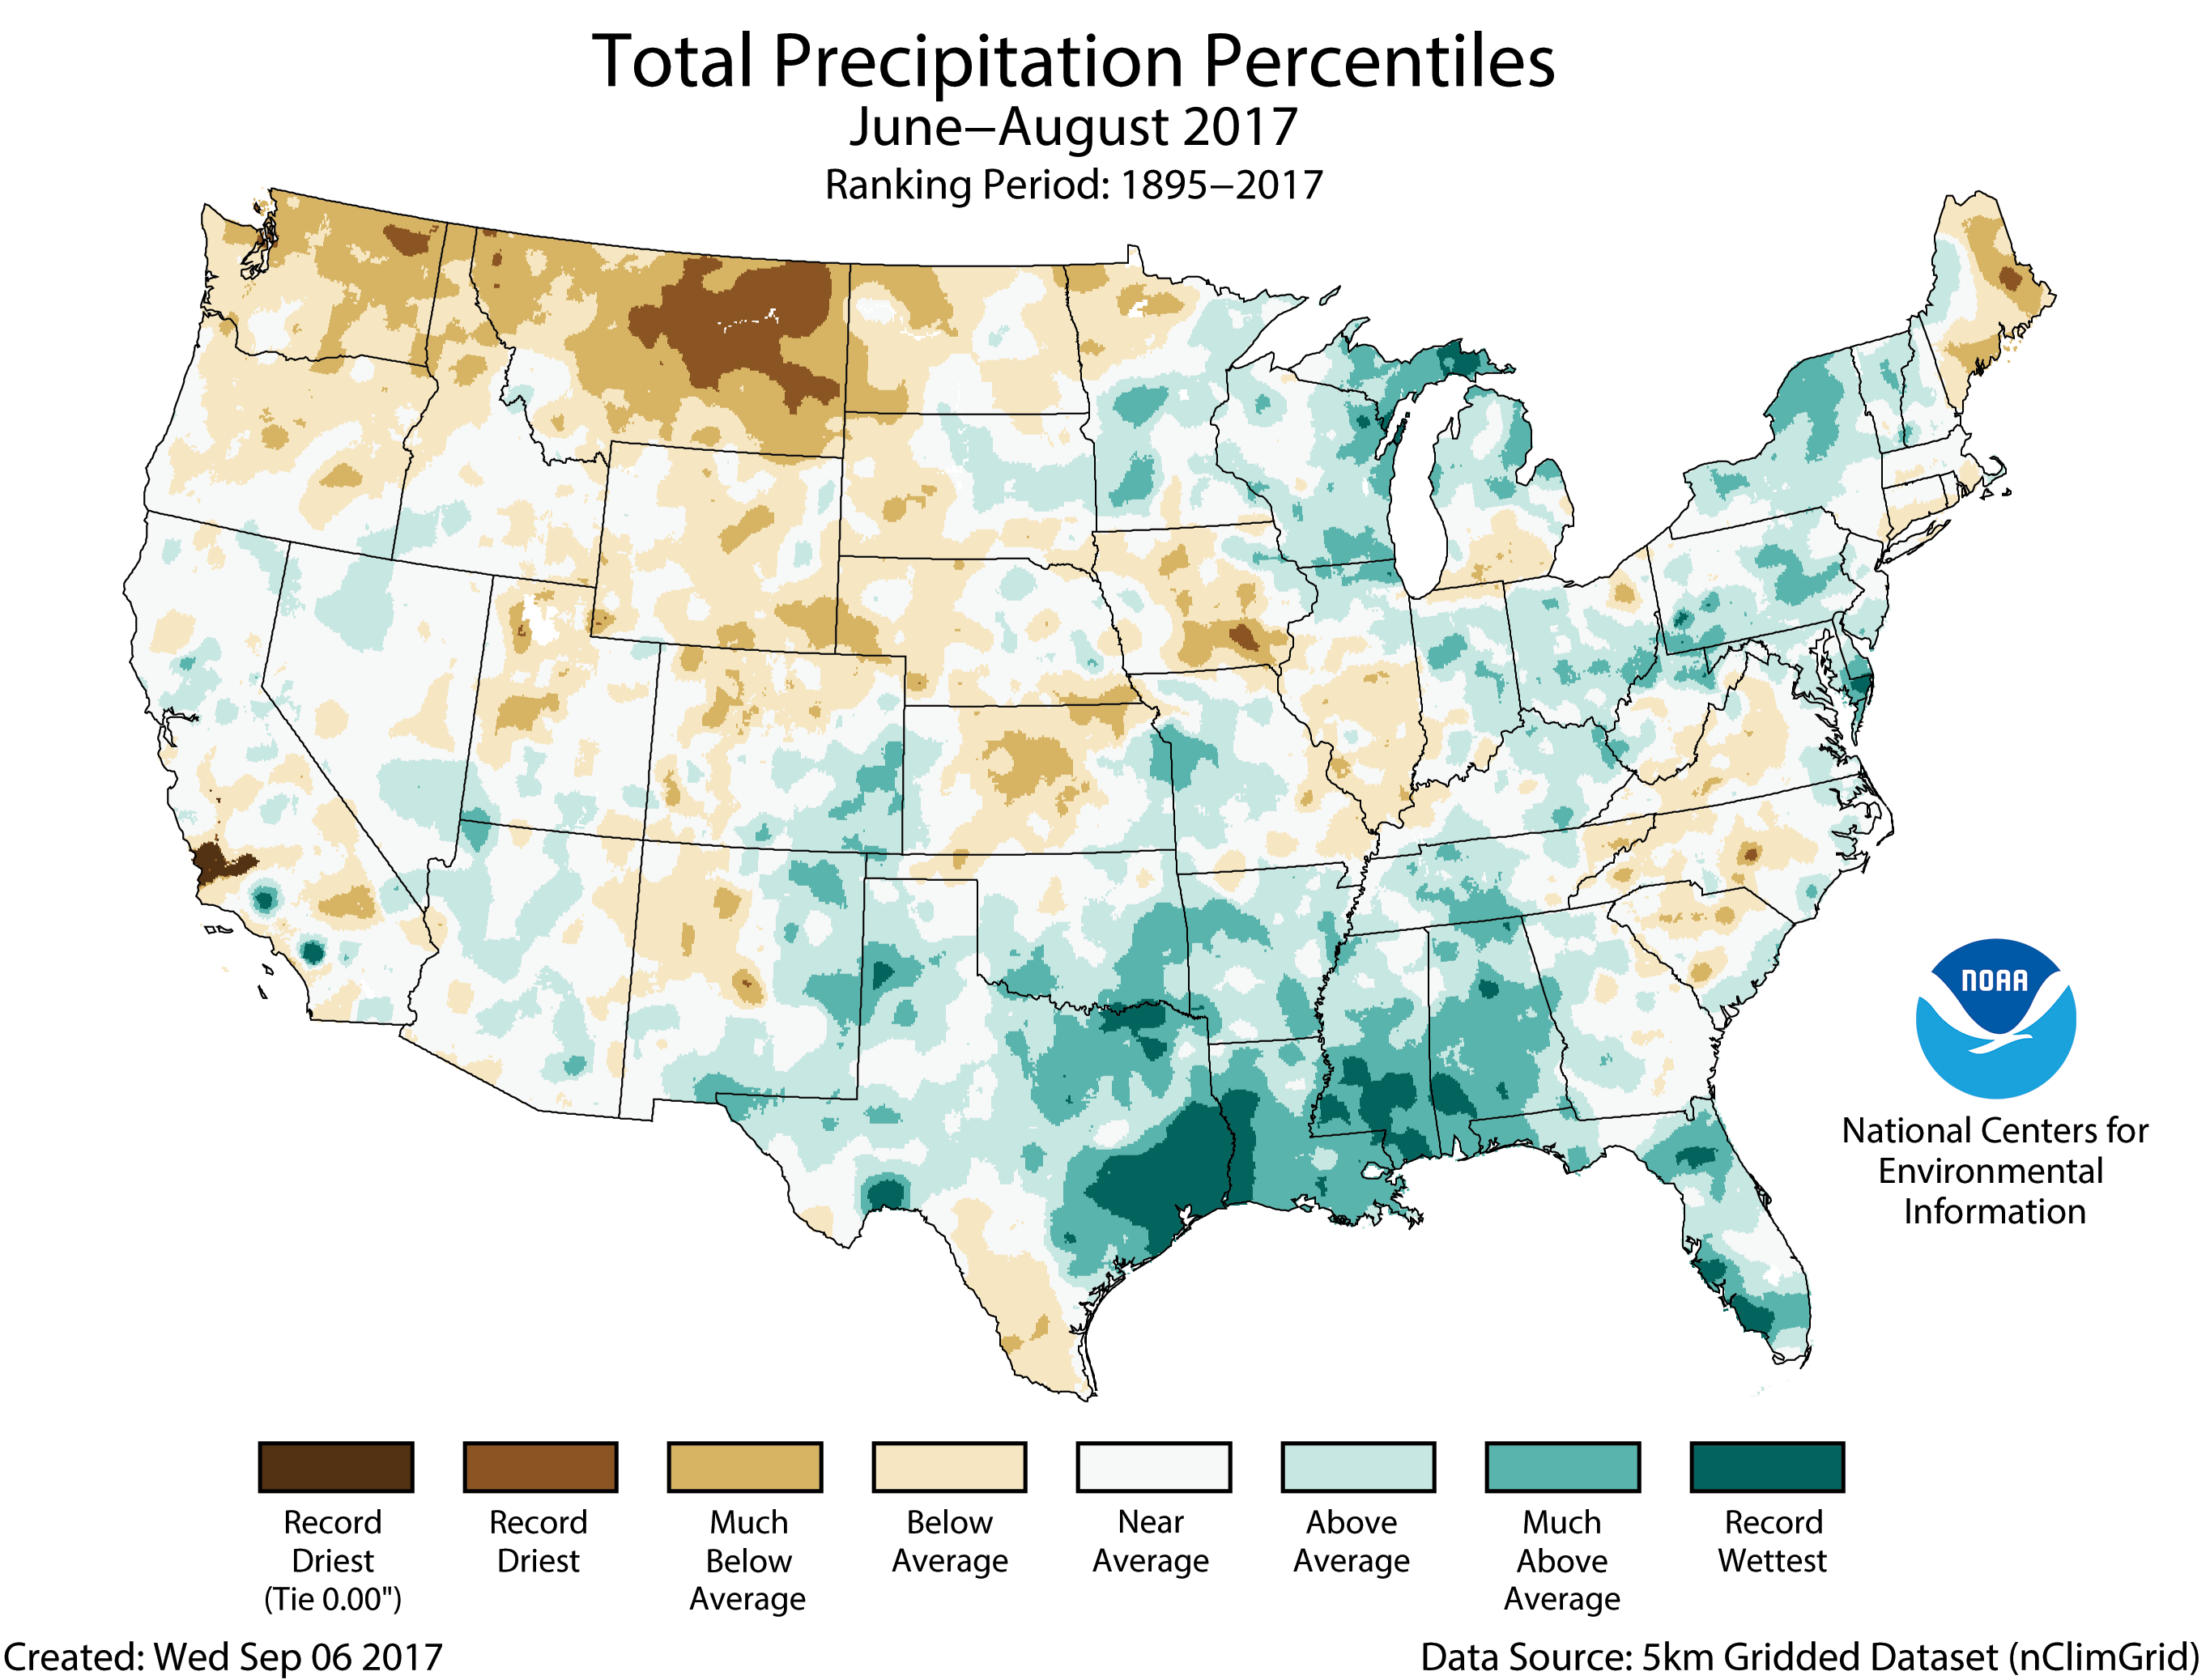
Driven by record warmth in the West, the national average summer (June–August) temperature for the contiguous U.S. was 72.7°F, 1.3°F above average and the 15th warmest summer in the 123-year period of record. The season’s precipitation averageof 9.19 inches was 0.87 inch above average and the 16th wettest summer on record.

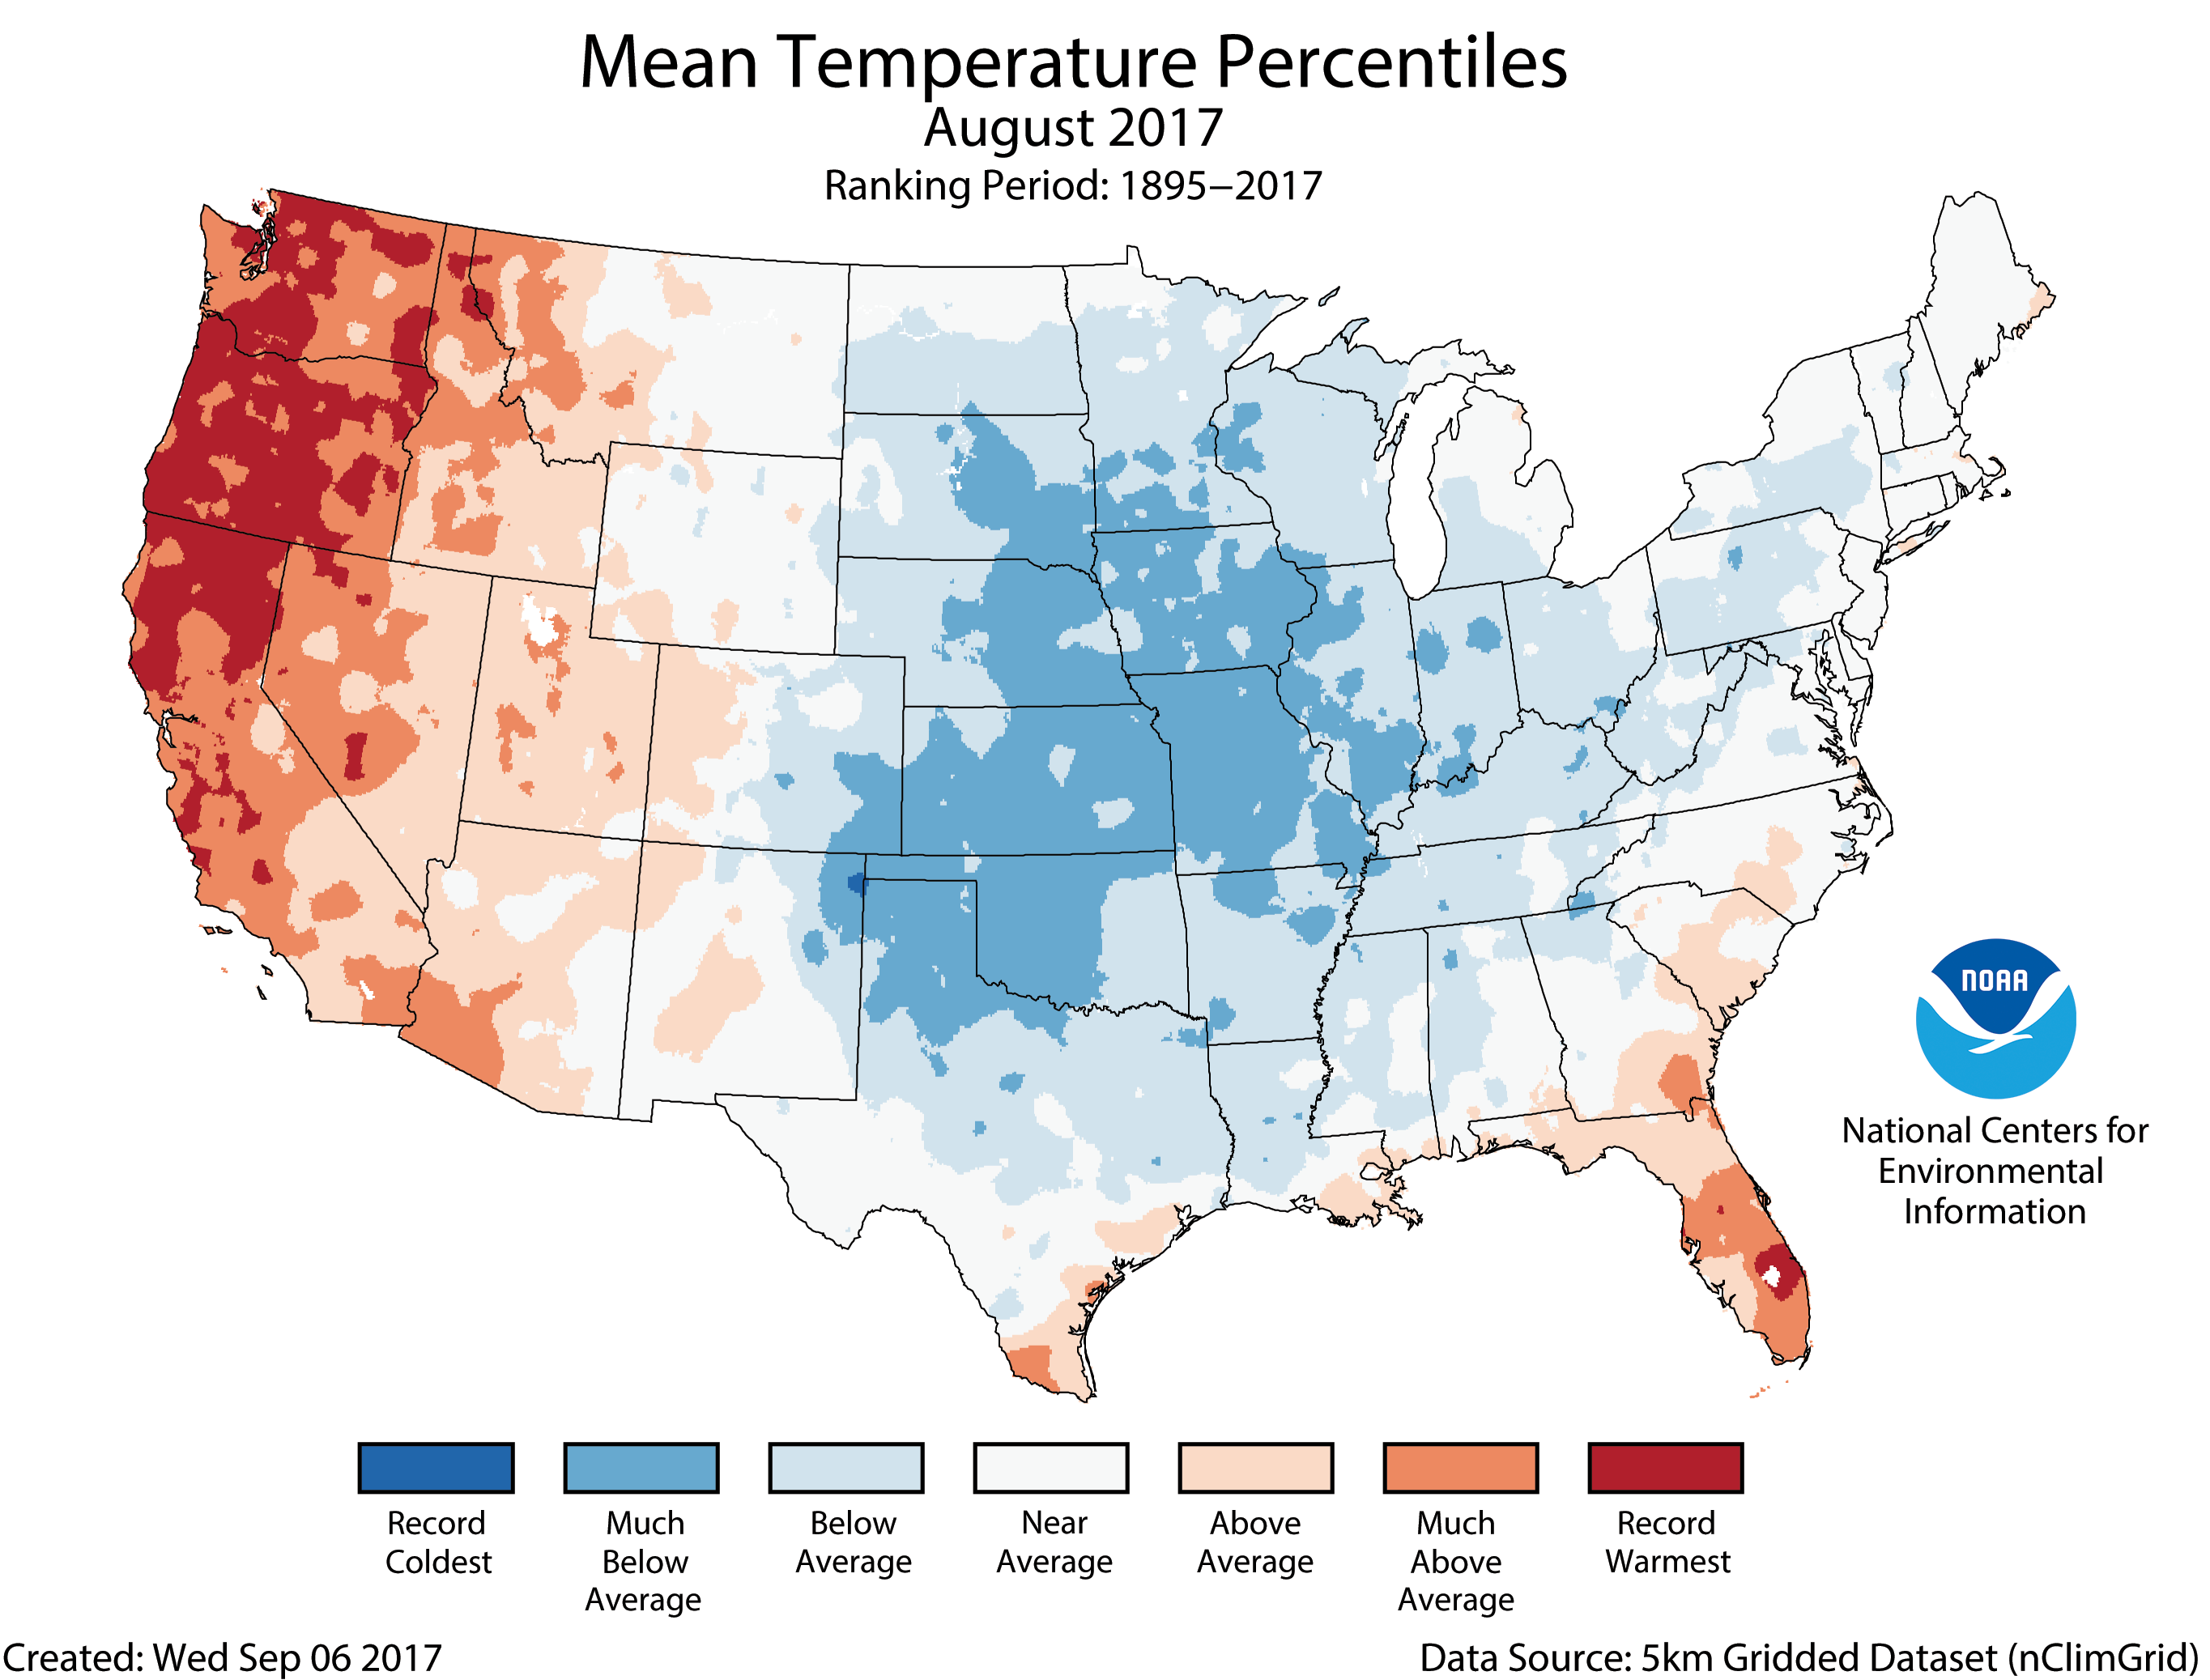
For the month of August, much-below-average temperatures in the Midwest and High Plains offset the record warmth along the West Coast. The August national temperature was near average at 72.0°F, 0.1°F below average, tying 1921 as the 53rd coolest on record. The August precipitation average for the contiguous U.S. was 3.34 inches, 0.7 inch above average, the seventh wettest in the 123-year period of record.

See all August, summer, and year-to-date U.S. temperature and precipitation maps.

This monthly summary from NOAA’s National Centers for Environmental Information is part of the suite of climate information services NOAA provides to government, business, academia, and the public to support informed decision-making.

Summer Temperature

  • Above-average temperatures spanned the western third of the country. California and Nevada were record warm, and six additional western states had temperatures among their 10 warmest. This was California’s second consecutive record warm summer; its last four summers are among its five warmest.
  • Nine states in the South and Midwest observed a cooler-than-average summer in 2017. This was primarily a result of cooler-than-average afternoons across these regions.
  • Seventeen of the past twenty summers, including the last seven, have been warmer than average.
  • Summer Precipitation

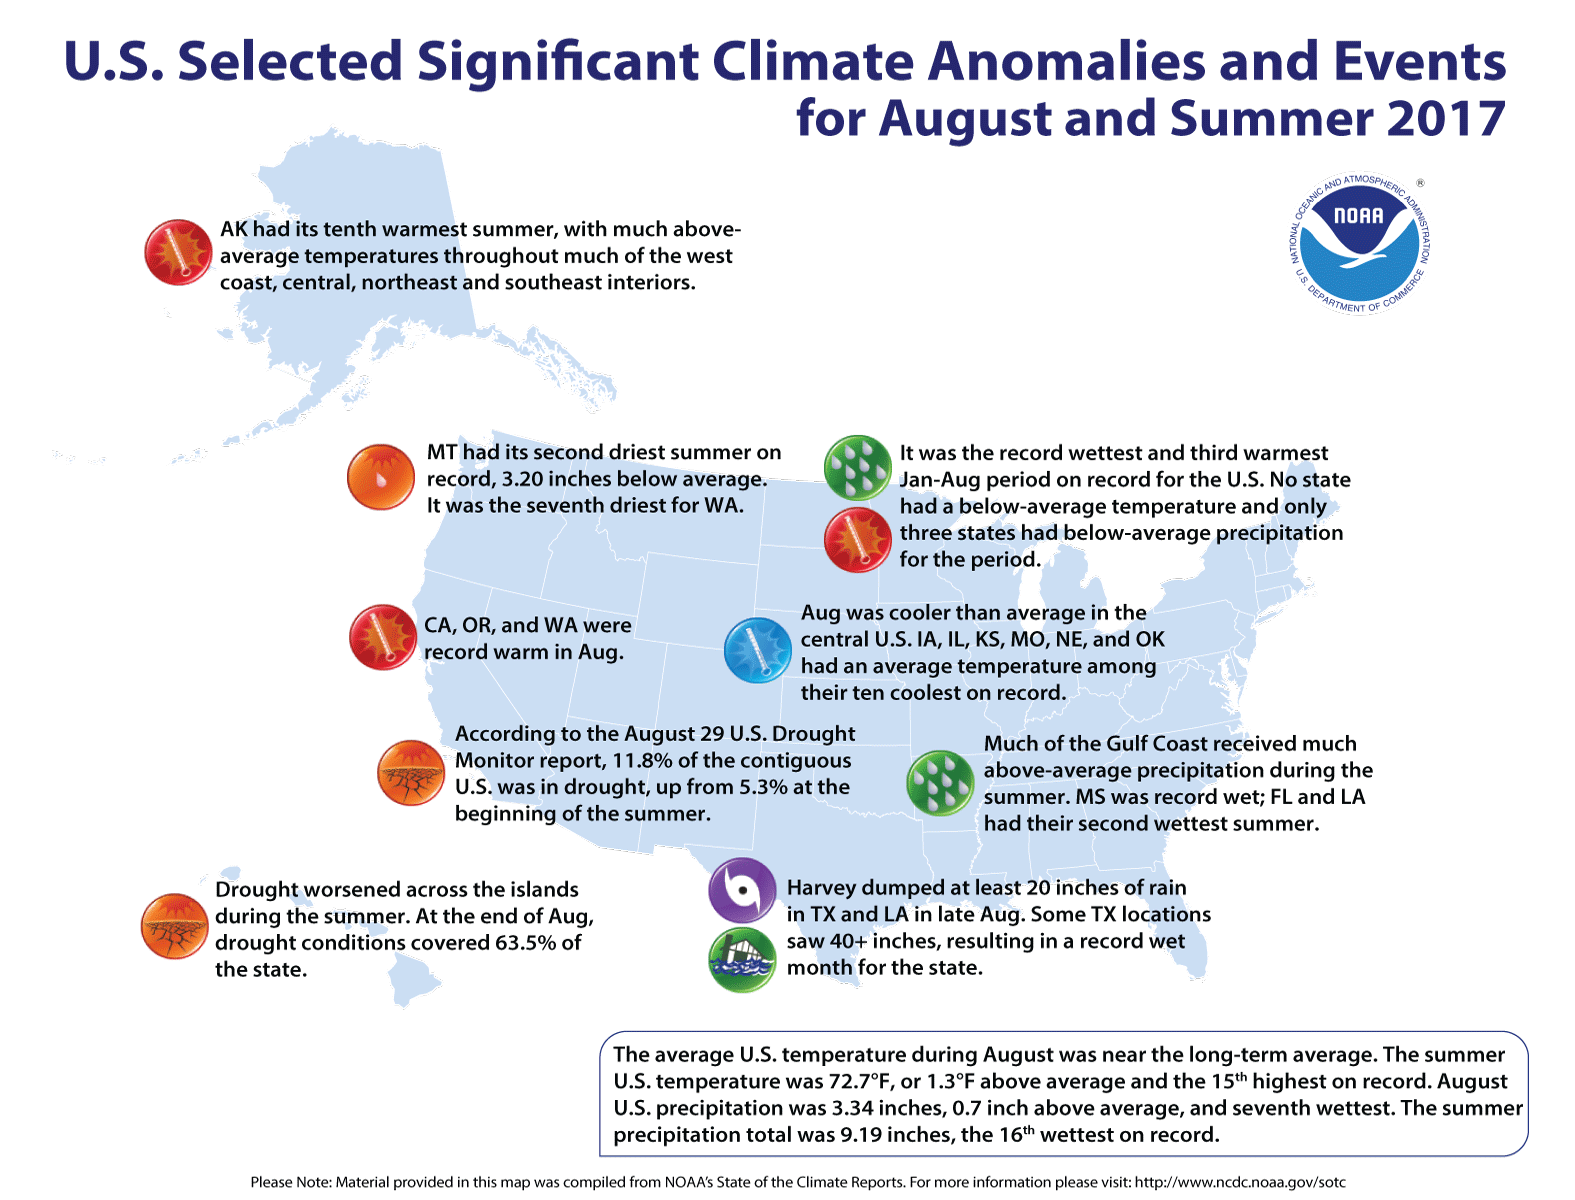
  • Mississippi observed a record amount of summer precipitation at 20.75 inches, 7.75 inches above average. This exceeded the previous record set in 1989 by 0.41 inch. Alabama, Florida, Louisiana, and Texas also had much above average precipitation for the season.
  • The Northwest, Northern Plains, parts of the Midwest, and parts of New England experienced a dry summer. Montana had its second driest summer on record, 3.20 inches below average, reflecting worsening drought conditions during the season and setting the stage for extensive wildfires.
  • Other Summer Weather and Climate Indicators

  • Although the nation on average was wet, drought expanded during the season, most notably in the Northern Plains, according to the U.S. Drought Monitor (link is external). Nationally, 11.8 percent of the contiguous U.S. ended the season in drought, up 6.5 percentage points since the beginning of the summer season. Montana’s drought coverage ballooned from 0.0 percent to 90.2 percent during the season, with nearly one quarter of the state in the most severe classification (D4, “Exceptional Drought”). Similarly, drought grew during summer in North Dakota from 24.1 percent coverage to 65.8 percent coverage, and in South Dakota from 20.4 percent to 68.9 percent.
  • The U.S. Climate Extremes Index (USCEI) for the summer was 24 percent above average and the 16th highest value on record. On the national scale, extremes in warm maximum and minimum temperatures were much above average. The USCEI is an index that tracks extremes falling in the upper or lower 10 percent of the record. The index covers land-falling tropical cyclones, temperature, precipitation, and drought across the contiguous U.S.
  • August Temperature

  • Although the August temperature was categorized as near-average nationally, there were stark regional differences. The western U.S. was very warm, while the central U.S. was quite cool.
  • California, Oregon, and Washington each had their warmest August on record. The California statewide average temperature of 77.8°F tied with 1967 and 2012 at 4.1°F above average. Oregon’s average temperature was 69.8°F, 5.9°F above average. Washington’s was 68.7°F, 5.2°F above average.
  • Average temperatures in parts of the High Plains and Midwest were much below average for August, owing especially to much cooler than average afternoons in the region. Missouri had its seventh coolest August on record with an average temperature of 72.0°F, 4.0°F below average. It was the eighth coolest in Iowa and Kansas, the ninth coolest in Oklahoma, and the 10th coolest in Illinois and Nebraska.
  • August Precipitation, Including Hurricane Harvey

  • Texas was record wet, mostly due to powerful and slow-moving Hurricane Harvey and its remnants. Precipitation across the state averaged 6.57 inches, 4.26 inches above average. Louisiana averaged 12.64 inches, 8.0 inches above average, resulting in its second wettest August, 0.38 inch shy of the record set just in 2016, which also saw widespread very heavy rainfall and flooding.
  • Locally in areas of Texas and Louisiana, precipitation amounts were historic due to Hurricane Harvey. At least 22 stations reported more than 500 percent of normal, or five times their normal rainfall for August. Monthly totals in excess of 40 inches were recorded by long-time NOAA observers in Lumberton, Beaumont, and at the Houston National Weather Service office.
  • Other August Weather and Climate Indicators

  • According to the August 29 U.S. Drought Monitor report, 11.8 percent of the contiguous U.S. was in drought, relatively unchanged since early August. Drought and abnormal dryness contracted across the Plains, in Alaska, Puerto Rico, and the Southwest and Mid-Atlantic regions. Drought and abnormal dryness expanded or intensified in the Pacific Northwest, northern Rockies, northern High Plains of Montana, and parts of the Midwest, Southeast, Kansas, Maine, and Hawaii.
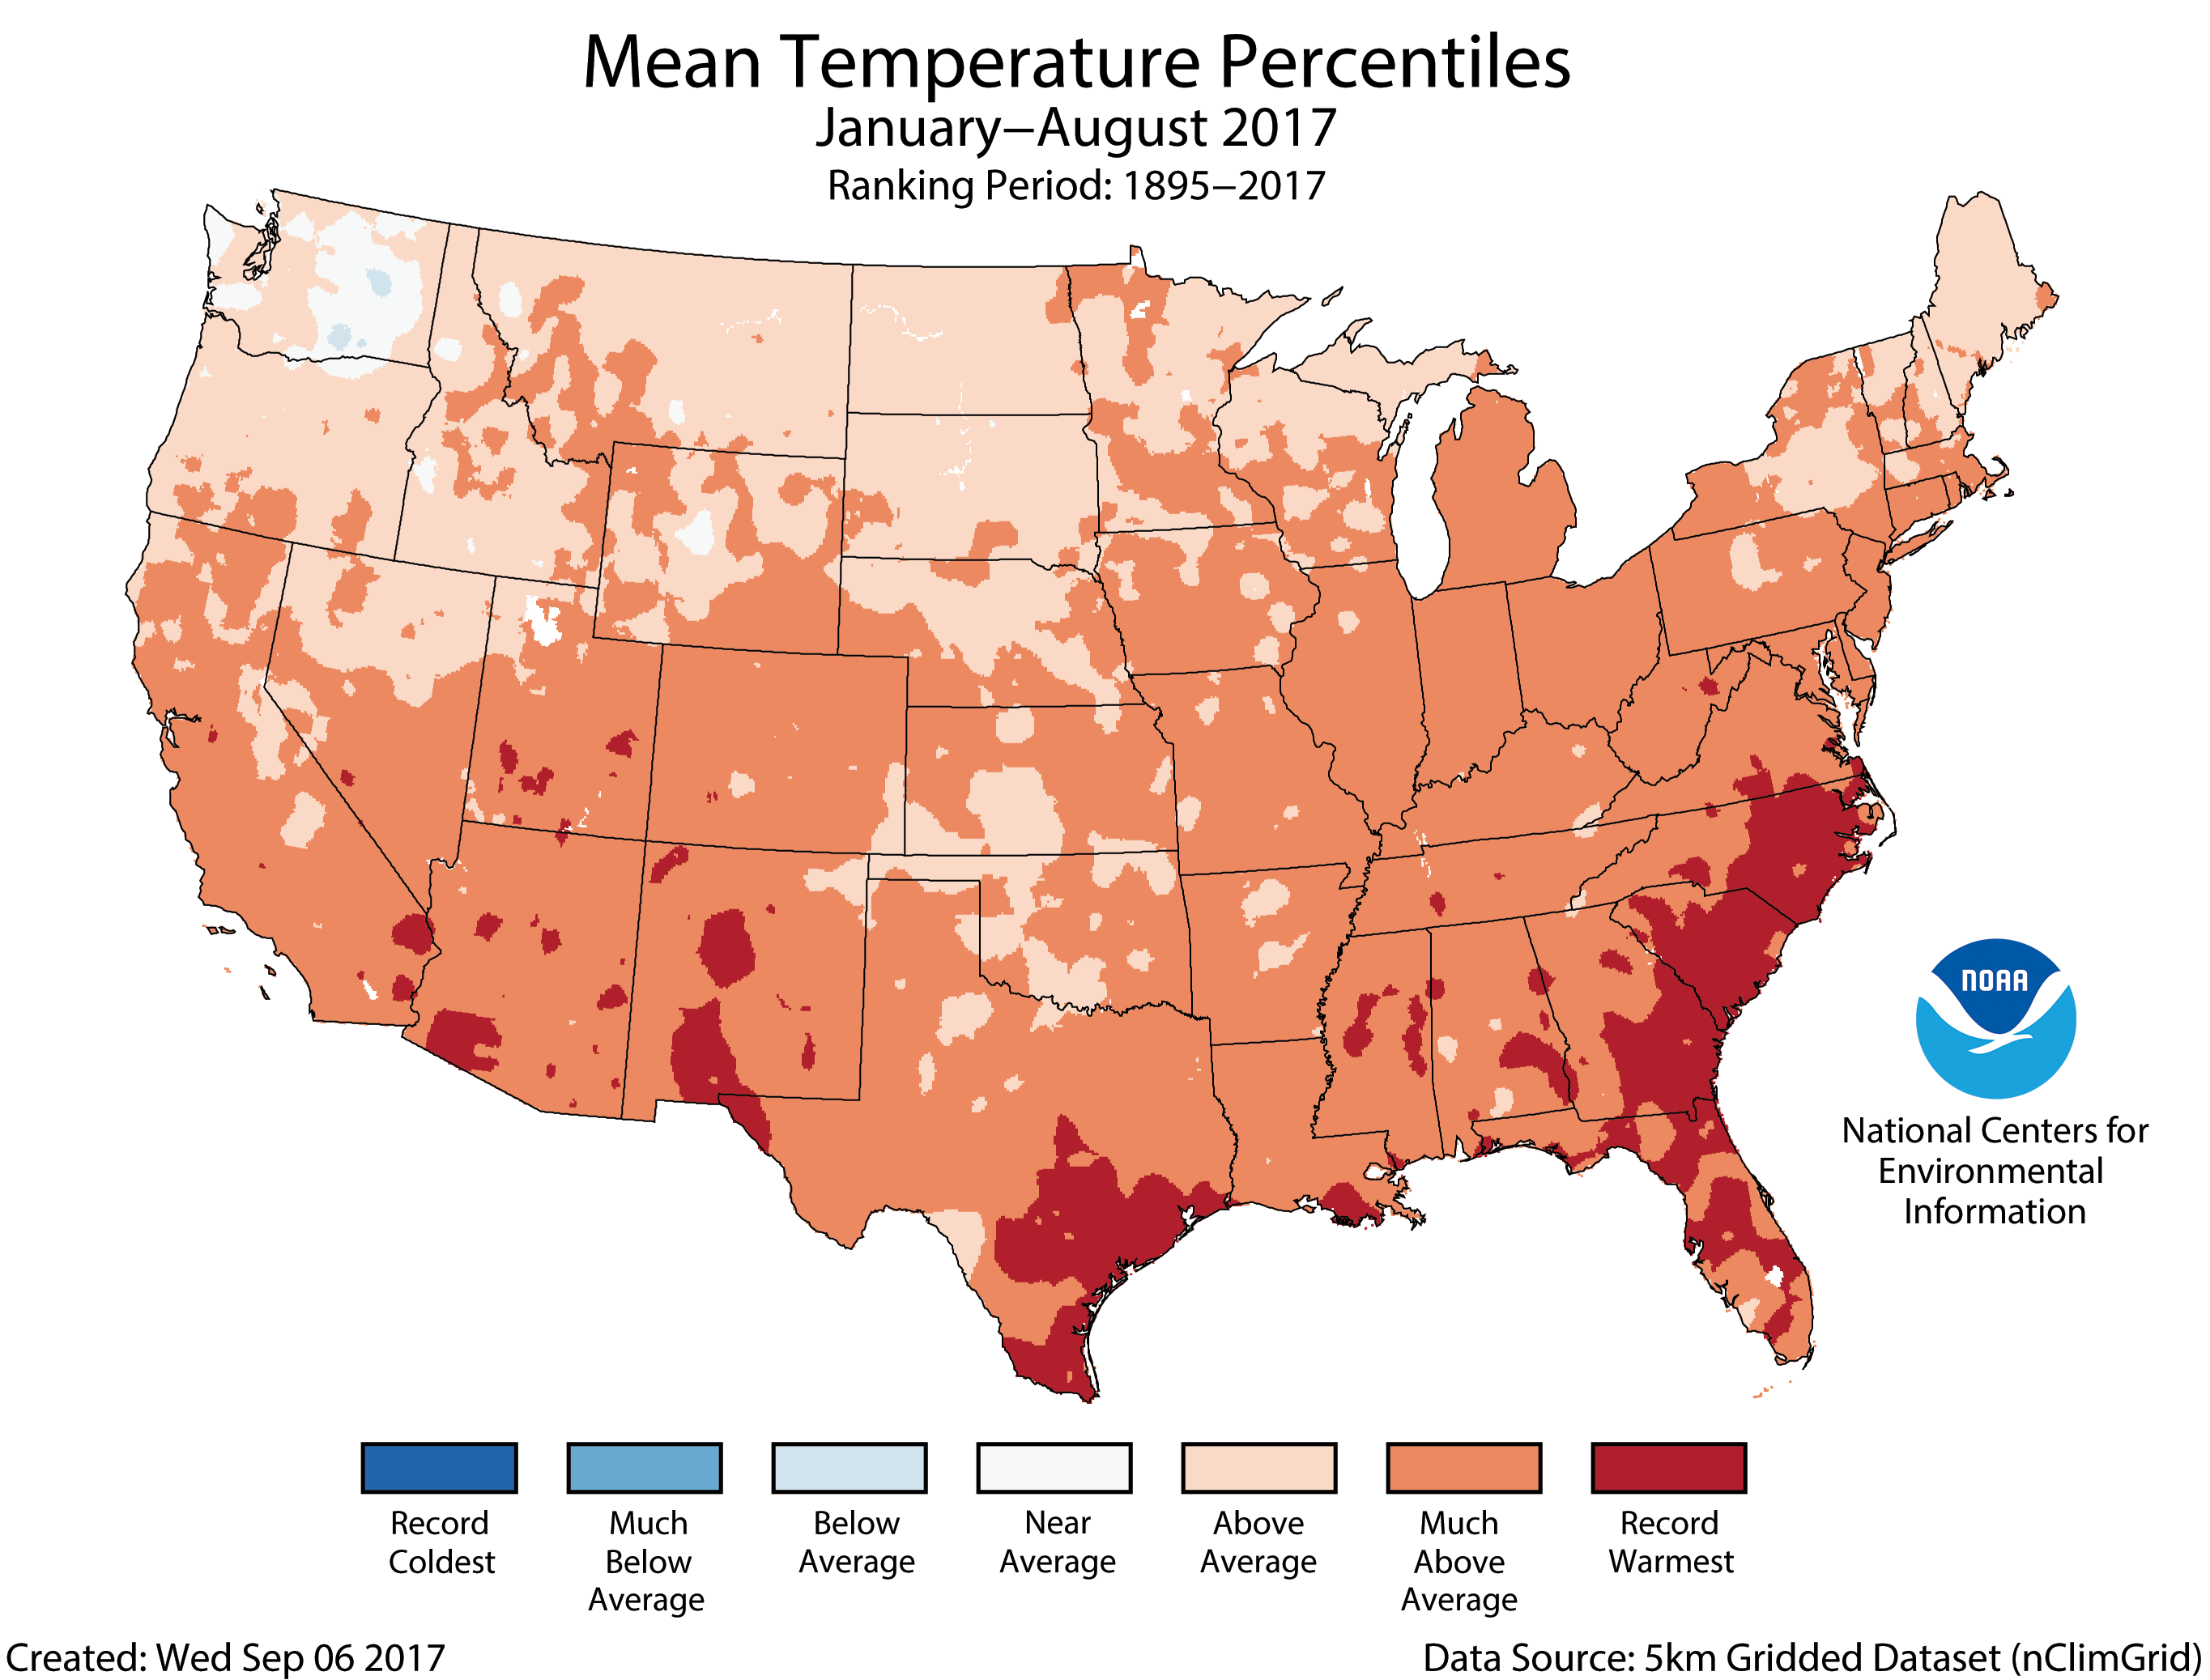
  • The year-to-date temperature averaged across the contiguous U.S. was 56.7°F, 2.8°F above the 20th century average. This ranks as the third warmest January–August period on record.
  • Four Atlantic states—Florida, Georgia, and the Carolinas—were warmest on record for the period. No state fell in the “Near Average” category or cooler.
  • Year-to-Date Precipitation

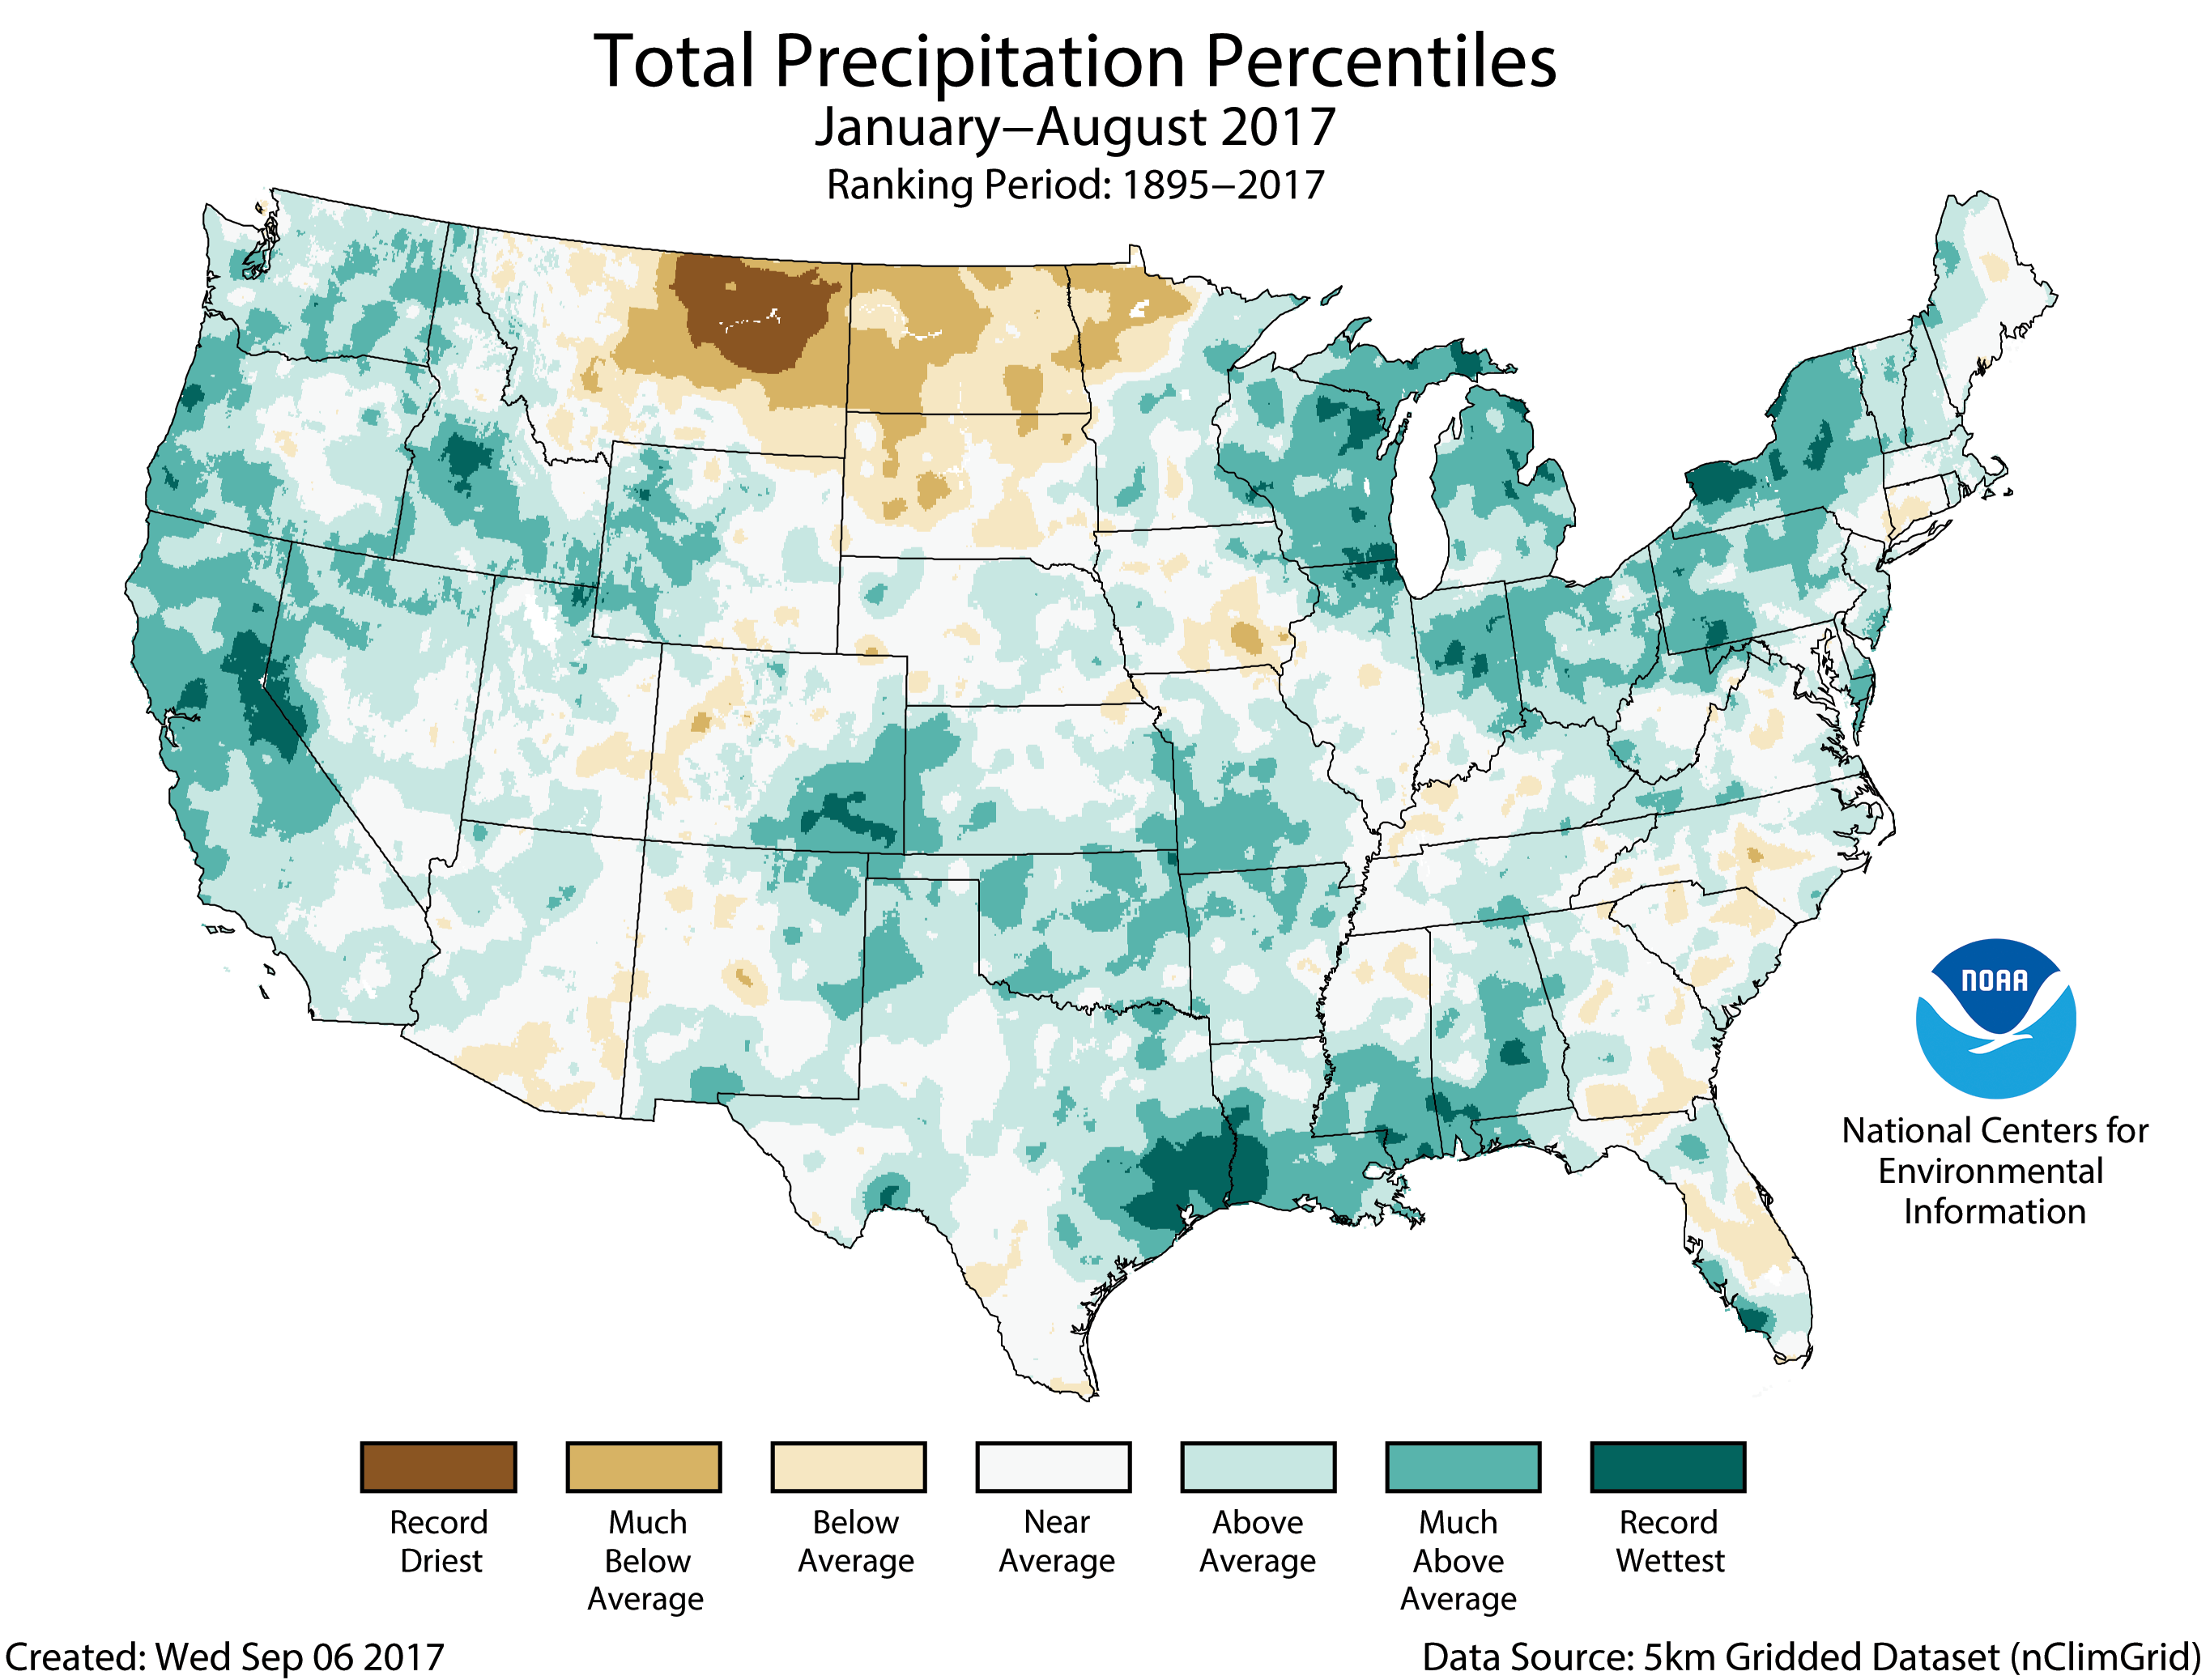
  • The year-to-date precipitation for the contiguous U.S. was 24.1 inches, 3.4 inches above average, and the wettest in the 123-year period of record.
  • Ten states—scattered in parts of the South, Midwest, Northeast, and West—had precipitation totals among their 10 largest for the period. Only North Dakota (seventh driest) had a year-to-date precipitation considered much below average.
  • Erie, Broomfield, Thornton and Lafayette are all developing oil & gas rules

    Drilling rig and production pad near Erie school via WaterDefense.org

    From The Denver Post (Bruce Finley):

    Colorado residents fed up with what they see as the state’s failure to protect people and the environment are fighting fossil-fuel development inside their towns by making new rules requiring odor control, bigger setbacks and company disclosure of underground oil and gas flowlines.

    But the industry and state government are ready to fight back.

    An odor-control measure in Erie, letting police hit companies with tickets for foul fumes, takes effect next week.

    Erie, Broomfield, Thornton and Lafayette are each developing map submission rules, with leaders saying the fatal April 17 house explosion in Firestone makes this a no-brainer. Broomfield residents also will vote on whether to change their charter to require protection of health, safety and the environment as preconditions before drilling inside city limits can be done…

    “The odor ordinance? We will see how that is applied in Erie,” COGA president Dan Haley said in an interview at a fossil-fuels energy summit in Denver. “It clearly was an effort to go after oil and gas. It will have broader impacts if it is applied aggressively.”

    And Thornton’s latest 750-feet setback and flowline-removal rule, Haley said, is a case where “you have a City Council passing illegal regulations after a very limited stakeholder process.”

    […]

    Gov. John Hickenlooper announced Tuesday that an existing 811 notification system will be used to give site-specific underground flowline information to residents, planners and builders — instead of a public website. COGA favors that approach because pipeline information quickly becomes outdated as new lines are installed, Haley said. Industry leaders and Hickenlooper invoked the potential for terrorism or monkey-wrenching, too, should flow line network maps be made public…

    But Lafayette mayor Christine Berg bristled at “loopholes” favoring oil and gas companies and said locals must be able to protect health, safety and the environment within urban boundaries.

    “We are putting something on our books saying we want to know where the flowlines are. The city does not have a good sense of where the existing lines are,” Berg said. “This is within our purview. We have fought before. We are not averse to working through the judicial system.

    “What has happened is that local control issues have not made it onto a statewide ballot. And we haven’t gotten traction with state lawmakers. This is what the communities want.”

    Not only are industry groups prepared to challenge local rules they see as restrictive, but state COGCC officials are asking the state Supreme Court to review and reject the Martinez decision. State Supreme Court rulings already have buttressed COGCC power by striking down moratoriums and bans on drilling inside municipal limits such as those attempted by Longmont and Fort Collins.

    But as oil and gas drilling gets closer to communities, the more Front Range residents are compelling elected leaders to set limits, using land-use and zoning codes to control industrial operations.

    #Drought news: D0 (Abnormally Dry) expanded and D1 (Moderate) introduced in W. #Colorado

    Click here to go to the US Drought Monitor website. Here’s an excerpt:

    Summary

    This past week saw too much rainfall and historic flooding along the Gulf Coast as a result of Hurricane Harvey. After dumping record-breaking rainfall on the Texas coast, the remnants of Harvey tracked to the northeast, bringing excess rainfall from the Lower Mississippi Valley to the Mid-Atlantic states. Despite this, pockets of abnormal dryness continue to develop in the Southeast in areas that missed the bands of heavy rains. With Hurricane Irma approaching the United States, there is a potential for heavy rainfall to alleviate these conditions

    While many eyes were on the devastation in Texas, drought continued to intensify in the Pacific Northwest. Record-breaking heat and dry streaks have parched vegetation and fueled devastating wildfires across the region. Smoke from these fires traveled along the jet stream and stretched to the East Coast…

    High Plains

    Above-normal temperatures continued across the Dakotas and the Nebraska Panhandle this past week. A band of rain moved through the region during the week, though amounts were generally less than one inch. North-central North Dakota saw increases in severe drought where rainfall was less than 25 percent of normal over the last 30 to 60 days and satellite based-vegetation indicators were showing stress. South-central North Dakota saw a one-category improvement in areas where rainfall deficits, soil moisture, and well levels have begun to show recovery and pastures have responded to rains over the last 30 days. Western South Dakota saw a small one-category deterioration due to a continued lack of rainfall, low soil moisture and streamflow values, and vegetation stress. Southeastern South Dakota and northeastern Nebraska saw one-category improvements in areas where precipitation deficits, soil moisture, and vegetation indicators have returned to normal or near-normal values. Improvements also occurred in the abnormally dry area in the Nebraska Panhandle and in the moderate drought in central Kansas…

    West

    Hot, dry weather continued across much of the Northwest, causing conditions to deteriorate a conditions in many locations as rainfall deficits increased and hot temperatures dried out vegetation. Many locations in the region have experienced a record-breaking 80-plus days without rain over the last three months. The dry conditions have fueled wildfires across the region, prompting public health warnings because of decreases in air quality. Changes to this week’s map include an expansion of severe and extreme drought in central Montana and the introduction of moderate drought in eastern Washington and western Washington and Oregon. Conditions also deteriorated in southern Idaho and the Upper Colorado River Basin as rainfall deficits grew and streamflow fell below normal. Southern Idaho, Wyoming, Utah, and western Colorado saw expansions in abnormally dry conditions while eastern Utah and northwest Colorado also saw an expansion of [moderate] drought.

    Looking Ahead

    Since the Tuesday morning cut-off for this week’s map, 1 to 3 inches of rain has fallen in two swaths, one in eastern North and South Carolina and the other stretching along a cold front from the Mid-South to New England. The front will continue to bring rain and cooler temperatures, 5-15 degrees below normal, to the East Coast. The East will likely see even more rainfall from Irma, a large and powerful hurricane that is expected to make landfall in the Southeast this weekend. Heavy rains of 1 to 10 inches, with isolated higher amounts, are forecast for parts of the Florida Peninsula, Georgia, and South Carolina with the locations of heaviest rainfall depending on Irma’s eventual track.

    The National Weather Service’s Weather Prediction Center forecasts warm and dry conditions are expected from the Northern Plains into the Northern Rockies where temperatures may be 5 to 20 degrees above normal. Forecast thunderstorms are also expected to bring much needed rainfall to southeastern Oregon with amounts of 1 to 1.5 inches. Rainfall from 0.5 to locally over 1 inch is also forecast for northern New Mexico, southwest Colorado, and northern Utah, and in southern Nevada, northwest Arizona, and southeast California through early next week.

    Here’s a look at precipitation for Colorado in August:

    Upper Colorado River Basin precipitation as a percent of normal August 2017 via the Colorado Climate Center.

    Mining jobs at West Elk without methane emissions? — The Mountain Town News #ActOnClimate #keepitintheground

    West Elk Mine. Photo/WildEarth Guardians via The Mountain Town News.

    From The Mountain Town News (Allen Best):

    Solomon-like wisdom in methane emissions or something else?

    One of Colorado’s larger sources of greenhouse gas emissions is something few people see, a coal mine located an hour or two from both Crested Butte and Aspen.

    There, invisibly, methane wafts into the atmosphere, trapping heat. That methane has now become a major issue as Colorado Gov. John Hickenlooper tries to balance economic and environmental goals.

    He did so last week with a Solomon-like gesture. He endorsed a proposal to approve a royalty rate reduction at the West Elk Mine from 8 to 5 percent for operations in a new coal seam that Arch Coal, the operator, says will be economically challenging.

    But in return for that royalty reduction, Hickenlooper wants to see a “good-faith commitment to dedicating significant time and resources” to an effort to capture methane vented from the mine and possibly put it to beneficial use.

    Arch plans to bore holes from the surface into the mine to release methane gas. Without venting, miners would be endangered.

    A precedent exists for methane capture. In a complicated financing deal, the methane coming from the nearby Elk Creek mine was captured several years ago and is being burned to generate electricity. It still produces carbon dioxide, but methane as measured over the course of a century has 23 times the heat-trapping capacity of carbon dioxide.

    Craig Station is the No. 2 source of greenhouse gas emissions in Colorado, behind Comanche station at Pueblo. Photo/Allen Best

    The West Elk alone is responsible for 0.5 percent of all greenhouse gas emissions in Colorado, according to the calculations of Ted Zukoski, an attorney for Earthjustice, which represents various groups that oppose the mine expansion. The North Fork mines are said to be among the gassiest in the world.

    As of 2015, West Elk’s methane emission were the equivalent of half a million tons of carbon dioxide. Colorado’s largest CO2 producers that same year were the Comanche and Craig power plants, which produced 8.4 million tons and 8.2 million tons of CO2.

    This royalty reduction will cost the state, but just how much will depend upon how much coal ends up being mined. Hickenlooper estimated $4 million over a five-year period. Environmentalists, however, calculated lost royalties of up to $12 million.

    The Crested Butte-based High Country Conservation Advocates expressed frustration with Hickenlooper’s stance. Matt Reed, the public lands director for the HCCA, said the governor’s office holds that it has little power to limit methane pollution from the mine in cases such as this one, where the federal government is the ultimate decision-maker.

    Reed tells the Crested Butte News his group disagrees. The state has power under current law to require permits for coal mine emissions because of its authority to regulate emissions of both volatile organic compounds, which are ozone (smog) precursors, and hazardous air pollutants. They are emitted along with methane. As recently as January, state health regulators said they reserved the right to undertake enforcement action.

    The Crested Butte group also points to state law that it says authorizes rules be created to control for emissions of hydrocarbons … and any other chemical substance.”

    But Gunnison County Commissioner John Messner sees the Hickenlooper letter sending a “strong message that the analysis, development and implementation of a methane capture and utilization plan is to be expected in the North Fork of Gunnison County and the key word here is that it is to be implemented.”

    For the coal mine expansion to go forward, Arch Coal will need a permit from the U.S. Forest Service to build temporary roads into what is now a designated roadless area. That agency’s decision will be posted Friday, Sept. 8, in the Federal Register.

    In an editorial a week before the governor’s letter was released, the Grand Junction Sentinel said the “coal industry has one foot in the grave and the other on a banana peel.” It urged him to take exactly the position that he took.

    The newspaper—located in a fossil-fuel-friendly-town—went on to urge Hickenlooper to “use the mine as an example of why Colorado needs a carbon credit cap-and-trade market to monetize waste methane.”

    Ironically, California’s cap-and-trade is partly the reason why electricity is now being generated from the Elk Creek Mine. Tom Vessels, who put the generating system together, secured money from California, because he is reducing a greenhouse gas. But Holy Cross Energy—which serves Aspen and Vail areas—also is paying a premium for the electricity, and Aspen Skiing Co. provided money to ensure that deal happened.

    About Allen Best
    Allen Best is a Colorado-based journalist. He publishes a subscription-based e-zine called Mountain Town News, portions of which are published on the website of the same name, and also writes for a variety of newspapers and magazines.

    Chatfield Reallocation Project update

    Proposed reallocation pool — Graphic/USACE

    From TheDenverChannel.com (Connor Wist):

    The water supply project reallocates a portion of the storage space in Chatfield Reservoir from flood control to joint flood control and multipurpose use. The project will raise the water level in the reservoir by 12 feet.

    Chatfield Reservoir holds an estimated 350,000-acre feet of flood storage. The project takes 20,600-acre feet for re-purposing and also uses 2,100-acre feet for an environmental pool to improve water flow, water quality and recreation. The additional storage space will also be used by municipal and agricultural water providers to help meet the water needs of the state.

    The U.S. Army Corps of Engineers is currently reviewing the final design plans. The project costs more than $134 million and is being funded by eight project participants. Six of the participants are water providers, and two are state entities.

    Construction is slated to begin in fall 2017 and will span over a three year period. Project organizers said the recreation construction would mainly happen during 2018. The project plans for completion by early winter 2020. For updates on closures in the park during construction, click here.