The reversal of fortunes this water year for San Luis Valley irrigators – going from one of the deadest rivers on record to a bountiful water year that sees full canals and increased reservoir storage – has been breathtaking.
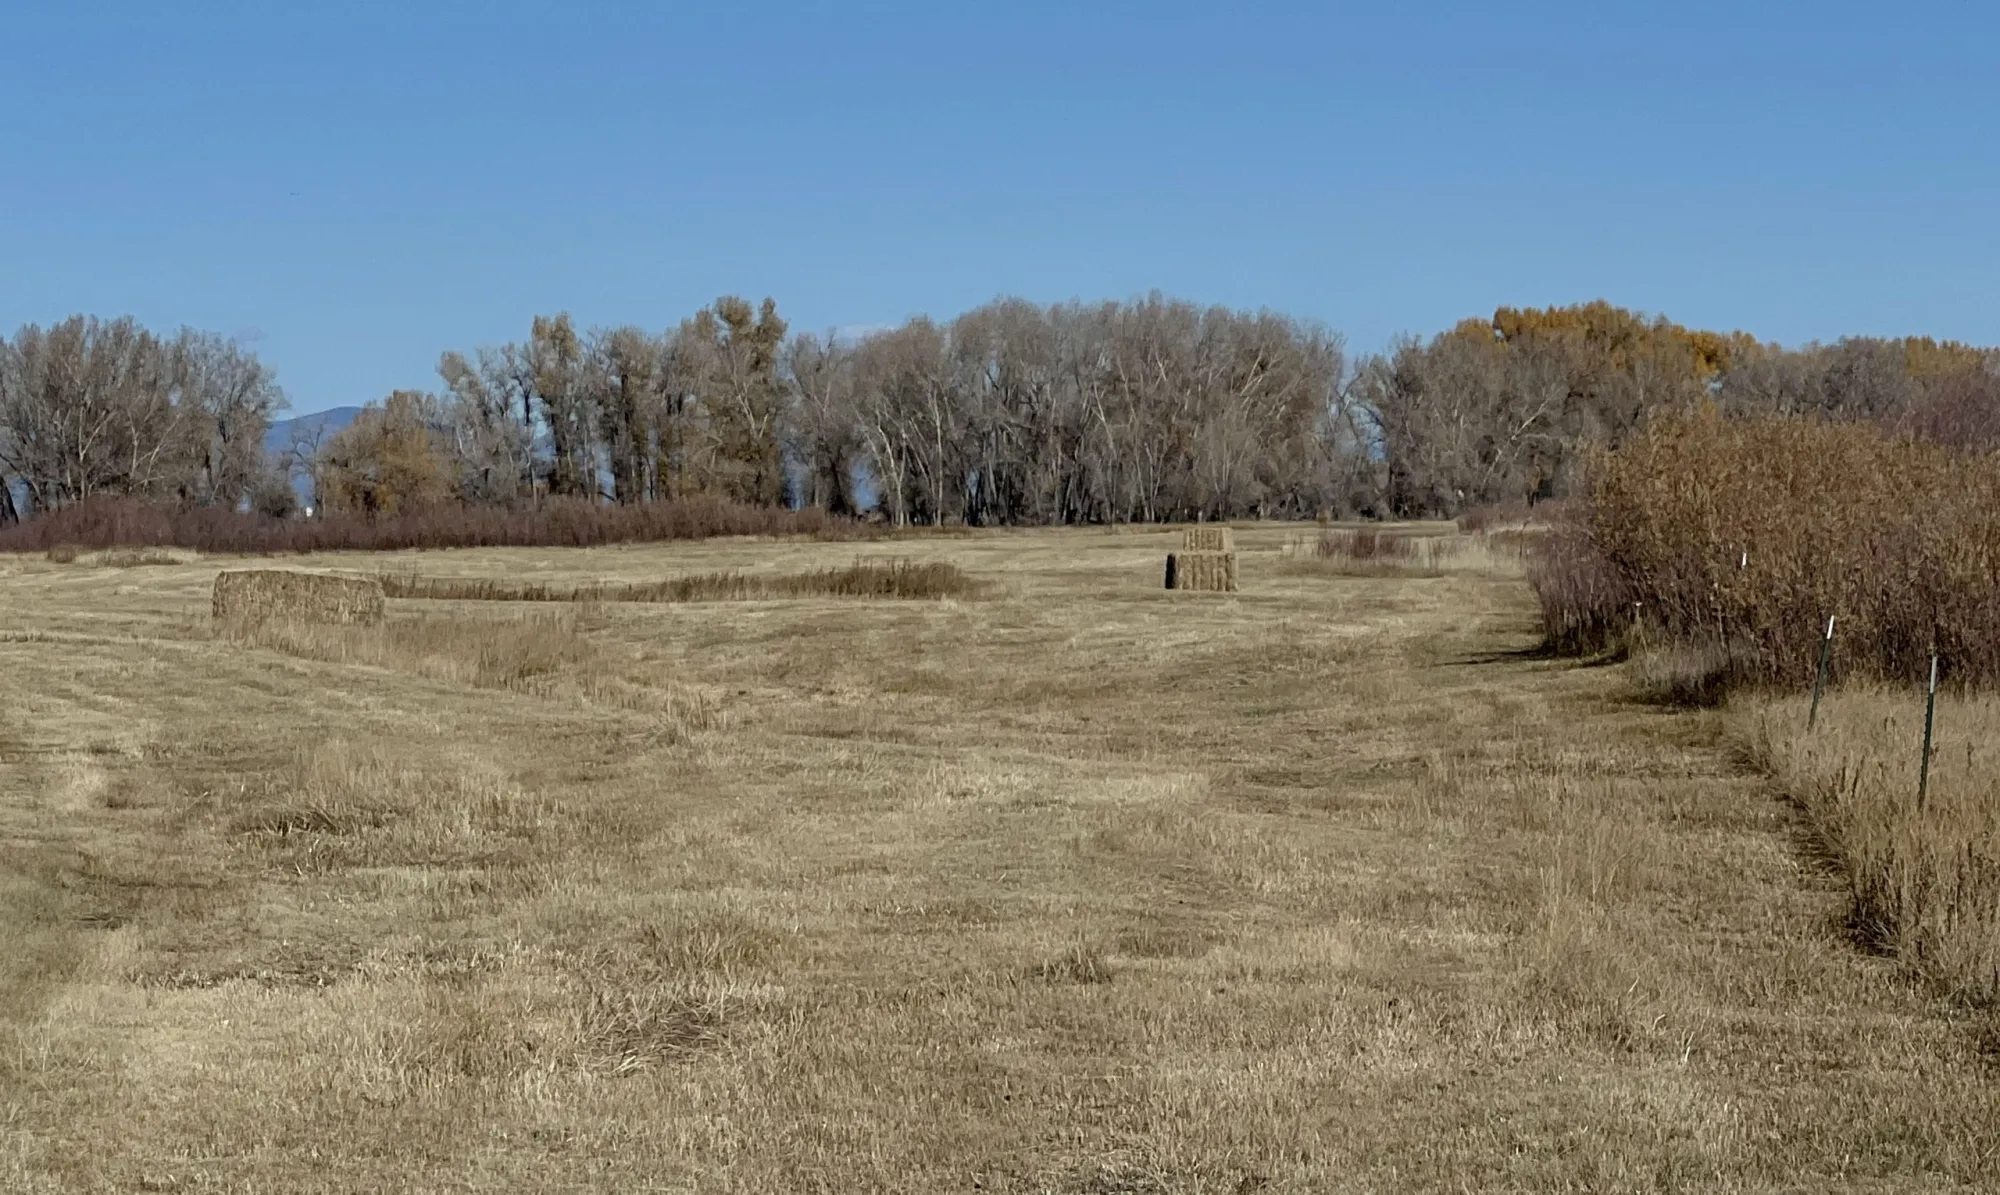
The “water year” for Valley farmers technically ends Nov. 1, which means no more water in the fields. Now with the mid-October rains from the southwest and resulting historic fall river flows, the state is talking to farmers about extending the water season a bit into November, which would allow for another week of irrigating and another cut of hay.
“I’m working hard, but I’m not complaining,” said Greg Higel, whose Alamosa County cattle ranch and hay operation takes in surface water through the Centennial Ditch. It was private ditch operators like Higel who opened their head gates to begin diverting water off the Rio Grande.
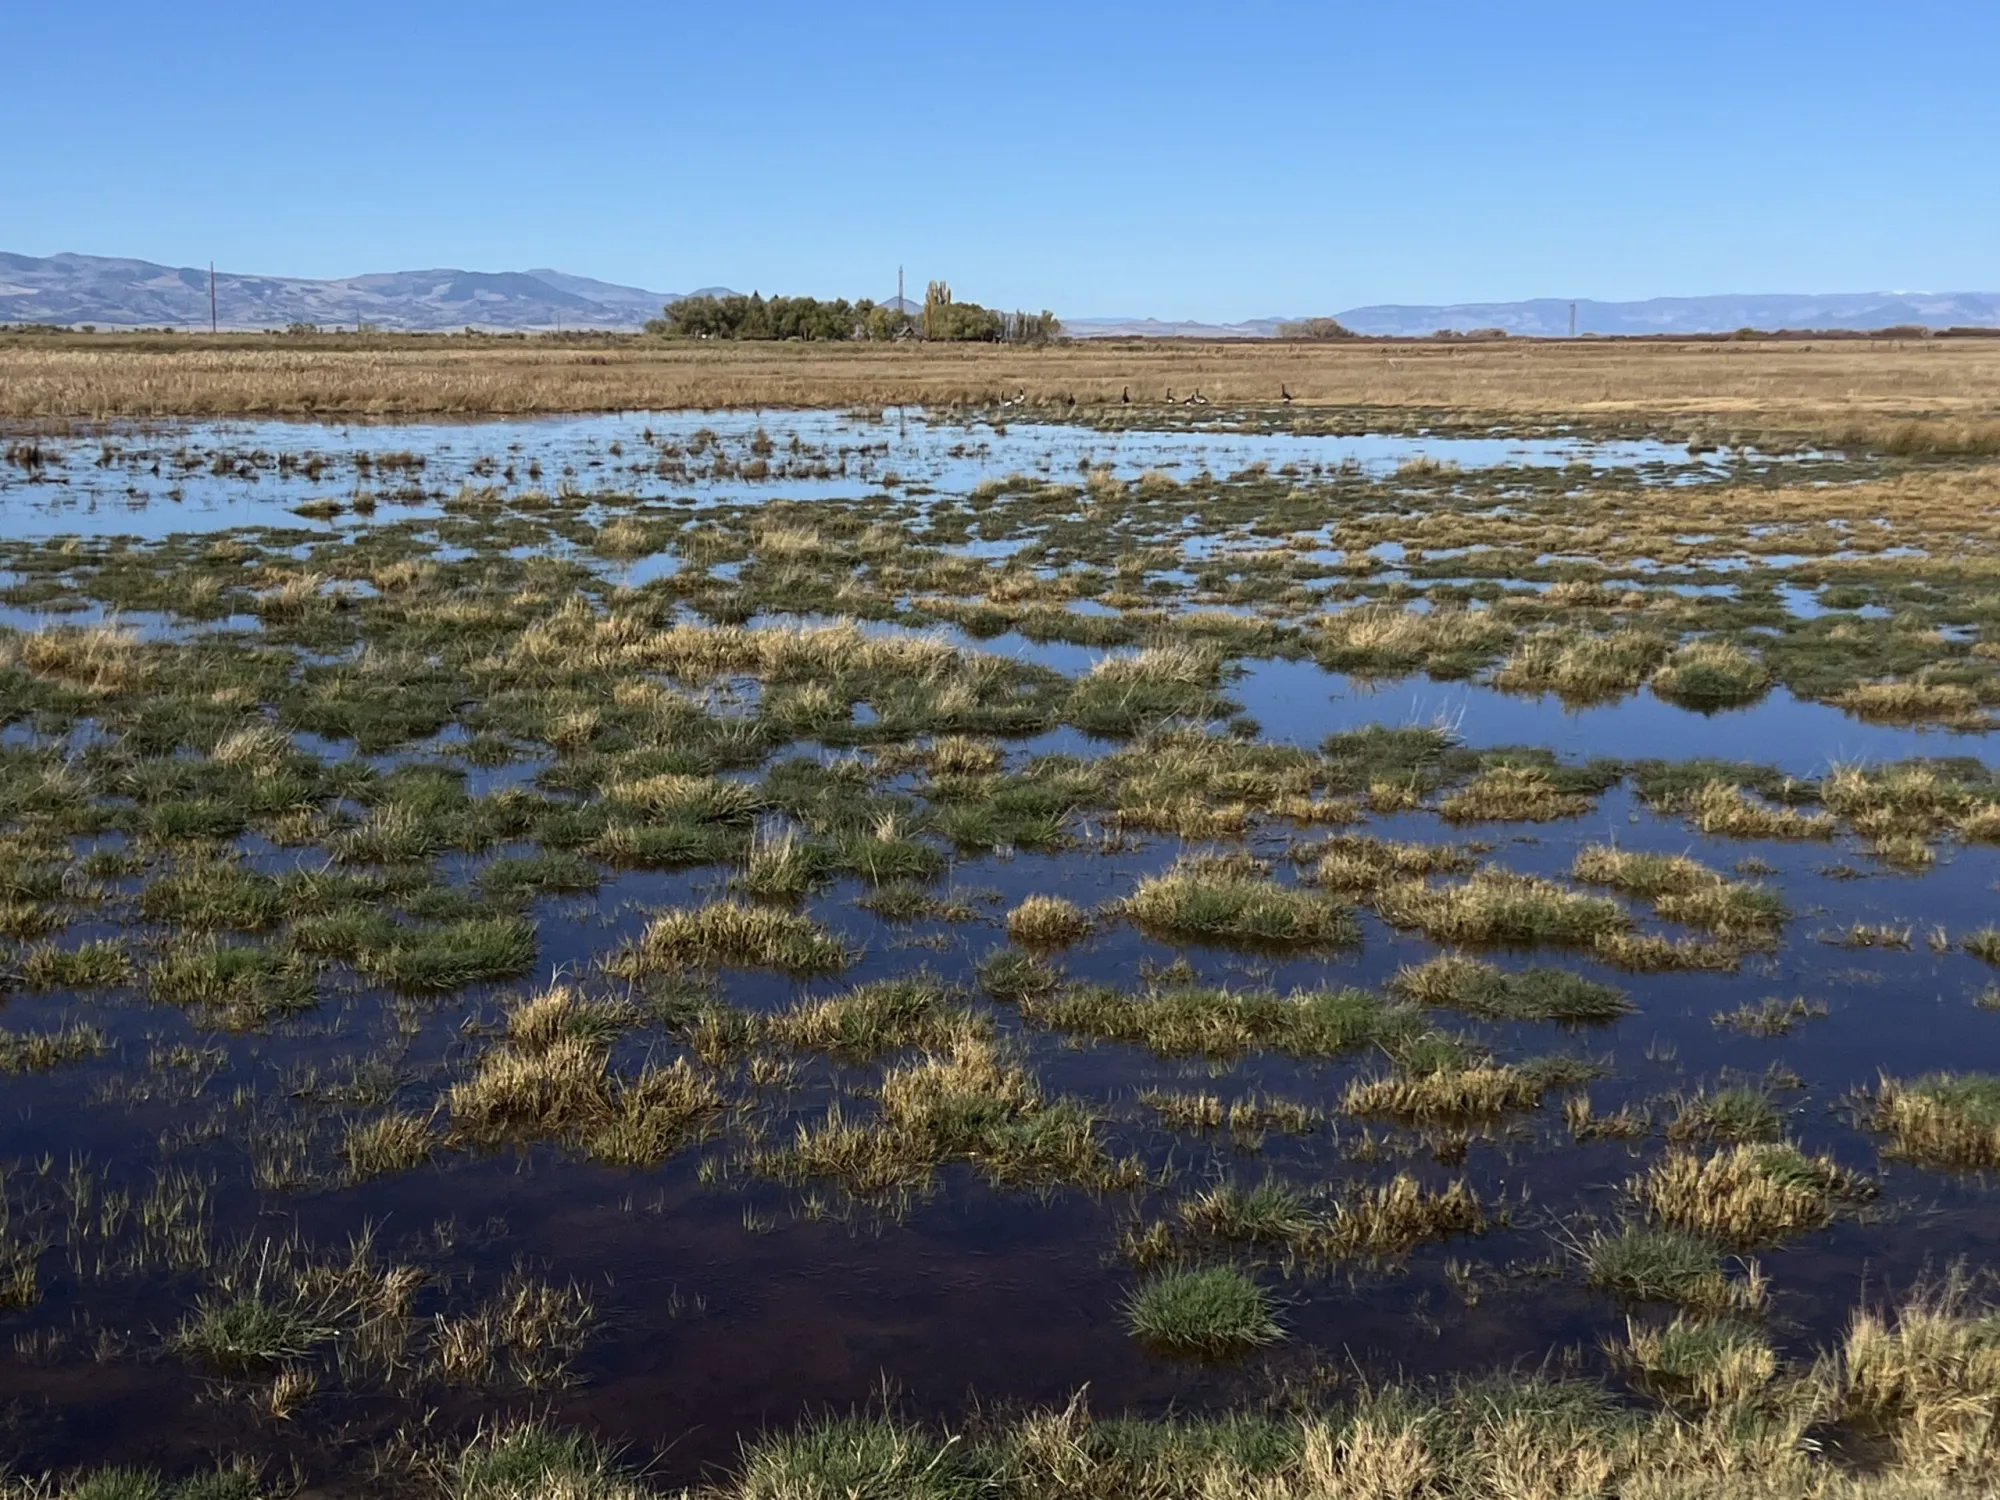
“All of us who live along the river on the flat have water out in the meadows today,” said Higel.
That was not the case before Sunday, Oct. 12, when it became evident the Upper Rio Grande would be impacted by La Niña’s first seasonal storm.
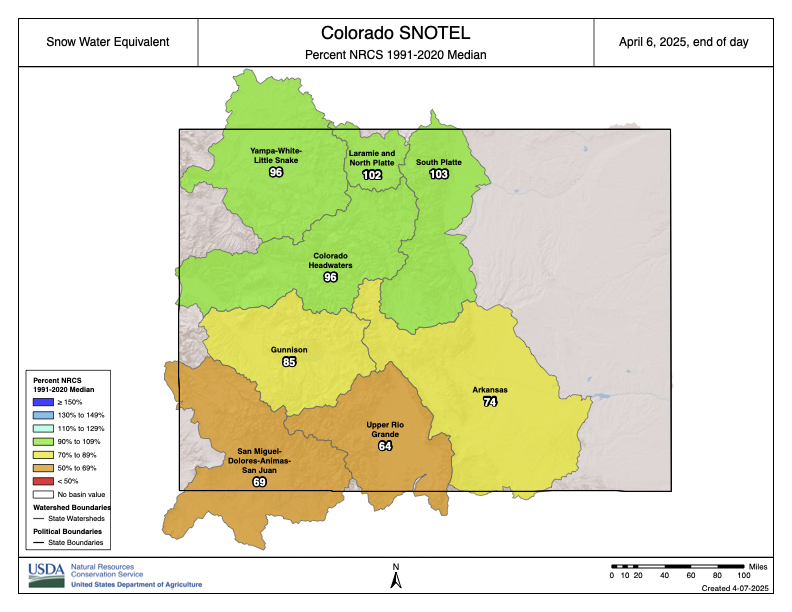
Back in April at the start of the irrigation season, State Engineer Jason Ullmann warned Valley irrigators that the 2025 water year looked troubling given the lack of snow in the San Juan Mountains and expectation for another light spring runoff.
By August, the Rio Grande through Alamosa was disappearing before our eyes. Literally. The flow of the Rio Grande was 180 cfs at Del Norte, the Conejos at Mogote was running at 75 cfs, and downstream into New Mexico the Rio Grande had become a dry bed in Albuquerque.
The state is talking to farmers about extending the water season a bit into November, which would allow for another week of irrigating and another cut of hay. Credit: The Citizen
Then came the ocean storms over the Pacific and heavy rains through the southwest, and the rivers that are essential to the Valley and downstream into New Mexico sprang to life. The Upper Rio Grande at Del Norte hit 7,180 cfs, and unheard of flow this late into the water season. The Conejos River at Mogote hit its record high flow for the season, and farmers in the southern end of the Valley, like Higel on the west end, opened ditches to take water in.
“This helps us in the long run,” said Lawrence Crowder, president of the Commonwealth Ditch.
The Commonwealth had six ditch riders working the storm and diverting water into fields throughout the week. Now the expectation is the water will freeze in the fields and then thaw in the spring to give irrigators “a little extra head start.”
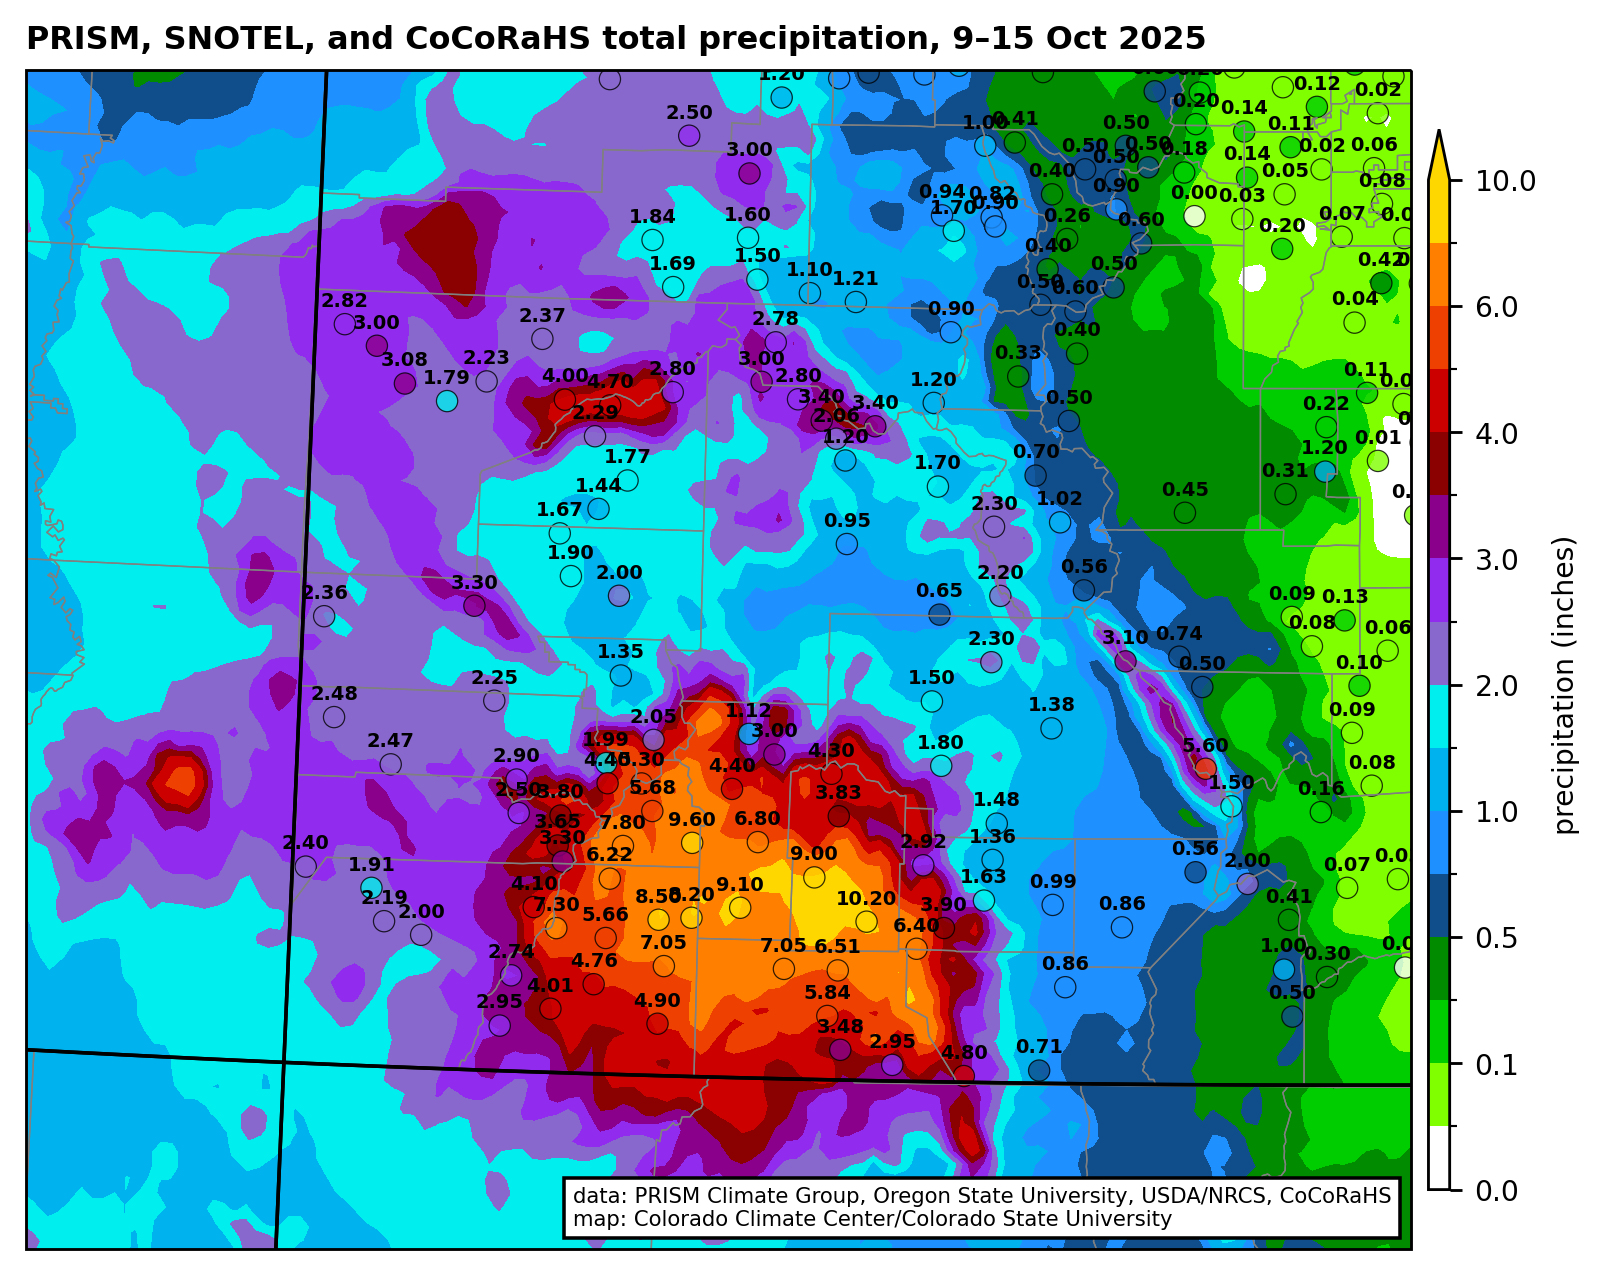
Total precipitation (inches) from 9-15 October 2025 with gridded data from the PRISM Climate Group and observations from the Community Collaborative Rain, Hail, and Snow (CoCoRaHS) network.
“It’s not going to dry out much between now and when the snow flies,” Crowder said.
The October moisture also turned around the calculations of the Colorado Division of Water Resources and its delivery of water to the New Mexico state line under the Rio Grande Compact. The weather event, according to initial estimates by the Colorado Division of Water Resources, added 20,000 to 25,000 acre-feet of water to the Rio Grande system itself, and around 10,000 to 15,000 acre-feet that was diverted into the private ditches like the Commonwealth and Centennial.
“All of us who live along the river on the flat have water out in the meadows today,” said rancher Greg Higel. Credit: The Citizen
With all the extra water, Colorado no longer thinks it overdelivered this year and instead likely owes in the neighborhood of 5,000 acre-feet to New Mexico.
At the upcoming Rio Grande Water Conservation District quarterly meeting on Oct. 21, Colorado Division of Water Resources officials will deliver a report that should provide final estimates on the amount of water the great storm of October delivered and the impact it had on the Upper Rio Grande Basin.
Needless to say, the reversal of fortunes on the Upper Rio Grande was dramatic. At least for 2025.
Rio Grande and Pecos River basins. Map credit: By Kmusser – Own work, Elevation data from SRTM, drainage basin from GTOPO [1], U.S. stream from the National Atlas [2], all other features from Vector Map., CC BY-SA 3.0, https://commons.wikimedia.org/w/index.php?curid=11218868
The flooding that breached the levees of Vallecito and Grimes creeks on Oct. 11 and forced the evacuation of 390 Vallecito homes has been described as “unprecedented.” Record flow rates fueled by record rains left the little valley awash, with recovery efforts expected to continue for months. The event – which owed its debut to Tropical Storm Priscilla and, to a lesser extent, Tropical Storm Raymond – is a striking reminder of the power of Mother Nature. But when compared with another destructive flood that inundated towns, drowned fields of crops and washed out miles of railroad tracks, the Vallecito flood hardly made a splash…
The 1911 Flood occurred 114 years ago on Oct. 5, 1911 on the Animas River. According to the Animas Museum in Durango, “1911 was a wet year for southwest Colorado with heavy snows in the high country and heavy rains through the summer.” A gentle rain began Oct. 5, the museum’s summary said. By morning, 2 inches of rain had fallen and the storm showed no sign of letting up. The Animas Museum described the Animas River’s waters as “unstoppable.”
[…]
The river flowed at an estimated rate of 25,000 cubic feet per second, washing out railroad tracks and shutting the stretch of Denver & Rio Grande Western Railway’s railroad for nine weeks. By comparison, the Animas River reached 4,860 cfs on Tuesday, less than a fifth the amount in 1911. Matt Aleksa, meteorologist for the National Weather Service in Grand Junction, said the 1911 Flood was “way worse” than the flood that washed through Vallecito last weekend. The only real comparable details, he said, are both events were caused by tropical storm systems that resulted in consecutive days of heavy rainfall. He said 1911 opened with a strong winter and heavy snowpack. In the summertime, runoff combined with a strong monsoon season, and disaster finally struck in October when a tropical storm rolled through. The soils were already saturated, meaning moisture from rain wasn’t absorbed into the ground and instead flowed over it. In 1911, Durango received almost 3.5 inches of rain over 36 hours. Silverton received 4 inches of rain. Gladstone north of Silverton received 8 inches of rain, Aleksa said. Between 2 and 4 inches of rainfall was measured in the Animas River Basin and 4 to 6 inches was measured at higher, mountain elevations. He said the Durango area probably received half the precipitation last weekend as it did during the 1911 Flood.
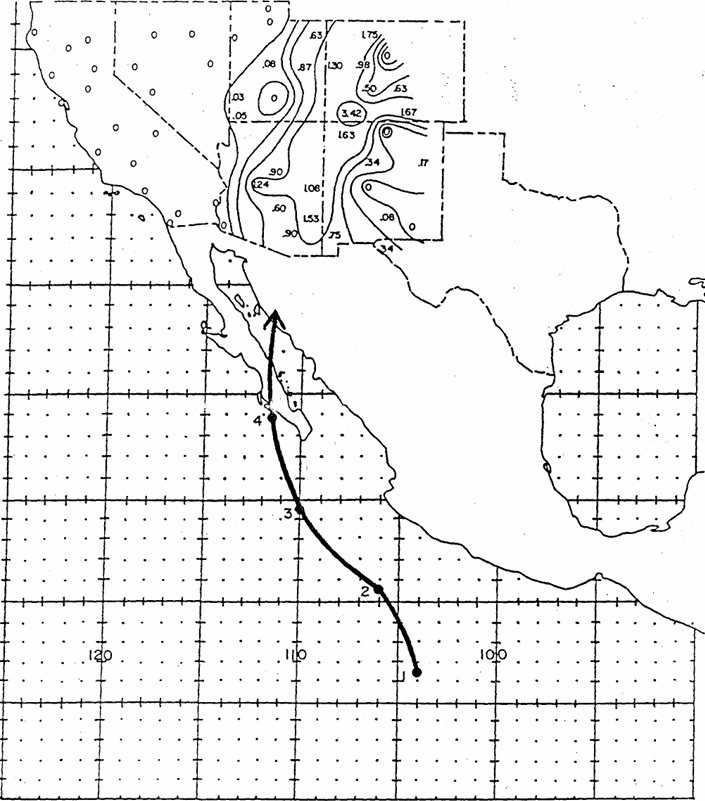
Track of the October 1911 hurricane, along with rainfall measurements in the southwestern US. From the National Weather Service report “THE EFFECTS OF EASTERN NORTH PACIFIC TROPICAL CYCLONES
ON THE SOUTHWESTERN UNITED STATES”, https://www.weather.gov/media/wrh/online_publications/TMs/TM-197.pdf . h/t Jeff Lukas for pointing out this report.
There is no way around it: The city of Durango must increase water and sewer rates next year and follow up with annual rate increases going forward, according to city officials. For water rates, the city proposes an average monthly increase of $2.80 for residential accounts and $16.76 for commercial accounts. For sewer rates, the city proposes an average monthly increase of $9.18 for residential accounts and $78.14 for commercial accounts. The city, which has a number of significant water infrastructure projects planned for the next decade – including a $35 million to $40 million replacement of the pipeline that delivers Durango’s drinking water – expects its water fund to be $3 million in the red by the end of 2030, officials said. The sewer fund requires a rate increase just to meet operational expenses, which are projected to exceed revenues next year…
The Public Works Department is recommending 10% and 20% increases to water and sewer rates, respectively, to be followed by annual increases yet to be determined. What residents should expect of annual rate increases will be informed by a rate study outlined in pending water and sewer master plans to be completed in 2027, said Bob Lowry, interim Public Works director…Had the city incrementally raised rates annually “since Day 1,” current rates would be significantly higher. If rates aren’t raised soon, larger increases will be necessary later on, and utility customers will feel them all the more in their pocketbooks. Lowry said it’s best practice to review water and sewer rates annually and to adjust them no less frequently than every other year.
Map of the San Juan River, a tributary of the Colorado River, in Arizona, Colorado, New Mexico and Utah, USA. Made using USGS National Map data. By Shannon1 – Own work, CC BY-SA 4.0, https://commons.wikimedia.org/w/index.php?curid=47456307
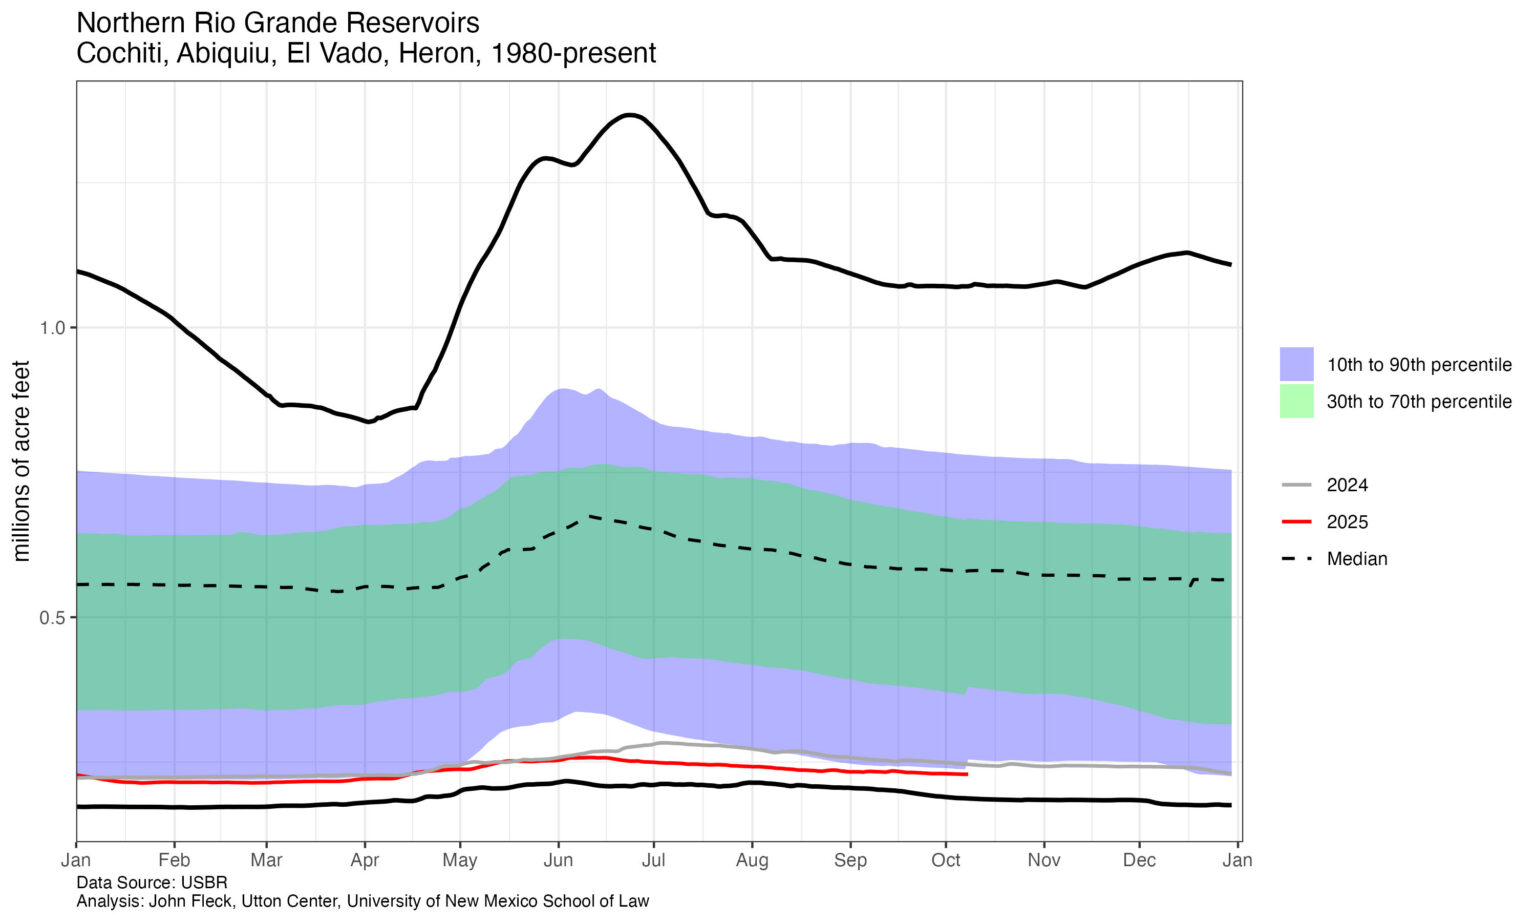
Exploring the data commons (I need to update the legend, the black lines are max and min)
Click the link to read the article on the InkStain website (John Fleck):
October 9, 2025
A bunch of odds and ends cluttering my brain, blog posts that are half written in my mind that are in the way:
Quoting Luis Villa on accessing the open data commons
Yes.
See graph above.
I always have had more questions (sometimes ill-posed, sometimes well-thought-through) than my coding abilities can execute. (See also domestic wells below.)
I pay for a subscription to Newspapers.com in order to have access to a large portion of my written work. I view what I have written over the course of my life – newspapers, books, blogs – as a mindful and intentional contribution to the information commons. But this aligns poorly with the formal economic and legal structures – “institutions” as we might define them for our water resources students, the rules that serve as the foundation for the more common-language definitions of “institutions” that might apply here, the organizations of publishing – newspapers and book publishers and Inkstain.
The newspaper paid me well (it wasn’t a lot of money, but I viewed it as a fair transaction) and owned what I produced. I pay now for the privilege of reading it. The books are more complicated. I choose to make Inkstain freely available.
Derrida and Adorno, two philosophers I have been poking at of late, are helping me think about the definitional challenges – not “the commons” in particular, but what we’re doing when we attach words/concepts to things, the cultural quicksand beneath our linguistic feet.
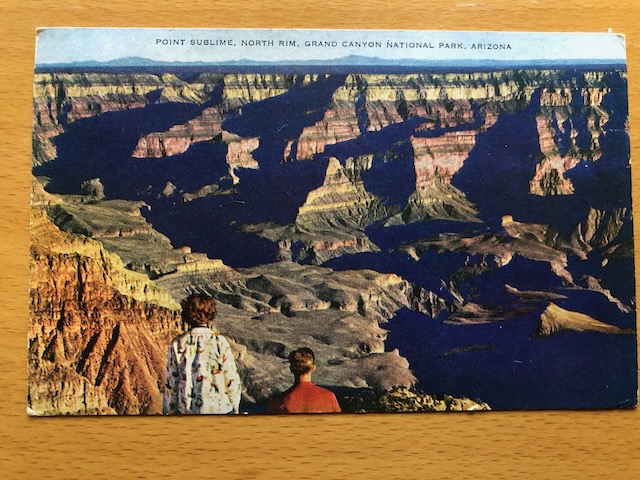
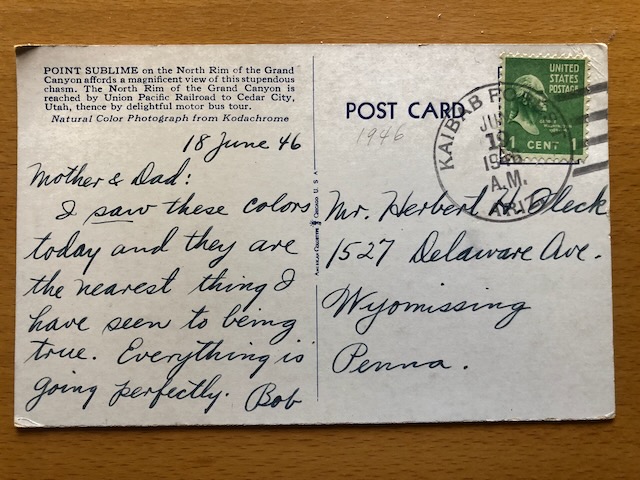
That Postcard
Point Sublime
“the nearest thing I have seen to being true”
Found this in a stack of old Dad stuff. It is my origin story, my father as a young artist in a moment of profound change. In laying the groundwork for his life, it laid the groundwork for mine.
Domestic Wells
OpenET-reported change in evapotranspiration, 2000-2004 compared to 2020-2024. Green is places water consumptive use from all sources has gone up. Brown is places it has gone down.
Density of domestic wells in greater Albuquerque. Dark green is >150 wells per square kilometer. Brown is no wells at all.
See Luis’s comment above about vibe coding and open data.
I am not sure what to do with this. I can’t unsee it.
I’m out on the epistemological thin ice here, but as a journalist I spent much of my life working in areas where that ice is thin, it’s where the interesting stuff happens.
Ostrom and the Colorado River
I’ve mostly been grabbing the handrail and trying not to fall off as my Wilburys friends, in what we see as a discourse vacuum, charge ahead with our critique of Colorado River governance:
In a 2011 paper, Elinor Ostrom laid out one of the final versions of her “design principles,” characteristics of successful institutional arrangements for collective action around natural resource systems. We spend a lot of time on this in the class I teach with Bob Berrens each fall for UNM graduate students. It was at the heart of my book Water is For Fighting Over, and it is at the heart of Ribbons of Green, the book Bob and I wrote that UNM Press will be publishing next year.
(Did I mention how much I love teaching?)
There are two design principles in particular that are at the heart of the current Colorado River challenges. Quoting from Ostrom 2011:
How are conflicts over harvesting and maintenance to be resolved?
How will the rules affecting the above be changed over time with changes in the performance of the resource system, the strategies of participants, and external opportunities and constraints?
There is an additional principle from Ostrom that shows up over and over in her work, that’s embedded in her explicit principles: a need for a shared understanding of the quantification of the resource.
I am thinking through how these ideas relate to the current Colorado River challenges. Those challenges suggest what I had thought was a functional system lacks these three things. I am thinking a lot about what I described in 2015 when I was writing Water is For Fighting Over, versus what I see happening in 2025. What has changed, or what did I miss?
In which I get my first ambulance ride
Burying the lead here (I always hated the artifice of the journalistic jargon-spelling “lede”), but I had occasion recently to spend a few days in the bubble of the medical-industrial complex. I’m fine, I think, but the identification of a “new” life-changing risk is in actuality the identification of a risk that has probably been there all along. It’s just that now I know about it.
Which means I can do some stuff to reduce that risk, including magical pharmacology (“If I crash,” I told my bike-riding buddy Sunday, “be sure to tell the EMT’s!”) and also saying more “nos” to the stresses of my life of public engagement. My contributions to the commons are not without personal cost, as well as the personal benefits I derive. (Sorry, J.)
It also means that I spend a lot of time thinking about this (new?) risk. This is subtext to all the rest of what I just wrote.
Our post from over the weekend highlighted the first round of heavy rainfall and flooding in southwest Colorado. There was a break in the rain on Sunday, October 12, and then a second round of heavy rain on Monday the 13th associated with moisture from remnant Tropical Storm Raymond. That’s right, a one-two punch of tropical moisture from the larger Priscilla and then from Raymond a couple days later. Here are some observations of the total precipitation over the entire event.
Total precipitation (inches) from 9-15 October 2025 with gridded data from the PRISM Climate Group and observations from the Community Collaborative Rain, Hail, and Snow (CoCoRaHS) network.
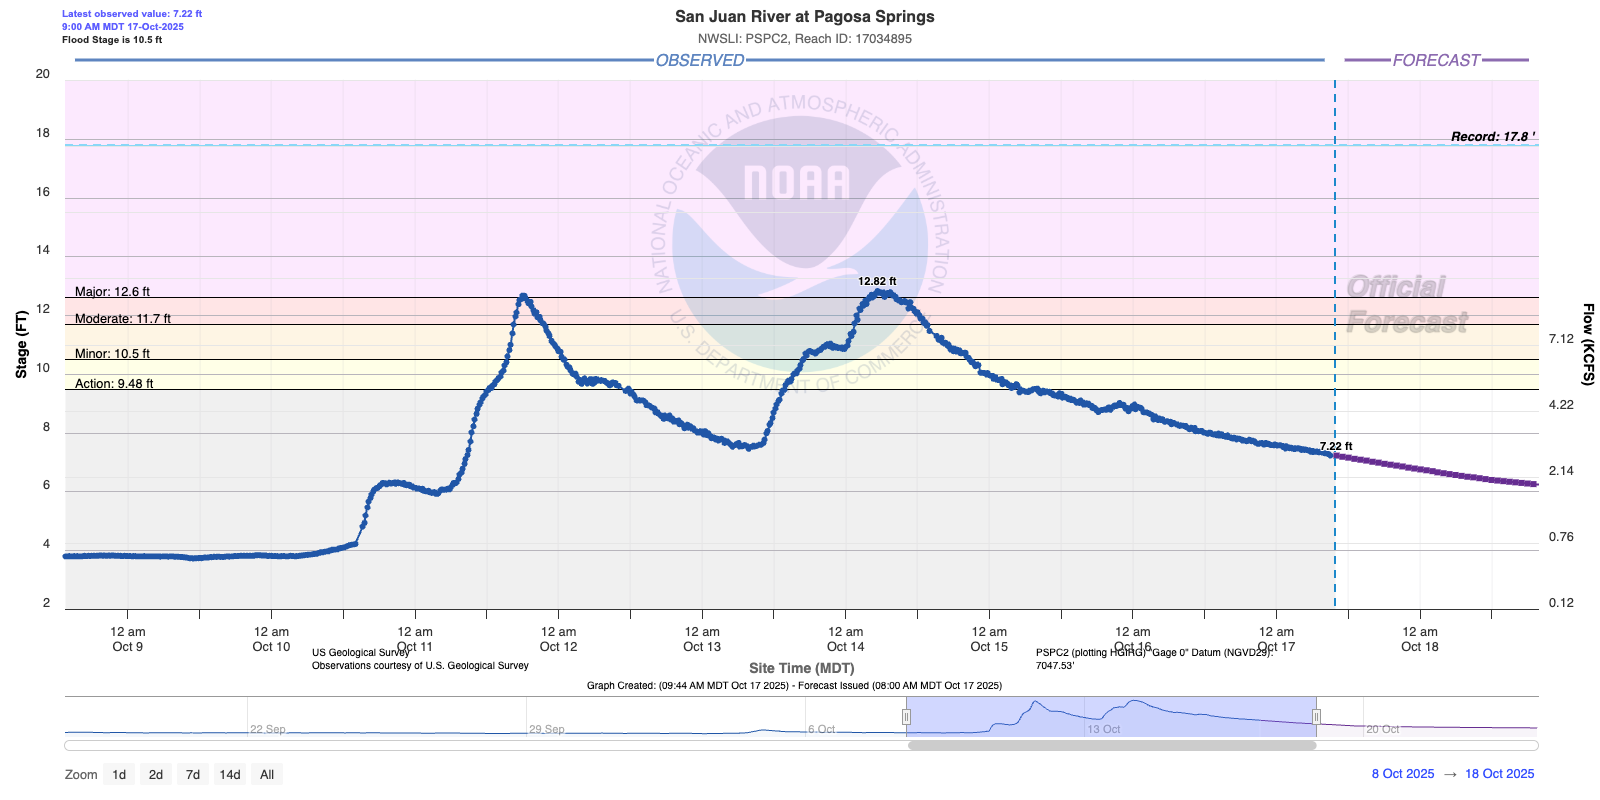
With soils already saturated and rivers and creeks running high, the Monday rainfall led to even more flooding in La Plata and Archuleta Counties. The San Juan River at Pagosa Springs actually peaked slightly higher on Tuesday morning than it did on Saturday, once again reaching major flood stage.
The high elevations of the San Juan mountains received another 3-4″ of precipitation on Monday (a bit of it as snow on the higher peaks), with 1-3 additional inches at lower elevations around Pagosa Springs, Bayfield, and Durango. This brought the 7-day total precipitation to a remarkable 10.2 inches at the Upper San Juan SNOTEL station, with over 9″ at several other sites.
7-day precipitation at southwestern Colorado SNOTEL stations from 9-15 October 2025. From the USDA NRCS interactive map
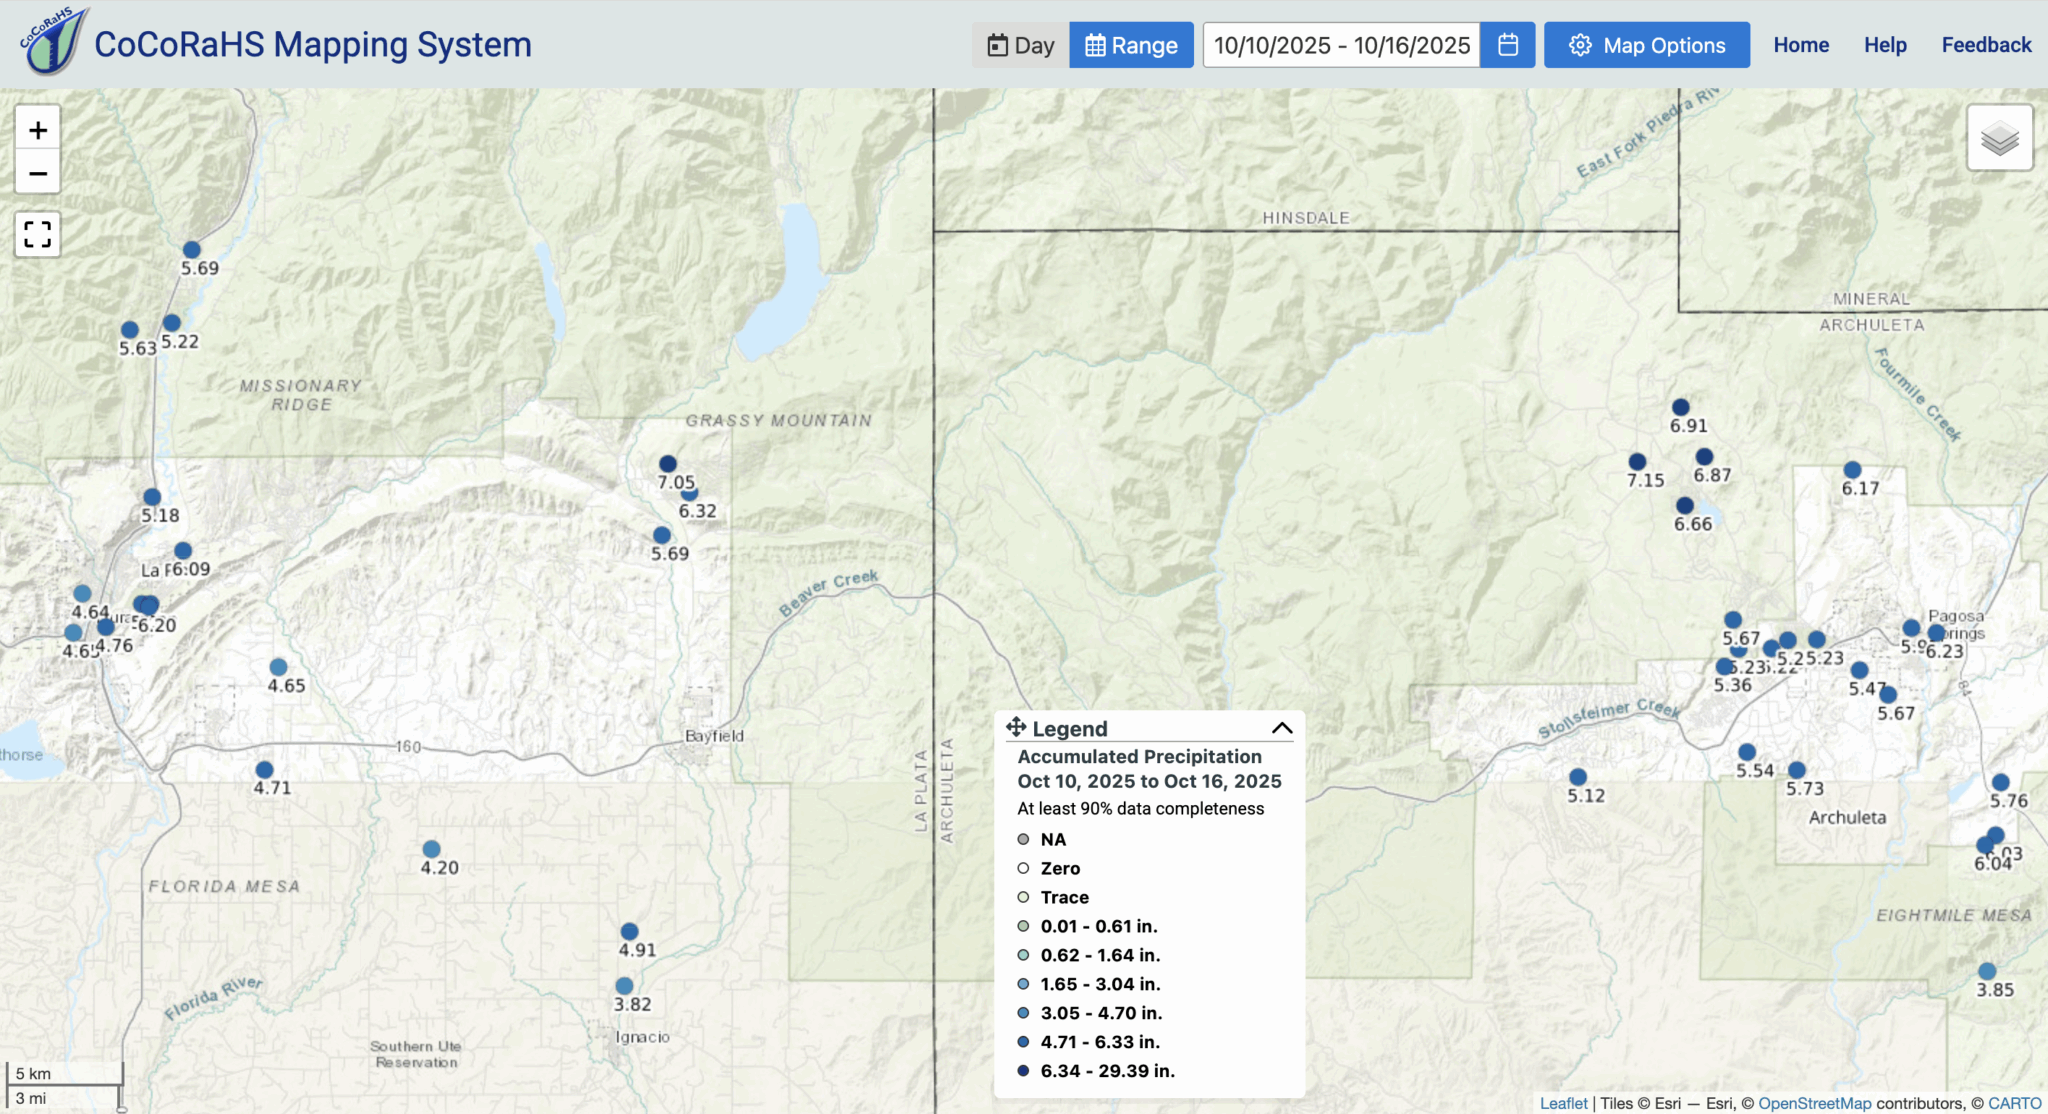
Volunteer observers from the Community Collaborative Rain, Hail, and Snow network (CoCoRaHS) recorded over 7 inches of rainfall in 7 days north of Bayfield and northwest of Pagosa Springs. These are huge rainfall totals for this part of the state!
CoCoRaHS precipitation observations for the period from 10-16 October 2025 in La Plata and Archuleta Counties. From https://maps.cocorahs.org/
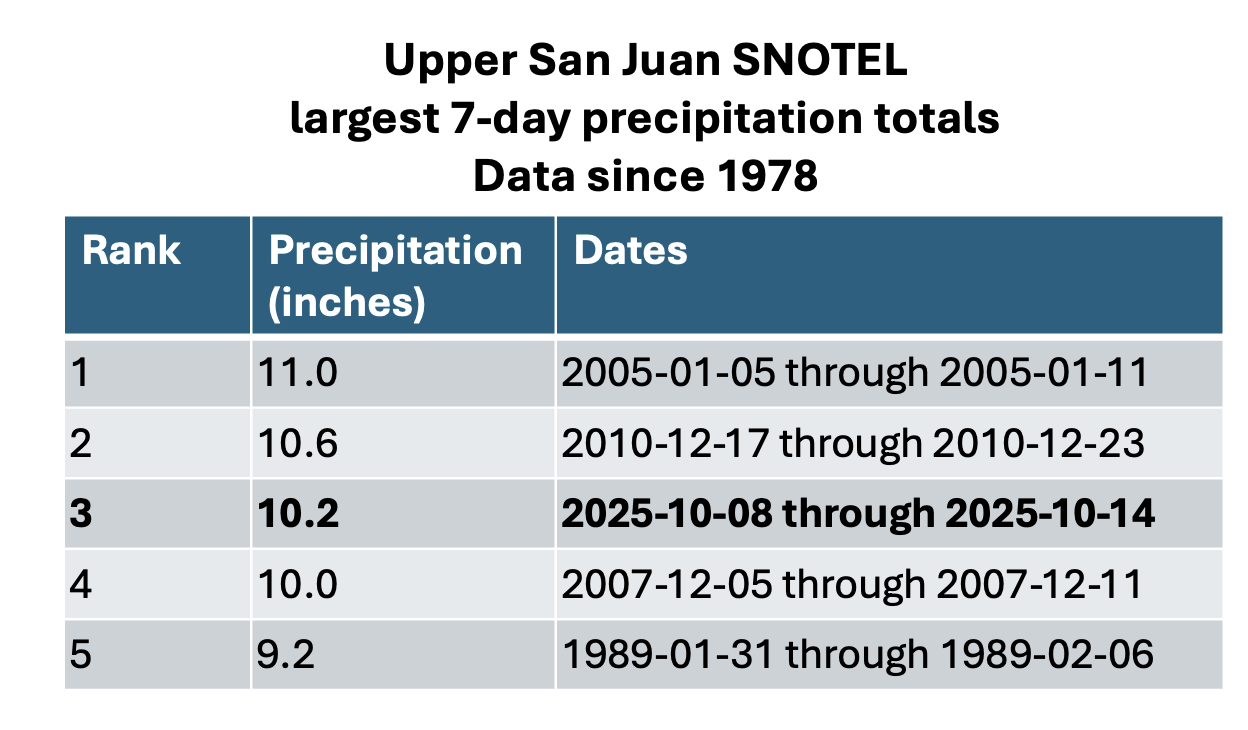
Updating the table from the previous post to show seven-day precipitation accumulations at the Upper San Juan SNOTEL station, we see that the 10.2″ from the recent storm is surrounded only by huge winter snowstorm cycles. In the years since that station was established in 1978, there aren’t any fall rainstorms that come anywhere close to rivaling it.
Ranking of the top 7-day precipitation totals at the Upper San Juan SNOTEL station since 1978, with overlapping periods removed. Data from ACIS.
The hurricane and flood of October 1911
Looking back farther in history, however, there is one event that surpassed this one in terms of the level of flooding in the southwestern US (including Colorado): the “Sonora hurricane” of October 1911. This caused the flood of record on many rivers in southern Colorado, including the San Juan at Pagosa Springs (the 17.8 feet shown on the graph at the beginning). Jonathan Thompson of the Land Desk had a great summary a few years ago about that flood along with other historic floods in the region. (h/t John Orr for pointing me to this).
The track of the 1911 hurricane appears to be somewhat similar to what happened with Priscilla this year, with tropical moisture streaming ahead of the decaying circulation. (Animations below are from this year, the map below that is the track of the 1911 hurricane.)
Track of the October 1911 hurricane, along with rainfall measurements in the southwestern US. From the National Weather Service report “THE EFFECTS OF EASTERN NORTH PACIFIC TROPICAL CYCLONES
ON THE SOUTHWESTERN UNITED STATES”, https://www.weather.gov/media/wrh/online_publications/TMs/TM-197.pdf . h/t Jeff Lukas for pointing out this report.
There are a lot more rainfall observations available now than there were during the 1911 storm (thank you, CoCoRaHS observers and SNOTEL network, among others!), but from the available data, the rainfall totals over 1-2 days in the 1911 storm were greater than those in the 2025 event, but the fact that there were *two* tropical cyclone remnants in 2025 made the total precipitation over 5-7 days much greater. The break in the rainfall on Sunday in between the two waves of heavy rain was certainly important, or the flooding could have been closer to what happened in 1911.
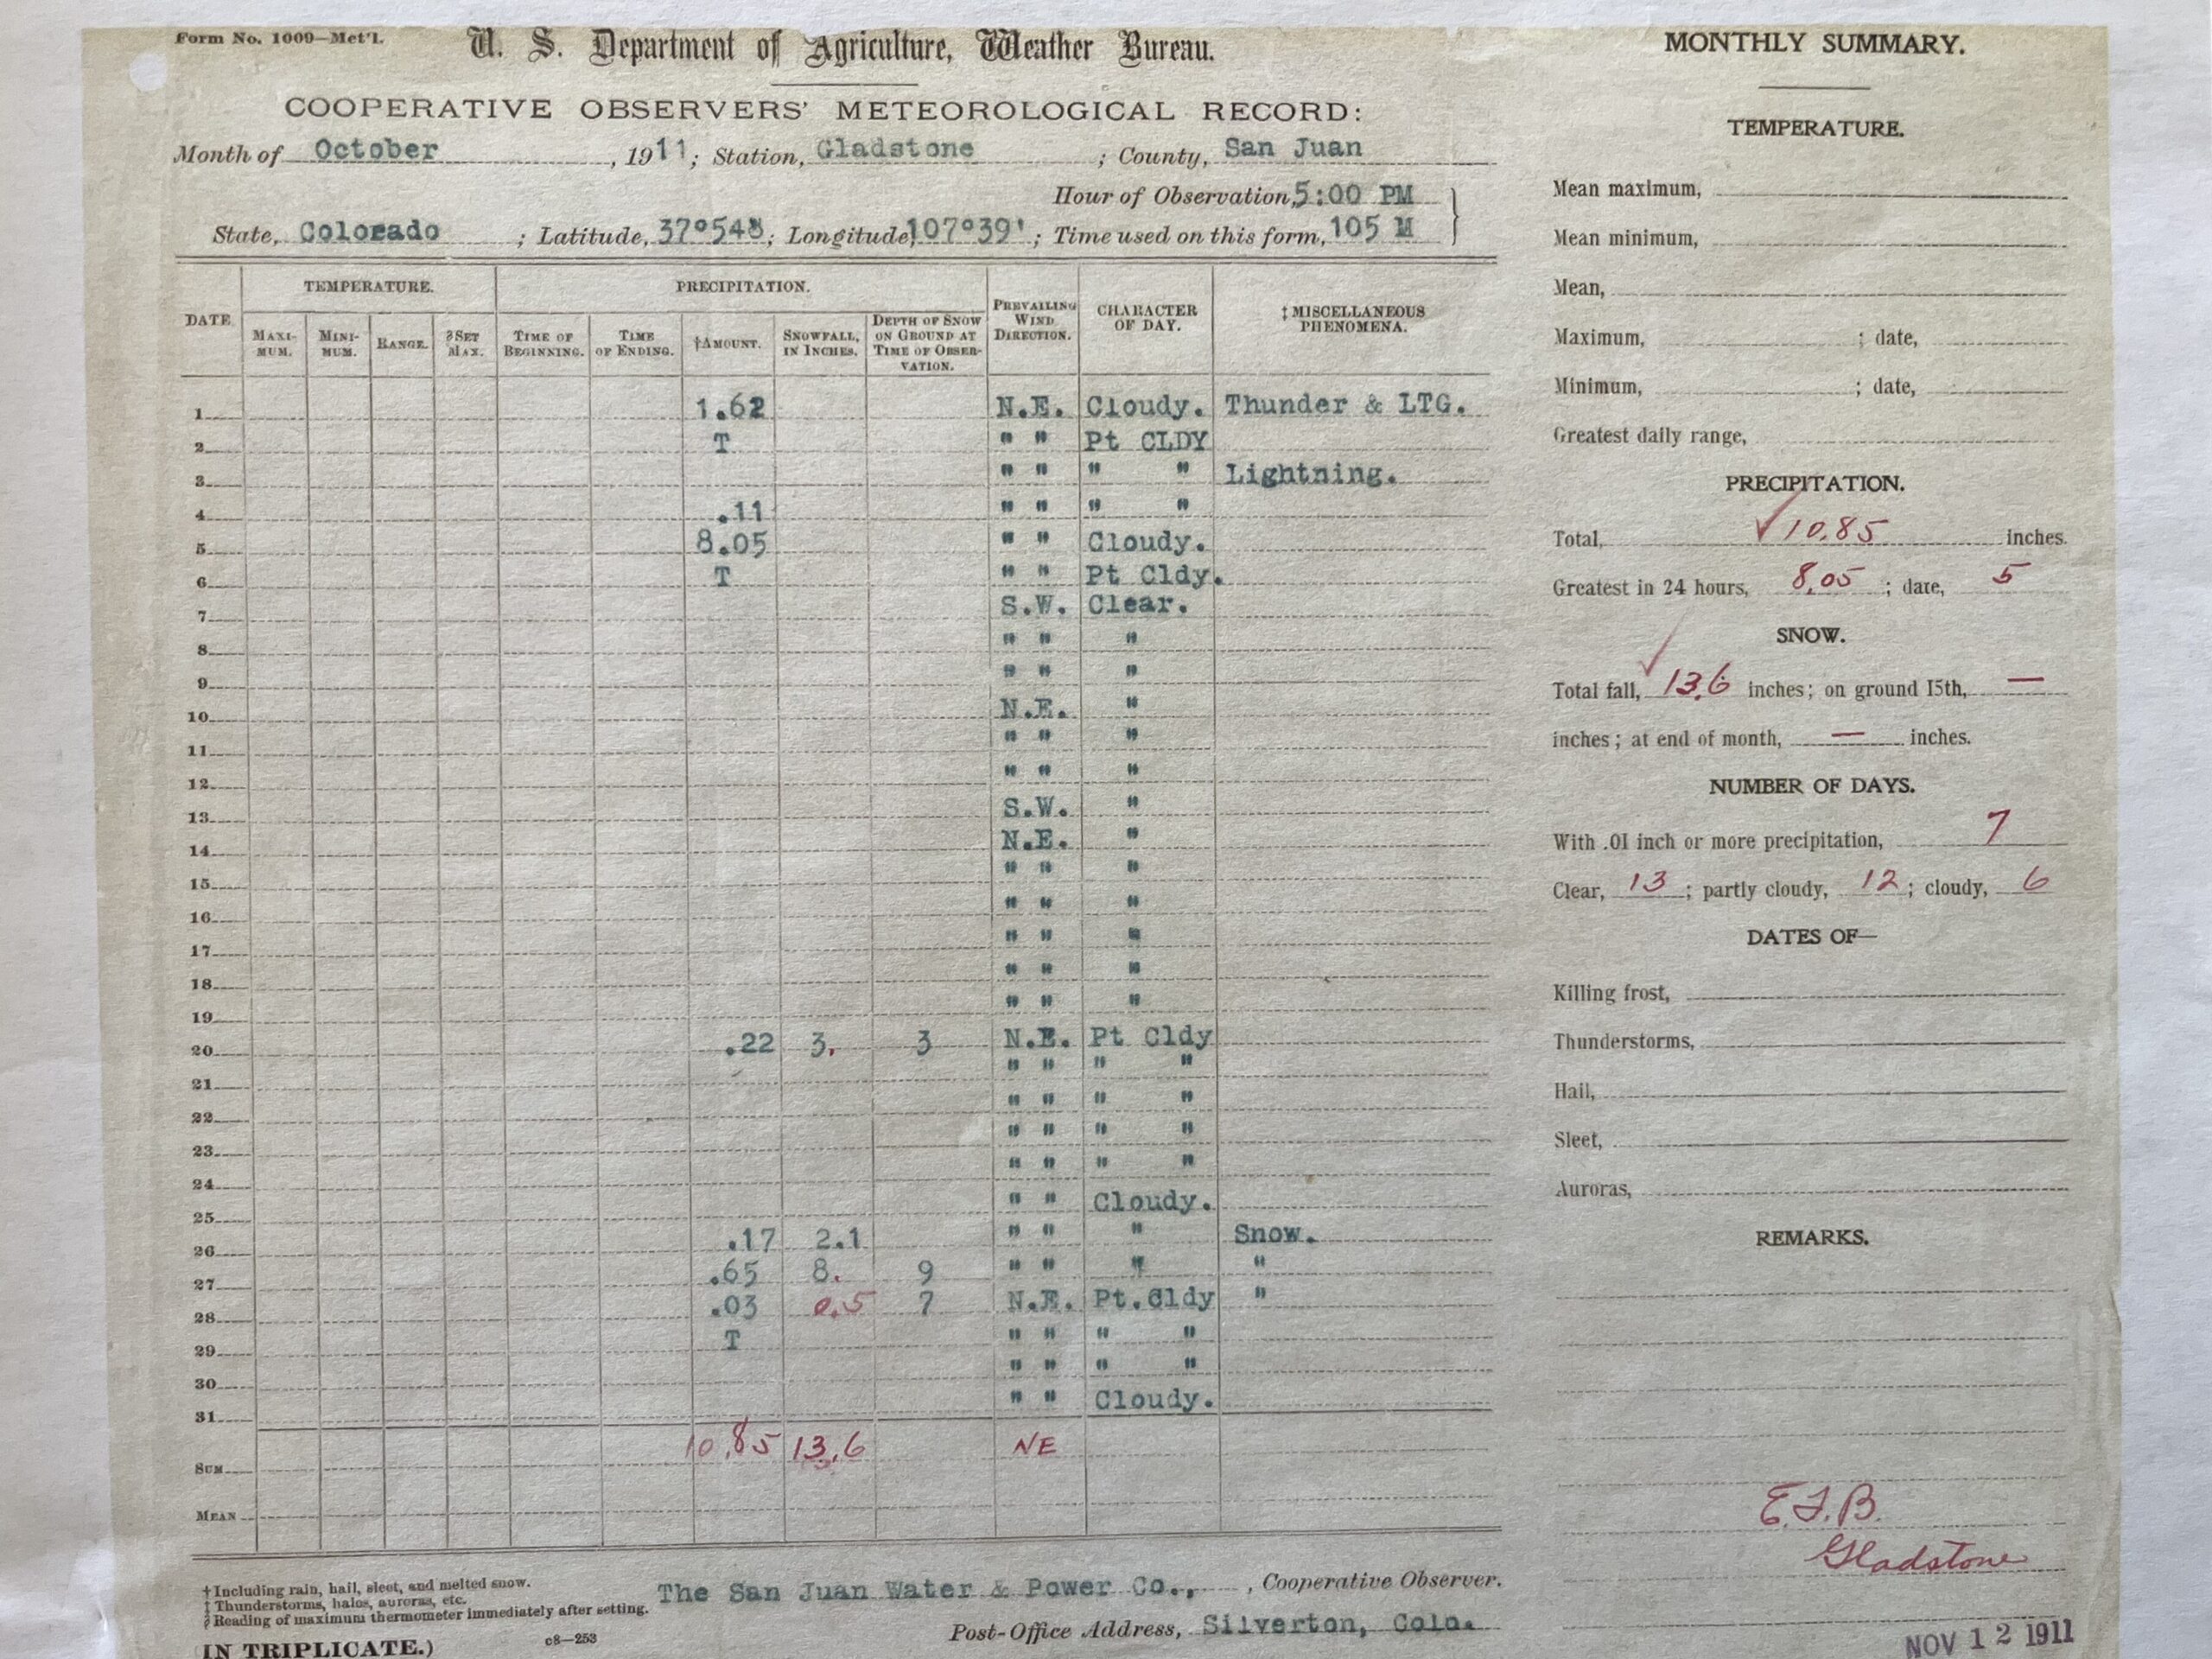
And it turns out there was a particularly controversial rainfall observation in October 1911 — I was not really aware of this previously, but my predecessor Nolan Doesken was involved in many of the debates surrounding the chart shown here.
Photo of the cooperative observer form from Gladstone, Colorado, October 1911.
This is the observation form from Gladstone, Colorado, north of Silverton, at around 10,500 feet elevation. It shows 8.05″ on October 5, 1911. There’s no question that a lot of rain fell in southwestern Colorado during that storm based on the floods that happened, but if it’s possible for over 8″ of rain to fall in one day at 10,500 feet, that has major implications for the robustness of infrastructure that is needed. A later study of the flooding near Gladstone by Pruess, Wohl, and Jarrett found that it was not consistent with such large rainfall accumulations (or at least not within 24 hours), and the Gladstone observation is now generally deemed to be unreliable.(Thanks to Jeff Lukas for pointing this paper out.) Even so, Silverton recorded 4.05″ on October 5, 1911, and flooding on the Animas and San Juan Rivers reached record levels (at least since measurements have been in place)
The good news: improvements in drought conditions
The flooding in southwestern Colorado led to the destruction of multiple homes and to major disruptions around the region. But the flip side is that all the rain will help to ameliorate the lingering drought in the area. Everyone would prefer that the water arrive more steadily rather than in a huge burst like this, but as noted in this Colorado Sun story, small reservoirs like Vallecito saw big boosts in their storage from the storm. On this week’s US Drought Monitor, there were widespread two-category improvements in southwestern Colorado, going either from D2 (severe drought) to D0 (abnormally dry), or from D1 (moderate drought) to nothing on the map. Two-category improvements in one week are very rare for the Drought Monitor, typically only applied when there are major rain events associated with tropical systems.
Summary of US Drought Monitor changes for the week ending October 14, 2025. Courtesy of Allie Mazurek, Colorado Climate Center.
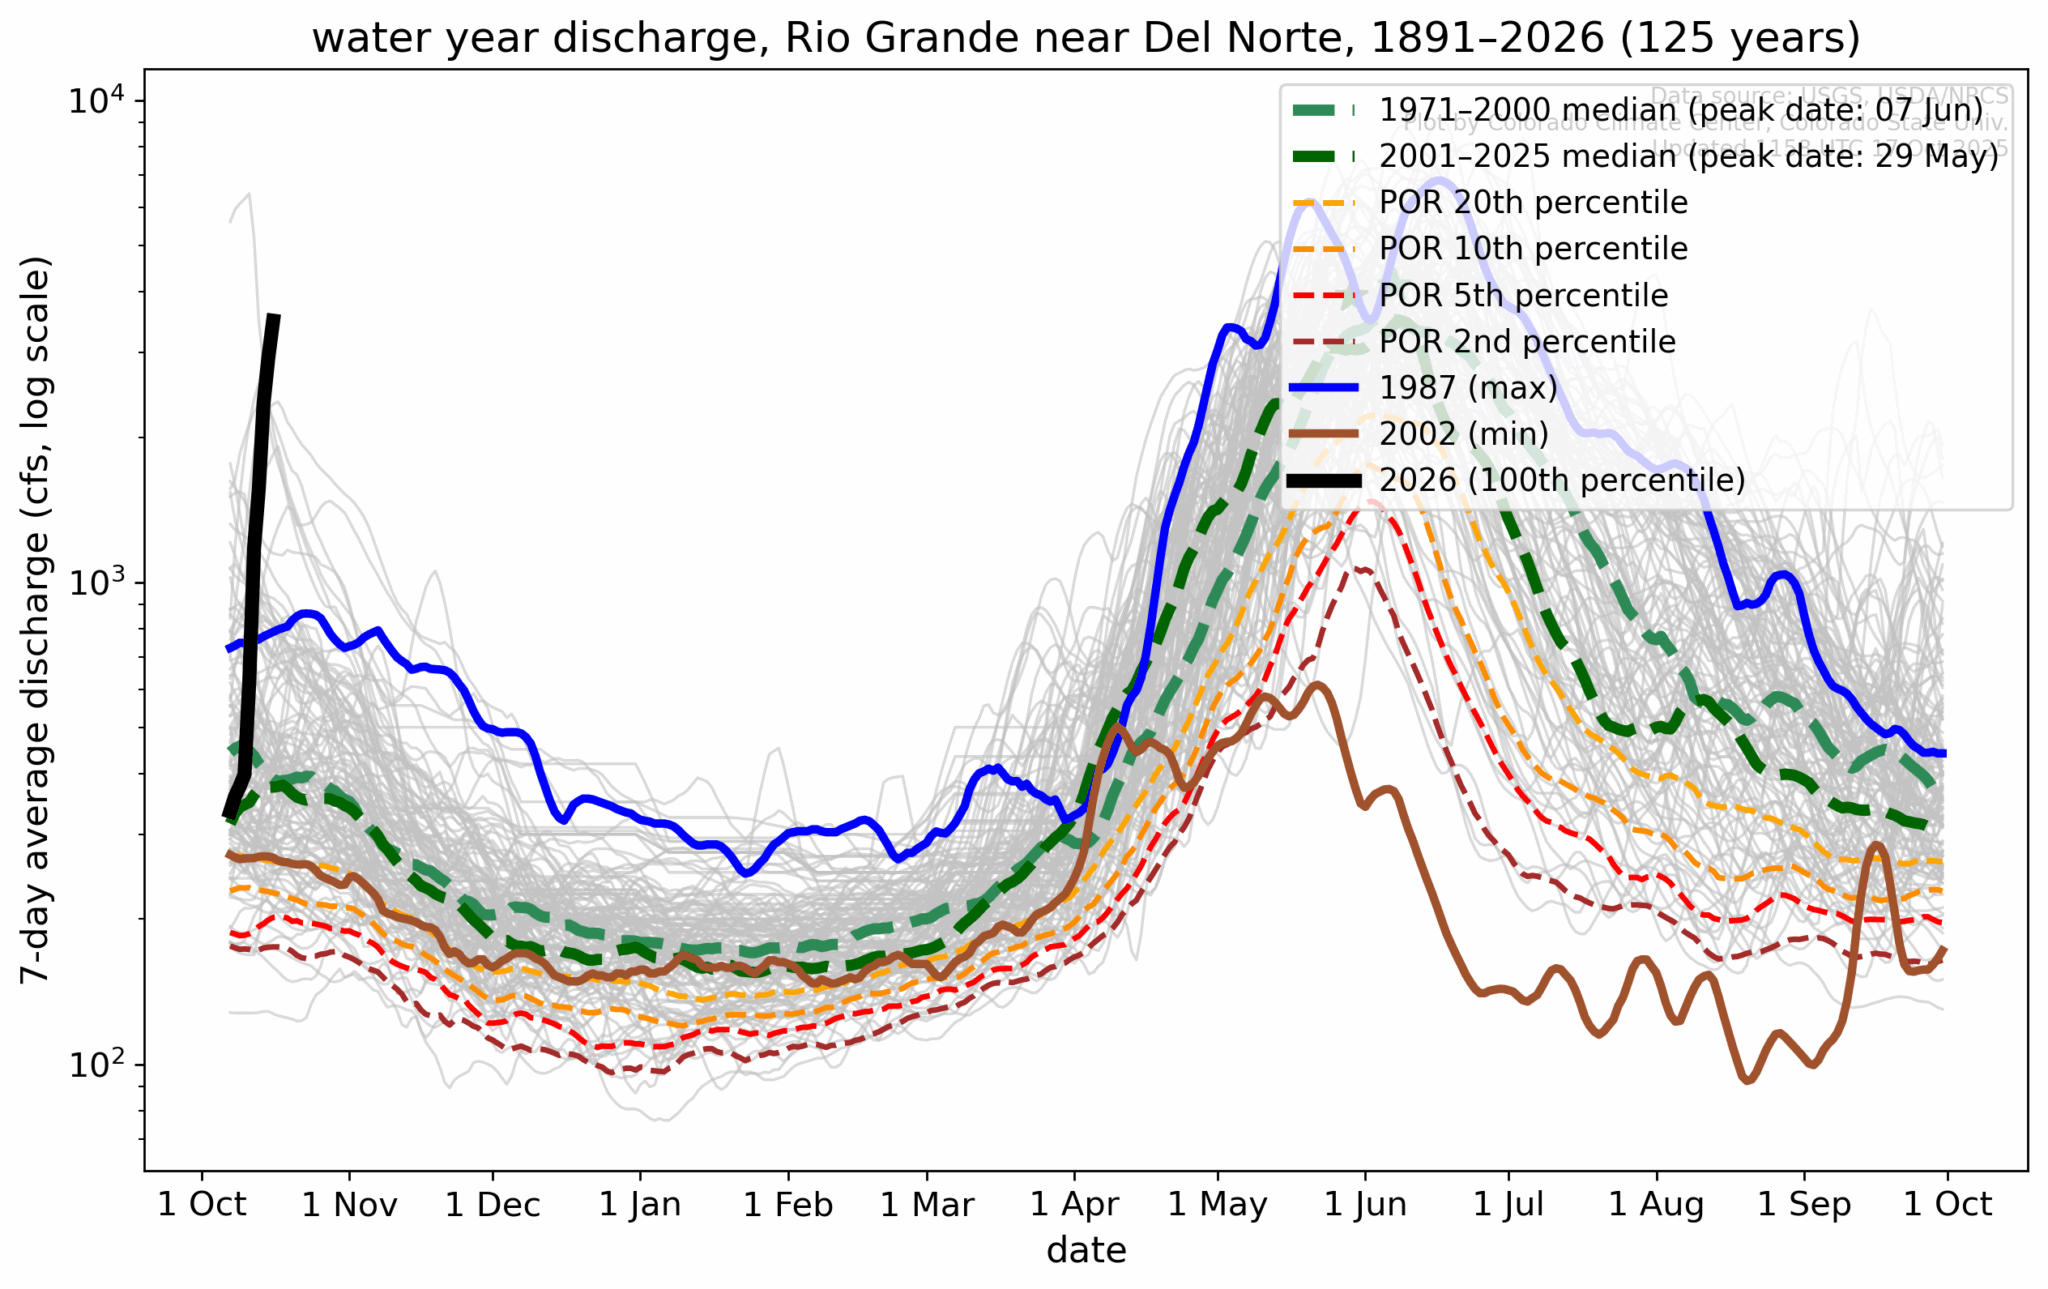
Both the Animas and Rio Grande Rivers saw huge increases in streamflow, with 7-day average flows near record levels for the fall, and close to the average early-summer peak from snowmelt runoff. On the Rio Grande, only the peak from October 1911 is higher than the current average flow for the period between October and April. [Daily data is missing for the Animas in October 1911, but it surely peaked even much higher than shown on the graph.]
Other than around the San Juan Mountains, this event didn’t end the drought that goes back to last winter (or even longer, depending on how you define it) across western Colorado, but did put a nice dent into the precipitation deficits that had mounted over that period. Now it’s time to look ahead to the snow accumulation season and see what arrives in the usual source of water in western Colorado: the mountain snowpack.
We got pulled in to analyzing this major storm, along with some other activities this week, but we will be finalizing and releasing our recap of Water Year 2025 within the next week or so, so please stay tuned for that! [Subscribe here if you want to get it delivered straight to your inbox. And use the ‘subscribe’ box here on the blog if you like these posts and want to get them in your email — it’s a different mailing list.]