A late-season surge of tropical moisture brought heavy precipitation and areas of flooding to parts of the Four Corners States. Amounts of 4 to locally over 6 inches were reported in parts of interior Arizona and southern Colorado. Farther east, a potent coastal storm system brought gusty winds and heavy rains to parts of the East Coast. Rainfall totals approached one foot near Georgetown and Pawley’s Island, SC while amounts of 7 to 10 inches were scattered across South Carolina and near Whiteville, NC. Totals of 4 to 6 inches were measured at scattered locations from South Florida northward through eastern Massachusetts. Wind gusts reached 60 to 65 mph at several buoys near the North Carolina Coast; Cape Lookout, NC; and Island Beach Park, NJ. In contrast, only a few tenths of an inch, at most, fell across southeast California, most of the Great Basin, the central and northern High Plains, much of the Great Plains, the Great Lakes Region, portions of the Middle and Lower Mississippi Valley, much of the interior Deep South, and the Gulf Coast Region. Drought designations improved by multiple categories in some of the wetter areas across interior Arizona, southern Colorado, and eastern South Carolina while broad areas of 1-category improvement covered the central and southwestern Four Corners Region, The Middle and Lower Ohio Valley and adjacent locations, and portions of the Atlantic Coast from south Florida through southern New England. In contrast, dryness and drought persisted or intensified across large parts of the Deep South away from the Atlantic Coast, the central Gulf Coast Region, the Lower Mississippi Valley, the east-central and south-central Great Plains, and scattered locations across the northern tier of the Lower-48 from Montana through northern New England…
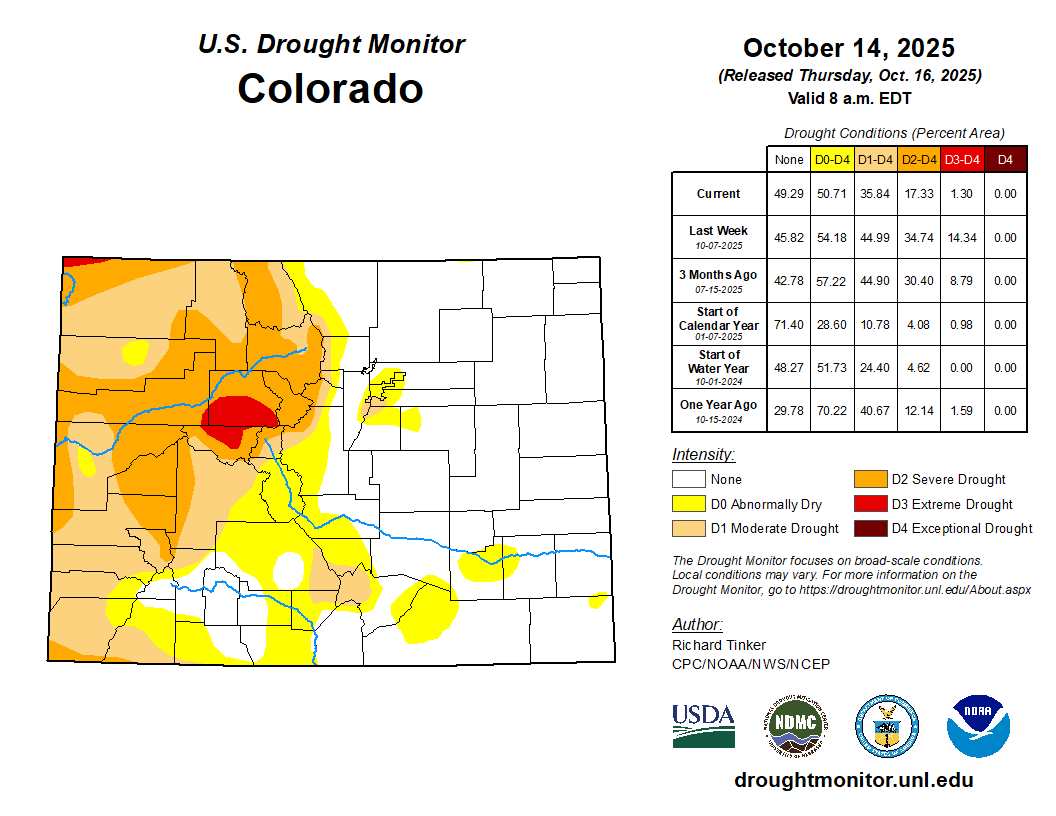
Heavy to excessive precipitation pounded the higher elevations of Colorado. Most areas from west-central through south-central portions of the state received at least 3 inches of precipitation, with much heavier amounts – approaching 8 inches in spots – falling on the higher elevations of south-central Colorado. This precipitation let to widespread improvements, with some of the wetter areas noting 2-category improvements. Elsewhere light to moderate precipitation (generally 0.5 to 1.5 inches) fell on most of the Plains and Wyoming, with amounts over an inch recorded in isolated sections of central Kansas, eastern North Dakota, and westernmost Wyoming. Significant areas of dryness development or deterioration were limited to eastern Kansas and the southern tier of South Dakota…
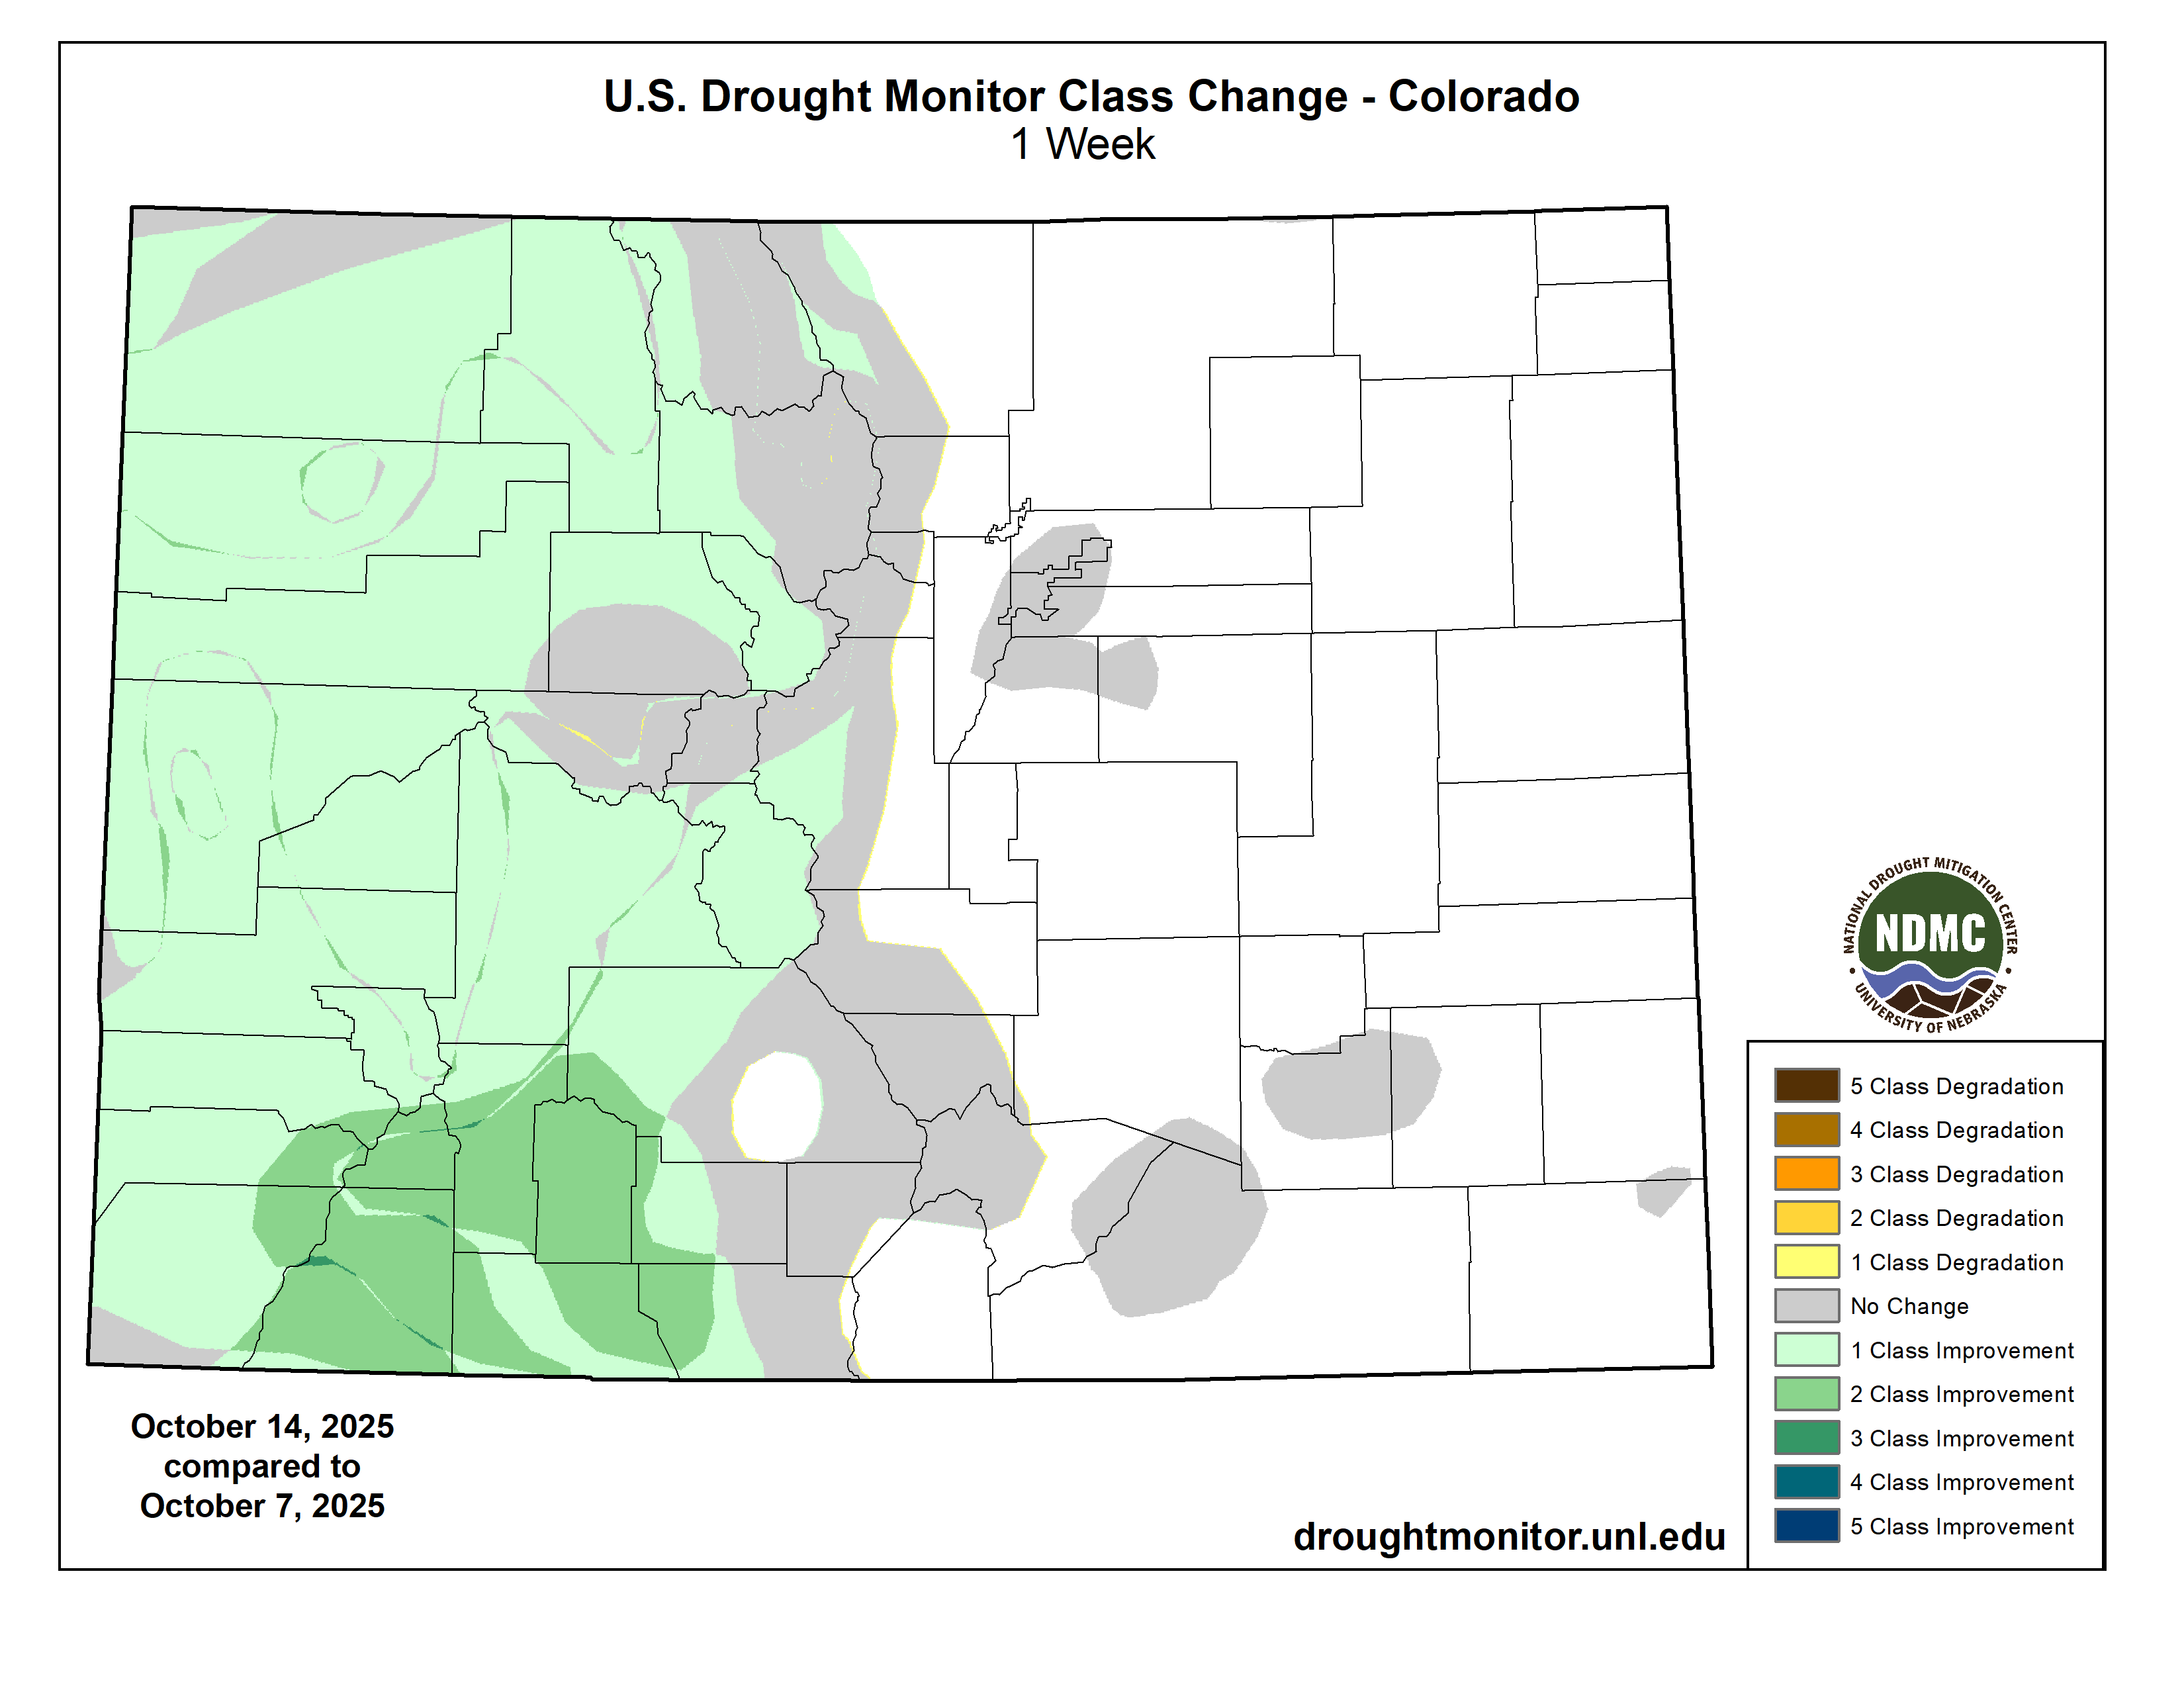
Colorado Drought Monitor one week change map ending October 14, 2025.
Late-season tropical moisture surged into the Four Corners States, bringing heavy to excessive precipitation to large parts of Arizona, western New Mexico, and eastern Utah. Improvement was also noted in scattered areas across central and western Utah, and southwestern Montana. The only areas of deterioration were in north-central and northeastern Montana, where parts of a few counties slid from D0 into moderate drought (D1). In other parts of the West Region, precipitation amounts were nondescript, and dryness and drought were essentially unchanged…
Recent rainfall allowed for some improvement in dryness and drought across western Tennessee, adjacent Mississippi, central Oklahoma, and western Texas. However, deterioration was more common in aggregate across the South Region, with most of northwestern Mississippi, Louisiana, and eastern Oklahoma noting some intensification. There were scattered areas of moderate to locally heavy rainfall, but most of the Region recorded subnormal amounts for the week…
Looking Ahead
During October 15-20, 2025, heavy precipitation (1.5 to 3.0 inches) is forecast for coastal and windward locations from the Cascades to the Pacific Ocean, across eastern Montana and adjacent North Dakota, along a frontal boundary from the Middle Mississippi Valley through the central tier of the Great Lakes Region, and across scattered locations in northwestern Pennsylvania, the Tennessee Valley, and the Lower Ohio Valley. Moderate amounts of 0.7 to 1.5 inches are anticipated in the remainder of the Pacific Northwest, the higher elevations of the northern Intermountain West, central and northern Wyoming, the northern tier of the Plains, parts of the central Great Plains, most areas from the southeastern Great Plains through the Gulf Coast Region, the interior Deep South, most of the Ohio Valley, the lower Northeast, and southern New England. Meanwhile, a few tenths of an inch at most are expected across the South Atlantic Region, most of the southern half of the Plains, and the southwestern quarter of the Lower-48. Temperatures should average generally below-normal from the Rockies westward, and above-normal from the Plains to the Atlantic Coast. Daily highs are expected to average 4 to 5 deg. F below normal from southeastern California through southern Idaho and eastern Oregon while readings top out 8 to 11 deg. F above normal on average across central and southern Texas and most of Maine.
The Climate Prediction Center’s 6-10 day outlook valid for October 21-25 favors heavier than normal precipitation across central and northern California, northwestern Nevada, and the Pacific Northwest. Chances for totals in the top one-third of historical occurrences exceed 60 percent west of the Cascades. Wetter than normal conditions are nominally favored across Hawaii, most of Alaska, southern sections of the Rockies and High Plains, central and western Texas, and from the Great Lakes through much of the mid-Atlantic Region and Northeast. Subnormal precipitation is more likely across central and northern sections of the Rockies and Great Plains as well as parts of the South Atlantic Region. Warmer than normal weather is expected from the northern Intermountain West to the Appalachians, plus much of the South Atlantic and Northeast. Southern Texas and most of Maine are most likely to experience warmer than normal weather. Unusually warm weather is also favored across the eastern half of Mainland Alaska and across Hawaii. Temperatures are expected to average closer to normal from the Rockies through the West Coast and across the Carolinas and Virginias. The central tier of Alaska is also expected to average near normal while subnormal temperatures are nominally favored across western Mainland Alaska.
US Drought Monitor one week change map ending October 14, 2025.
Wonk warning: I’ll be explicating the chart above. If this sort of thing bores you, or just gets you more, not less confused about what’s going on with the river today as the negotiators for post-2026 system management continue to negotiate with a November 11 deadline, then I’d say take a break until next post, when I’m going to try to explain why I call this stuff ‘Romancing the River.’
For those reading on here, remember my purpose from earlier posts: to show a reasonably equitable division of the consumptive use of the Colorado River waters among the seven states and Mexico, with no ‘temporary’ division into competitive Upper and Lower Basins – the Compact they really wanted to do in 1922. I present the table above as just a draft effort in that direction; there will be arguments about some of the specific figures, but the method to the madness might have some merit.
All the consumptive use information is from Bureau of Reclamation records accessible online, or from other cited historical documents going back to the 1922 Compact. The Bureau publishes consumptive use records every five years – eventually. (Figures for 2016-2020, for example, still have ‘Coming soon!’ where one would click to get them.) All quantities are expressed in millions of acre-feet (maf) or thousands (kaf).
To just jump into it, here’s a column-by-column explication of the chart. I suggest clicking on the image above to get an enlargable view of the table. If nothing else, this table is kind of a history-in-numbers of the Colorado River in the 20th century CE. (It is important to remember too that, thanks to the 1952 McCarran Amendment, all the Indian tribal rights are negotiated intrastate, although suits and appeals go to the federal courts – a separate set of challenges from what the seven states are trying to negotiate right now.)
Column 1, River Users: I make no reference to the Upper and Lower Basin, but it does make sense to distinguish between the ‘hot desert’ states below the canyon region, and the ‘cold (orographic) desert’ states above the canyons, due to the significant difference in system losses – evaporation, transpiration, bank and aquifer storage and other losses. We will start with some analysis of those lines in the table, one for each set of desert states (considerably higher for the subtropical ‘hot desert’ region than the higher and cooler ‘cold (or steppe) desert’ region.
System Losses, Structural Deficit and Surpluses: These constitute the river’s wild card. Natural system losses were listed in the paragraph above – all the natural things that happen to water mixed with sun, wind and thirsty ground. Storage reservoirs are built on snowmelt rivers to increase the amount of water available for use through a longer period of time, storing the two-month snowmelt flood for use through the rest of the year. But increasing in reservoirs the amount of water available for use does not increase the amount of water; in fact, it decreases that, as the stored water spreads out in reservoirs under a desert sun that can evaporate annually as much as six acre-feet per acre off of open water in the lower Colorado River.
This was completely ignored in the Colorado River Compact, despite the fact, that as Eric Kuhn and John Fleck pointed out in their book Science Be Dammed, there were scientists who tried to advise the commissioners. Today, with two huge reservoirs, another half dozen big reservoirs and a lot of little ones, along with around 600 miles of large open aqueducts meandering through the hot deserts, somewhere between 12 and 16 percent of the river is lost to the system under the sun and wind.
The compact commissioners, thinking they had an 18 maf river, believed that evaporation would be covered by the surplus they anticipated above and beyond the quantities consumed by the seven states and Mexico. That was actually the case, well into the 1980s. But as more users materialized in the states above the canyons, and the Central Arizona Project began to draw from the mainstem, the ‘structural deficit’ from ignoring the system losses began to draw down the big reservoirs. These natural system losses were estimated at around 800,000 af annually from the mainstem for the states below the canyons, and between 400,000 and 500,000 from Powell and the other Colorado River Storage Project reservoirs.
Another element in the structural deficit was consistent provision for Mexico’s treaty allotment of 1.5 maf per year. The compact made the Upper and Lower Basin each responsible for half of whatever portion of that allotment which was not covered by surplus flow (up to 750 kaf). Beginning in 1971, however, under a 1970 reservoir management agreement, the Bureau began releasing the Upper Basin’s full half of the 1.5 maf each year, whether it was a ‘surplus year’ or not. A similar arrangement was not made for the Lower Basin share of the Mexican allotment; the Bureau apparently has just continued to charge it to ‘surplus’ – along with the Lower Basin’s system losses – whether or not there was actually that much surplus. These ‘structural deficits’ were almost as responsible for the big 21st-century reservoir drawdown as was the ‘millennial drought.’ A figure of around 2 maf was established for these natural and cultural commitments: 1.5 maf for the ‘hot desert’ states, 1.2 maf for the ‘cold desert’ states – those states having consistently delivered their 750 kaf share for Mexico (leaving the 450 kaf in the table). The three states below the canyons have apparently agreed to accept responsibility for their 1.5 maf after 2026, although they are not saying much yet about how that consumption will be divided up.
Back now to the columns.Column 2, Authorized Allotments: These are based on the 18 million acre-feet (maf) river we all believed we were working with back in the 1920s. The Colorado River Compact allotted 7.5 maf to each of its Basins. The Boulder Canyon Project Act made the Bureau water-master for the Lower Basin states, and set their individual allotments, contested by Arizona but confirmed by the U.S. Supreme Court in the last Arizona v. California case (BCPA/SC). The Mexican allotment was set by the 1944 two-rivers treaty. And in 1948, the four Upper Basin states created the Upper Colorado River Compact. Knowing by then that it was not an 18 maf river, they gave themselves percentages ‘of whatever’s left’ (OWL) after compact obligations to the downriver states and their share of the Mexican treaty obligation were fulfilled. This column shows what that ‘% OWL’ would be if those states actually got 7.5 maf regularly. The cold-desert states have never even come close to those figures.
Column 3: This column shows the allotments for the 14.5 maf average of the river’s ‘natural’ flows for the 1930-2000 period, the period when all of the river’s major development took place. All of the ‘averaging’ fell on the states above the canyons. Allotments for Mexico and the three states below the canyons were legally and physically ‘set in concrete’ at 9 maf – legally by the Supreme Court affirmation of the BCPA allotments, and physically by the two big linked reservoirs, Mead and Powell. The four states above the canyons took their floating percentages from what nature provided, or didn’t – estimated natural flows for that period ranged between 5 and 24 maf. The average ‘of whatever’s left’ (OWL) after the obligatory quantity was sent to the states below the canyon and Mexico was assumed to range between 5 and 6 maf – if no attention was paid to the structural deficit and system losses. And for most of that period, there were no worries there; the states above the canyon were not using that much water until the substantial transmountain diversions (100 percent depletions) were completed. The table figures for those states (unlike the figures for the states below the canyons) amounted to wishful thinking for a future that will never happen.
Column 4 gets real: a compilation of three columns with five-year consumptive use averages for three periods, covering the time when the physical development of the river storage and delivery systems was being completed, and consumptive use of the river was approaching full development too – but just on the edge of the trauma of the ‘millennial drought’ (which may last for a millennium) and the near-collapse of the storage system. The attempt at normal distribution for the 2001-2005 period might be considered just beyond that edge – like the roadrunner cartoons, when Wiley Coyote runs a few yards into the air beyond a cliff – then looks down…. These dates are bookended by two ‘reservoir coordination’ elements in the ‘Law of the River’: the 1970 ‘Criteria for the Coordinated Long-range Operation of Colorado River Reservoirs’ and the 2007 ‘Interim Guidelines’ for coordinated operation of the Powell and Mead Reservoirs, set to expire next year.
The Bureau’s five-year compilation tables include, for the first time maybe, the system losses/structural deficit.
Something worth noting: California’s consumptive use during this 35-year period started well above the state’s 4.4 maf compact allotment, and then declined, while uses for all the other states were increasing. This is because California’s major users had decided, before Hoover Dam was even started, that they would ‘borrow’ 800,000 af of unused Upper Basin water until the Upper Basin needed it. They would, in other words, grow on borrowed water. The Bureau of Reclamation allowed this, because they assumed that the Colorado River would eventually be augmented by even greater public works from some larger river basin. Optimism is a sunny thing. On the strength of this, the Metropolitan Water District on the Southern California coast built its 250-mile aqueduct to carry twice the 500,000 af that was their share of California’s 4.4 maf allotment. They began decreasing their ‘borrowed’ usage during this 35-year period, in anticipation of the 2006 California Limitation Act – thanks mostly to the California State Water Project exporting water from Northern California.
Arizona’s jump in usage between 1971-75 and 1991-95 was due to the completion of the Central Arizona Project. To give a more accurate picture of ‘the completed river system,’ only its 1991-95 and 2001-2005 figures were used in compiling Column 5.
Column 5: A compiled average for the three five-year periods – resulting in the 14.5 maf river of 1930-2000.
Column 6: An attempt to divvy up the system losses/structural deficit (SLD) between the seven states and Mexico. My operating assumption is that the ‘hot desert’ states and the ‘cold desert’ states should share these losses proportionally to their consumptive use. This meant creating percentages of the 9.0 maf of decreed use for the four entities below the canyons; the four entities above the canyons were already operating on percentages.
I’m sure the state (guess which one) with a lot of pre-compact ‘senior’ water will object vehemently to this concept, wanting all the junior users to absorb those losses. This is a misapplication of the appropriation doctrine, in my estimation; it was set up for resolving differences among specific users, not for the resolution of major river management issues related to natural phenomena like evaporation and riparian storage, or natural and cultural changes like a warming climate. These issues fall equally on all users, everyone’s fault and responsibility. But such rational and moral arguments will probably not dent California’s resolve of seniority uber alles.
Column 7 just adds those proportionate shares of the system losses/structural deficit to the consumptive use averages for the seven states and Mexico in Column 5, leaving the system losses/structural deficit lines empty. This is not increasing the amount of water for each state; it is increasing the amount of consumption each has to manage. This column, I’m arguing, is the seven-way equitable division of consumptive use that the Compact commissioners wanted to create in 1922, but lacked the information about both the river and their futures to develop. Now, a century later, that future is here, like it or not, and we’re sadder but wiser in knowing the river.
There’s probably an error at the bottom of this column; instead of 0.00 in the ‘Surplus or Drain’ column, it should probably be ‘-2.00 maf’: the difference between the 14.5 maf 20th-century river and the 12.5 maf early 21st-century river. This was the frightening drawdown of the early 21st century decades.
Column 8 then uses the Column 7 figures to calculate what percentage of the 14.5 maf river each of the eight entities ‘owns.’
Column 9 then applies those percentages to the 12.5 maf Colorado River of the 21st century – and subtracts from each state’s total consumption its share of system losses and structural deficit – thus showing what each state will actually have with which to try to do what it is doing today with its presumed allotment for consumptive use of the 14.5 maf river of bygone days. Read it and weep. (Note that I’ve put the 1.5 and 0.45 maf system losses/structural deficit numbers back in Column 9 to remind you that they have not disappeared from the system; they’ve just been re-collated from those portions of the individual states’ total consumptive uses.)
I would welcome comments and criticisms of this work. I do believe it is the kind of pinning down of numbers we need to finally do for the Colorado River, if we are going to go into the post-2026 era with our eyes open. ‘Woke,’ you might say.
By my next post, there will probably either be a new management plan for the river in the messy agonies of birthing – or there won’t. If there is, I would wager a six-pack that they will drag along the old two-basin cold-war division. And I’d wager further that the ratio of total consumptive use for the four ‘states’ below the canyons to the four states above the canyons will be between within a few points either way of 70-30. Is that ‘equitable’? Given the amount and productivity of land under cultivation, and the number of people gathered in large metropolitan ganglia, and the location of most of the Indian nations, it probably is. But – it’ll probably be another point of discussion.
Map of the Colorado River drainage basin, created using USGS data. By Shannon1 Creative Commons Attribution-Share Alike 4.0
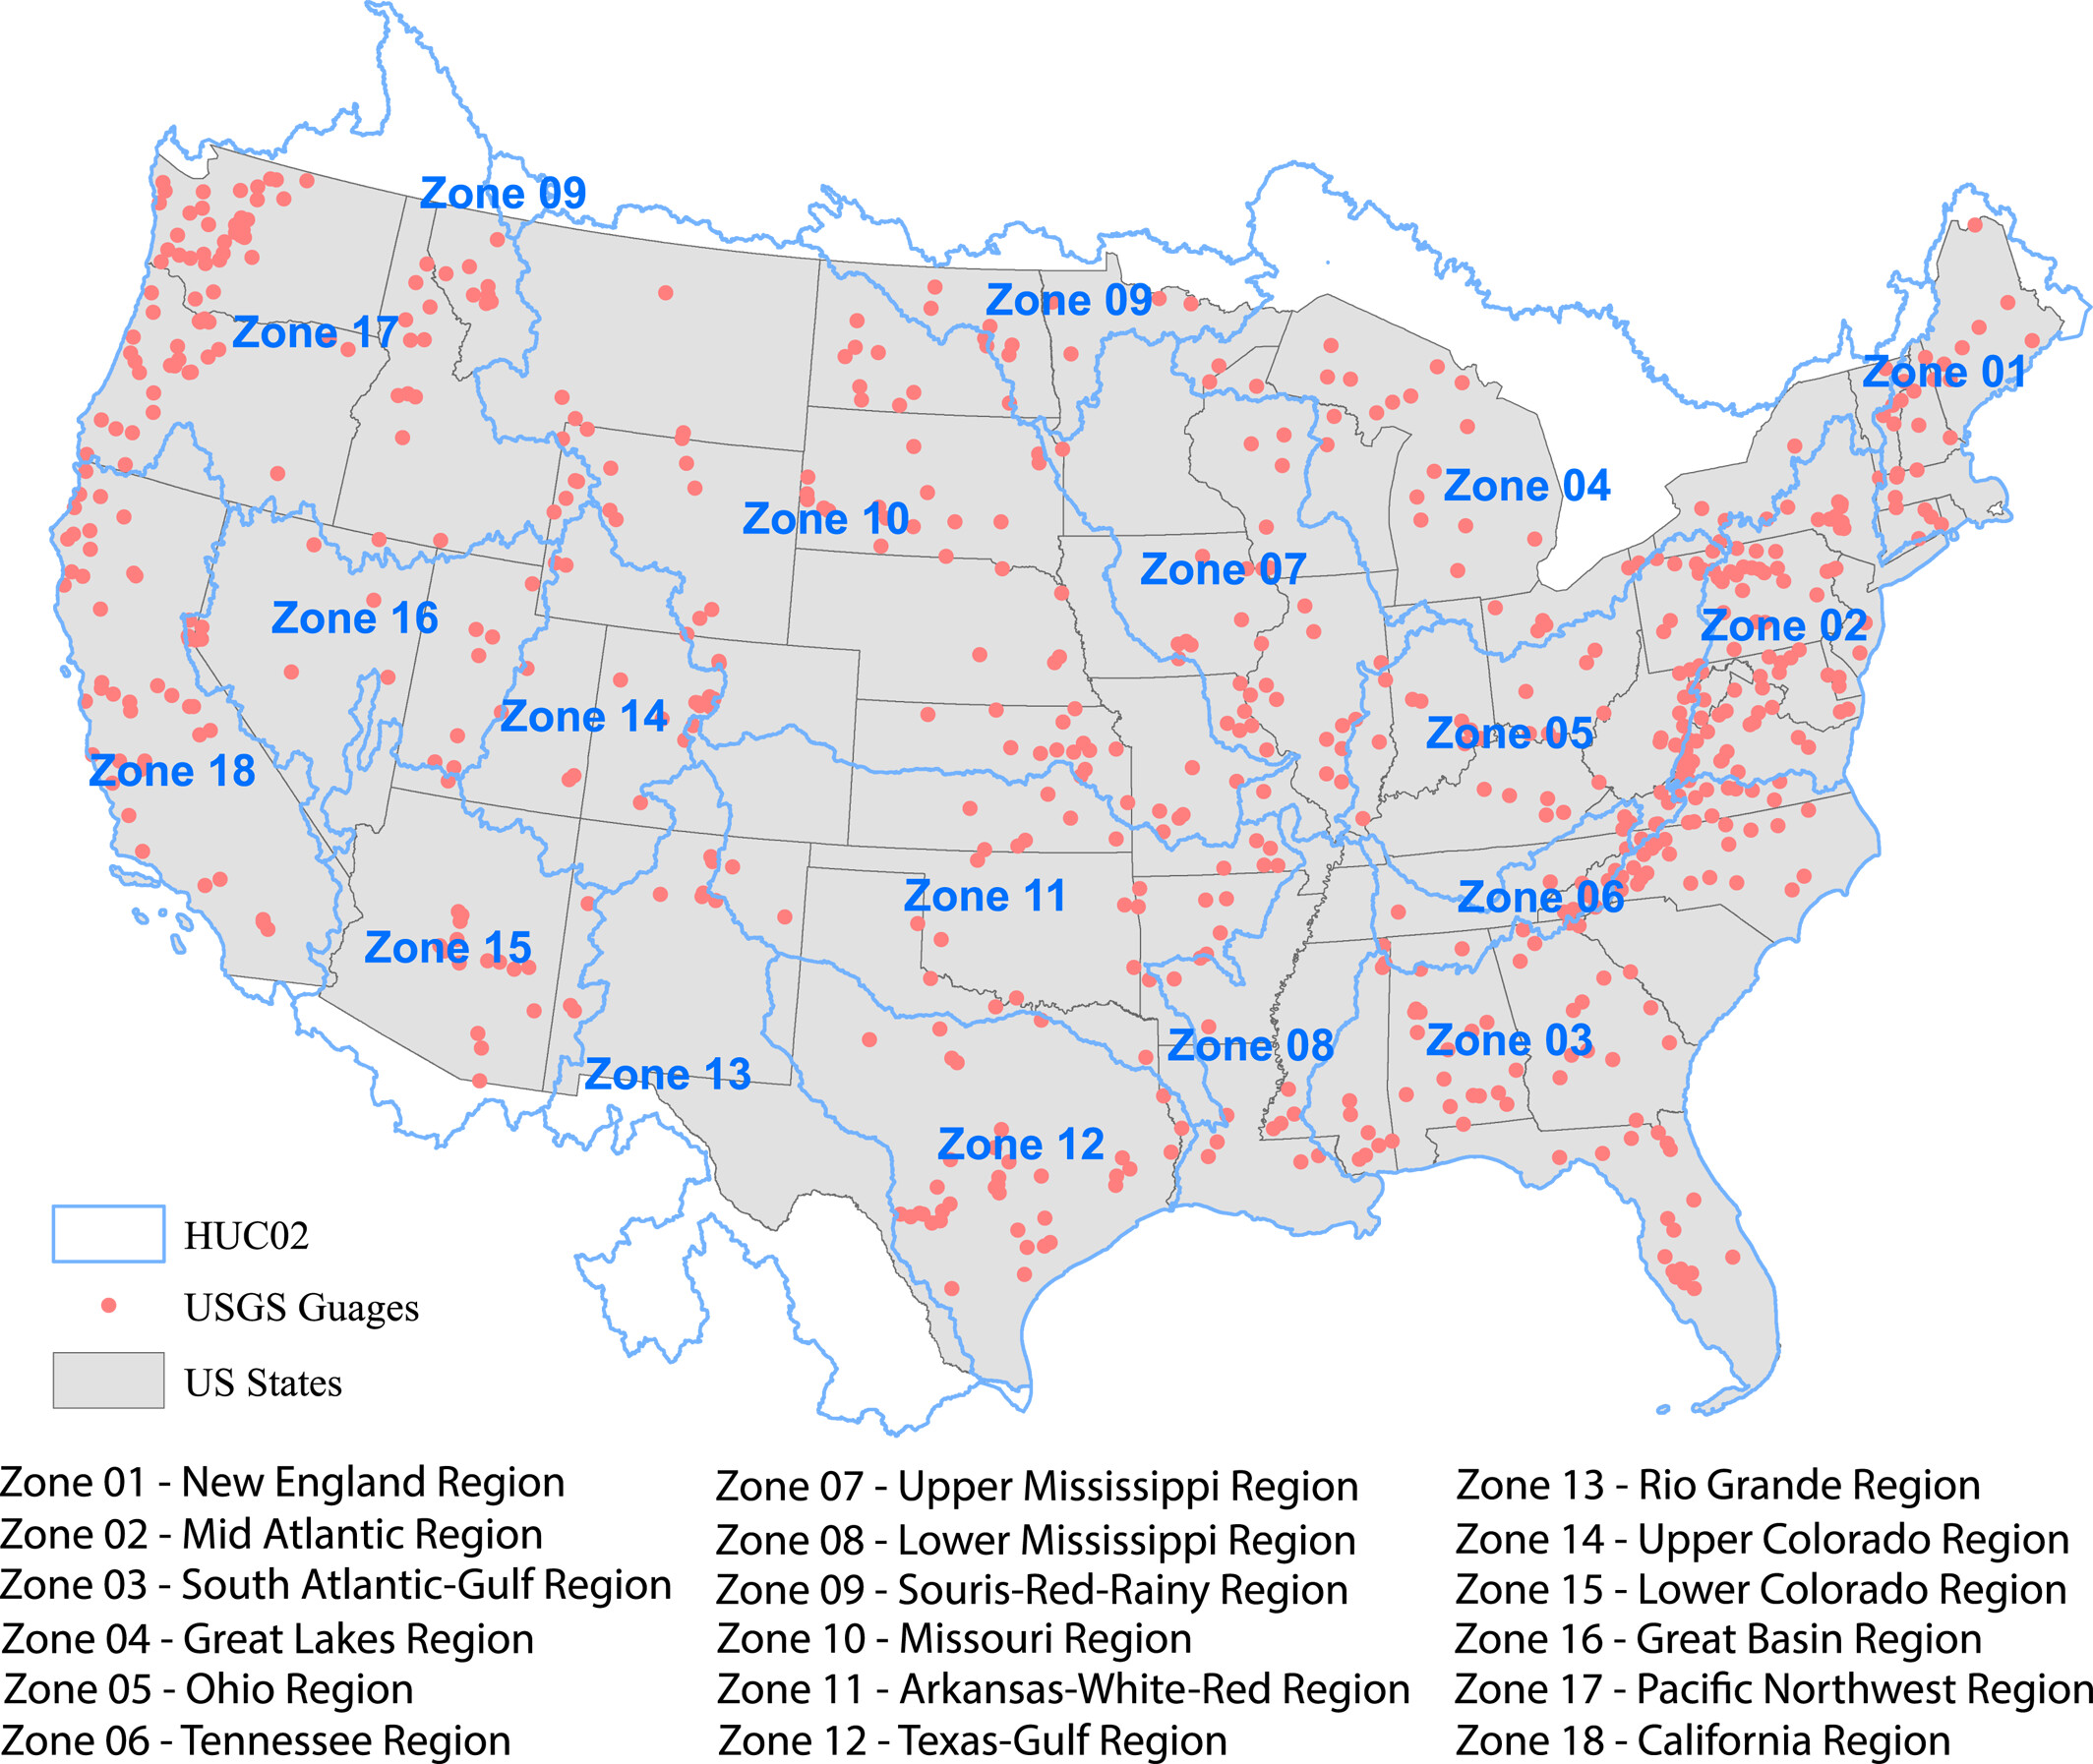
Overview of the 18 CAMELS HUC2 basins (or zone) across CONUS.
Click the link to access the article on the AGU website (Sadegh Sadeghi Tabas, Vidya Samadi, Catherine Wilson, Biswa Bhattacharya). Here’s the abstract:
September 22, 2025
As Deep Neural Networks (DNNs) are being increasingly employed to make important simulations in rainfall-runoff contexts, the demand for interpretability is increasing in the hydrology community. Interpretability is not just a scientific question, but rather knowing where the models fall flat, how to fix them, and how to explain their outcomes to scientific communities so that everyone understands how the model arrives at specific simulations This paper addresses these challenges by deciphering interpretable probabilistic DNNs utilizing the Deep Autoregressive Recurrent (DeepAR) and Temporal Fusion Transformer (TFT) for daily streamflow simulation across the continental United States (CONUS). We benchmarked TFT and DeepAR against conceptual to physics-based hydrologic models. In this setting, catchment physical attributes were incorporated into the training process to create physics-guided TFT and DeepAR configurations. Our proposed physics-guided configurations are also designed to aggregate the patterns across the entire data set, analyze the sensitivity of key catchment physical attributes and facilitate the interpretability of temporal dynamics in rainfall-runoff generation mechanisms. To assess the uncertainty, the modeling configurations were coupled with a quantile regression by adding Gaussian noise with increasing standard deviation to the individual catchment attributes. Analysis suggested that the physics-guided TFT was superior in predicting daily streamflow compared to the original TFT and DeepAR as well as benchmark hydrologic models. Predictive uncertainty intervals effectively bracketed most of the observational data by simultaneous simulation of various percentiles (e.g., 10th, 50th, and 90th). Interpretable physics-guided TFT proved to be a strong candidate for CONUS daily streamflow simulations. [ed. emphasis mine]
Created by Imgur user Fejetlenfej , a geographer and GIS analyst with a ‘lifelong passion for beautiful maps.’ It highlights the massive expanse of river basins across the country – in particular, those which feed the Mississippi River, in pink.
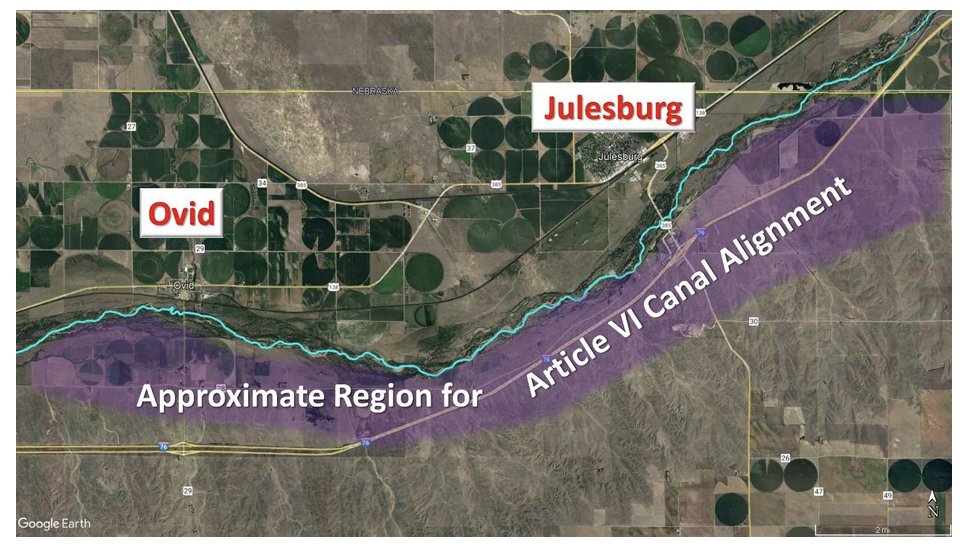
Perkins canal drawing showing the Colorado portion, courtesy Nebraska Department of Natural Resources.
Here’s the release from Governor Polis’ office (Lawrence Pacheco and Shelby Wieman):
October 15, 2025
Governor Jared Polis and Attorney General Phil Weiser today urged the U.S. Supreme Court to reject a case about the South Platte River Compact and Nebraska’s efforts to build the Perkins County Canal. Colorado is complying with its obligations under the compact and not obstructing Nebraska’s efforts to build the canal, so there is nothing for the court to review at this time, according to a brief filed with the court.
The South Platte River originates in Colorado and supplies water for the state’s biggest cities and some of its most productive agricultural lands. The river starts in the Rocky Mountains and winds roughly 380 miles northeast into Nebraska. The South Platte River Compact is an agreement between Colorado and Nebraska that establishes the States’ rights and responsibilities to use water in the South Platte.
While Colorado acknowledges Nebraska’s right to build the Perkins County Canal, Nebraska has failed to move forward on the project for over 100 years. Recently, Nebraska officials have taken preliminary steps to plan and permit the project through the U.S. Army Corps of Engineers, but numerous steps lie ahead during which Nebraska, and others who might be affected by the project, will identify potential issues and fully study any impacts.
Nebraska appears to be using the prospect of the canal and this request for Supreme Court action as leverage to renegotiate the South Platte River Compact. Colorado will ensure that Nebraska honors the letter of the Compact, just as Colorado always has.
“Water is the lifeblood of our state. We have always faithfully honored the century-old South Platte Compact and all other water agreements with our downstream neighbor states, and we will continue to do so. We refuse to sit idly by while Nebraska chases a meritless lawsuit that threatens Colorado’s precious water resources, our robust agriculture industry, and our rural communities in Northeastern Colorado,” said Governor Jared Polis.
Attorney General Weiser said Colorado is complying with the compact and not interfering with Nebraska’s efforts to build the canal. As such, Nebraska hasn’t raised any claims ripe for Supreme Court review. Whatever issues arise in the future can be addressed through federal permitting processes or lower courts.
“Nebraska’s claimed violations rely on speculative and premature allegations. To the extent any legal issues arise in the future, there are alternative forums to resolve them. The Supreme Court need not take a case that would put the court and the parties on a long, time-intensive, and expensive path that might well, in the end, put the States right back where they were before Nebraska filed their proposed complaint,” said Attorney General Weiser. “Even if the court decides to take up part or all of Nebraska’s case, I’m confident that we will win on the merits. Both the facts and the law are on our side.”
Nebraska’s claims that Colorado authorizes water uses that harm Nebraska during the irrigation season are not supported by facts. Jason Ullmann, the State Engineer and Director of the Division of Water Resources, said Nebraska has only recently suggested they were concerned that Colorado was not meeting its obligations during the irrigation season.
“For over 100 years the Colorado State Engineer’s Office has worked with Nebraska and performed the hard work of ensuring Colorado meets its compact obligations on the South Platte River. This means we make difficult decisions every day on who receives their water and when based on the priority system and compact terms. As a result, water users in Colorado and Nebraska all receive their allotted share, said Jason Ullmann, State Engineer and Director of the Division of Water Resources “We were surprised and disappointed by Nebraska’s lawsuit and are hopeful once all the briefs are filed that we can resume discussions to meet the mutual needs of both of our States.”
The Supreme Court has original and exclusive jurisdiction over interstate disputes, such as border disputes and water rights. States must file a motion for leave to file a bill of complaint to bring a case to the court. The Supreme Court must still decide whether to accept the case.
The case is Nebraska v. Colorado, case number 220161.