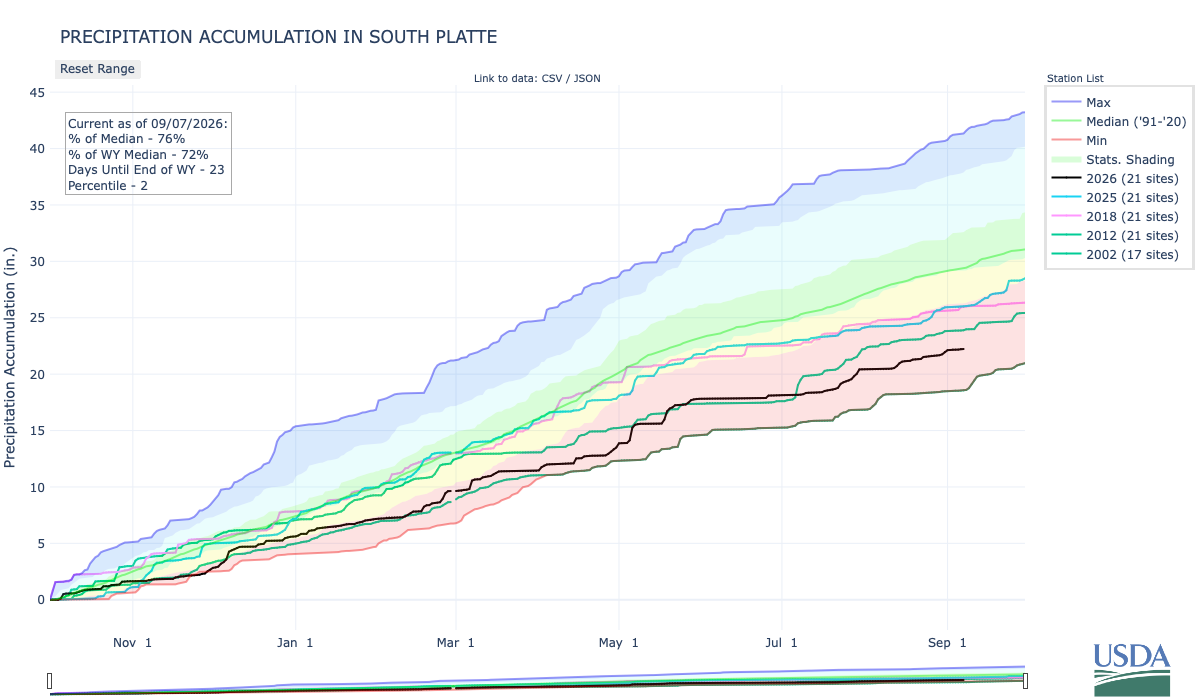
Below is the Precipitation Accumulation in South Platte graph from the NRCS for September 7, 2026. This morning precipitation, at the SNOTEL stations, is at 76% of the median (up 1% one week), and 72% of the water year median (up 1% one week). There are 23 days left in the water year.
There is a slight chance for thunderstorms today, then a chance of showers and thunderstorms Saturday and Sunday in the central and northern mountains. There is a chance for thunderstorms today then a slight chance for showers and thunderstorms Saturday, and a chance for showers and thunderstorms Sunday, down here about 55 miles from Berthoud Pass, where the Berthoud Pass Ditch brings water to Clear Creek from the Fraser River. From Clear Creek County:
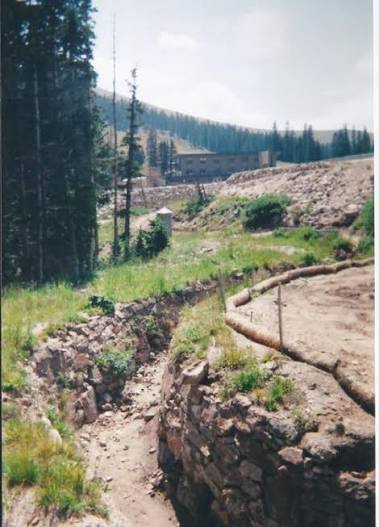
The little stone bridge at the Summit is hard to see, but it is still used both by U.S. Highway 40 and the Berthoud Pass Ditch. When viewed from the north side of the road, and behind the new wetland constructed as part of the U. S. Highway 40 widening project, the bridge can be seen and is the same design as three others on the Grand County side of the Pass. A culvert funnels the water from the Ditch under this bridge and across U.S. Highway 40. The Berthoud Pass Ditch is now owned by the City of Northglenn. The ditch has long been a part of the history of Grand County and Berthoud Pass.

Here’s a look at the 7-Day Colorado precipitation map through September 5, 2026 from the High Plains Regional Climate Center. Precipitation in the South Platte Basin along the Continental Divide of the Americas ranged from 0.10” to 1.20”.

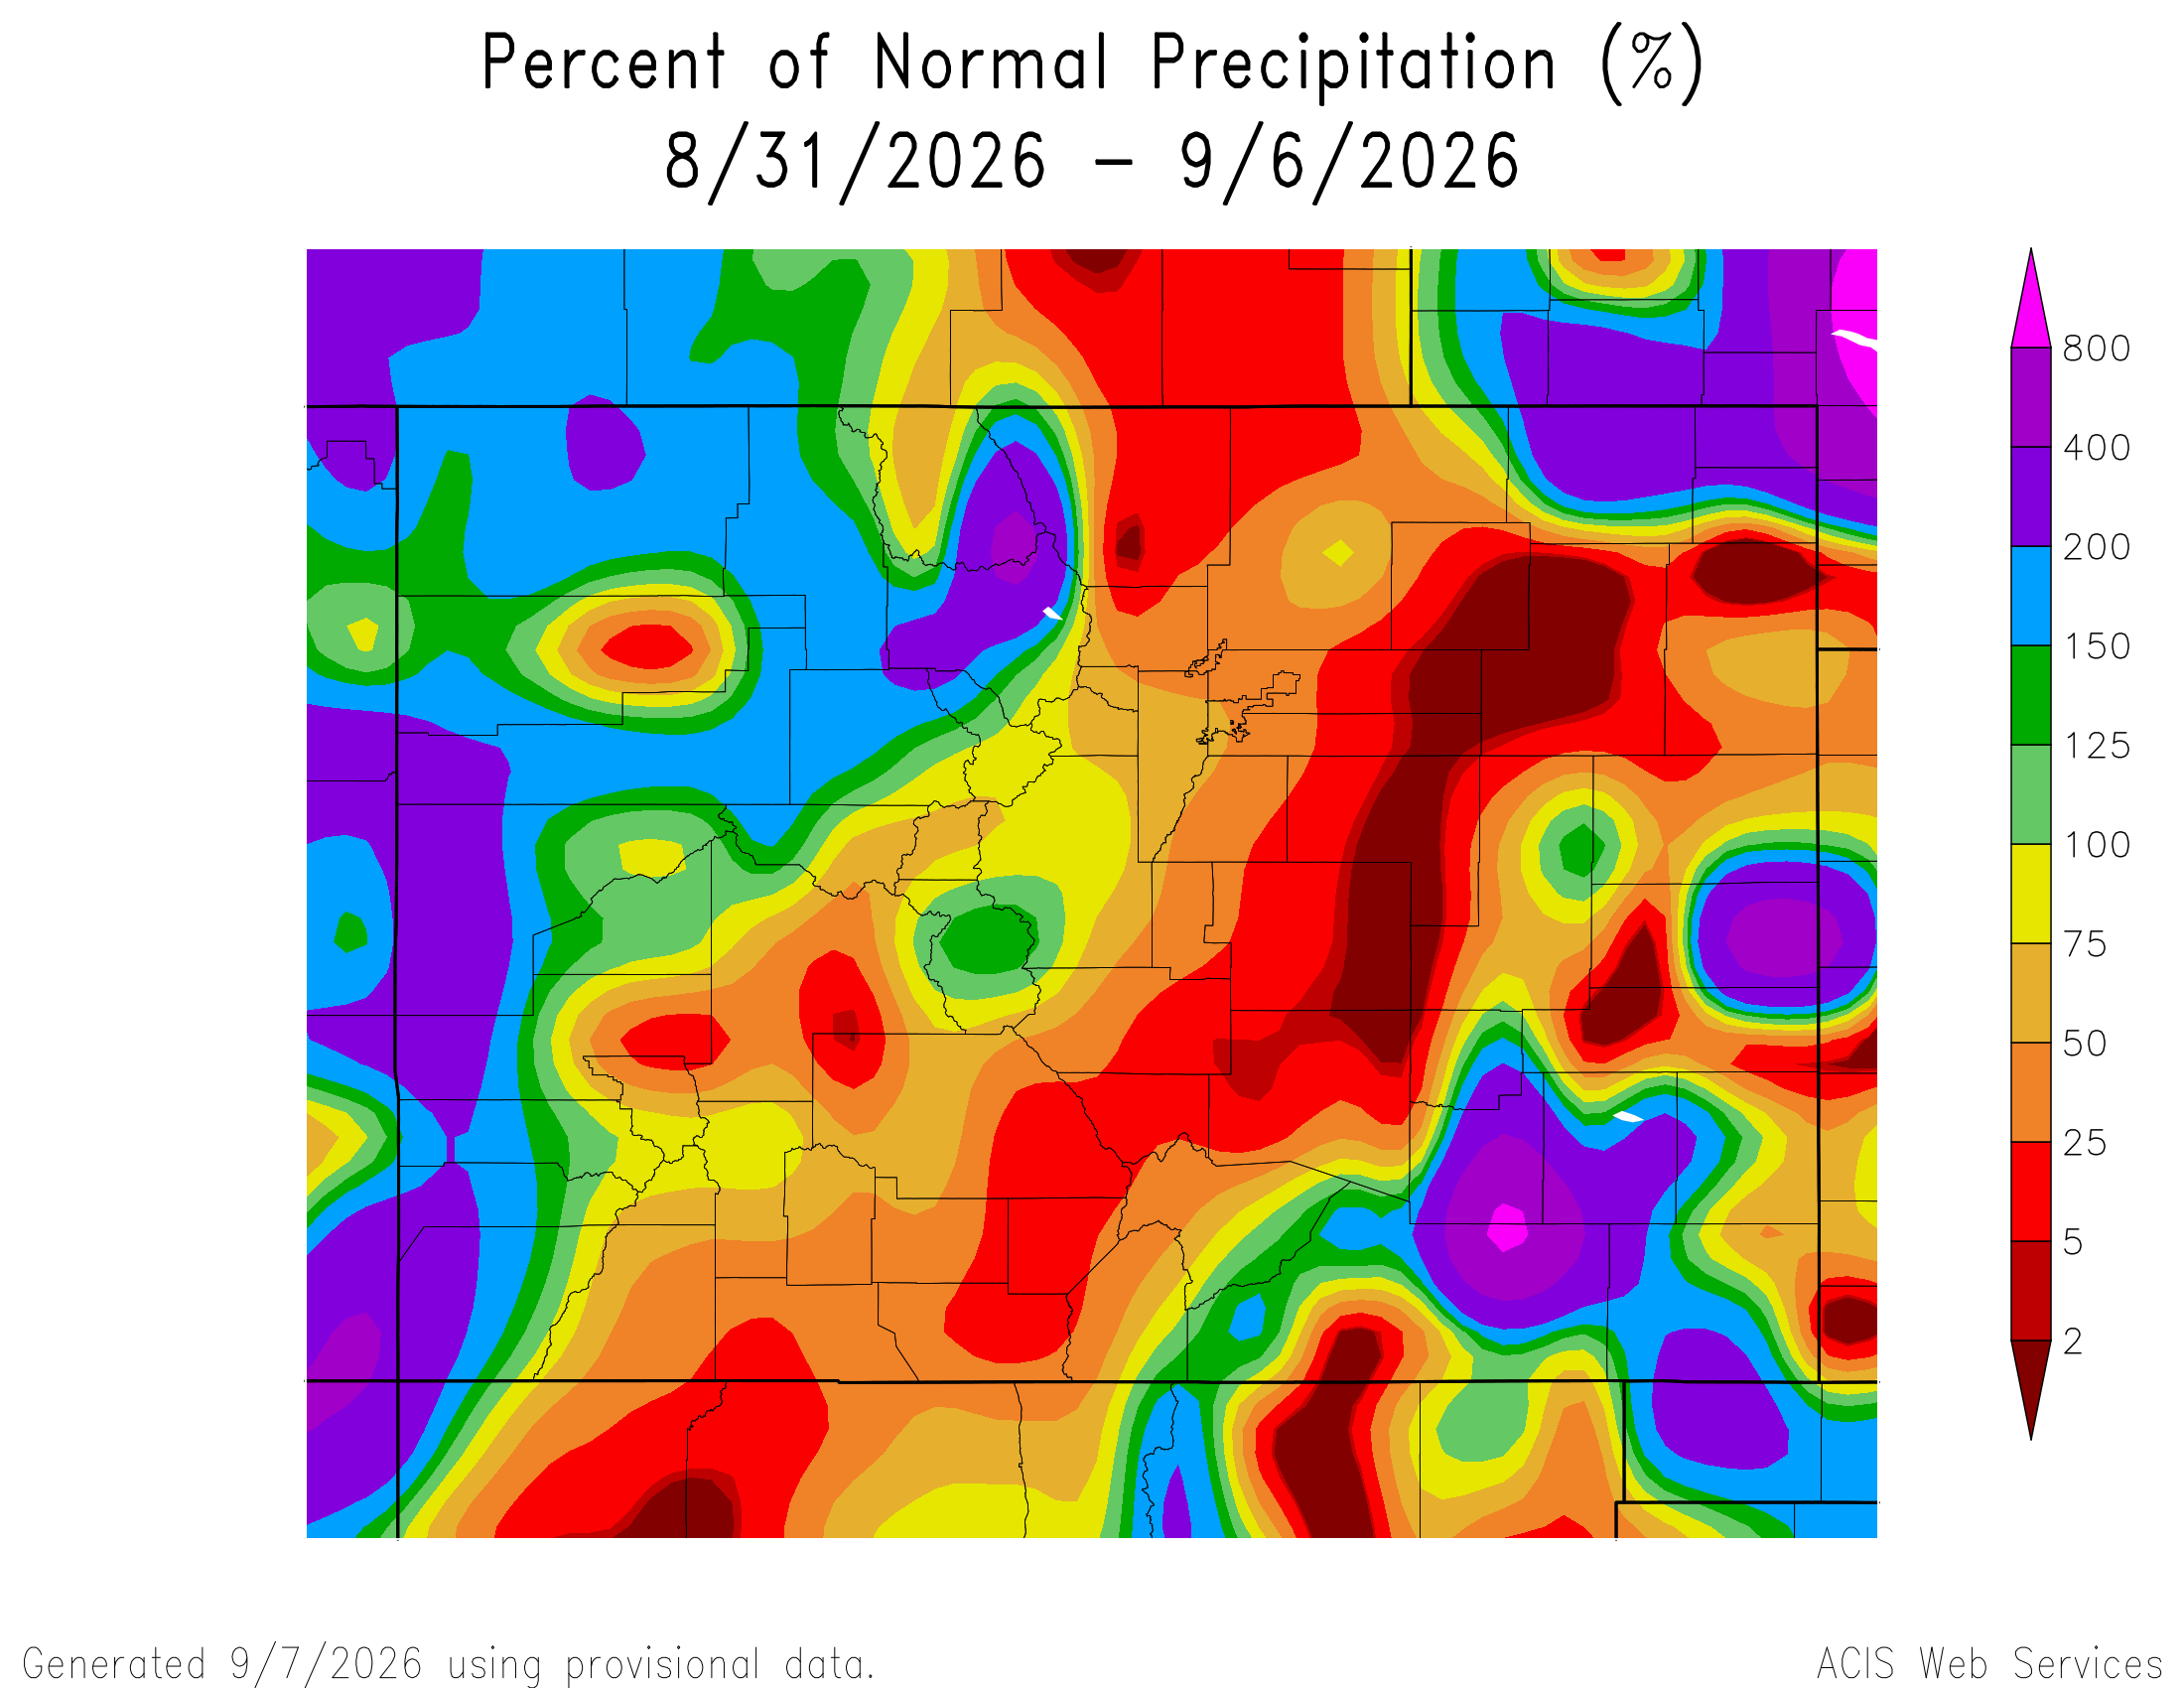
Here’s the 7-Day percent of normal precipitation map through September 6, 2026 from the High Plains Regional Climate Center. Precipitation in the South Platte River Basin along the Continental Divide of the Americas was 25% to 125% of normal.
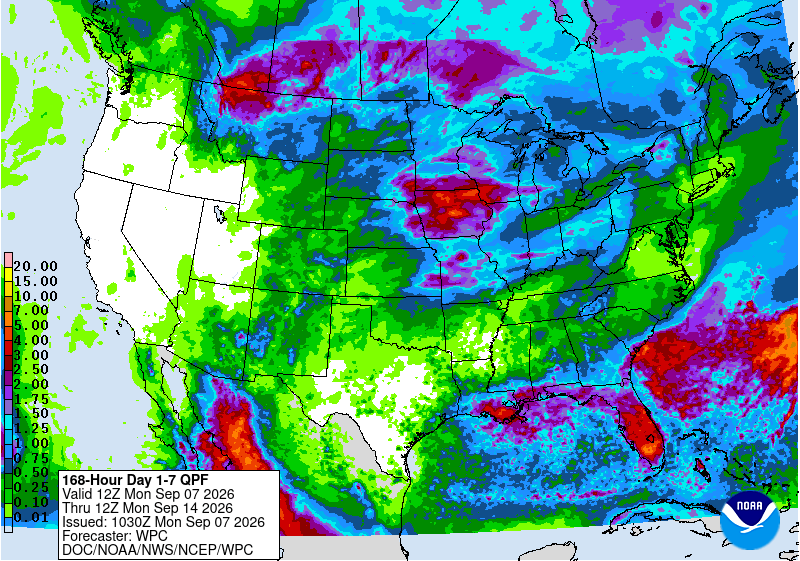
Below is the 7-day Quantitative Precipitation Forecast for the week of September 7, 2026. Precipitation is anticipated for the mountains of the South Platte River Basin and may total up to 0.50″.
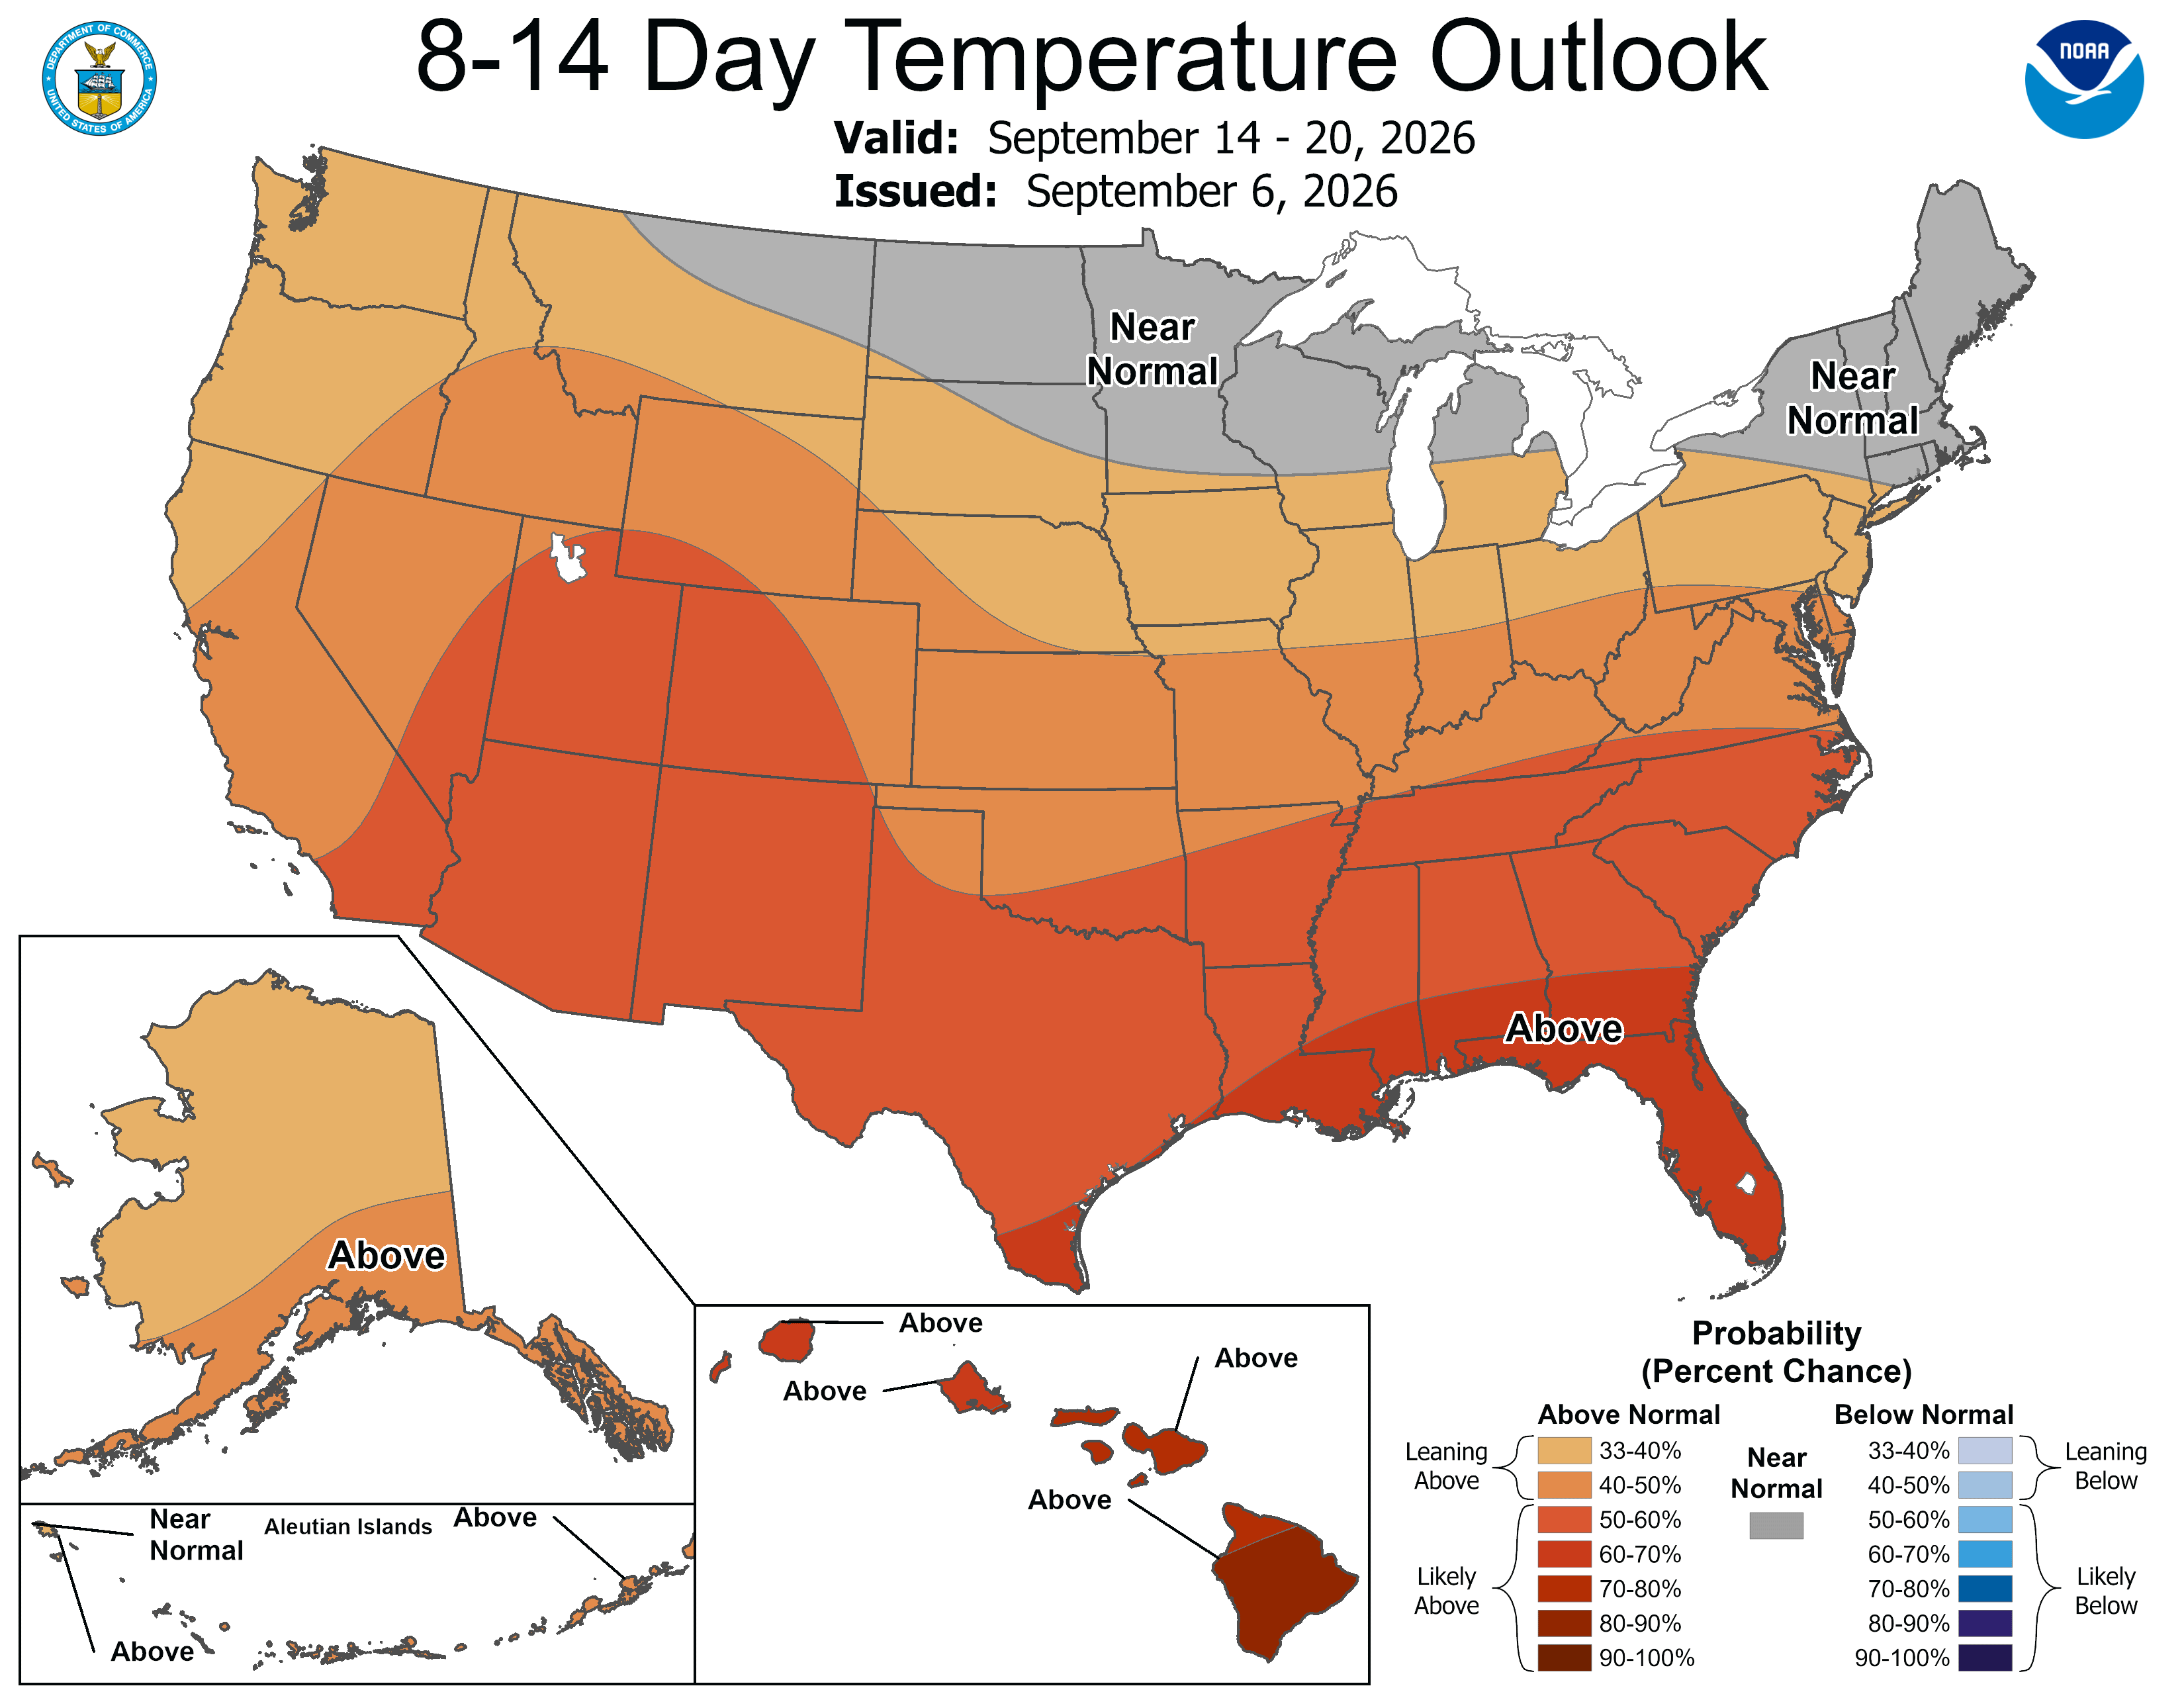
Below are the 8-14 day outlooks from the Climate Prediction Center, issued September 6, 2026, for temperature and precipitation, for the week starting September 14, 2026. The CPC expects above normal temperatures and above normal precipitation for the mountains of the South Platte River Basin.

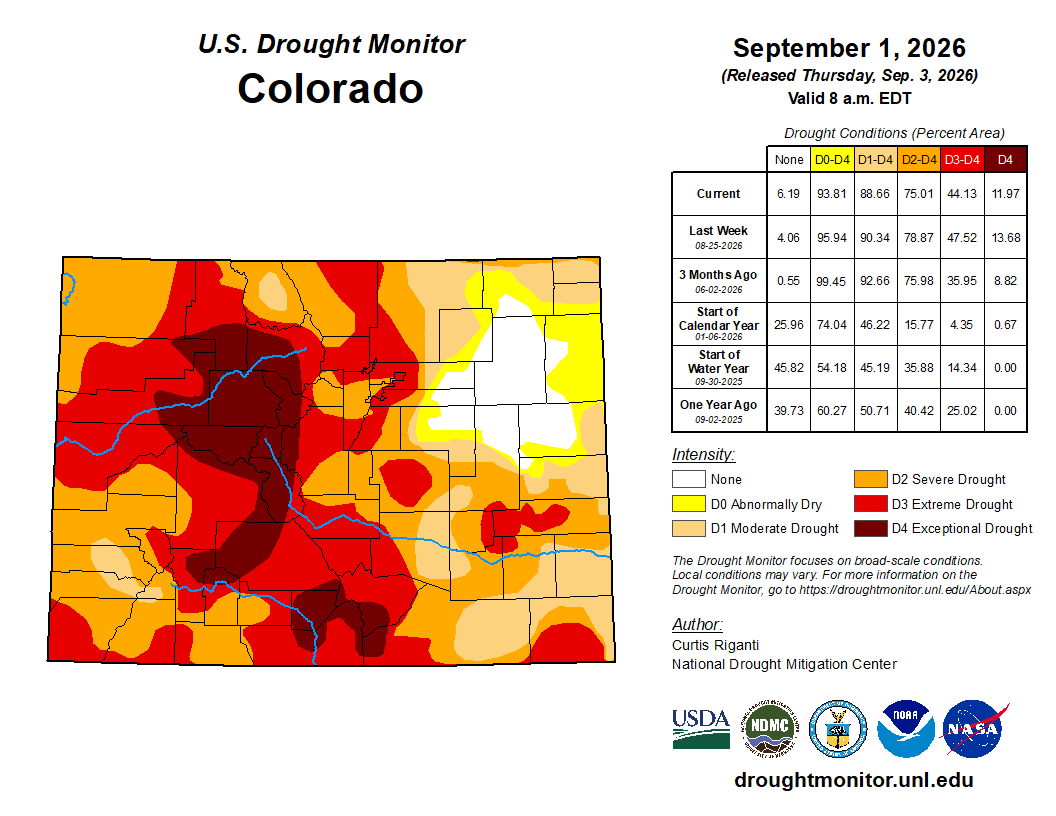
Below is the Colorado Drought Monitor map from September 1, 2026. There were one class improvements in Douglas, Arapahoe, Adams, Morgan, Weld, and Logan counties. Drought and abnormal dryness covers 93.81% of Colorado. The South Platte Basin is experiencing Abnormally Dry, Moderate, Severe, Extreme, and Exceptional drought conditions.
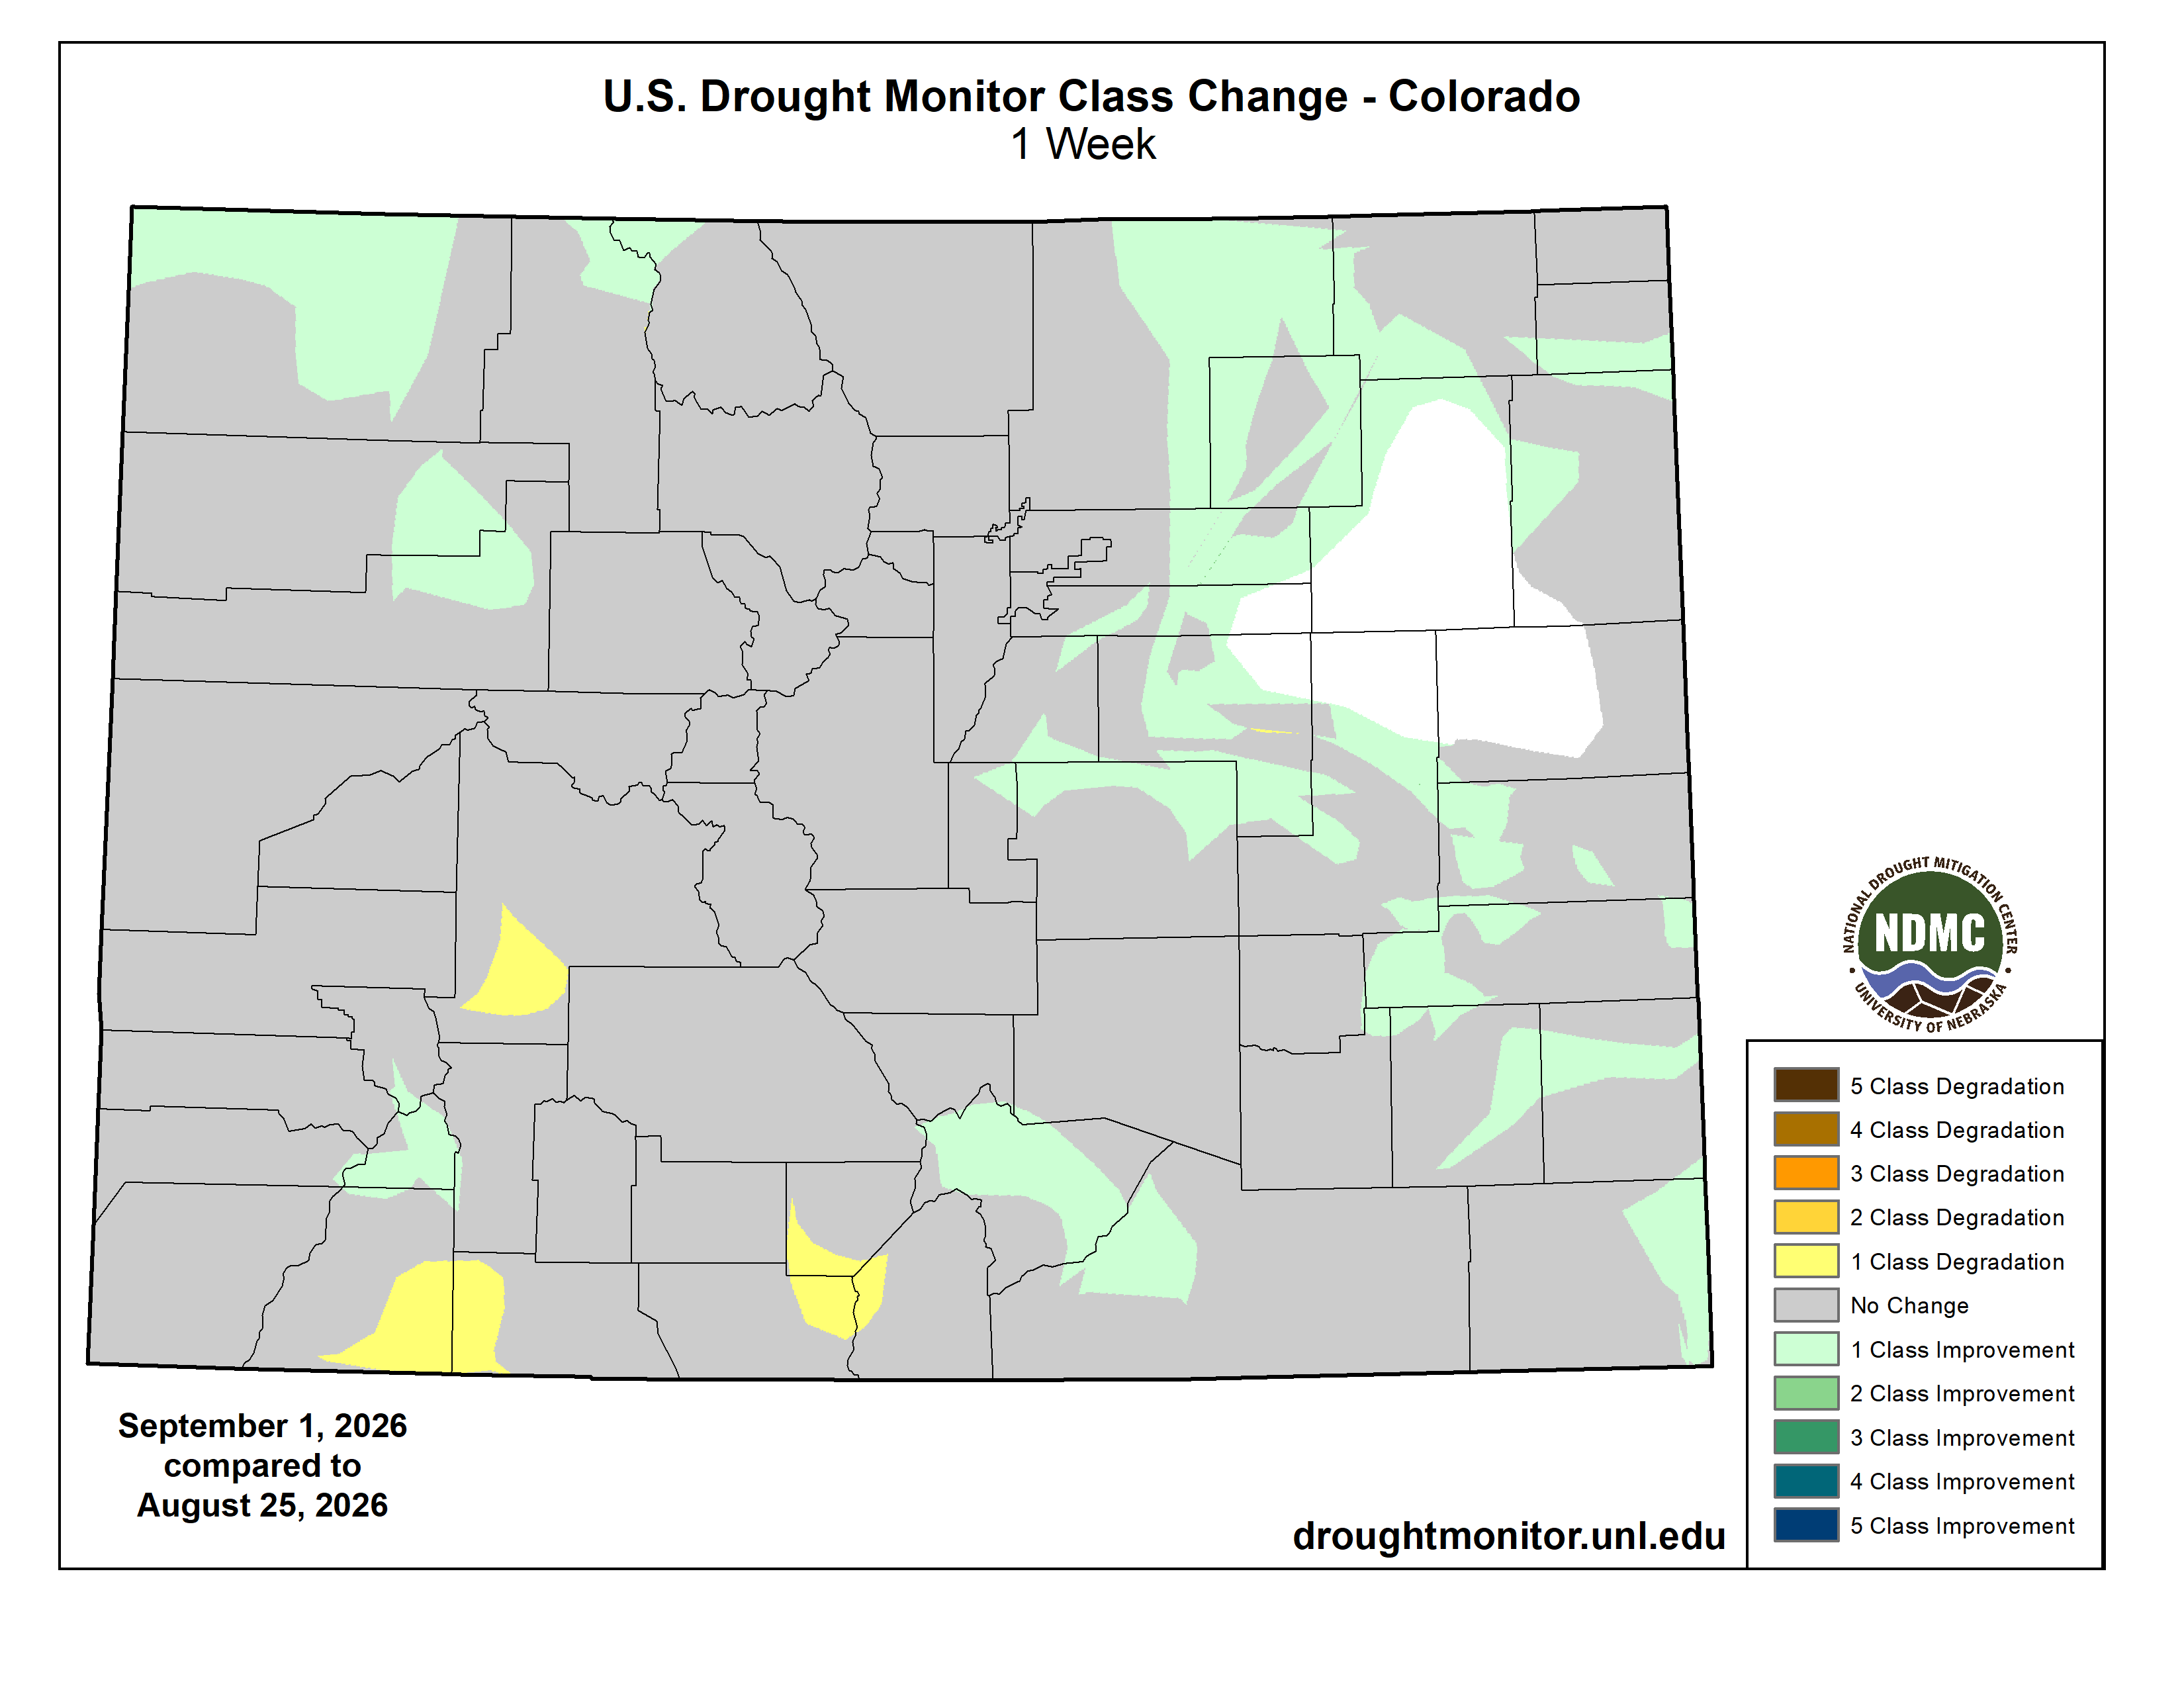
Below is the Colorado Drought Monitor one week change map ending September 1, 2026.
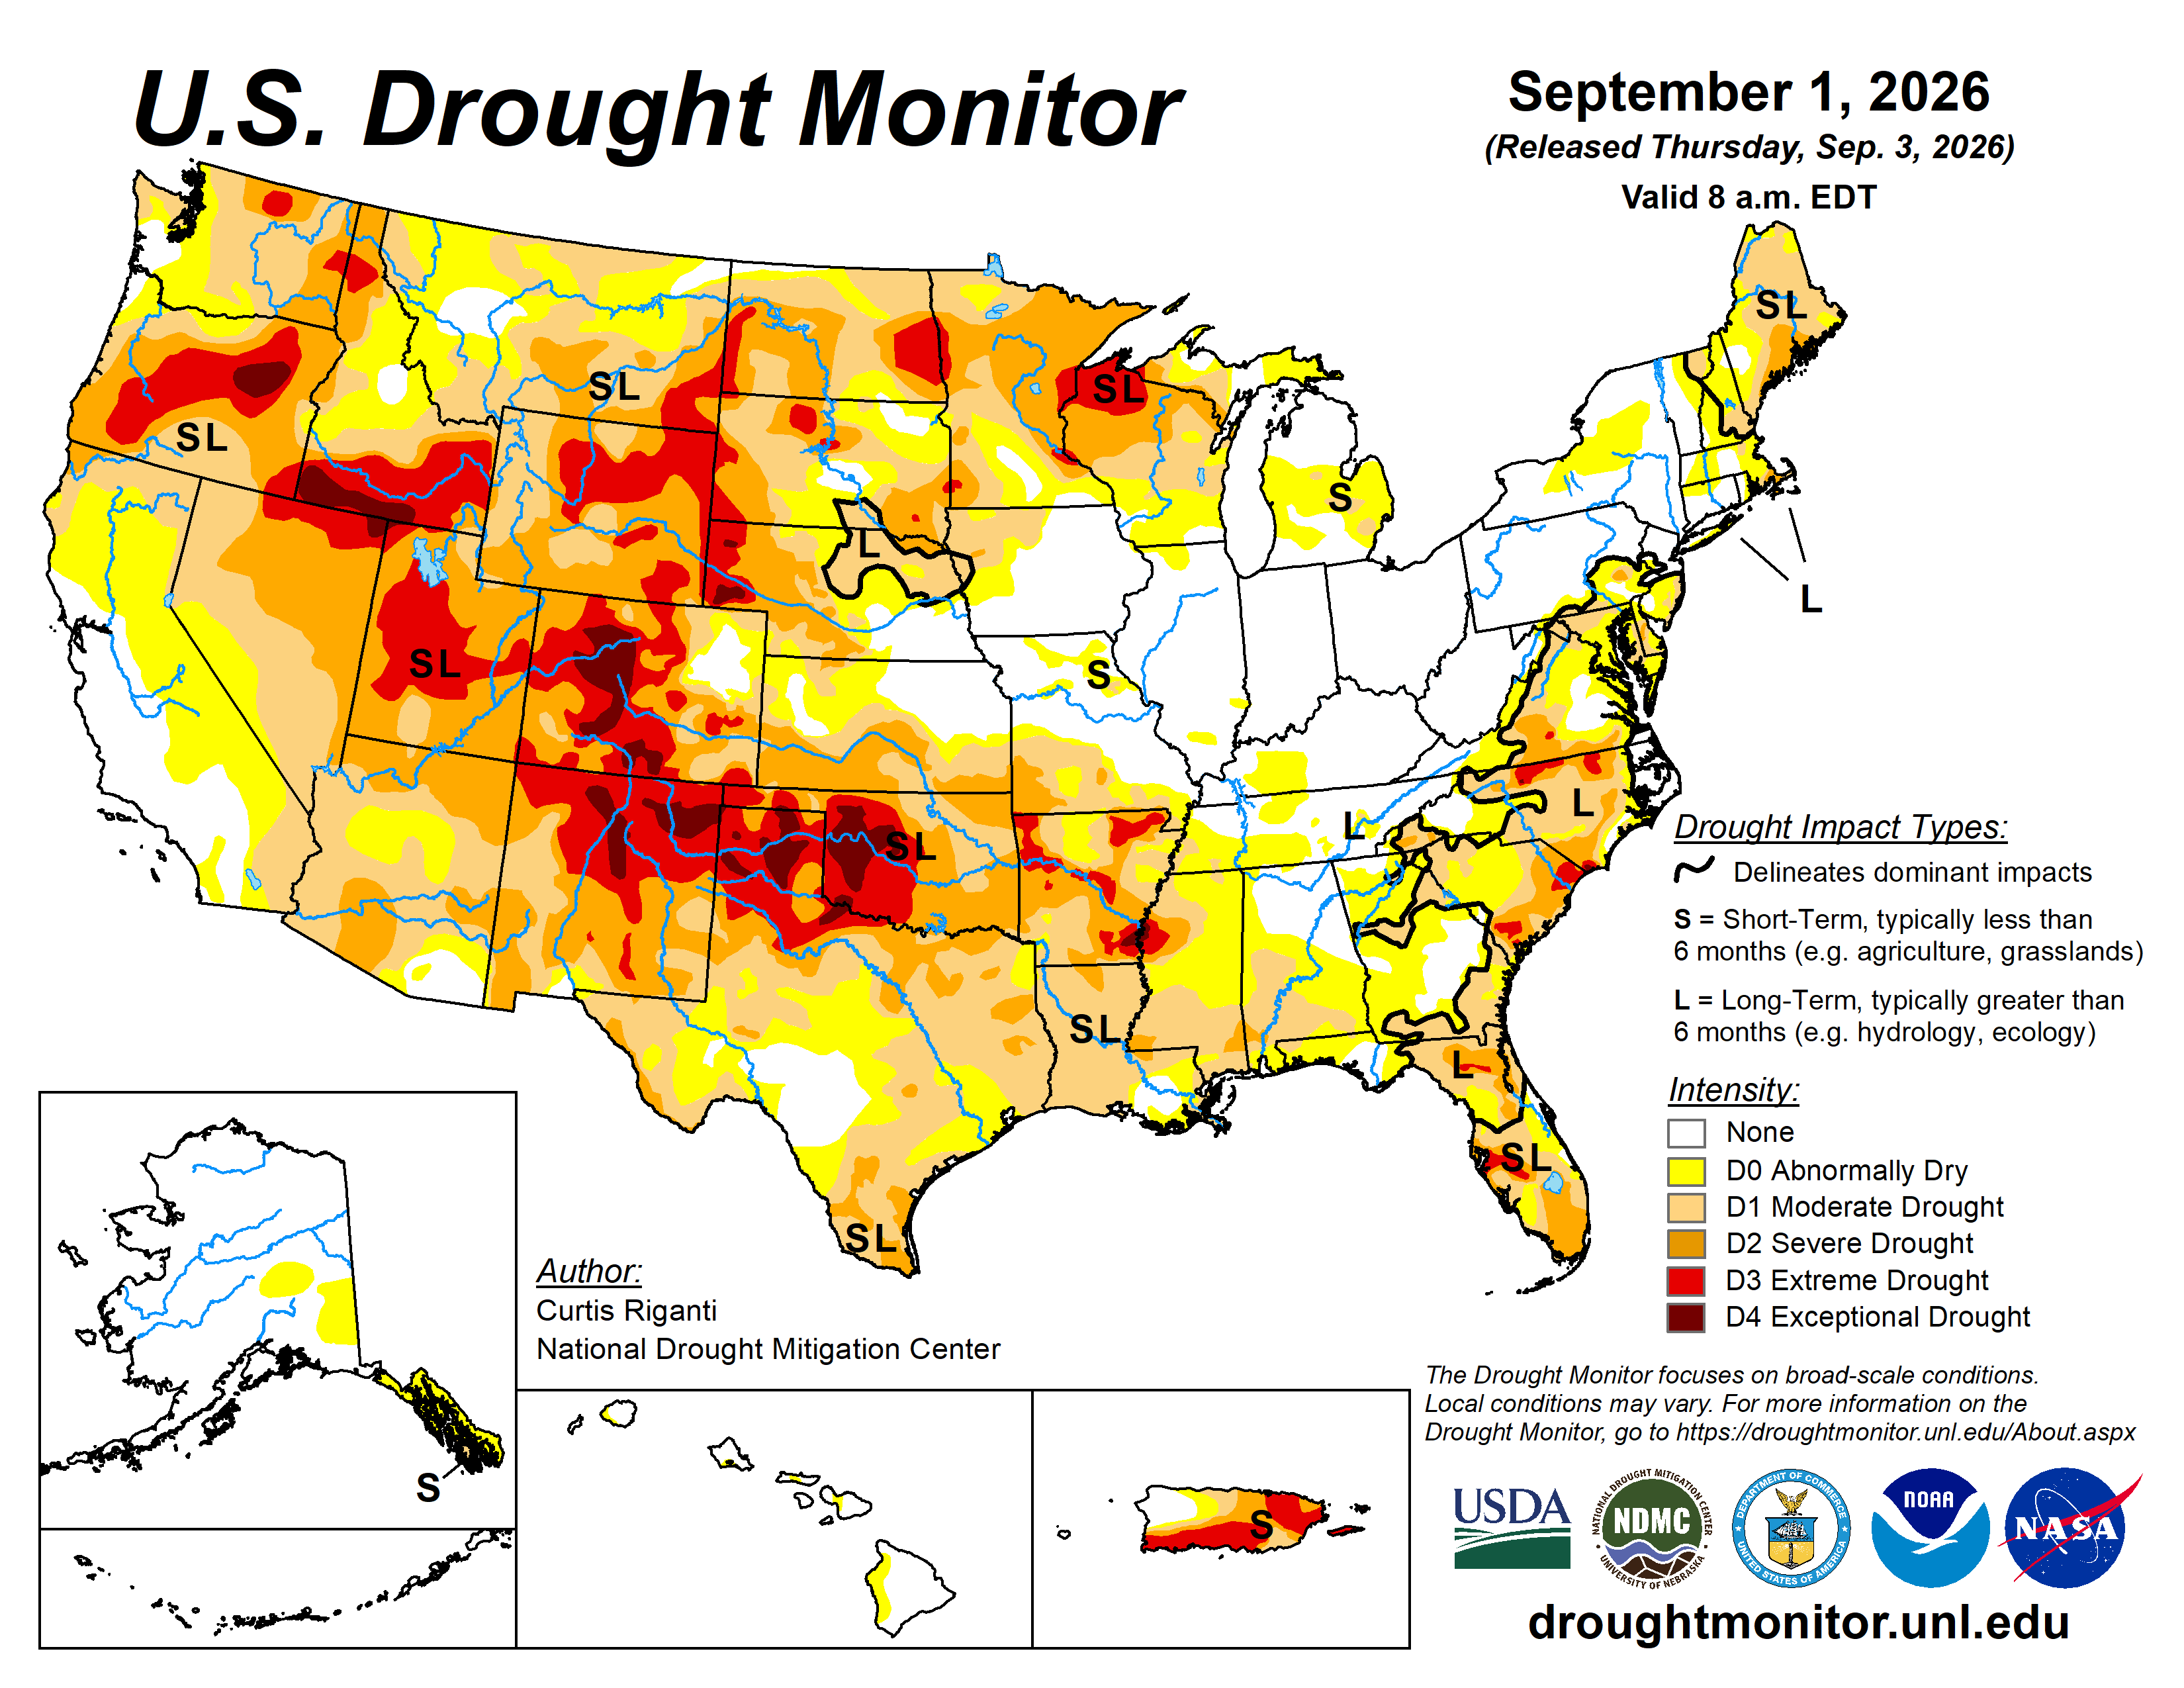
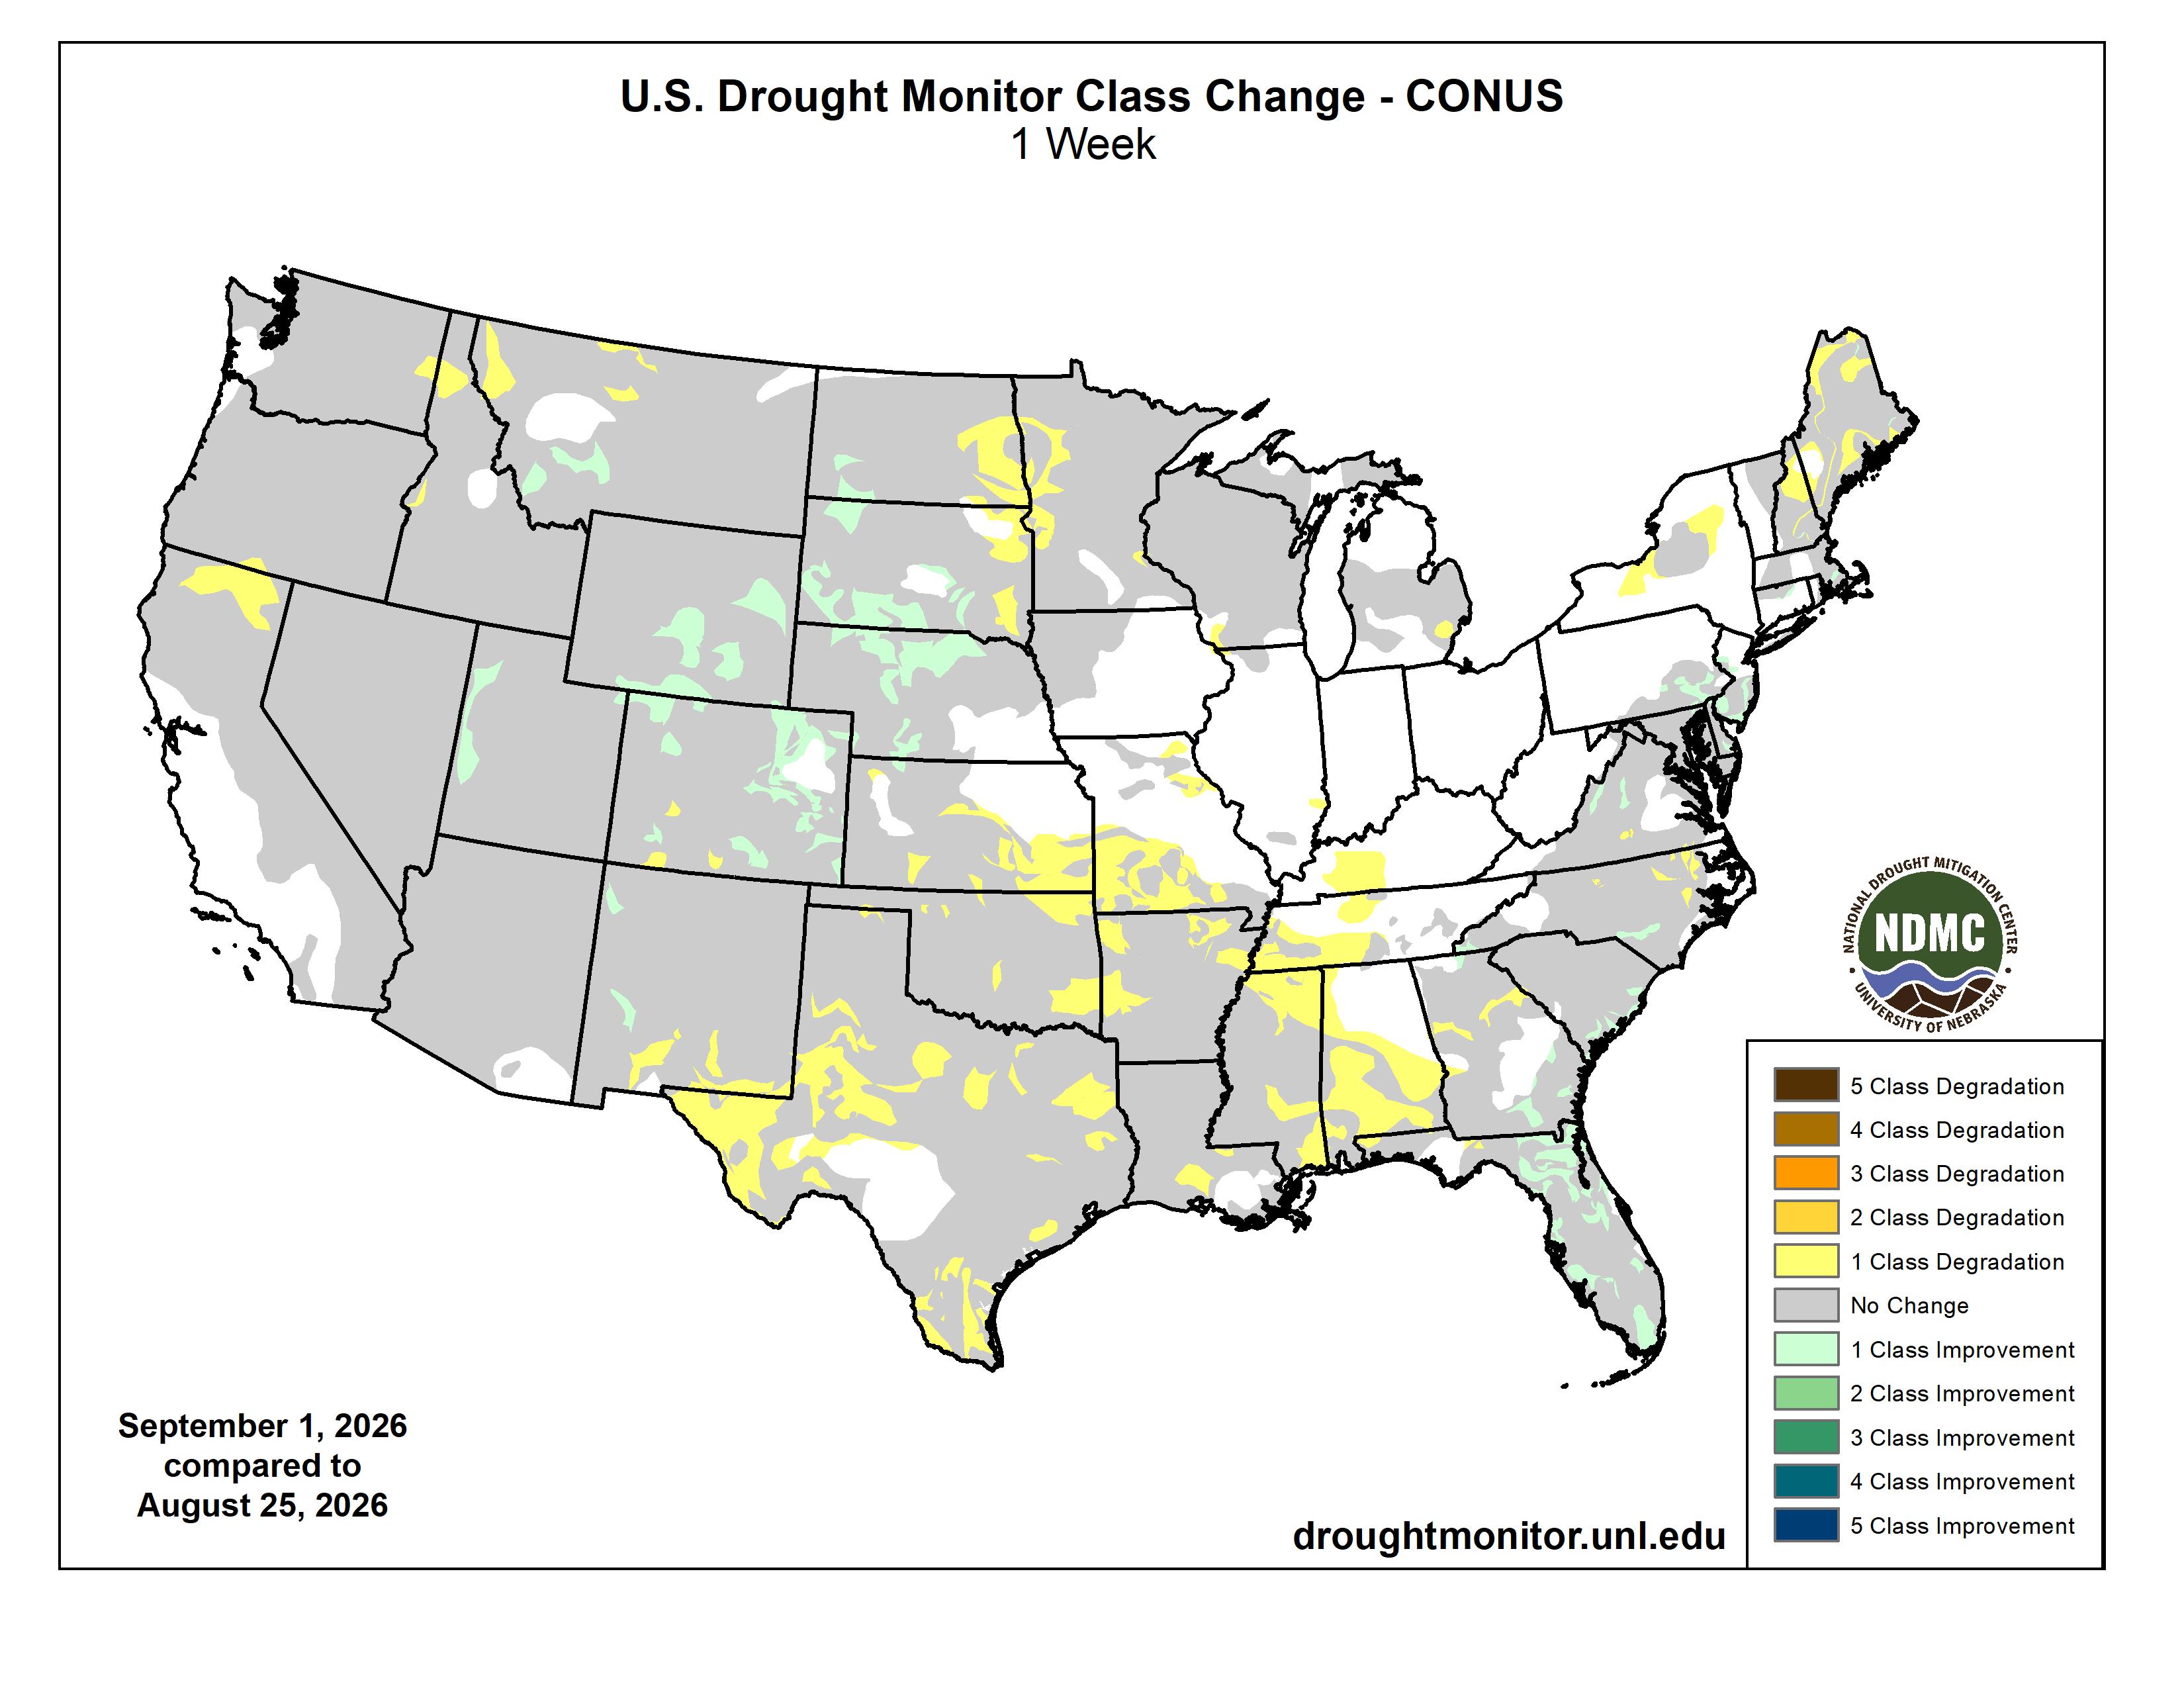
Here’s the US Drought Monitor Map from last week along with the one week U.S. change map.
Finally, Peter Goble recently wrote, What Super El Niño Means for Colorado, on the Colorado Climate Center blog. From the post:
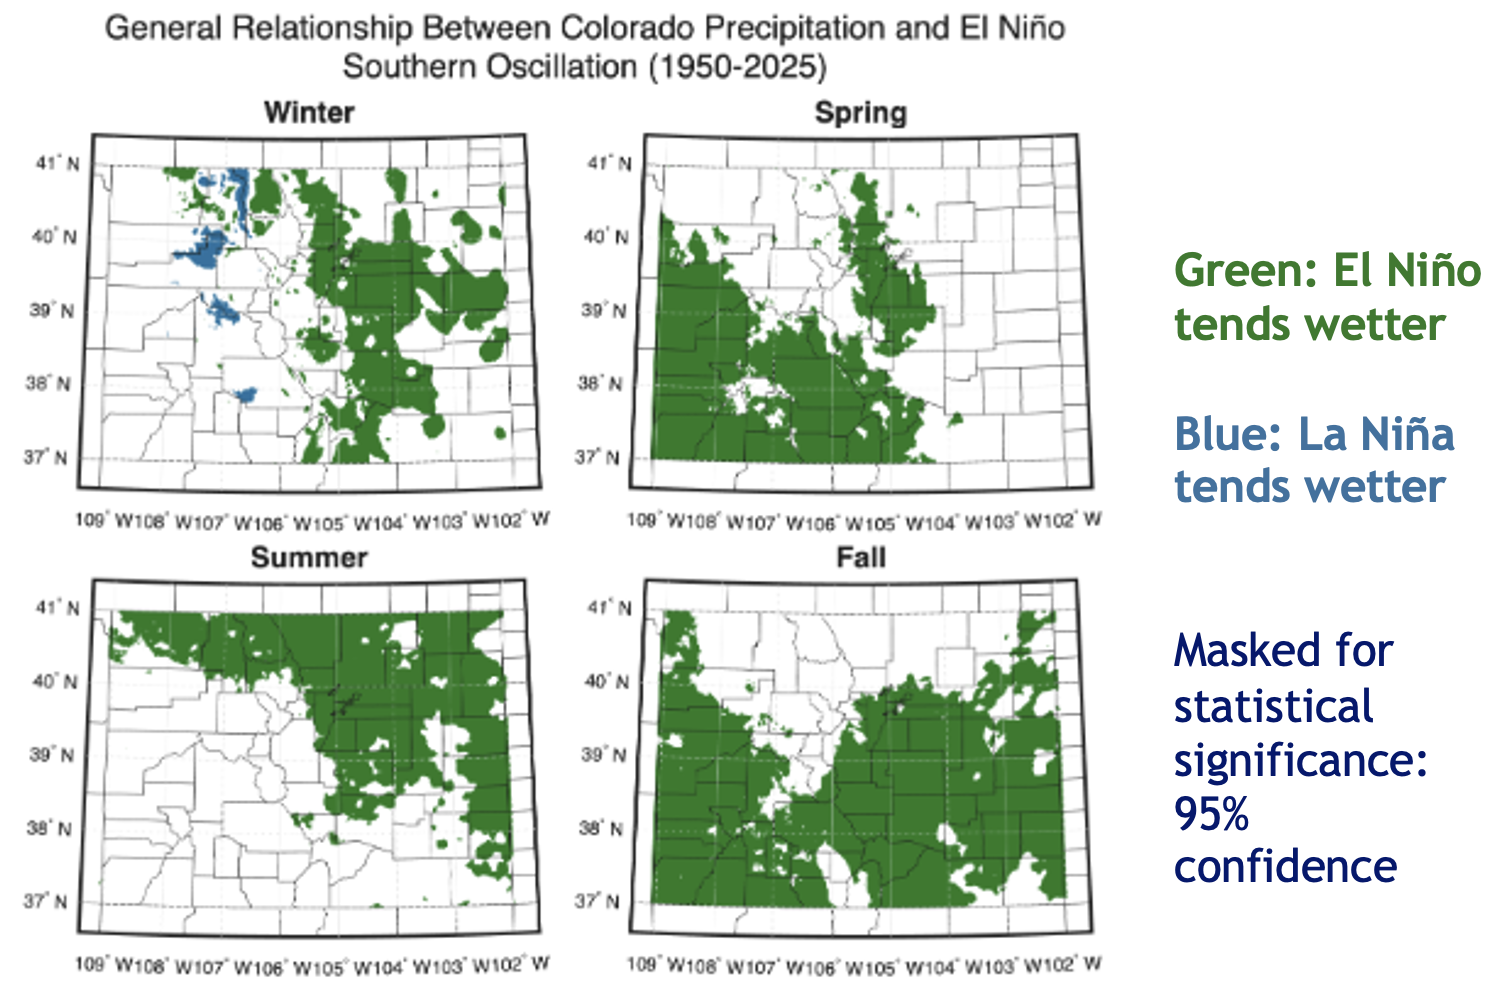
Historical correlation analysis shows El Niño is also linked to changes in Colorado weather, where conditions are generally wetter during El Niño years (image 5). This is especially true in fall and spring, when much of the state averages higher precipitation. Furthermore, the Front Range and Eastern Plains are more prone to large spring snowstorms and experience fewer dry and windy spring days (though such days remain frequent regardless). Unfortunately, the link between the El Niño–Southern Oscillation (ENSO) and peak seasonal snowpack levels in Colorado is weak. Southern river basins, such as the San Juan and Rio Grande, show a loose positive correlation between El Niño and snowpack.