#Drought news October 30, 2025: #Colorado and #Wyoming are the most drought-impacted states, in the High Plains region, with almost 55% of those states combined covered by D0 conditions or worse

Click on a thumbnail graphic to view a gallery of drought data from the US Drought Monitor website.

Click on the link to go to the US Drought Monitor website. Here’s an excerpt:

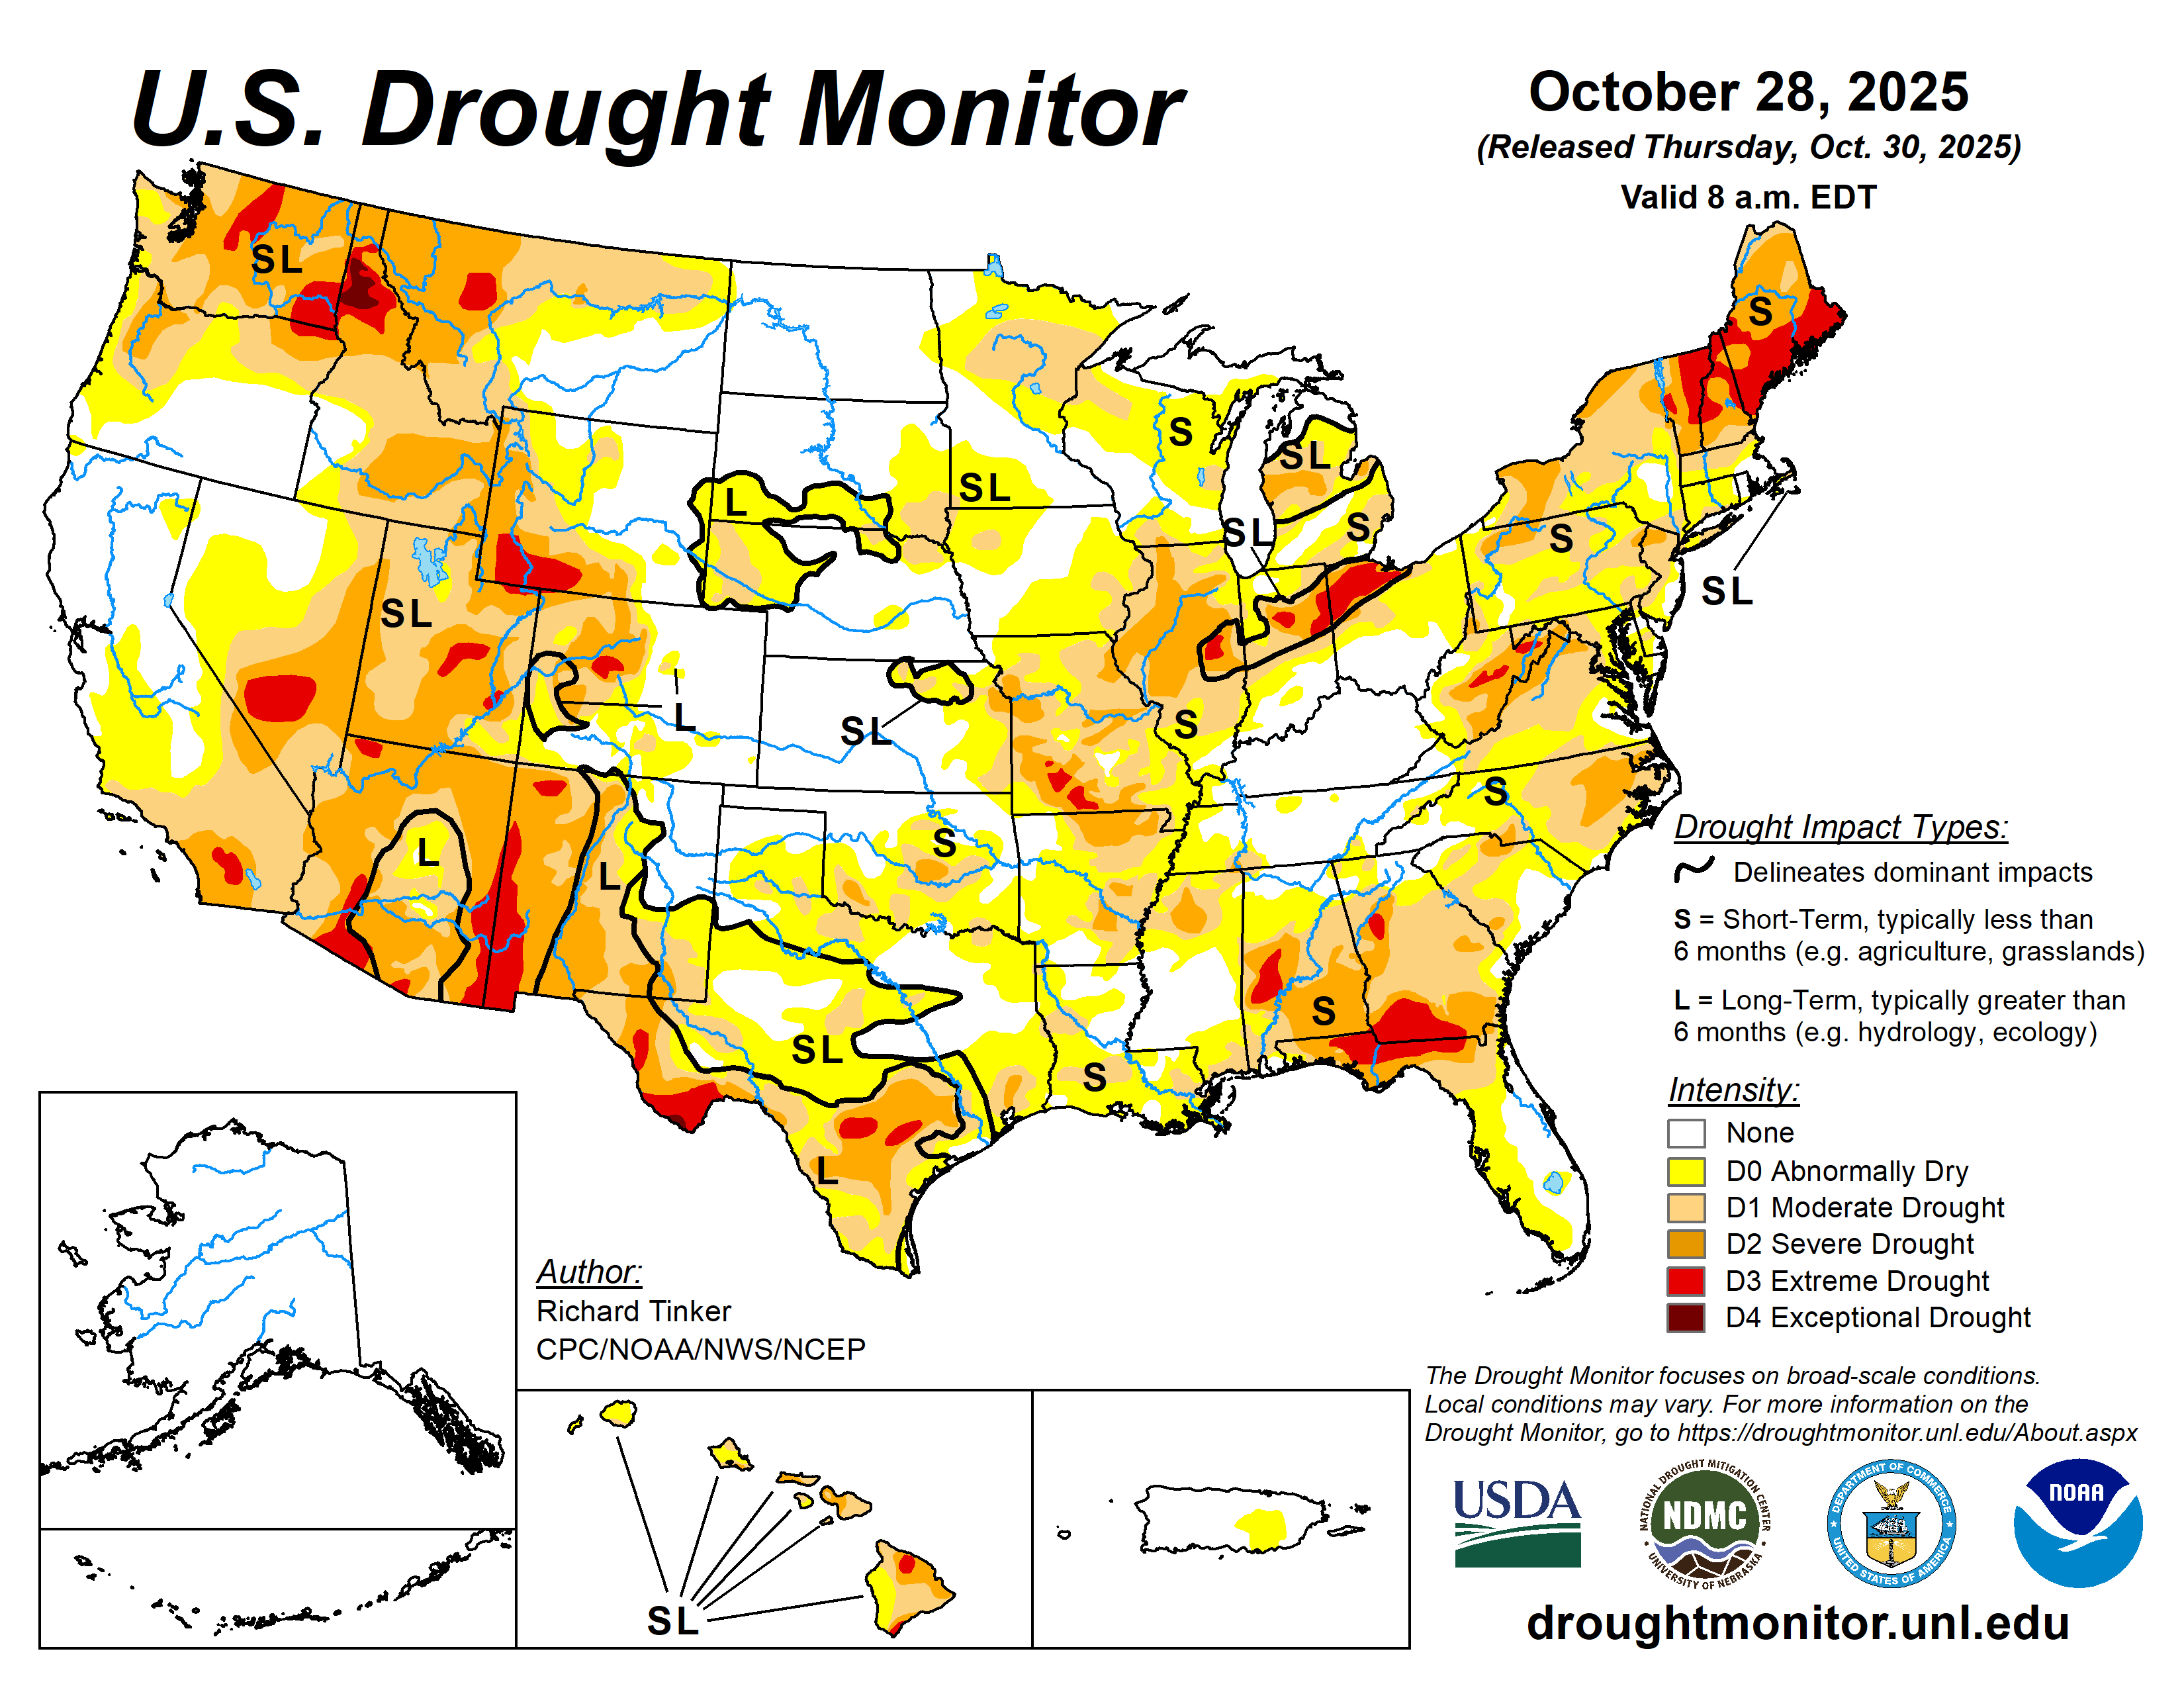
This Week’s Drought Summary

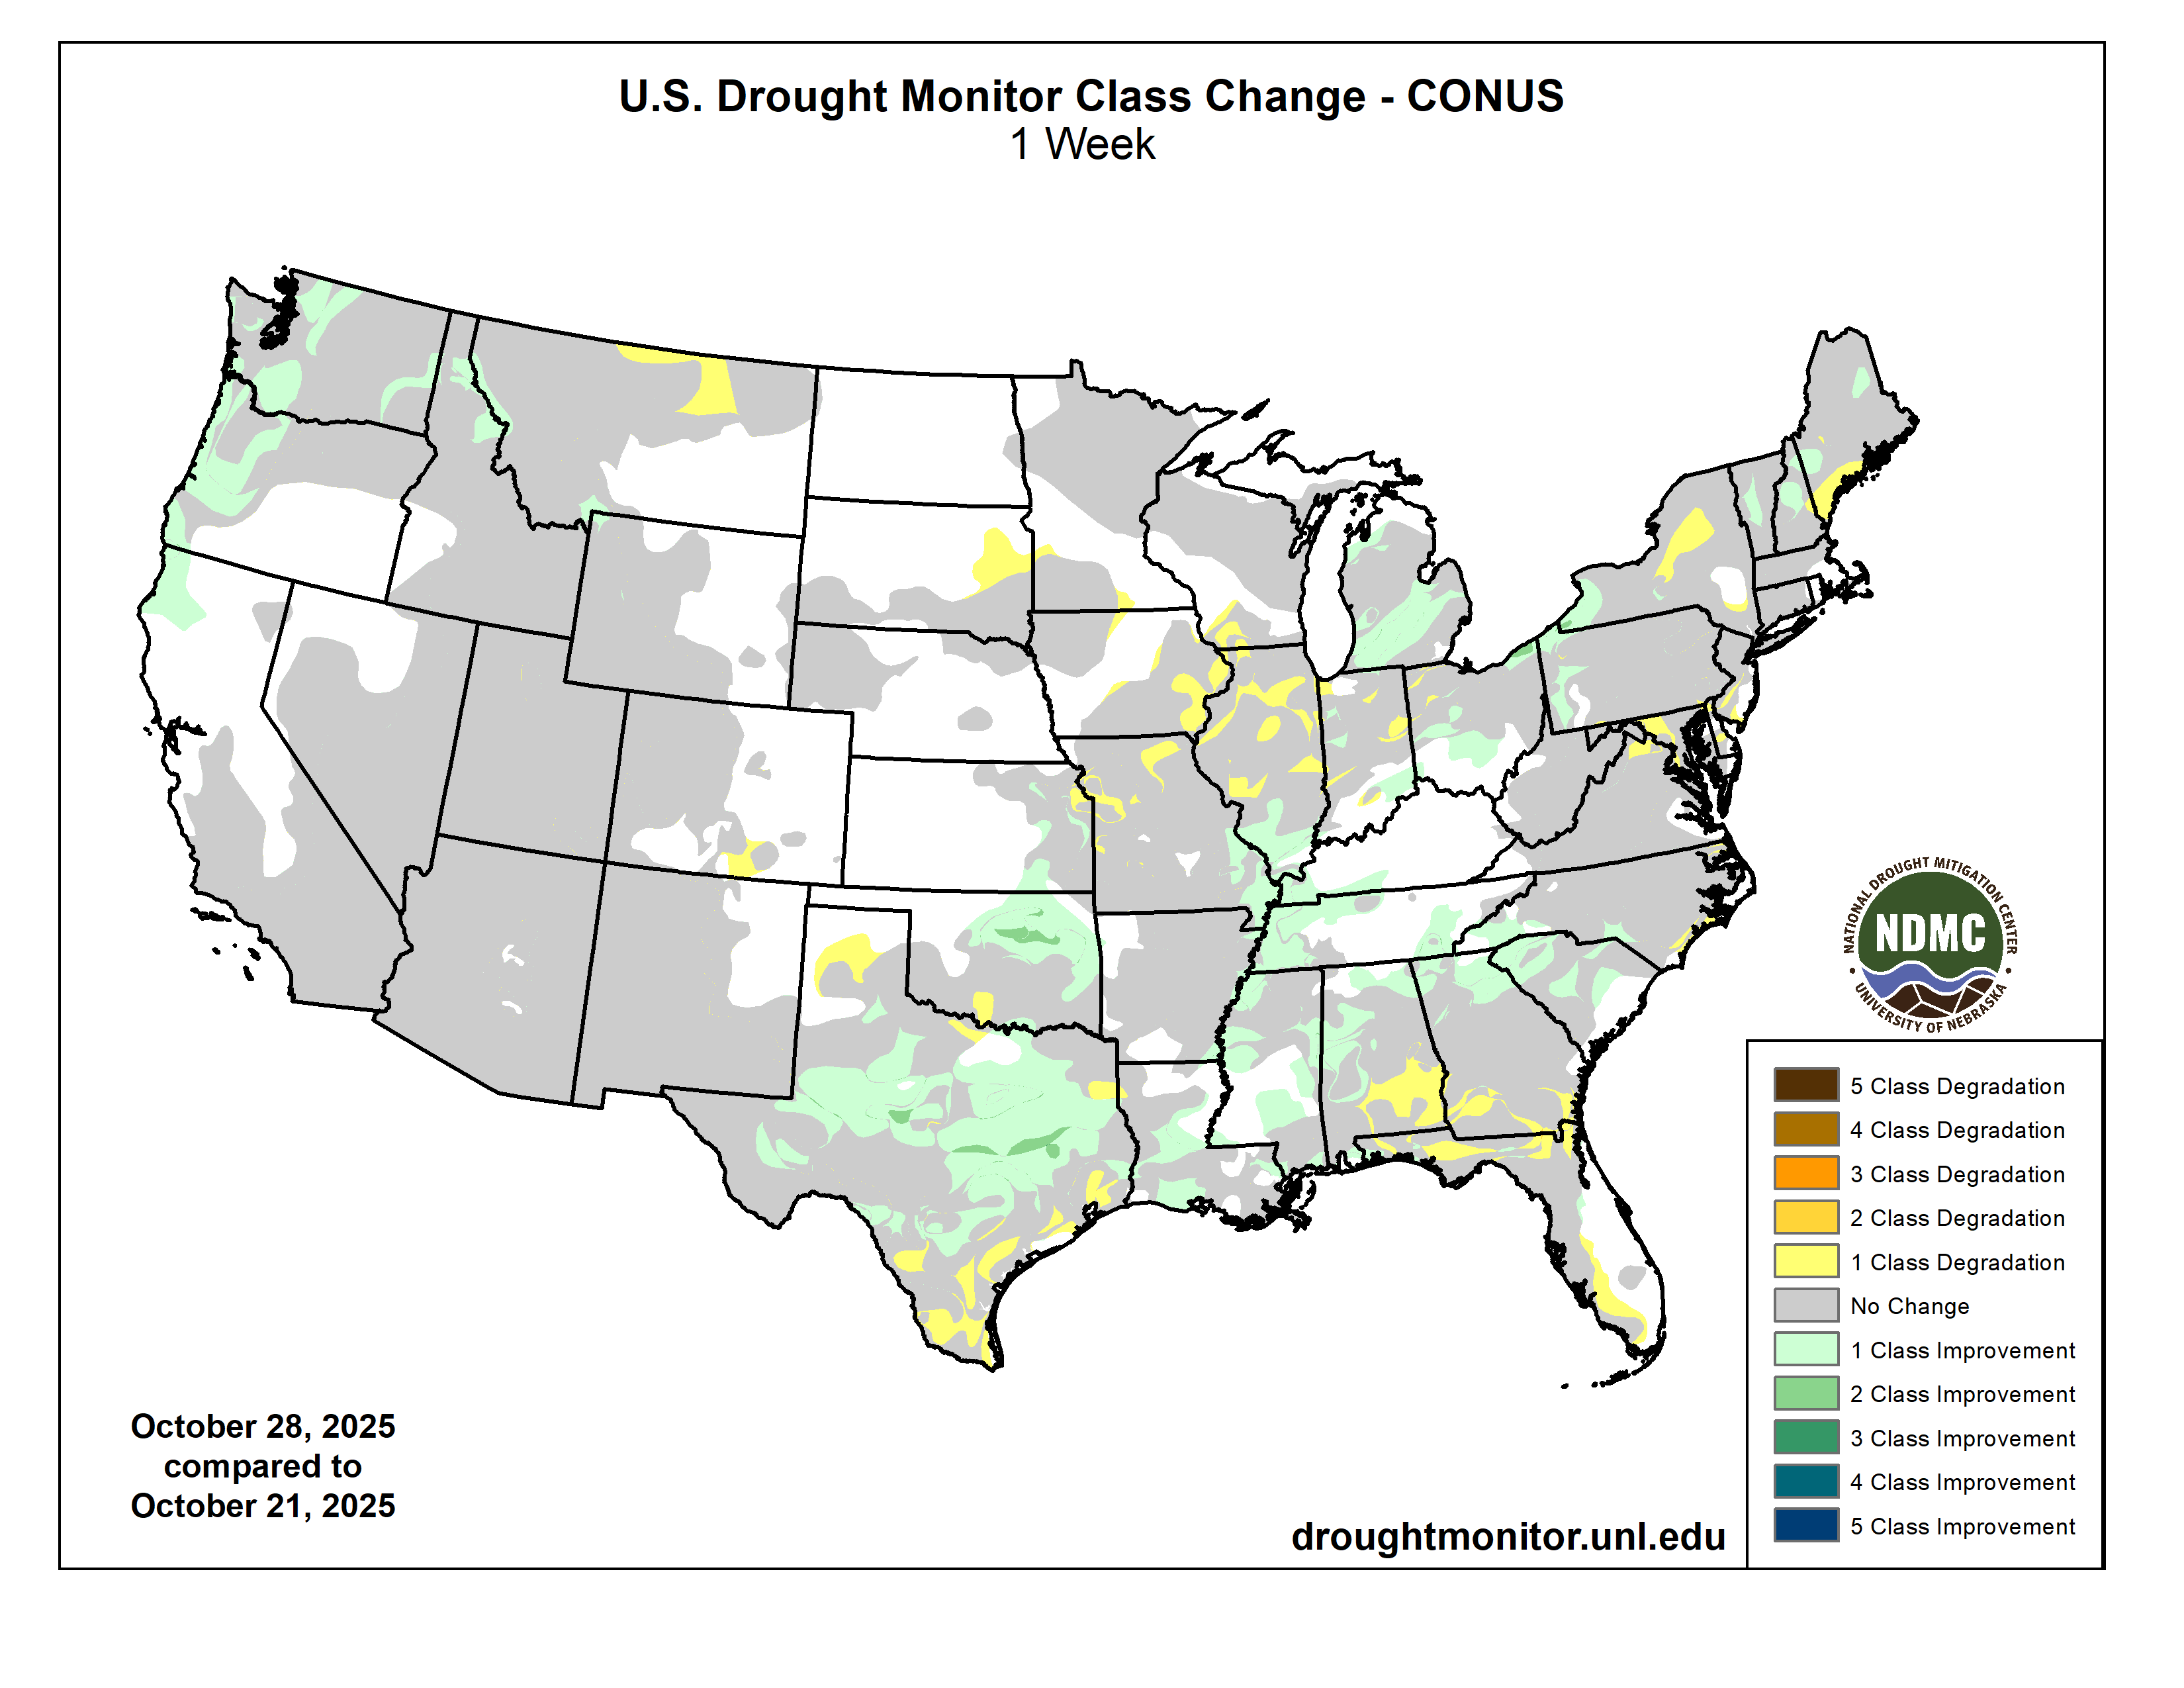
Heavy precipitation (over 3 inches) was observed last week over many of the higher elevations and coastal areas from northern California to the Canadian Border. Farther east, similar amounts doused numerous locations from Oklahoma southward to central Texas, a few areas across the lower Mississippi Valley, portions of the southern Appalachians, parts of the central Gulf Coast, the east-central Florida Peninsula, and some areas just downwind of Lake Erie. Between 5 and 10 inches of precipitation fell on a few areas in the coastal and higher elevations of Washington and Oregon, north-central through east-central Oklahoma, northeastern Texas, south-central Mississippi, and east-central Florida. Moderate to heavy precipitation (between 1 and 3 inches with isolated higher amounts) was reported across the rest of the Pacific Northwest, parts of the higher elevations in the northern Intermountain West, part of the northern Great Plains, most of central and western Michigan, a few patches across New England, and many areas from the central Carolinas to the central Great Plains, plus much of northern and central Texas, the southern Lower Mississippi Valley, and a few patches across northwestern and central Florida. Other locations across the Conterminous U.S. (ā€œLower-48ā€) received only a few tenths of an inch at best.

This resulted in significant areas of improvement in the Pacific Northwest, northern Intermountain West, the Great Plains from eastern Kansas through central Texas, the interior Deep South, the Ohio Valley, the eastern Great Lakes, the Carolinas, the southern Appalachians, and a few patches in New England. In some of the drier areas, dryness and drought conditions deteriorated in a few parts of the central and northern High Plains, the Texas Panhandle, Deep South and Coastal Texas, southern Alabama and Georgia, and small areas in the mid-Atlantic, and the Northeast from New York to coastal Maine. Deteriorating conditions also affected small parts of Hawaii (Upcountry Maui, northeastern Maui, and the southeastern Big Island). Conditions in Puerto Rico were unchanged with abnormal dryness persisting in parts of southeastern Puerto Rico, and Alaska remained free of any dryness or drought.

Overall, coverage of D0 or drier conditions across the Lower-48 declined slightly from 72 to 69 percent, remaining well above the average coverage since 2000 (49.2 percent). Drought (D1 or worse) extent also declined slightly from 46.1 to 43.6 percent of the Lower-48, also above the average since 2000 (31.1 percent)…
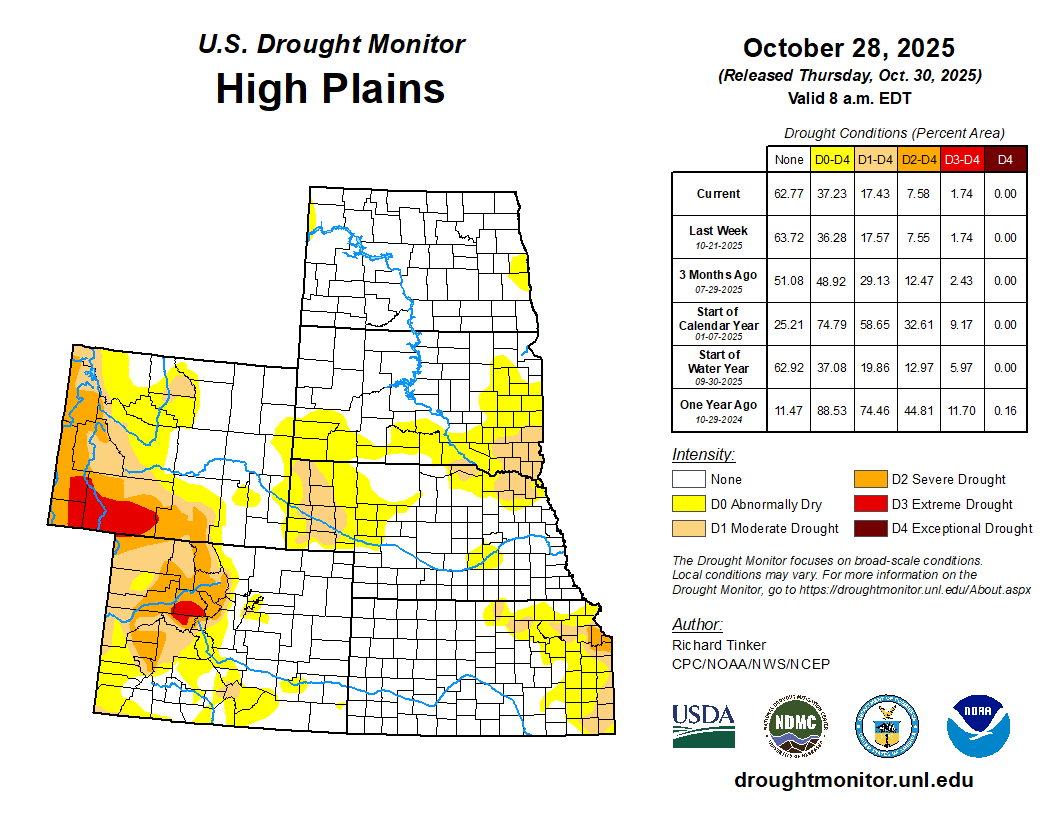
High Plains

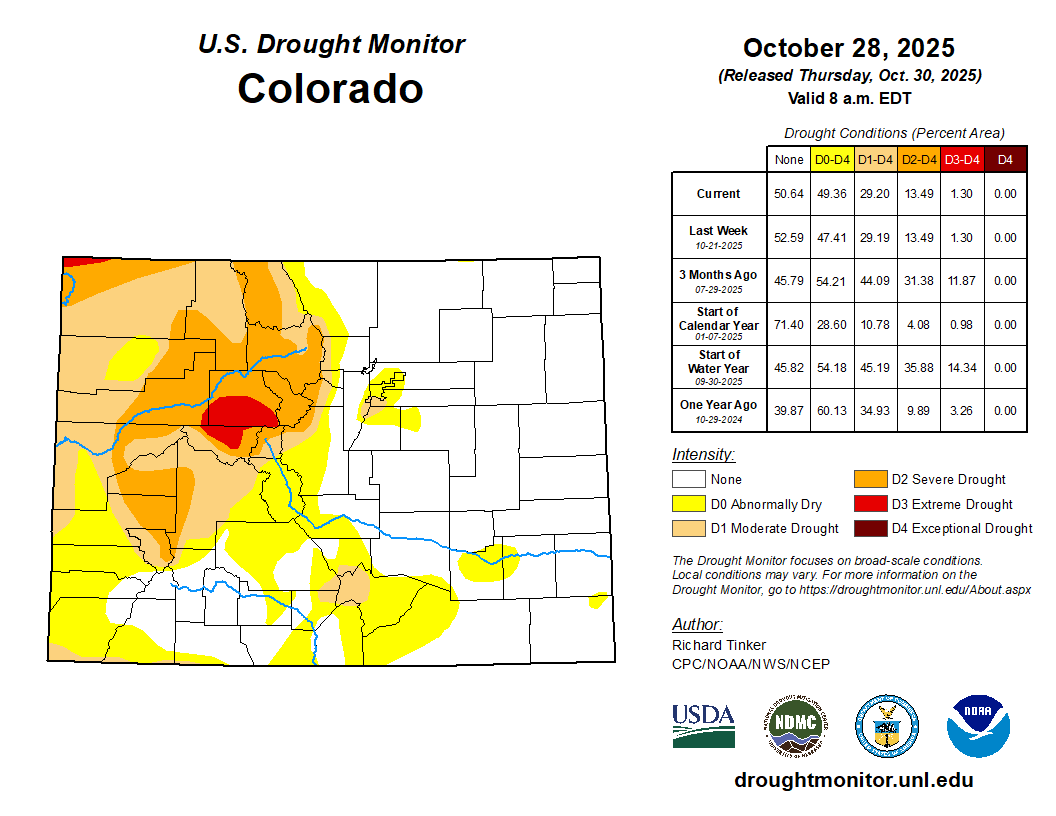
The High Plains Region is currently the Region least-affected by dryness and drought. Only 37.2 percent of the Region is affected by dryness (D0) or drought (D1-D4). Colorado and Wyoming are the most drought-impacted states, with almost 55% of those states combined covered by D0 conditions or worse, and about one-third experiencing some degree of drought (D1-D4), primarily in the higher elevations. In the Great Plains states, there is no drought in North Dakota and D0 covers less than 3 percent of the state. Dry conditions are a little more common farther south, with D0 or worse covering 39 percent of South Dakota, 35 percent of Nebraska, and 25 percent of Kansas. In all 3 states, drought (D1 or worse) coverage is less than 13 percent. Last week, moderate to locally heavy rain induced areas of improvement in eastern Kansas and far northwestern Wyoming while patches of deterioration were introduced in eastern South Dakota and small parts of south-central Colorado and far northeastern Kansas…
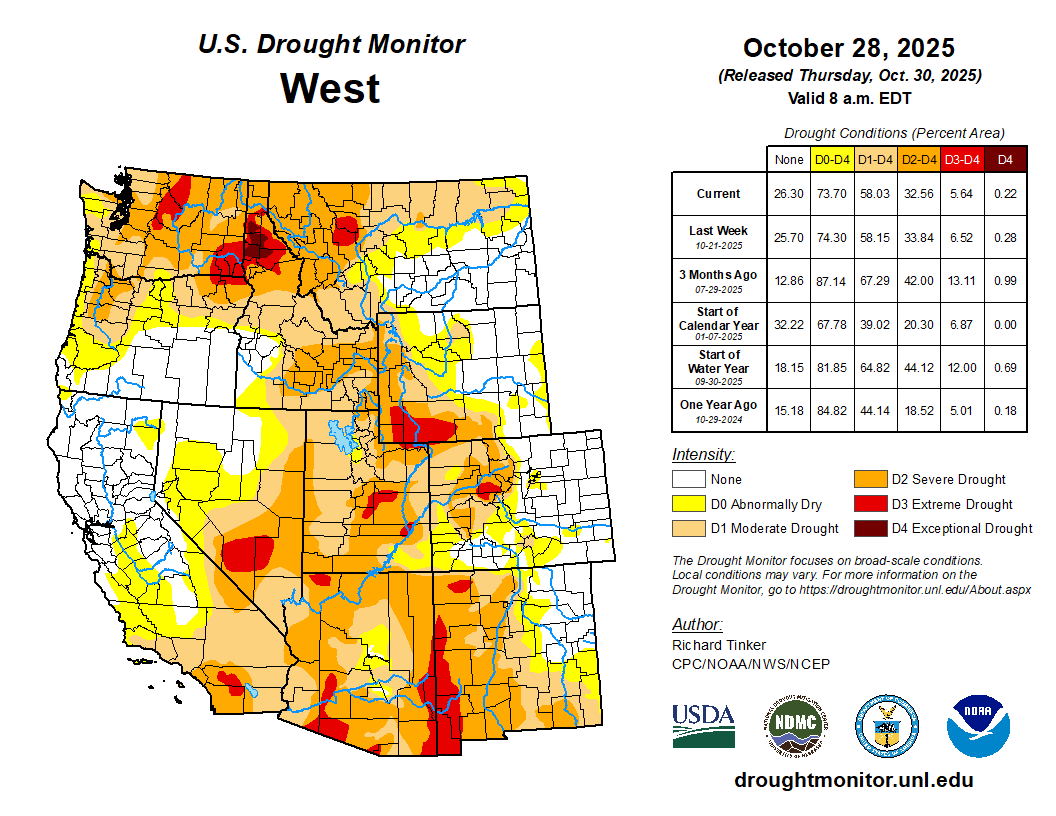
Colorado Drought Monitor one week change map ending October 28, 2025.

West

Following substantial changes across the West Region last week, conditions generally persisted across all but the northern tier of the West Region, with no changes made relative to last week across New Mexico, Arizona, Utah, Nevada, and most of California. Across the northern tier of the West Region, heavy precipitation engendered improvement in a few areas, mostly across northern California, Oregon, and Washington from the Cascades to the Pacific Coast. Many locations in the higher elevations of Washington and near the Washington and northern Oregon coastline measured over 3 inches of precipitation, with scattered amounts of 4 to locally over 8 inches recorded, particularly in northwestern and north-central Washington. Farther east, recent precipitation led to some improvement across western Montana and northern Idaho while, to the east, recent deficient precipitation totals led to deterioration across north-central Montana…

South

Heavy rains in many regions engendered broad areas of improvement across most of Texas, Oklahoma, Louisiana, Mississippi, and Tennessee. Some areas of deterioration were observed in areas that missed the heavy rains, specifically southern and coastal Texas, part of the Texas Panhandle, and a few patches of the Red River (South) Valley. Several inches of rain resulted in a few swaths of 2-category improvement across central and east-central Texas as well as central Oklahoma, where upwards of 4 to 8 inches of precipitation were observed. Overall, coverage of dryness and drought dropped from 80.6 to 68.6 percent of the Region while drought coverage (D1 or worse) was reduced from 37.1 to 27.6 percent. D3-D4 extent inched down slightly from 10.7 to 9.6 percent. But despite the wet week, 90-day rainfall amounts ranged from 3 to 6 inches below normal across much of the Red River (South) Valley, and from 4 to locally over 10 inches from central Texas eastward along and near the Gulf Coast…

Looking Ahead

Over the next 5 days (October 30 – November 3), a large part of the Lower-48 is expecting little or no precipitation, specifically most areas from the Appalachians to the Pacific Coast. Light to moderate amounts are forecast for most of interior New England, the central and southern Appalachians, the Oregon Cascades and Coast, the higher elevations of the Intermountain West, much of Peninsular Florida, and portions of the South Atlantic Coastal Plain. Heavier amounts exceeding 1.5 inches are anticipated across the Washington Cascades and Coast, isolated spots near the central and western Gulf Coast, much of the middle and upper Ohio Valley, most of a broad swath from Maryland through New York, and the Florida Keys. Daily high temperatures are forecast to average 2 to 4 deg. F below normal across the Southeast, and near normal over the Northeast and the Lower Mississippi Valley. Unusual warmth featuring daily Highs 4 deg. F or more above normal is expected across the northern Great Plains and most locations from the High Plains to the Pacific Coast, outside the Pacific Northwest. Average daily highs could reach 10 to 14 deg. F above-normal across the eastern Great Basin and the central and northern Rockies.

During November 4 – 8, wetter than normal weather is again expected in the Pacific Northwest, expanding to cover the northern Intermountain West, western Great Basin, and central through northern California. Odds for wetness exceed 50 percent from northwestern California through central and western parts of Washington and Oregon. Elsewhere, wet weather is marginally favored in much of the South Atlantic, south-central and southeastern Alaska, and portions of northern Alaska. Meanwhile, most of a large swath from the Rockies to the Appalachians have enhanced odds for drier-than-normal conditions, with chances topping 50 percent across New Mexico and the western half of Texas. Subnormal precipitation is also marginally favored across all but the eastern fringe of the Big Island in Hawaii. Warmer than normal conditions are favored from the Great Lakes and lower Ohio Valley through most areas from the Mississippi Valley to the Pacific Coast. Enhanced chances for warmer-than-normal weather also cover southern Florida, south-central and eastern Alaska, and Hawaii. Most areas over and near the central Rockies have chances for warmth exceeding 80 percent. Subnormal temperatures are only favored in New England and adjacent New York. In other areas, near normal temperatures are most likely.

US Drought Monitor one week change map ending October 28, 2025.

Exploring #Colorado’s untapped geothermal energy potential — Charles Ferrer (University of Colorado #Boulder)

Map of Western US geotthermal areas via the USGS

Click the link to read the article on the University of Colorado website (Charles Ferrer):

October 21, 2025

A major question looms over Colorado’s energy future: why does geothermal energy ā€” a natural renewable resource ā€” remain virtually untapped? 

Professor Bri-Mathias Hodge. Photo credit: University of Colorado Boulder

Professor Bri-Mathias Hodge, based in the Department of Electrical, Computer & Energy Engineering, along with Assistant Teaching Professor Shae Frydenlund from the Center for Asian Studies, will examine the technological and social barriers that have held back geothermal development in Colorado.

Geothermal energy comes from the natural heat stored beneath the Earth’s surface. It’s harnessed by tapping underground reservoirs of steam or hot water to produce electricity or provide direct heating.

Colorado is home to significant geothermal areas including the areas of Mount Princeton Hot Springs, Waunita Hot Springs and the San Luis Valley ā€” yet no geothermal power plants currently operate in the state. That could soon change, thanks to growing collaboration among researchers, energy companies and policymakers.

Assistant Teaching Professor Shae Frydenlund. Photo credit: University of Colorado Boulder

ā€œWe know there is an abundant amount of geothermal energy potential in our state,ā€ said Hodge, who brings two decades of experience in renewable energy integration and power systems simulation. ā€œWhat we need is a better understanding of the social, economic and regulatory factors that influence its development.ā€

Bridging technology and community

Frydenlund’s work with Indigenous communities in Indonesia, some of whom oppose geothermal projects due to environmental justice concerns, sparked an interdisciplinary collaboration with Hodge.

ā€œI became very interested in bringing together physical science and social science perspectives,ā€ Frydenlund said, ā€œand to understand why a place as geothermal-rich as Colorado hasn’t tapped into this natural resource.ā€

Her research, together with Geography Professor Emily Yeh, revealed that struggles over geothermal projects emerge in and through the politics of indigeneity, land tenure and uneven development.

ā€œThere are concerns over land rights, sacred territories, livelihoods and environmental justice,ā€ she said. ā€œWe need to bring those perspectives as we think about using geothermal here.ā€ 

To capture both the human and technical sides of geothermal development, the CU Boulder team will combine tools, such as power systems modeling, spatial statistics and GIS mapping along with community forums, surveys and interviews. Gaining community input will be integral for this project. 

One of their main goals is to create an interactive map tool of Colorado showing potential geothermal sites, layered with data on social and technological factors.

ā€œJust because an area has strong potential doesn’t mean it’s a good place to develop geothermal energy,ā€ Frydenlund said. ā€œIf it’s not culturally appropriate or desired by the community, resources can be wasted and projects can fail.ā€

The issue isn’t unique to Colorado. 

ā€œWe’ve seen this already in the U.S.,” Hodge said. “Hawaii has been a leader in decarbonization goals and has great geothermal resources. Yet, there’s very little being developed there because you have to be mindful of the traditions in Hawaiian culture.ā€ 

The planning phase for the project includes three major steps: campus-wide town halls to connect with geothermal experts, identifying industry and community partners across the state and gathering preliminary data through stakeholder engagement. Between January and March 2026, Frydenlund will conduct fieldwork at six sites across Colorado, including Steamboat Springs, Buena Vista and Sterling Ranch in the South Metro area. 

Building toward carbon neutrality

Geothermal exploration speaks directly to CU Boulder’s goal of carbon neutrality by 2050 and the Western Governors Association’s Heat Beneath Our Feet initiative, which announced $7.7 million in funding in May 2024 to advance geothermal technology in Colorado. 

Geothermal technologies can operate at multiple scales from single buildings to community thermal networks to large-scale power generation.

ā€œWhat’s really interesting from a power systems standpoint is that geothermal affects not only electricity supply, but also demand,ā€ Hodge said. ā€œIf ground-source heat pumps became widespread, Colorado’s power grid could shift from a summer to a winter peak system.ā€

However, these technological advances alone can’t drive an increased transition to geothermal. 

ā€œUnderstanding the intimate relationships that people have with land and with energy and with each other will make for a much richer picture of what kind of future geothermal energy has in this state,ā€ Frydenlund said. 

The project is funded by a Research & Innovation Office New Frontiers Grant.

Geothermal Electrical Generation concept — via the British Geological Survey

Will data centers show up in #Colorado’s rural areas? — Allen Best (BigPivots.com)

Data construction at 49th & Race, Denver. Photo credit: Allen Best

Click the link to read the article on the Big Pivots website (Allen Best):

October 23, 2025

Data centers in Colorado have been almost exclusively located along the Front Range, more narrowly yet between Colorado Springs and Boulder County.

In other words, they have arrived at exactly those places within the state that have prosperous economies, jurisdictions even struggling with the challenges imposed by growth.

Might data centers make their way to rural areas of Colorado?

Leaders of several electrical cooperatives offer mixed responses. Some report getting interest already, others not.

Tri-State Generation and Transmission Association, Colorado’s second largest electrical provider, hopes to prime the pump. It has filed a proposal with the Federal Energy Regulatory Commission for a tariff that it believes will interest developers. It’s called HILT, which stands for high-impact load tariff. It is designed for demands of 45 megawatts or more.

Meanwhile, several state legislators continue to hone bills they expect to introduce into the next legislative session. In the last legislative session, one bill proposed incentives for data center development in some locations. Others thought that the state needed guardrails to ensure  that other customers — as well as land and especially water resources — are not imperiled. (Look for a deeper story on that in coming days in Big Pivots).

ā€œAbsolutely,ā€ said Duane Highley, the chief executive of Tri-State, in an interview with Big Pivots on Oct. 7 when asked about potential for data centers in places like Craig or Fort Morgan. ā€œOur members have actually had quite a bit of interest across our entire footprint. So definitely not just the urban areas.ā€

The Westminster-based cooperative provides wholesale power to 40 electrical cooperatives and public power districts in Colorado and three adjoining states.

ā€œSome of our high-elevation members get a lot of interest because of the cool air and less need for cooling a data center,ā€ he said. This, he added, is particularly true in Wyoming, where Tri-State has 10 member cooperatives. It supplies electricity to 16 cooperatives in Colorado.

Tri-State does not deliver electricity to Craig and Hayden, although it does operate three coal-burning units at Craig. It plans a gas-fired power plant there after the coal units get retired. The first unit is scheduled to retire later this year and the final two before the end of 2028.

At 6,200 feet in elevation, Craig is consistently cooler than the Front Range. It is often below zero during winter nights, sometimes far below.

ā€œI guess Craig would be an excellent spot,ā€ said Highley. He cited the existence of a ā€œreally big substationā€ as well as transmission.

ā€œSo if anybody wants to start a conversation around Craig, we will have the tariff in place to allow that to happen. ā€

Highley reported that Tri-State has had four gigawatts of requests on its system from data centers. Tri-State has a generating capacity of 2.5 gigawatts from Wyoming to Arizona. Not all that demand will materialize, Highley hastened to add. ā€œA lot of them are just shopping, but I have to think that some part of that is real.ā€

A spot check by Big Pivots of electrical cooperatives in Colorado reveals little of substance — yet.

ā€œWe really haven’t had any inquiries about data centers in the Mountain Parks service territory to date,ā€ said Virginia Harman, the chief executive of Granby-based Mountain Parks Electric. ā€œThat doesn’t mean they won’t happen.ā€

In Buena Vista, Jon Beyer, the general manager of Sangre de Cristo Electric, has the same report. ā€œWe are not getting any inquiries anywhere in the Arkansas Valley. Land prices are pretty expensive, and electrical infrastructure is probably not robust enough for stuff of that size. Finding employees is a challenge as well,ā€ he said.

ā€œCoops along the Front Range — Poudre Valley, United Power, Mountain View, maybe even San Isabel, I would guess they have all received inquiries, folks kicking the tires.ā€

In western Colorado, Delta-Montrose Association has at least heard a little bit of interest via upstream electrical providers but ā€œnothing to take to the bank,ā€ said Kent Blackwell, the chief administrative officer. ā€œThe fact that we have even heard any out there is shocking to me, this far removed from urban centers.ā€

Different sizes

Data centers do come in different sizes and flavors. Micro data centers generally are those in places of 5,000 square feet or less. Small comes in at 20,000 square feet. Hyper-scale data centers are classified as those with over 100,000 square feet and consuming 100 megawatts.

QTS, Colorado’s most high-profile data center, seems not to have divulged its square footage but has a 67-acre campus in Aurora, near the intersection of I-70 and E-470, and a demand of 177 megawatts. However, it still ramping up, with a 10-year expansion.

The QTS hypescale data center in Aurora occupies a campus of 67 acres and is still ramping up. Photo credit: Allen Best/Big Pivots

Many data centers are even larger. Meta (Facebook) has a data center in Oregon that covers 4.6 million square feet. A data center in Inner Mongolia covers 10.7 million square feet.

These definitions and other information, by the way, come in part from Google AI reports (which makes those of us who are actual providers of diminished relevance — or at least uncompensated.) They could be wrong — as AI often is. Of course, newspapers were never wrong, were they?

Tri-State’s Highley said he has talked with developers covered by non-disclosure agreements. ā€œI can’t share who they are, but I’ll just say I’m inspired by them,ā€ he said. ā€œThey have a lot of money, and they do have the ability to execute. I also believe they’re shopping multiple locations at once, and so it’s a little bit of competition.ā€

Will this new HILT tariff from Tri-State — assuming it is approved by FERC — become a model for others? Highley said he got a call from a White House office in late September. The individual had lots of questions about Tri-State’s FERC filing. The individual had read Tri-State’s FERC filing in detail.

ā€œWhy do you care so much? Why are you calling me?ā€ Highley asked. ā€ And he said, ā€˜Because I think this tariff that you filed could set a precedent for the industry nation-wide.ā€

Highley said he has not noticed another large-load tariff approved at FERC, although he has seen two that were rejected. ā€œI don’t think we have it perfect, but we think we’re moving down a good path. We had input from developers and from our own co-op members to design this.ā€

Stranded assets?

Will this interfere with Tri-State’s plans to decarbonize? It expects to be at 50% carbon free electricity by year’s end and 70% by 2030. No, said Highley. Tri-State can meet new demand with solar, wind and battery storage. It also plans another natural gas plant near Craig, pending approval by the Colorado Public Utilities Commission.

Tri-State and its members would also allow data center developers to produce part of their own generation. That tariff is called bring-your-own-resource, or BYOR. A developer might have better access to supply chains, Highley said. ā€œAgain, some of these hyper-scalers have such a big checkbook they can buy their way to the front of the line. ā€

HIghley said the Tri-State’s tariff will ensure that it has the capacity to back up the data center developer while getting properly compensated, so no other members subsidize the project.

A September presentation by Matt Fitzgibbon, Tri-State’s vice president of planning and analytics, tells a slightly nuanced story. A slide deck reported ā€œlimited potentialā€ for stranded assets resulting in financial risk to Tri-State and its members while enabling ā€œeconomic development across our members’ systems at an unprecedented level and pace.ā€

This gets at the heart of one concern about data centers, as illustrated in the Xcel filing with the Colorado Public Utilities Commission last year. How much of the prospective demand from data centers is real? And if it is not real, who will be left holding the bag if a utility spends gobs of money building new generating capacity? How much risk will be put on ratepayers, in the case of Xcel, or in the case of cooperatives, members?

In Durango, Chris Hansen, the chief executive of La Plata Electric since November, foresees data centers arriving in more rural parts of Colorado.

ā€œWe have had significant discussions with three different data center operators who are interested in southwest Colorado,ā€ he reported. ā€œWe are making sure that we are open for business and communicating our opportunities in the near term, in the next 24 months, and those requiring more lead time of three, four or five years.ā€

Data centers, he said, ā€œare most focused on low cost of power and availability of water for cooling. Those are very high on their list.ā€

And Colorado’s sales tax policy will not make it a higher cost for developers when they are buying hundreds of millions of dollars for chips. ā€œThat is something that is relevant for them as they make their decisions.ā€

Hansen said he believes that data center demand can be met in ways that are highly beneficial to existing customers and the electrical system more broadly.

Some rural places could be limited by lack of sufficient fiber connectivity to more urban areas. Hansen acknowledges that but points out that data centers can have different needs. As for southwest Colorado, it is well connected.

Delta-Montrose’s Blackwell sees his cooperative being in a good position to interest data center developers. It has fiber connectivity to Denver, Salt Lake City and Albuquerque. ā€œA Facebook, an Amazon — the big data centers will want direct fiber connectivity.ā€

A map published last week by the Wall Street Journal using Department of Energy information showed data centers across the United States. Texas has, well, Texas-sized dots and maybe bigger. Virginia, with its data center alley, is well represented. But you see almost no dots of any size in the Rocky Mountain states beyond the urban areas with the exception of Cheyenne.

Hansen said he believes electrical cooperatives are positioned to meet demand that investor-owned utilities in urban areas cannot.

ā€œLarger investor-owned utilities around the country are not in great position to meet demand. That is the trend I am seeing. Rural co-ops can move fast, as they don’t have to necessarily go through PUCs. Those things help make rural areas more attractive.ā€

Lots of shopping, little commitment

In Southwest Colorado, the data developers have been looking to get started at 50 to 100 megawatts. If things go well, they might want to grow to data centers of a gigawatt or more.

Data centers come in different flavors, said Hansen. Some data centers do have flexibility in their need for electricity, while others must respond immediately to needs of their consumers.

Then there is the bring-your-own power approach. The Wall Street Journal article on Oct. 15, ā€œAI Data Centers, Desperate for Electricity, Are Building Their Own Power Plants,ā€ noted the problems of building transmission and other infrastructure.

ā€œTech companies in the AI race need power, and lots of it. They aren’t waiting around for the archaic U.S. power grid to catch up,ā€ reports Jennifer Hlller.

Data centers long took power for granted, a consultant told the Journal. ā€œBut that’s no longer possible given the city-sized amounts of electricity needed to train AI models. One data center can devour as much electricity as 1,000 Walmart stores, and an AI search can use 10 times the amount of energy as a Google search,ā€ Hiller said.

Hence, they have taken to building their own power generating sources, often gas plants.

The downside to that, as Hansen pointed out, is that the data center developers could still need the reliability of the broader grid. ā€œIt’s a balancing act,ā€ he said.

While Hansen in Durango has just started getting inquiries from data center developers, Mark Gabriel, chief executive of Brighton-based United Power, has been fielding inquires for two or three years.

The electrical cooperative covers 900-plus square miles from the foothills of the Rockies to the oil and gas territory of the Wattenberg Field. But it also serves land near DIA as well as along the fast-developing I-76 and I-25 corridors.

As such, United has been getting lots of ā€œtire kickers.ā€ Now, says Gabriel, United actually expects something to come of the talk. Two operators with large load demands have committed to the $650,000 up-front fees, two more are in active negotiations, and several others are talking with United.

ā€œWe anticipate at least one to come to fruition,ā€ said Gabriel.

The 2025 state of the climate report: a planet on the brink — William J. Ripple, et al. (Oxford)

Figure 1. Time series of climate-related human activities. In panel (f),tree cover loss does not account for forest gain and includes loss due to any cause. For panel (h),statistics are based on total energy supply (Energy Institute 2025). Sources and additional details about each variable are provided in supplemental file S1. Credit: The 2025 state of the climate report

Click the link to access the report on the Oxford website. From the report:

August 10, 2025

We are hurtling toward climate chaos.The planet’s vital signs are flashing red. The consequences of human-driven alterations of the climate are no longer future threats but are here now. This unfolding emergency stems from failed foresight, political inaction, unsustainable economic systems, and misinformation. Almost every corner of the biosphere is reeling from intensifying heat, storms, floods, droughts, or fires.The window to prevent the worst outcomes is rapidly closing. In early 2025, the World Meteorological Organization reported that 2024 was the hottest year on record (WMOĀ 2025a). This was likely hotter than the peak of, the last interglacial, roughly 125,000 years ago (Gulev et al.Ā 2021, Kaufman and McKayĀ 2022). Rising levels of greenhouse gases remain the driving force behind this escalation. These recent developments emphasize the extreme insufficiency of global efforts to reduce greenhouse gas emissions and mark the beginning of a grim new chapter for life on Earth.

In this report, we seek to speak candidly to fellow scientists, policymakers, and humanity at large. Given our roles in research and higher education,we share an ethical responsibility to sound the alarm about escalating global risks and to take collective action in confronting them with clarity and resolve. We show evidence of accelerated warming and document changes in Earth’s vital signs. These indicators build on the framework introduced by Ripple and colleagues (2020), who issued a declaration of a climate emergency that has garnered support from approximately 15,800 scientist signatories worldwide. We also examine recent extreme weather disasters and discuss physical and social risks. The final sections of the report include suggested climate mitigation strategies and the broader societal transformations needed to secure a livable future.A summary of key findings is given in boxĀ 1.

Continue reading