Click on a thumbnail graphic to view a gallery of snowpack data from the NRCS. Be cautious about the statewide map, percent of normal is not as meaningful after runoff starts.

Statewide Basin High/Low graph May 22, 2017 via the NRCS.

Upper Rio Grande River Basin High/Low graph May 22, 2017 via the NRCS.

South Platte River Basin High/Low graph May 22, 2017 via the NRCS.

Arkansas River Basin High/Low graph May 22, 2017 via the NRCS.

Gunnison River Basin High/Low graph May 22, 2017 via the NRCS.

Laramie and North Platte Basin High/Low graph May 22, 2017 via the NRCS.

San Miguel, Dolores, Animas, and San Juan Basin High/Low graph May 22, 2017 via the NRCS.

Yampa and White Basin High/Low graph May 22, 2017 via the NRCS.

Upper Colorado River Basin High/Low graph May 22, 2017 via the NRCS.

Statewide basin-filled snowpack map May 22, 2017 via the NRCS.
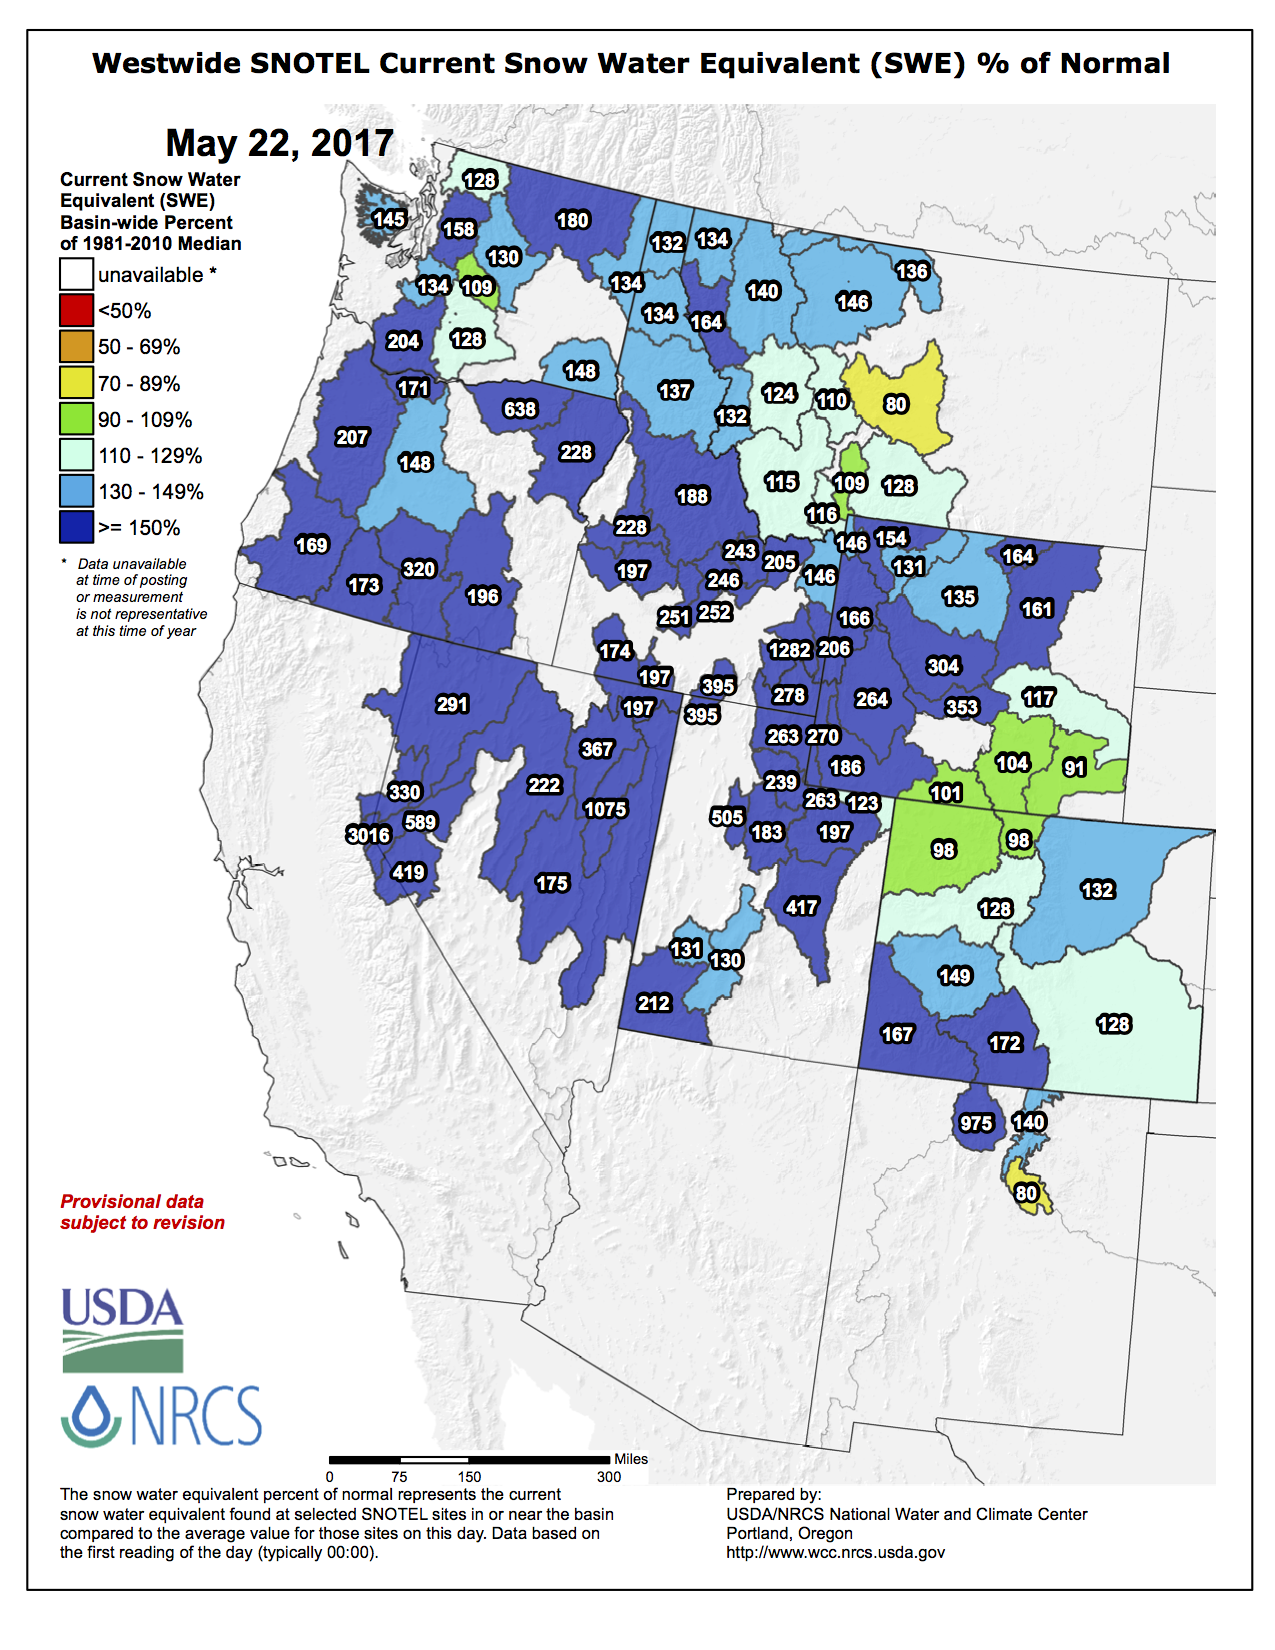
Here’s the Westwide SNOTEL basin-filled map from the NRCS.