#Groundwater True/False Quiz: @USGS Water #Science School


Andrew D. Hwang, College of the Holy Cross
In the U.S., scientists stress that the number of coronavirus cases has been growing exponentially. In ordinary speech, the term “exponential” usually means “really fast.”
To mathematicians like myself, and to scientists and public health officials, the term has a precise and subtly different meaning: A quantity is “exponential” if its rate of change at each point is proportional to the current size.
Let’s explore why the difference matters, and how exponential processes can mislead our perception of risk.
When an exponential quantity is small, its change is slight; when the quantity is large, the change is rapid. Thanks to exponential growth, epidemics start slowly, then balloon with surprising speed.
This pattern presents a distinctive challenge. People intuitively underestimate exponential growth. By the time individuals sense their peril and act, the damage has been multiplied many-fold.
In an epidemic, numerical data and mathematical models are like night-vision goggles, illuminating what cannot be directly perceived.
To a good approximation, viruses spread exponentially in unexposed populations. Each infected individual meets others at random. At each meeting, there is some chance of the virus being transmitted.
The number of new cases in a one-day period – the rate of increase of infection, in individuals per day – is proportional to the number currently infected.
Exponential quantities have a characteristic interval over which the quantity doubles. For illustration, consider an epidemic that doubles daily. If one person is infected today, two are infected tomorrow, four the day after tomorrow, eight the day after that, then 16, 32, 64. After one week, 128. Three days after that, 1,024 are infected.
Let’s flag two items about this example.
First, the number of new cases tomorrow equals the total number of cases today.
Second, 10 doublings, here 10 days, gives a thousand-fold increase in cases.
How many doublings give a million-fold increase? A million is a thousand thousand. It takes 10 doublings for 1,000 to become 1,000,000, 20 days total.
This percentage growth is constant, one doubling per day. In absolute numbers, however, an initial trickle grows rapidly into an uncontrollable flood.
In an epidemic, early action saves lives. Conversely, delay in public health response inflates case numbers exponentially.
The Centers for Disease Control and Prevention and World Health Organization had flagged the coronavirus as a U.S. public health concern by Jan. 21. At that time, there were only a few confirmed U.S. cases. Isolation of the infected and monitoring of their social contacts was technically feasible. Aggressive testing could have better revealed the true number and locations of cases.
Though testing in the first half of March was mostly confined to individuals needing hospitalization, even those numbers show the coronavirus doubling time in the U.S. was at most two and a half days.
Under these conditions, each eight-day delay in public health response translates into roughly 10 times as many cases and deaths as immediate action.
An exponential quantity is characterized by its starting value and its doubling time. By waiting until mid-March to act as a nation, the U.S. lost control over the starting value.
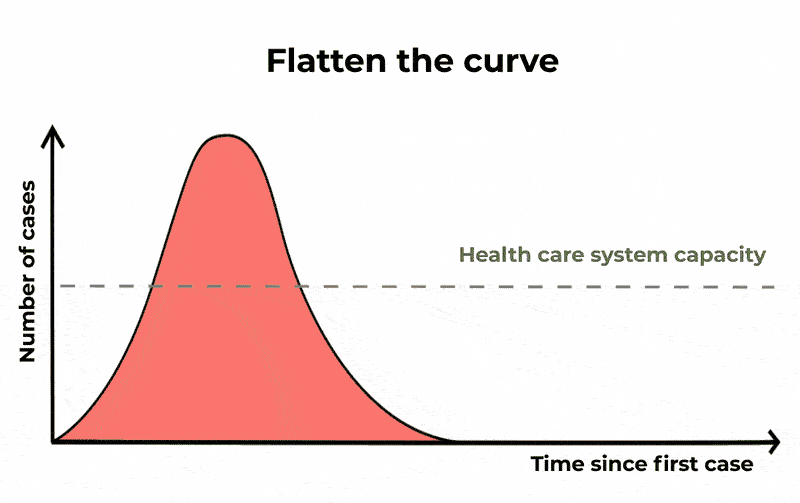
At any stage, however, people can collectively help lengthen the doubling time. Personal hygiene and social distancing effectively reduce viral transmission. Slowing the epidemic “flattens the curve.” The goal is to reduce the maximum number who are hospitalized at any given time and avoid overwhelming the medical system.
There are at least two civic lessons.
We citizens must recognize and respect the creeping-to-explosive nature of exponential growth. Epidemics start small and slowly. The CDC is equipped to detect potential outbreaks in early stages, but it needs the backing of government and the public to fulfill its mission.
Second, we must understand that the public health system undercuts its own public reputation by succeeding. When an epidemic is halted in its early stages, the public seldom knows. The enormous invisible benefits of public health take the form of averted disaster.
[Get facts about coronavirus and the latest research. Sign up for our newsletter.]![]()
Andrew D. Hwang, Associate Professor of Mathematics, College of the Holy Cross
This article is republished from The Conversation under a Creative Commons license. Read the original article.
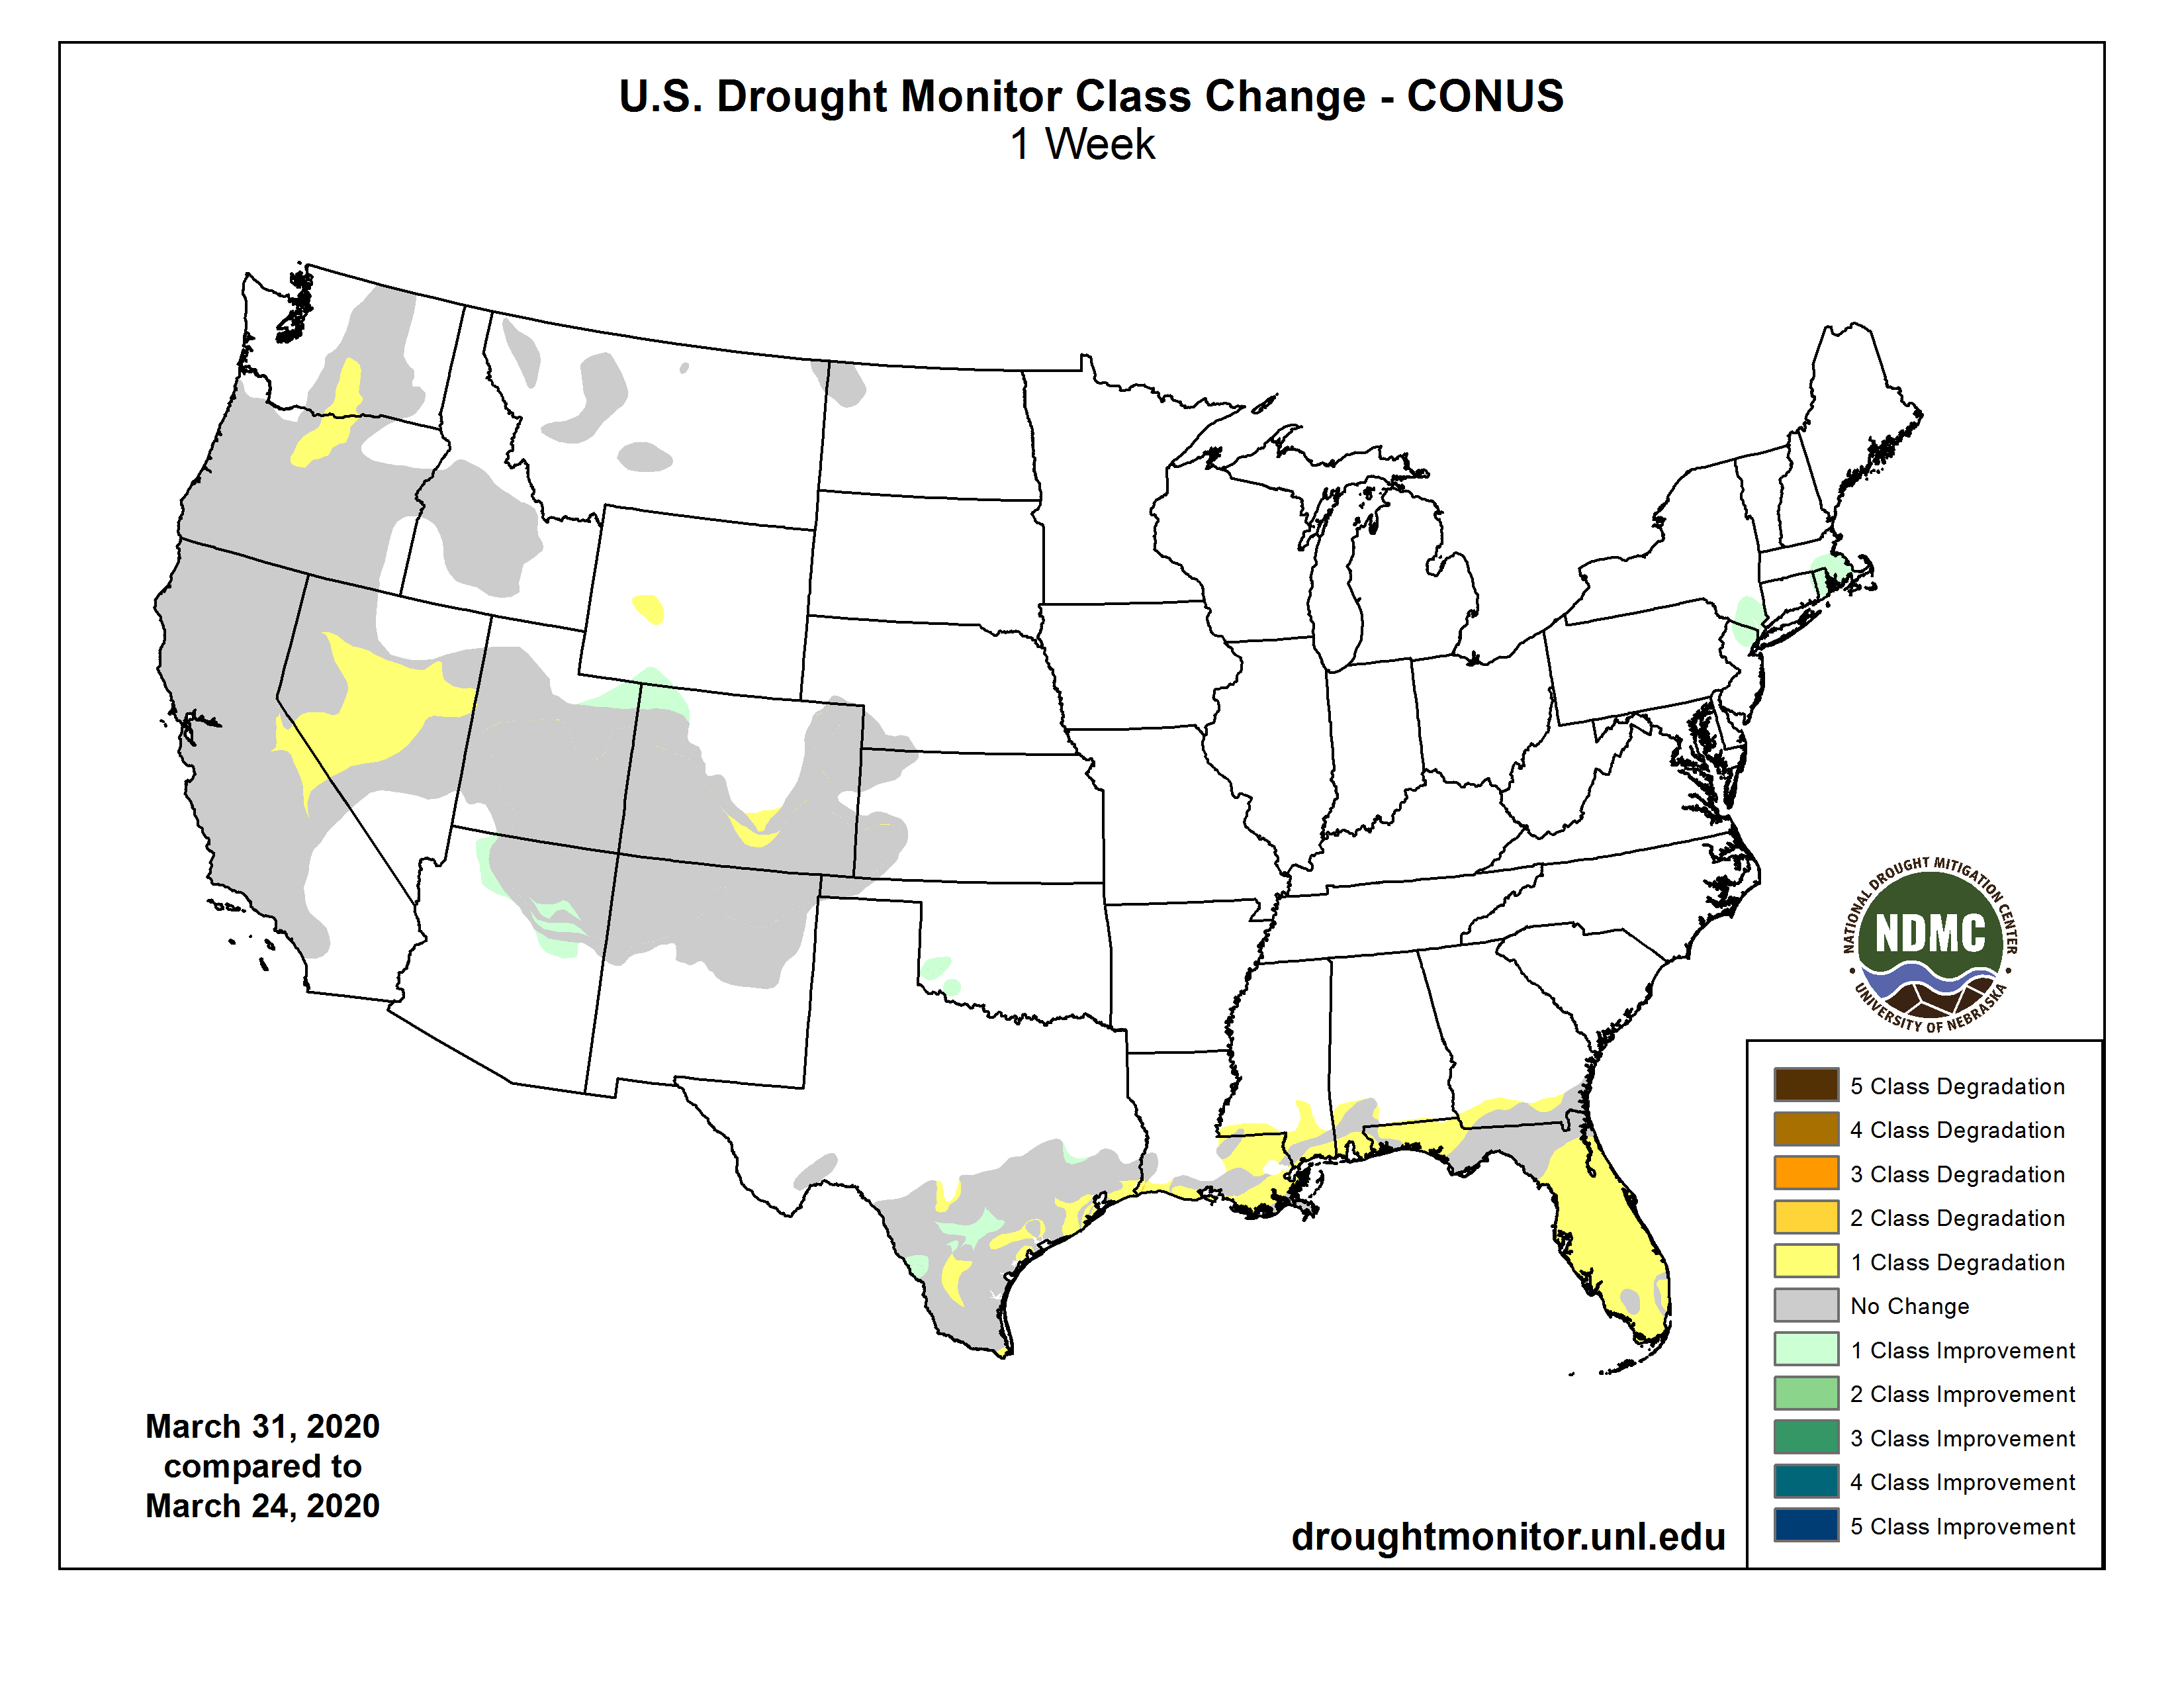
Click on a thumbnail graphic to view a gallery of drought data from the US Drought Monitor.


Click here to go to the US Drought Monitor website. Here’s an excerpt:
This Week’s Drought Summary
This U.S. Drought Monitor week saw an active weather pattern impact various parts of the conterminous U.S.—including the western U.S. which continued to experience below-normal temperatures and snow showers in the mountain ranges of the Pacific Northwest (Olympics, Cascades), California (Northern Coast Ranges, Sierra Nevada), and parts of the Intermountain West (Wasatch, central and northern Rockies). In other parts of the Pacific Northwest, including central Oregon and Washington, drought intensified while improvement in drought-related conditions occurred in the Four Corners of northeastern Arizona. Elsewhere, an outbreak of severe weather, including showers and thunderstorms as well as tornadoes, affected parts of the Midwest and South. Along the Gulf Coast, temperatures were well-above normal with numerous single-day high temperature records broken. In Florida, drought conditions expanded across much of the state after another week of unseasonably warm temperatures and continued dryness with numerous cities across the state experiencing record dryness for the month…
On this week’s map, only minor changes were made in Wyoming where an area of Abnormally Dry (D0) was introduced in response to below-normal snowpack conditions at several NRCS SNOTEL sites in the Wind River Range. Elsewhere, no changes were made on the map. Overall, precipitation for the week was light (generally <1.5” liquid accumulations) with areas of northwestern Kansas, eastern Nebraska, and southeastern South Dakota receiving the greatest accumulations. Average temperatures for the week were mostly above normal (2-to-8 degrees) with greatest positive anomalies observed in northern North Dakota and eastern Kansas while the plains of eastern Colorado and Wyoming were slightly cooler. For the past 30-day period, precipitation was below normal across the Dakotas, eastern Wyoming, southeastern Colorado, and portions of western Kansas, while above-normal precipitation was observed across much of Nebraska, eastern Kansas, and portions of northeastern Colorado…
On this week’s map, areas of drought expanded in north-central Oregon, south-central Washington, central Nevada, and in the central Sierra Nevada of California. Elsewhere in the region, one-category improvements in areas of Abnormally Dry (D0), Moderate Drought (D1), and Severe Drought (D2) were made in northern Arizona where precipitation has been above normal during the past 30-day period. In California, the California Snow Surveys is reporting a statewide SWE percentage of normal of 54% with a regional breakdown as follows: North 57%, Central 58%, and South 45%. Elsewhere in the West, region-level (2-digit HUC) SWE at the end of the month was as follows: Great Basin 91%, Pacific Northwest 107%, Upper Colorado 108%, Lower Colorado 110%, Missouri 113%, Rio Grande 92%, and Arkansas-White-Red 105%. At a basin level (6-digit HUC), below-normal SWE was observed across several basins in Arizona and New Mexico (Salt 29%, Little Colorado 81%, Upper Gila 29%, Rio Grande-Elephant Butte 75%, Upper Pecos 82%) as well as in central Nevada (Central Nevada Desert Basins 78%, Walker 54%, Carson 76%, Truckee 71%) and Oregon (Southern Oregon Coastal 84%, Deschutes 84%)…
On this week’s map, drought-affected areas of southern Texas and the Gulf Coast region of Louisiana and Mississippi saw continued deterioration resulting from the lack of rainfall and abnormally high temperatures. During the past week, a number of daily high-temperature records were either tied or broken across the region — including at the New Orleans International Airport that soared to 89 F on March 25. Along the Gulf Coast region of Louisiana and Mississippi, precipitation deficits (ranging from 3-to-6 inches) for the past 30-day period led to expansion of areas of Moderate Drought (D1). In the South Texas Plains and Gulf Coast Region, hot and dry weather this week led to continued expansion of areas of Moderate Drought (D1), Severe Drought (D2), and Extreme Drought (D3). In far southern portions of the state, temperatures reached the high 90s last week. According to the latest USDA Texas Crop Progress and Condition Report, some failed fields (small grains) in South Texas are being reported because of dry conditions while livestock across the state was rated in fair-to-good condition. In Oklahoma, above-normal precipitation during the past 30-day period led to removal of areas of Abnormally Dry (D0 and Moderate Drought (D1) in southwestern Oklahoma…
Looking Ahead
The NWS WPC 7-Day Quantitative Precipitation Forecast (QPF) calls for moderate-to-heavy accumulations ranging from 1-to-5 inches across central and eastern portions of Texas and slightly lesser accumulations in southeastern Oklahoma, Arkansas, and northern Mississippi. Across much of the Southeast, the dry pattern is forecasted to continue with the exception of northern portions, which are forecasted for light accumulations (1-to-2 inches). In portions of the northern Plains and western portions of the Midwest, generally light accumulations (<1 inch liquid) are expected. Out West, moderate-to-heavy accumulations (ranging from 1-to-4 inches liquid) are forecasted for northern California while western portions of Oregon and Washington are forecasted to receive less accumulation. Across the Intermountain West, liquid accumulations of generally less than one inch are expected for parts of the central and northern Rockies, Uinta, and Wasatch ranges of Utah while the Southwest is expected to be dry. The CPC 6-10-day Outlook calls for a moderate-to-high probability of above-normal temperatures east of the Rockies while areas west of the Rockies are expected to be below normal. In terms of precipitation, there is a moderate-to-high probability of above-normal levels across California and Nevada while there is a low-to-moderate probability of above-normal precipitation across the remainder of the West with the exception of the areas of Colorado and New Mexico where below normal precipitation is expected. Elsewhere, above-normal precipitation is expected (33% to 50% probabilities) across the eastern half of the conterminous U.S. with the exception of Florida where dry conditions are expected to prevail. In Alaska, the northern two-thirds of the state have a high probability of above-average precipitation while the Aleutians, Southcentral, and Southeast should be below normal.
And just for grins here’s an early April look at past US Drought Monitor maps.
From The Grand Junction Daily Sentinel (Dennis Webb):
A 2016 agreement is helping protect Colorado River flows downstream of Glenwood Canyon despite ice jams from the Colorado River shutting down the Shoshone Hydropower Plant in the canyon.
Jim Pokrandt, spokesman for the Colorado River District, a tax-funded agency serving counties within the river basin in western Colorado, said the problem at the plant occurred around March 1. Xcel Energy, the plant’s owner, says it won’t be using Colorado River water at the plant until it is repaired.
The plant’s operations are watched closely by the water community because it has one of the oldest water rights on the river in western Colorado — a 1902 right to 1,250 cubic feet of water per second.
That right has limited the ability of Front Range water users with more junior rights to divert Colorado River water. It helps keep water flowing down-river not just to the plant, but further downstream because the plant’s water use is nonconsumptive, benefiting municipal and agricultural water users, recreational river users and the environment.
However, the river district and regional water users have worried about the potential impacts on the river and water users whenever the aging plant is out of service and not calling for water under its senior right, such as when it requires maintenance.
To address that concern, reservoir operators including the river district, Denver Water and the U.S. Bureau of Reclamation agreed in 2016 to cooperate to maintain river flows at levels mimicking Shoshone’s normal operation, with certain exceptions.
Modified reservoir operations to mimic those flows are now in effect, and will remain so until snowmelt runoff causes the river flow to exceed the current outage protocol target of 1,250 cubic feet per second.
Pokrandt said that among the benefits of protecting flows, more water in the river means lower concentrations of total dissolved solids in the river due to dilution, reducing the need for water treatment by municipal water providers that rely on the river.
Kirsten Kurath, an attorney who represents the Grand Valley Water Users Association, a party to the 2016 agreement, said a big benefit of the Shoshone flows is maintaining flows in what’s known as the 15-mile reach of the Colorado River in Mesa County. Efforts to protect endangered fish in the river focus in part on maintaining adequate flows in that stretch of the river, upstream of the Gunnison River confluence…
While Grand Valley irrigators also have senior water rights on the river, Kurath said the Shoshone water smoothes out the river’s flows, making it easier for irrigators to plan and making water diversions more efficient than when flows are lower. “Everybody downstream always benefits as you keep water in the river,” she said.
The Orchard Mesa Irrigation District and Grand Valley Irrigation Co. are among other parties to the 2016 deal. As of late Monday afternoon, Xcel hasn’t yet said how long the power plant may be out of commission. According to the river district, Xcel has said that the COVID-19 outbreak is complicating repair plans…
The current outage agreement is in effect for 40 years. The river district says it and its West Slope partners are exploring ways to permanently protect the river flows.


From The Grand Junction Daily Sentinel:
The EPA finalized a new standard requiring vehicle fuel economy to increase by 1.5 percent each year, a lower amount than the 5 percent increase put into place during the Obama administration. The rule change creates a uniform federal standard flouting more strict standards like those implemented by California.
[Phil]Weiser said in a statement the regulatory rollback “rejects science” and “will harm public health and air quality.”
“The EPA’s misguided rollback is at odds with the agency’s own science and data, which show that the weaker fuel economy standards will increase air pollution, cost consumers more at the pump, and fail to make the nation’s roads safer,” Weiser said.
Last year, Colorado followed California’s lead in adopting a strict zero emission vehicle (ZEV) standard, which requires at least 5 percent of all vehicles sold in Colorado to be ZEVs by 2023.
Weiser said the EPA’s rule change “threatens to thwart Colorado’s ZEV program, which was implemented to improve air quality, reduce harmful ozone pollution, decrease fuel costs, and increase choices that Colorado customers have when purchasing an electric vehicle.”