Click on a thumbnail graphic to view a gallery of drought data from the US Drought Monitor.
US Drought Monitor November 17, 2020.
West Drought Monitor November 17, 2020.
Colorado Drought Monitor November 17, 2020.
Click here to go to the US Drought Monitor website. Here’s an excerpt:
This Week’s Drought Summary
Heavy precipitation – from 2 to locally near 8 inches – pelted the Carolinas, southern Appalachians, mid-Atlantic region, Pacific Northwest from the Cascades westward, higher elevations of the northern Intermountain West and western Wyoming, northeastern Wisconsin, and Michigan’s Upper Peninsula. Lesser amounts of 0.5 to locally over 2 inches dampened most of a large area from eastern sections of the central and northern Great Plains eastward through the middle and upper Mississippi Valley, Great Lakes Region, Appalachians, and Atlantic Coast States. Similar amounts fell on lower elevations of the northern Intermountain West and Pacific Northwest. Meanwhile, light precipitation at best fell on the central and western Gulf Coast States, most of the Plains, and the Southwest. Meanwhile, temperatures were generally cool in the West and warm in the East. Temperatures average 12 to 15 degrees F above normal from the Carolinas through Alabama. above normal from the High Plains of subnormal temperatures. In contrast, it was 8 to 12 degrees F cooler than normal from Montana southward through Utah, Arizona, the Southwest and the Great Basin. This pattern brought areas of improvement to parts of the Northeast the western Ohio Valley, the northern half of the Mississippi Valley, and northern sections of the Rockies, Intermountain West, and Pacific Northwest. In stark contrast, conditions deteriorated through most of central and eastern Texas, parts of the central Great Plains, the southern High Plains, and the central tier of the Four Corners States. As the period ended, dryness had persisted or worsened throughout the large area of entrenched drought from the Rockies westward, and dry conditions were intensifying quickly across Texas and the central Plains…
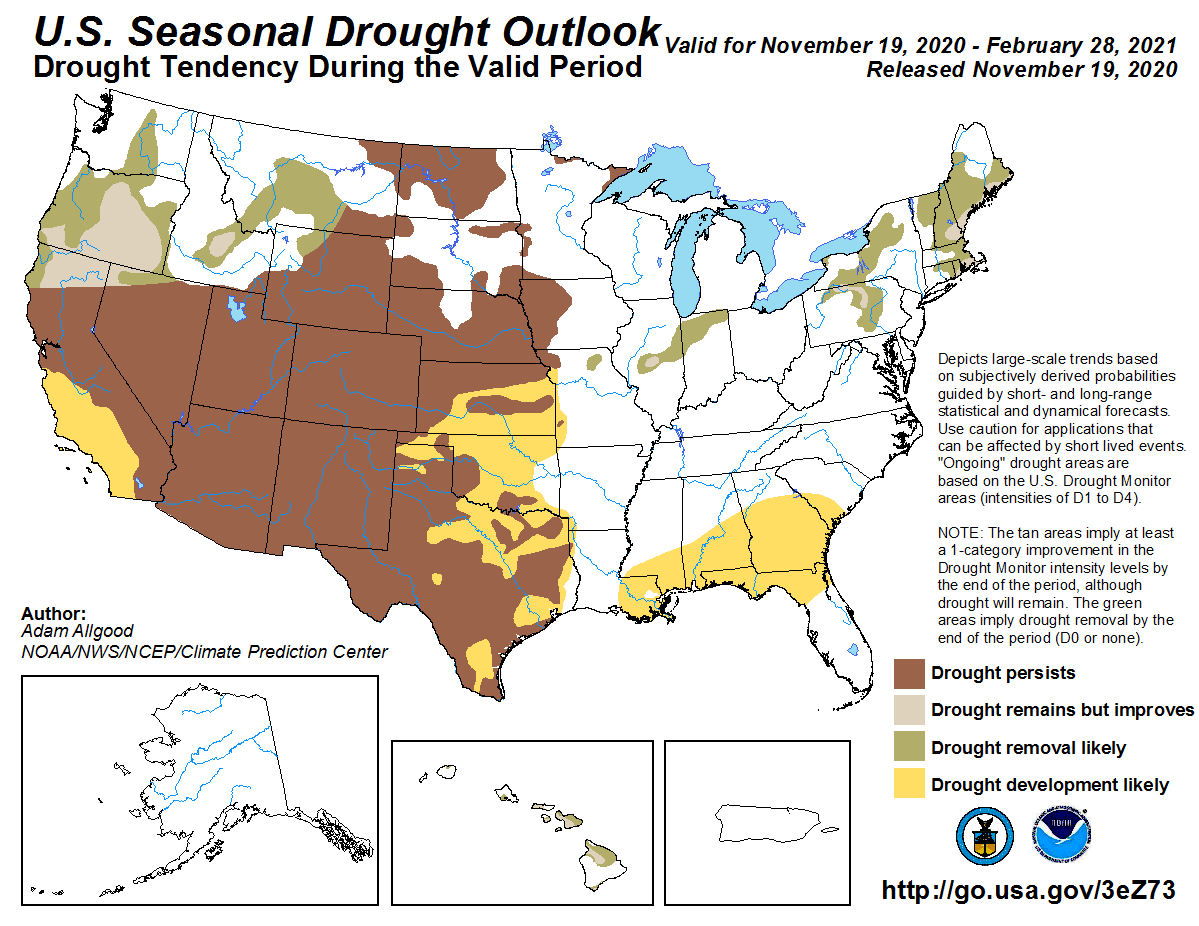
A few inches of precipitation fell on the highest elevations, particularly in western Wyoming. This induced some reductions in drought severity there, but broad areas of extreme to exceptional drought remained across the rest of Wyoming and Colorado, with the most severe classification D4 almost ubiquitous across western Colorado. Farther east, moderate to severe drought persisted across North Dakota, and generally moderate to severe drought stretched over much of Kansas and Nebraska. Conditions deteriorated across most of Kansas, but conditions were more stable farther north…
Exceptional D4 drought now extends across large sections of New Mexico, Arizona, and Utah as conditions intensified along the middle tier of the Four Corners States. In some areas, moisture budget shortages date back to the weak monsoon season of 2018. Across most of Nevada, Utah, and New Mexico, precipitation totals were among the driest 5 percent on record at many locations. Surrounding these areas, a large area of D3 extreme drought extended from New Mexico and Colorado [westward] through most of Arizona and Nevada, and D3 also stretched from northern California northward through a large part of Oregon into southern Washington. This despite patches of improvement from moderate to heavy precipitation in parts of the Pacific Northwest and northern sections of the Intermountain West and Rockies. Dryness has not been as severe along the northern tier of the region compared to areas farther south, and precipitation was sufficient to remove all dryness from central and northern Idaho eastward across western and much of northern Montana…
Dryness and drought expanded and intensified significantly across Texas and adjacent parts of Oklahoma and Arkansas. Since mid-September, precipitation totals were 4 to locally 8 inches below normal across central and northeastern Texas, southern Oklahoma, and adjacent Arkansas. D0 and D1 broadly expanded across central and eastern Texas. Drought is more entrenched farther west in Teas, where many areas near New Mexico declined into D3 and D4 this week. Drought has been entrenched longer here than farther east. In the last half-year, much of western Texas outside the Panhandle received only 15 to 35 percent of normal precipitation…
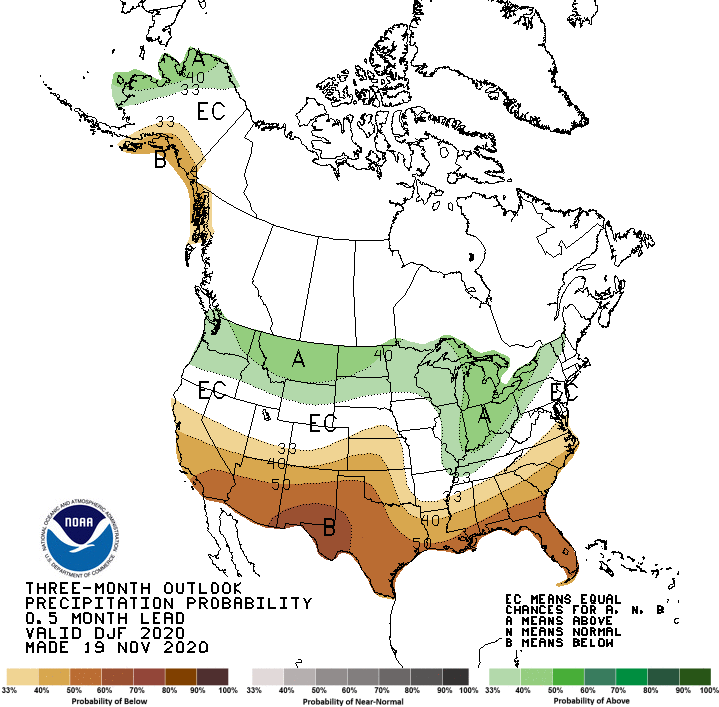
Looking Ahead
Through November 23, 2020, moderate to heavy precipitation should primarily fall on a swath from Kansas and Oklahoma through the lower Great Lakes Region, the Ohio Valley, and upstate New York. Over 1.5 inches are expected across parts of southern Illinois, central Missouri, and southeastern Kansas. Through the rest of the country, amounts over 1.5 inches should be restricted to the northern half of the immediate West Coast and the windward Cascades. Light to moderate precipitation – from a few tenths to about an inch – is forecast in the Sierra Nevada and the higher elevations across Idaho, western Montana, northwestern Wyoming, and central Colorado. Light to moderate precipitation could also fall on Florida’s immediate Atlantic Coast, and a few tenths of an inch should dampen the Northeast. Little or no precipitation is expected elsewhere, including most areas in the West experiencing extreme to exceptional drought. Specifically, a dry week is expected in the Southeast, the Gulf Coast, Texas, the northern Great Plains, the High Plains, lower elevations of the Four Corners States, the valleys of the Pacific Northwest, the Great Basin, and the Southwest. Meanwhile, unusually mild weather will prevail across most of the country. Most areas from the interior Atlantic Coast States through the Rockies should average at least 6 degrees F above normal, with means exceeding 12 degrees F above normal over a large area from the Plains through the Southwest. Only portions of the northern Intermountain West and West Coast can expect near to slightly below-normal temperatures…
The Climate Prediction Center’s 6-10 day outlook (November 24-28) favors subnormal precipitation to continue across most of the Plains, the upper Great Lakes Region, the Rockies, the Four Corners States, the Great Basin, and most of the Southwest. Subnormal precipitation is also favored in northwestern Alaska. Meanwhile, odds tilt toward surplus precipitation in southern Alaska, the Pacific Northwest, from the southeastern Great Plains and lower Great Lakes Region eastward to the Atlantic Coast. Meanwhile, a large part of the country has enhanced chances or warmer than normal weather, including central and western Alaska, the southern Rockies, the Plains, the Ohio Valley, the Southeast, and the mid-Atlantic region. Subnormal temperatures are not significantly favored anywhere in the continental 49 states.
US Drought Monitor one week change map ending November 17, 2020.
COVID-19 cases are surging upward around the U.S., reaching 100,000 daily cases for the first time on Nov. 4 and 150,000 only eight days later. Some believe this increase in reported is a result of increases in testing, as more than 1.5 million tests are performed every day in the U.S. But the evidence is clear that these high numbers reflect a true increase in the number of COVID-19 infections.
Hospitalizations, deaths and test-positivity rates are going up. Taken together, this means that serious COVID-19 illness is on the rise and cases are being undercounted.
Steep increases in hospitalizations and deaths
Rather than being an artifact of changes in testing policy, the rise in cases reflects ongoing transmission and serious illness.
Even as COVID-19 treatments have improved and death rates have fallen, record-breaking levels of hospitalizations are already overwhelming ICUs in many parts of the country. Hospitalizations and deaths will continue to climb even if the surge in new cases abates because the majority of cases are diagnosed before serious illness develops. Today’s new infections will add to the death toll for weeks to come.
These hospitalizations and deaths represent confirmed COVID-19 infections. A COVID-19 diagnosis for hospitalized cases must be justified based on symptoms and test results. COVID-19 is simply the only plausible explanation for ongoing high hospitalization and death rates.
Test positivity is the percentage of all COVID-19 tests for active infection that come back positive. For example, Iowa’s test-positivity rate of 51.7% as of Nov. 17 means that for every 100 COVID-19 tests performed, 51 are positive.
Test positivity tells public health officials whether a testing program is casting a wide enough net to catch the majority of COVID-19 cases.
A high test-positivity rate indicates that the people getting tested are mostly those who have symptoms or think they’ve been exposed to someone with COVID-19. But people can be infected or contagious even if they aren’t showing symptoms. A low test-positivity rate means that access to testing is wide enough to reach large numbers of people who may not know they have the coronavirus. This greatly increases the chances of diagnosing people without symptoms or known exposure who may nonetheless be infected.
The World Health Organization recommends a goal of 5% test positivity or less, but test-positivity rates in many parts of the U.S. are well above that. As of Nov. 17, 44 states had test-positivity rates above 5%, meaning their testing programs were not casting a broad enough net and were likely missing many undiagnosed cases.
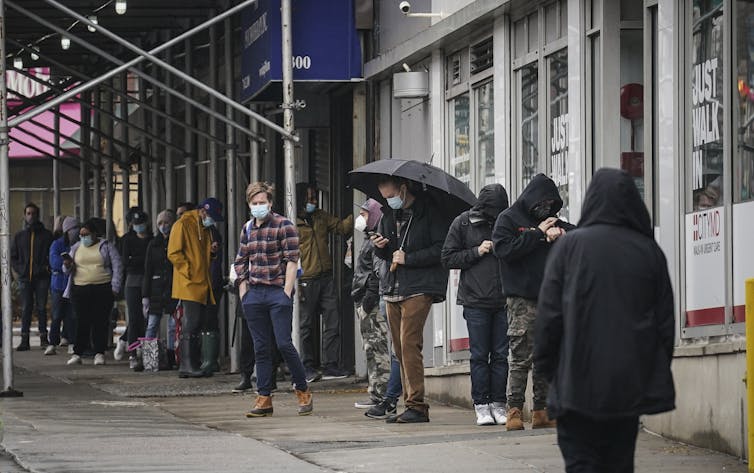
Hospitalizations and deaths are also rising, though they lag behind increases in diagnoses. AP Photo/Mary Altaffer
Things are worse than they seem
The data on hospitalizations, deaths and test positivity clearly show that the worst of the surge is yet to come. High test-positivity rates mean the current confirmed case numbers are undercounting total cases.
A test-positivity rate above 25%, as is the case in several states, implies there may be more than 10 times as many cases in the population as have been diagnosed. Many of these undetected cases may be contagious even though they have no symptoms, which further contributes to the spread of the virus. Considering the lag between new cases and hospitalization or death, the current surge does not bode well for the coming winter.
The record-breaking surge in COVID-19 cases and hospitalizations around the U.S. represents a true increase in infections and serious illness rather than an increase in testing. In fact, high test-positivity rates show that cases are undercounted because of limited access to testing. Hospitalizations and deaths will continue to rise in the weeks ahead.
Overstretched testing programs remain a weak link in the U.S. pandemic response. Diagnosing cases – and catching them as early as possible – will help cut off transmission chains of the deadly virus. When people learn they’re infected, they’re more likely to take necessary precautions to avoid exposing family, friends and others to the virus. Contrary to what some ill-informed people may be saying, the U.S. should be expanding access to testing to curb the spread of COVID-19. More testing would actually be a crucial step toward finally getting the virus under control.
Here’s the release from Colorado State University (Katie Courage):
The ski slopes of the Rocky Mountain West are facing new challenges as a shifting climate brings shorter winters and more severe droughts.
Few people, of course, are more aware of this than those in charge of running these ski resorts. But new research by the Colorado State University-based Colorado Climate Center found that these same ski managers often lack the tools and information to integrate the latest and most local climate data into operations and in planning for a successful future.
The interdisciplinary center, which is housed in the Department of Atmospheric Science at the Walter Scott, Jr. College of Engineering, recently conducted in-depth interviews with 21 ski area managers and critical staff members from 11 Rocky Mountain ski resorts, including seven in Colorado, about their use of climate data.
“Many ski areas we talked to recognized that they were doing the bare minimum and there was so much more to be learned,” said Natalie Ooi, an assistant professor in Warner College of Natural Resources’ Department of Human Dimensions of Natural Resources. “They are hungry for this information to best position their business, and their communities, to address climate change for the sustainability of the destination.”
Snow depth, lift operations, avalanche mitigation, overnight temperature. Ski area managers have a lot of moving pieces to worry about to keep their resorts running smoothly and safely each day. So it’s no surprise that most managers have little bandwidth to integrate complex climate modeling and projections in their already hectic jobs.
In their research with ski area operators, the Climate Center team, which is also supported by the Colorado State Agricultural Experiment Station, found that “climate data, whether historical climate averages or future climate model projections, were generally beyond the planning ranges of most decision makers,” said Trevor Even, a Ph.D. student in the Department of Anthropology and Geography in the College of Liberal Arts.
That doesn’t mean the mountain resorts aren’t taking general climate-preparedness steps. Aware that winter temperatures are steadily rising and precipitation patterns are changing, essentially every ski resort in the United States now incorporates some sort of artificial snow-making to help ensure enough of the powdery stuff for visitors. Many are shoring up these efforts by buying additional water rights and creating water storage facilities. They are also buffering against fluctuating oil prices for this energy-intensive work by shifting to renewable energy sources, including solar, wind, and hydroelectricity.
Additionally, some resorts are working to mitigate risk from wildfires and changes in forest health. They are also investing heavily in fall and summer attractions to diversify revenue streams.
And they are learning about weather and climate as they go. “They have become – often self-taught – weather experts in their local mountain environment,” said Ooi, who is also the program coordinator of the Ski Area Management program. “However, many are unaware, beyond general climate change studies and data, of the kinds of changes they can expect to see – and therefore plan for – at the local level.”
Even agreed, adding that, “even for those few resorts and companies that were looking out to the long-term horizon, climate change was treated more as a generalized issue, without much time being put into understanding the local-scale implications.”
How the Colorado Climate Center can help
Becky Bolinger. Photo credit: Colorado State University
The Colorado Climate Center is tasked with providing climate services and support to the state.
“We already have long-standing relationships with the agricultural and municipal water sectors, but we have had more limited relationships with recreation,” like the ski industry, said Becky Bolinger, the assistant state climatologist for Colorado. “We have a wealth of climate information to share, and the ski industry is particularly sensitive to climate variability.”
So they saw an opportunity to help.
Newly informed by their conversations with the ski industry managers, the Climate Center team is now working to create a dashboard to bring together key weather and climate forecasting – tailored specifically for winter mountain recreation businesses. Bolinger noted that her group is also on hand to help ski areas make sense of climate data.
These conversations also help Bolinger and her colleagues find out what more they can do. “Sometimes it helps us identify gaps between what the ski area managers want and what is currently available.”
The sharing goes both ways. Ski resorts have been collecting extremely detailed slope-side weather information for decades. This sort of granular data could go a long way in making weather forecasting and climate modeling more accurate for these niche locations. This will help scientists “understand how high elevation, topographically complex areas fit into the overall weather and climate data picture – because these areas have been notoriously difficult to provide accurate predictions and modeling outputs for,” Even said.
Filling in these gaps in forecasting will be a big help, Ooi added, because “many ski areas acknowledged a difference between what they see out their window on the mountain versus what the weather forecasts say for their region or nearby town.”
Deepening these lines of communication can also help “develop a foundation of trust between those generating information and those receiving it,” Even said.
It will also help resort managers make a case to their directors or shareholders for the smartest preparations to weather the near- and long-term changes, “such as bigger investments in forest management and wildfire mitigation,” Even noted. “More importantly, ski areas can play a huge role in helping the broader population understand changes that are already occurring locally – and what sort of cherished experiences and places are at stake when we’re thinking about the real impacts of climate change,” he said.
This partnership work can also reassure people that Rocky Mountain skiing has a future.
“The surprise is that many ski areas are more vulnerable to the public perception of drought and climate change impacts” than the changes themselves, Bolinger said. “This is an opportunity to share with people what the ski industry is doing to tackle these issues – and also to communicate that this industry is resilient and, with proper planning, can continue to be successful in the midst of a changing climate.”