#Drought news April 3, 2025: In areas of southwestern and south-central #Colorado, degradations were made on the map where snowpack conditions at numerous NRCS SNOTEL stations are reporting well below-normal SWE levels.

Click on a thumbnail graphic to view a gallery of drought data from the US Drought Monitor website.

Click the link to go to the US Drought Monitor website. Here’s an excerpt:

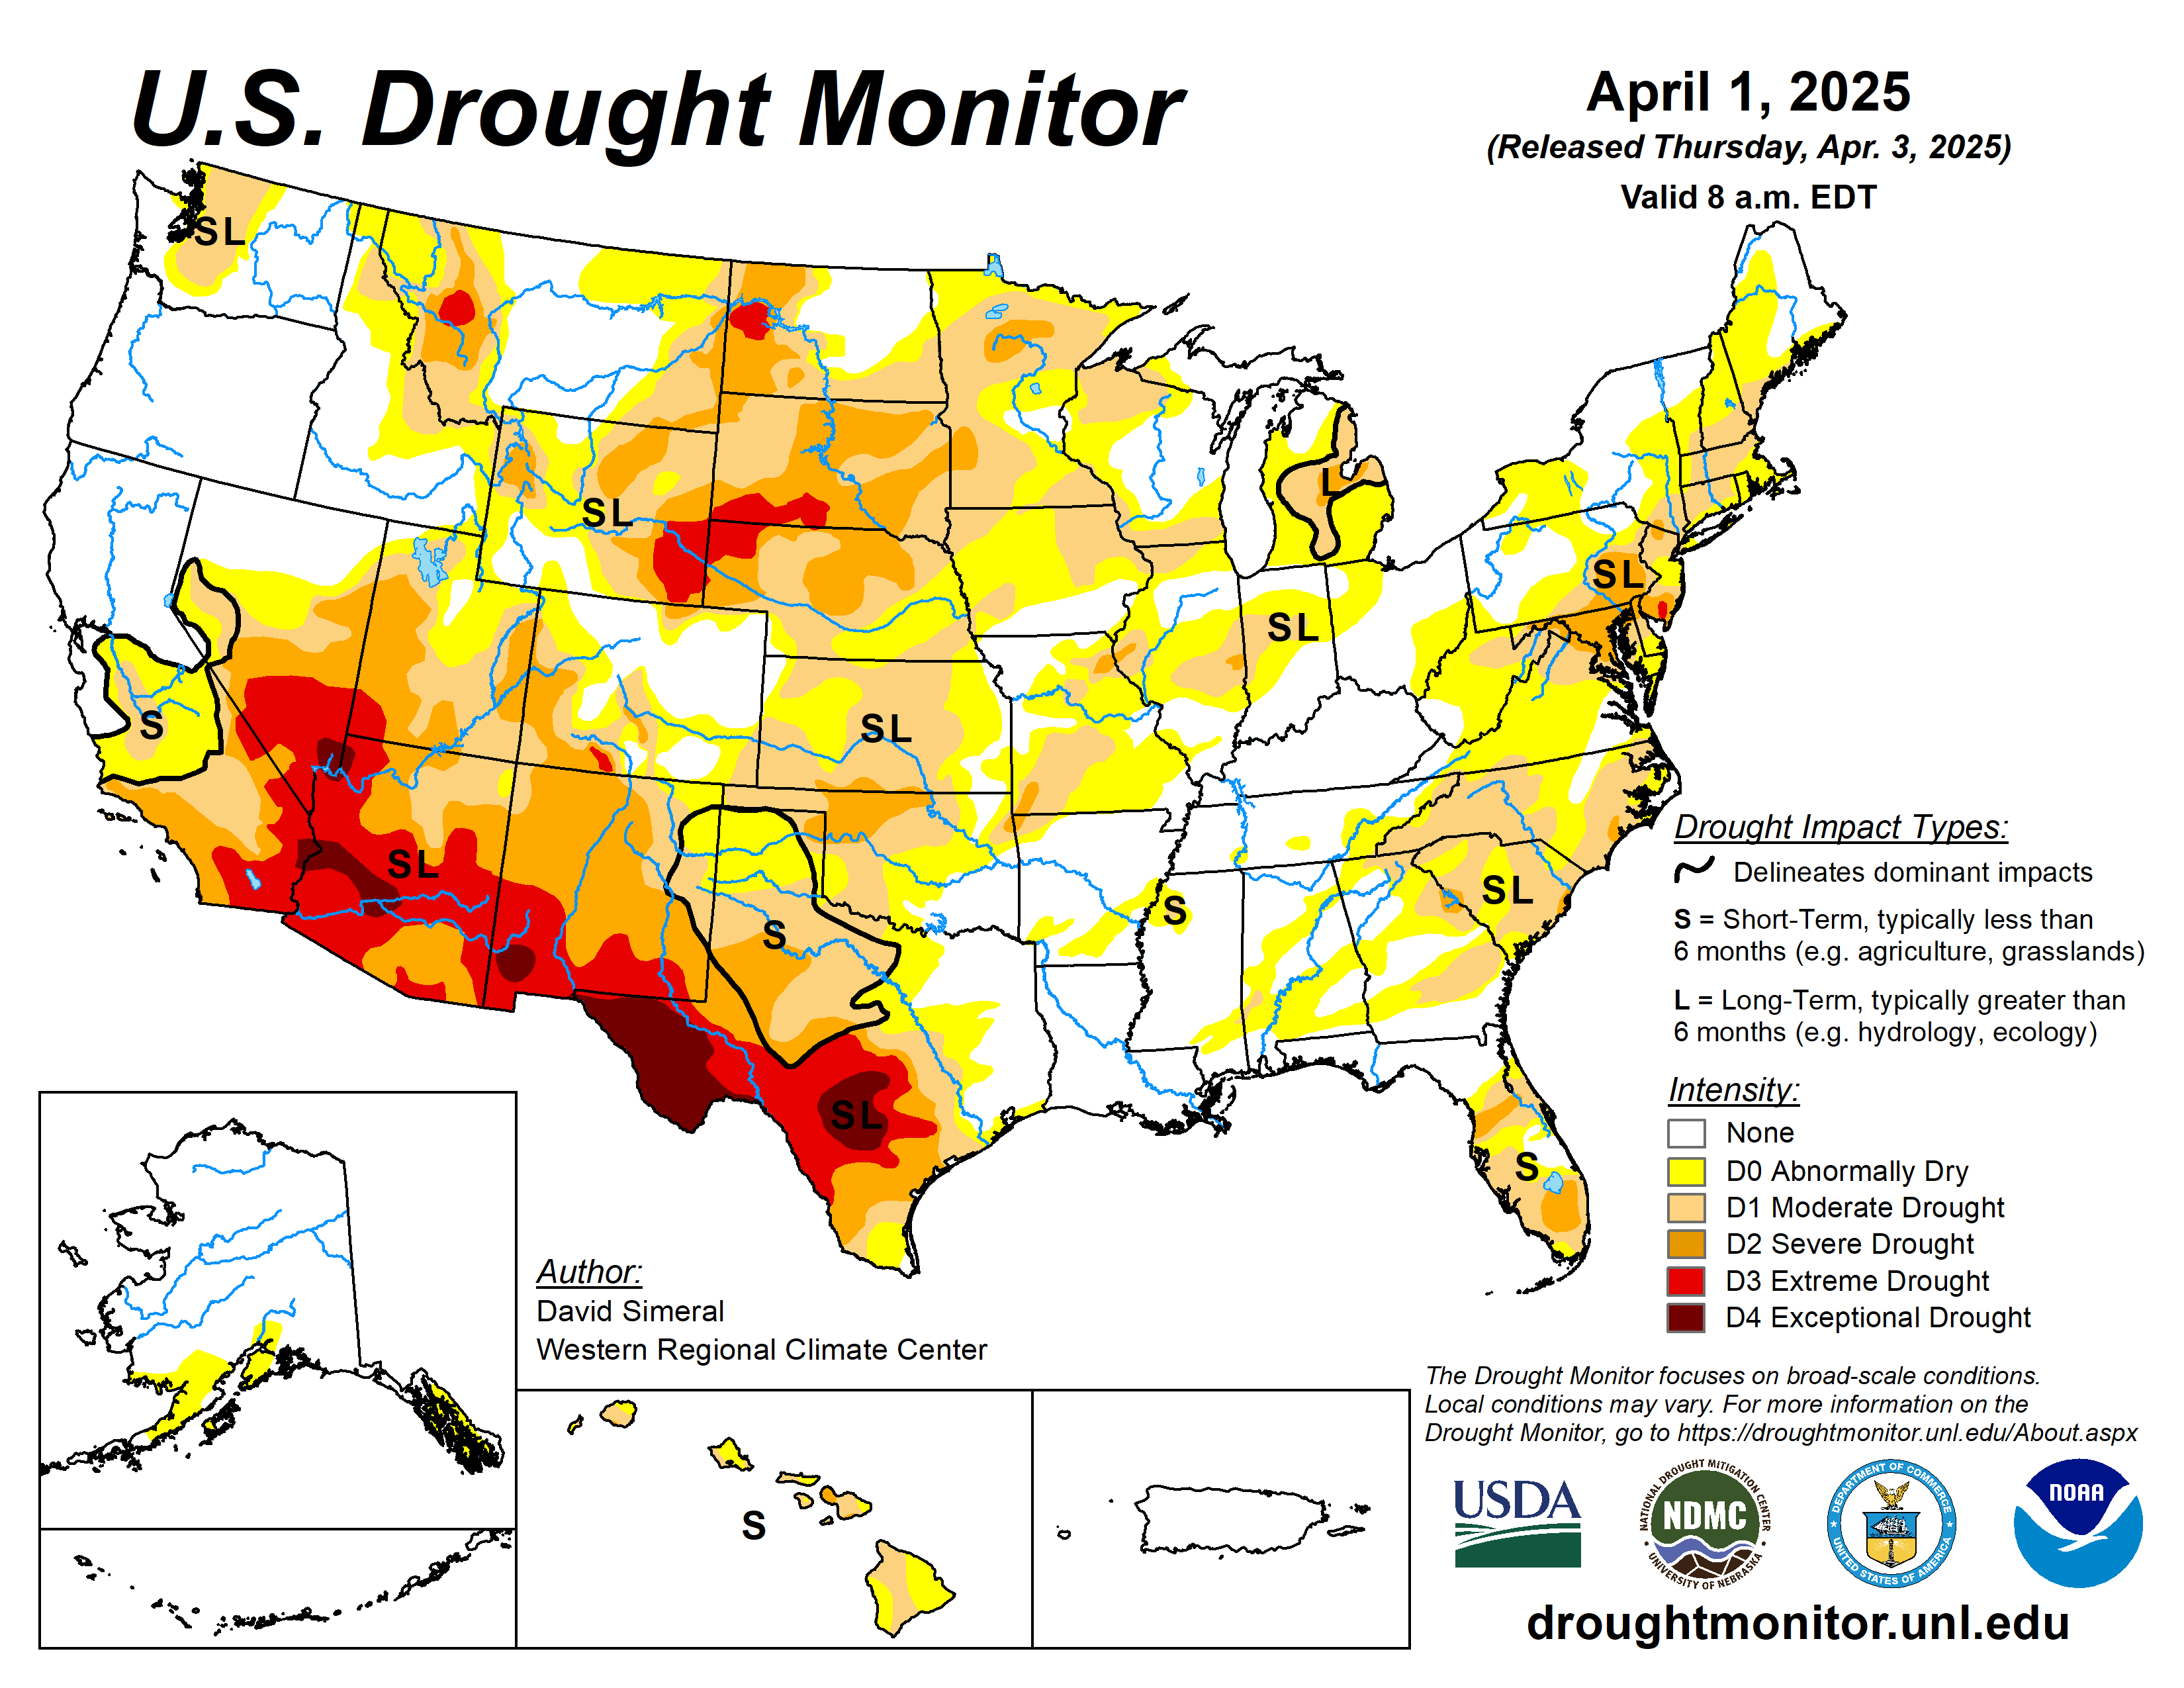
This Week’s Drought Summary

This U.S. Drought Monitor (USDM) week saw improvement in drought-related conditions across areas of the Intermountain West, High Plains, South, Upper Midwest, and Southeast. Meanwhile, conditions degraded on the map in the Southwest, Lower Midwest, and the Mid-Atlantic. Out West, a series of Pacific storms delivered significant rainfall to the lower elevation coastal areas and heavy mountain snow in the Klamath Mountains, Cascades, and Sierra Nevada ranges, as well as to the higher elevations of the Great Basin and the central and northern Rocky Mountains. In the coast ranges of Northern California, 7-day rainfall totals exceeded 10+ inches in some areas, according to preliminary data from the National Weather Service (NWS) California-Nevada River Forecast Center. The series of storms provided a late-season boost to mountain snowpack levels including in California, where the statewide snowpack (April 1) was 96% of normal, according to the California Department of Water Resources. In the Southwest, drought expanded and intensified across areas of southeastern and northeastern Arizona, northeastern New Mexico, and southwestern Colorado, where snowpack levels are below normal in the San Juan and Sangre de Cristo ranges. In the South, southern Texas received record-breaking rainfall (12+ inches) leading to widespread improvements in drought-related conditions. In the Upper Midwest, an ice storm impacted northeastern Wisconsin and northern Michigan, leading to widespread power outages. Precipitation from the storm event led to improvements on the map in those areas. In parts of the Northeast, some improvements occurred in response to a combination of factors, including normal to above-normal precipitation (past 30-60 days), increased streamflows, and some recovery in groundwater levels. In the Southeast, short-term dryness expanded areas of drought from North Carolina to Georgia, while Florida saw some minor improvement in drought conditions in response to recent rainfall events.

In terms of reservoir storage in areas of the West, California’s reservoirs continue to be at or above historical averages for the date (April 1), with the state’s two largest reservoirs, Lake Shasta and Lake Oroville, at 113% and 121% of average, respectively. In the Southwest, as of March 31, Lake Powell is 32% full (55% of typical storage level), Lake Mead is 34% full (54% of average), and the total Lower Colorado system is 41% full (compared to 42% full at the same time last year), according to the U.S. Bureau of Reclamation. In Arizona, the Salt River Project is reporting the Salt River system reservoirs 72% full, the Verde River system 53% full, and the total reservoir system 70% full (compared to 89% full one year ago). In New Mexico, the state’s largest reservoir along the Rio Grande is currently 14% full (30% of average). In the Pacific Northwest, Washington’s Franklin D. Roosevelt Lake is 81% full (148% of average for the date), Idaho’s American Falls Reservoir on the Snake River is 96% full (108% of average), and Hungry Horse Reservoir in northwestern Montana is 72% full (108% of average)…

High Plains

On this week’s map, only minor changes were made in the region, namely in western Nebraska and areas of Kansas. In the Sand Hills of Nebraska, precipitation during the past 7-day period (1 to 2 inches) led to 1-category improvements in areas of Severe (D2) and Extreme (D3) drought. In Kansas, short-term dry conditions (past 30-60 days) led to the expansion of isolated areas of drought in the southwestern and northeastern parts of the state. Generally dry conditions prevailed across much of the region for the week, with some small accumulations (0.5 to 1 inch liquid) observed in southern and eastern South Dakota, northern Nebraska, and southeastern Kansas. In terms of temperatures, near-normal average temperatures were logged across the region…
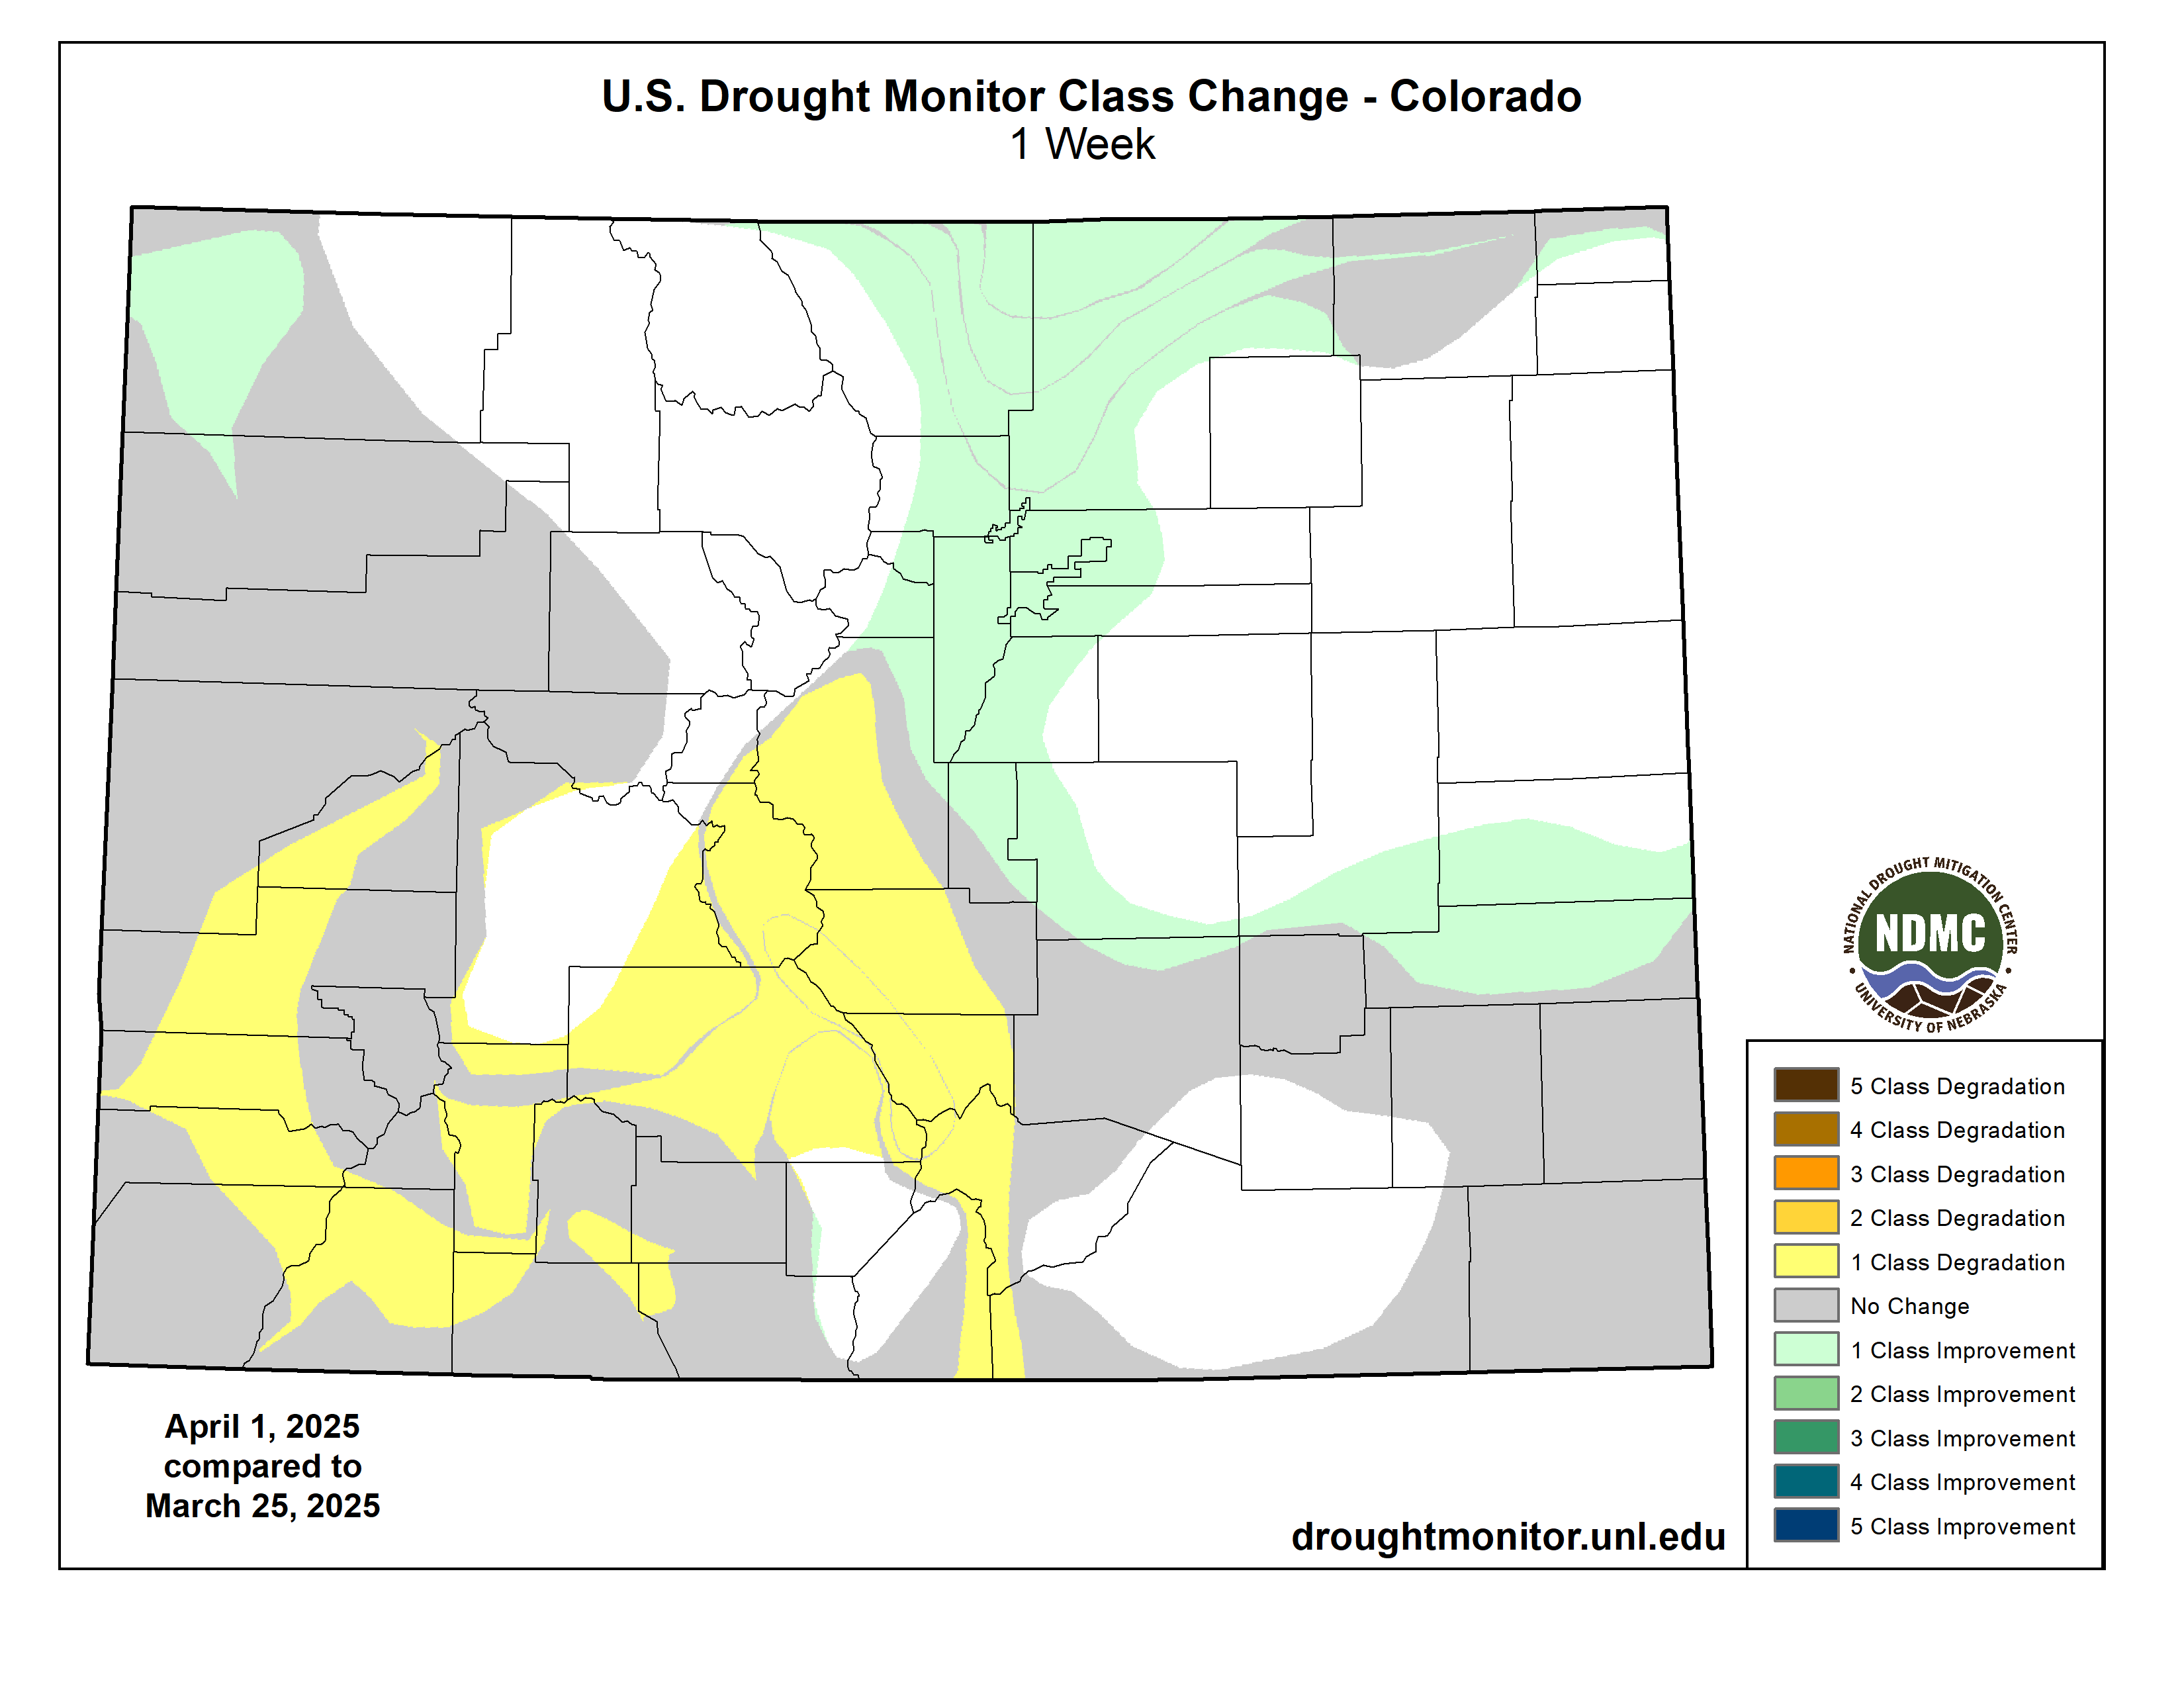
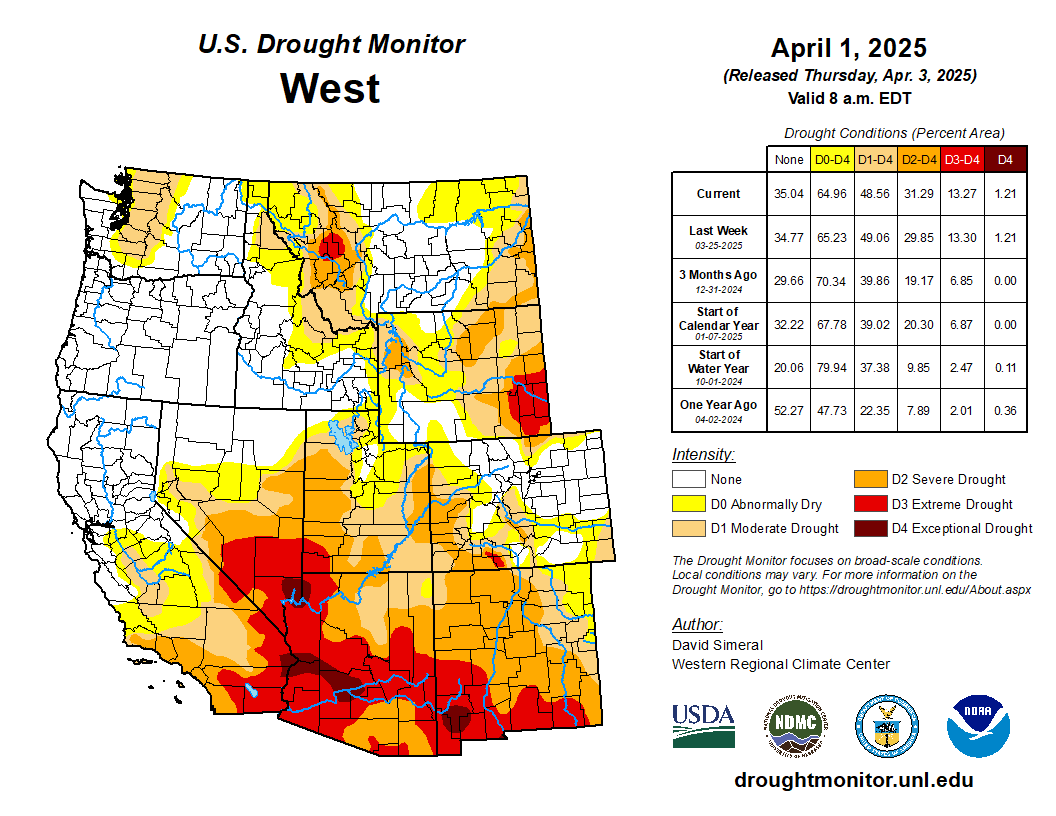
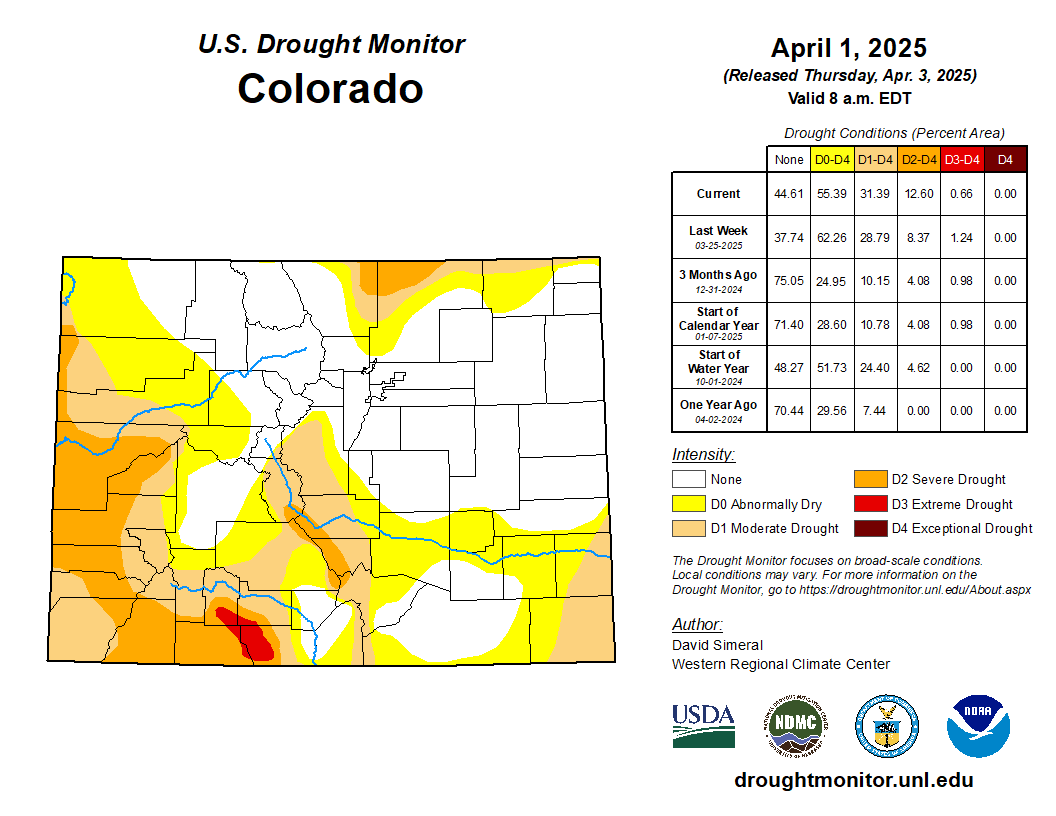
Colorado Drought Monitor one week change map ending April 1, 2025.

West

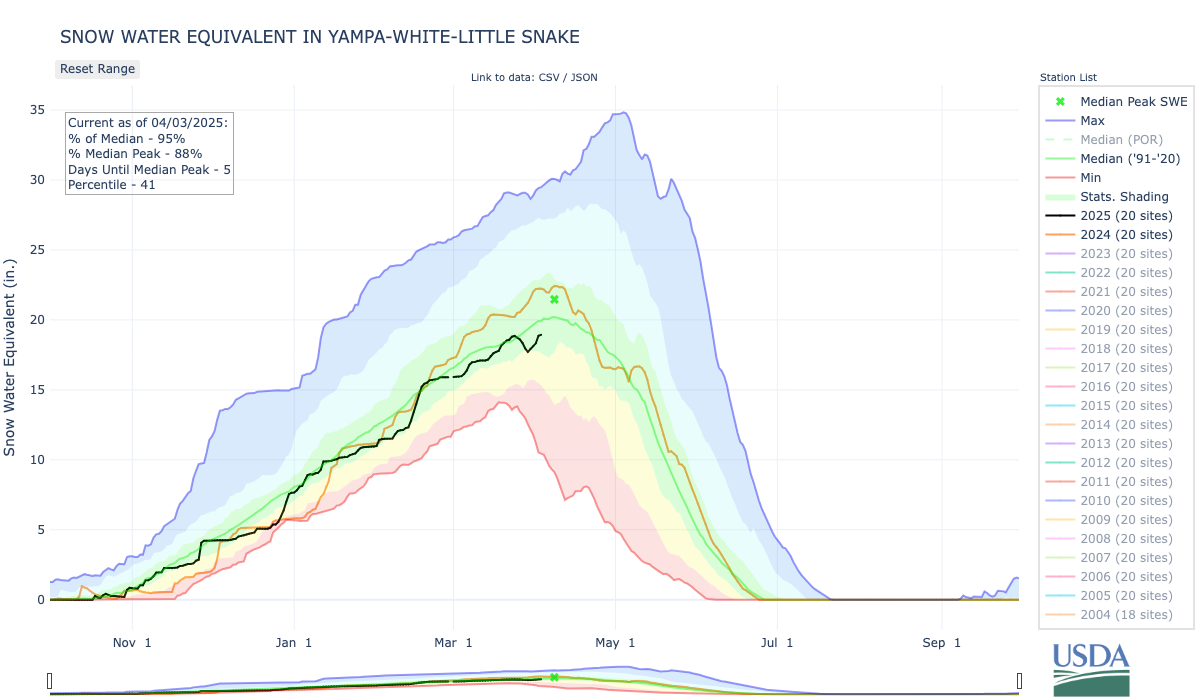
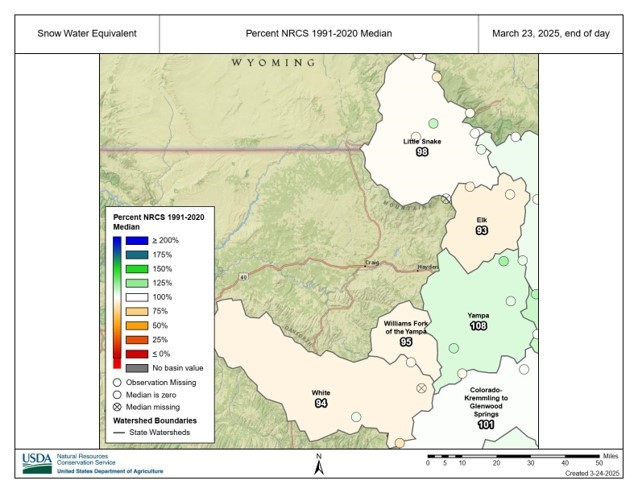
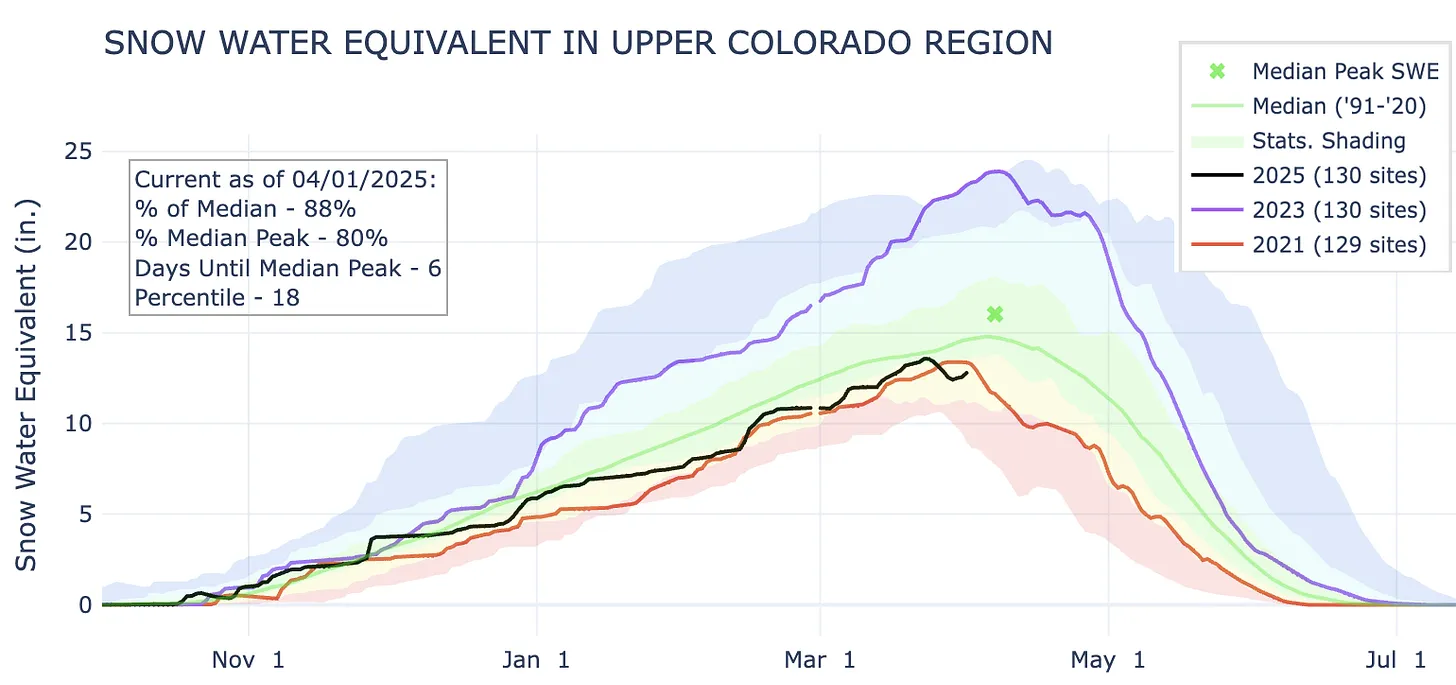
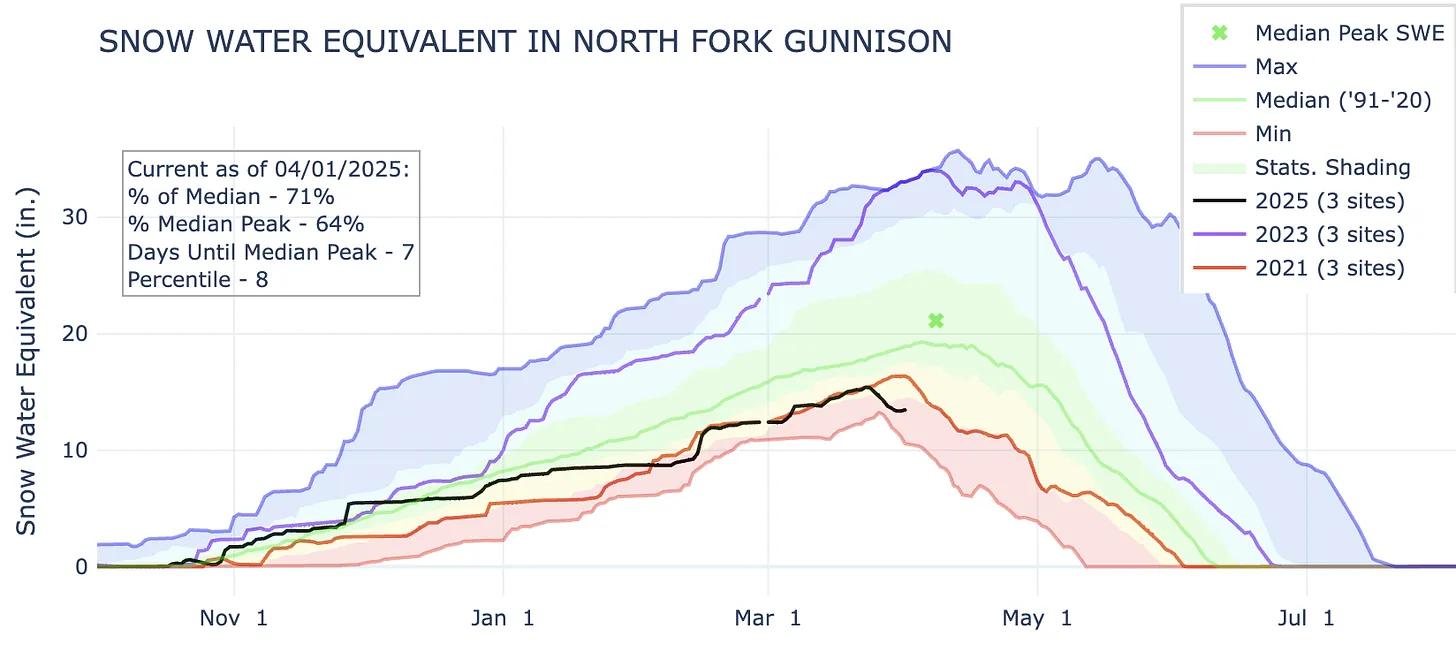
Out West, a series of Pacific storms delivered heavy rain to the lower elevations and snow to the higher elevations of the Pacific Northwest and Northern California. In the Lake Tahoe area, 7-day snowfall totals ranged from 1 to 2+ feet, while areas of the Klamath Mountains of northwestern California received totals up to 3 feet. Other mountain regions, including the Cascades of Oregon, the Wasatch and Uintas of Utah, and the northern Rockies, received accumulations ranging from 6 to 24 inches. Looking at the regional snowpack, the NRCS SNOTEL network is reporting (April 1) the following region-level (2-digit HUC) SWE levels: Pacific Northwest 104%, Missouri 98%, Upper Colorado 89%, Great Basin 103%, Lower Colorado 49%, and Rio Grande 49%. In the Desert Southwest, areas of Extreme Drought (D3) expanded in northeastern and southeastern Arizona in response to very low streamflows and below-normal precipitation since the beginning of the Water Year (Oct 1). In areas of southwestern and south-central Colorado, degradations were made on the map where snowpack conditions at numerous NRCS SNOTEL stations are reporting well below-normal SWE levels. Likewise, poor snowpack conditions have been observed in the mountain ranges of southern Utah, northern Arizona, and northern New Mexico…

South

Generally dry conditions prevailed across areas of the region including Oklahoma, western Texas, Arkansas, and southern Mississippi. Conversely, the Gulf Coast regions of Texas and Louisiana received very heavy rainfall in some areas (5 to 15 inches based on radar estimates), with the highest accumulations observed along the southern Gulf Coast region of Texas and the South Texas Plains. The deluge of rainfall led to life-threatening flooding and loss of lives. The rains also led to significant improvements in drought-related conditions, with multiple category improvements made on the map. In contrast, short-term dry conditions continued in Arkansas, although heavy rains are expected to impact the state over the next week. For the week, average temperatures were well above normal, with anomalies ranging from 4 to 10+ degrees F. Looking at reservoir conditions in Texas, statewide reservoirs are reported to be 75.3% full, with many reservoirs in the eastern part of the state in good condition, while numerous reservoirs in the western portion of the state continue to experience below-normal levels, according to Water for Texas (April 2)…

Looking Ahead

The NWS Weather Prediction Center (WPC) 7-Day Quantitative Precipitation Forecast (QPF) calls for moderate-to-heavy precipitation accumulations ranging from 3 to 10+ inches (liquid) across areas of the South, Lower Midwest, and the Pacific Northwest (Washington), with the heaviest accumulations expected in the Middle Mississippi Valley and Ohio River Valley regions. Light-to-moderate accumulations are expected in areas of the Southeast, Mid-Atlantic, Upper Midwest, and central and southern Plains. In the central and southern Rocky Mountains, mountain snowfall is expected. The Climate Prediction Center (CPC) 6-10-day Outlook calls for a moderate-to-high probability of above-normal temperatures across the Western U.S. and Plains, while below-normal temperatures are expected across the Midwest and Eastern Tier. In terms of precipitation, there is a moderate-to-high probability of below-normal precipitation across most of the West, Plains, South, and the Midwest. Elsewhere, above-normal precipitation is expected across the Eastern Seaboard and in the Pacific Northwest (Washington).

US Drought Monitor one week change map ending April 1, 2025.

Feds unfreeze $50M grant for #GreatSaltLake projects ahead of uncertain #runoff: Lake should get a boost again this year, conservation experts say — The Deseret News

Figure 1. A bridge where the Bear River used to flow into Great Salt Lake. Photo: EcoFlight.

Click the link to read the article on The Deseret News website (Carter Williams). Here’s an excerpt:

March 26, 2025

Water levels at the Great Salt Lake’s southern arm remain a foot below where they were this time last year as the gap between it and its northern arm shrinks. The state agency tasked with managing the massive body of water is hopeful for a good spring runoff from a “remarkably average” snowpack collection season that’s nearing an end.

“We are sitting … better than I would have expected (with) where we were a month ago,” Great Salt Lake Commissioner Brian Steed said as he provided an update on lake conditions to reporters on Tuesday. “We’ve just had … a ‘miracle’ March, and we’re happy to have that ‘miracle March’ and get water levels back up where they need to be.”

The Great Salt Lake’s southern arm is now up to 4,193.3 feet in elevation, per U.S. Geological Survey data; its northern arm is at 4,192.4 feet in elevation. While the southern arm is a foot below its level this time last year, the northern arm is up about 1½ feet because more water has flowed into it since last year. It’s expected to receive a boost from the basin’s snowpack, which is up to 18.6 inches of snow-water equivalent, about 95% of its annual median average, according to the Natural Resources Conservation Service. At least one more storm is projected later this week, while long-range outlooks also favor a wet start to April, which could elevate the basin to its third straight above-normal season.

The conservation service estimates the lake will rise another 0.5 to 1.5 feet this spring, but several variables could factor into how much…On the other hand, the lake could also receive another boost from controlled releases. Utah’s reservoir system remains 82% full — about a percentage point higher than last year and well above normal before the spring snowmelt — which means there’s less water needed from spring runoff to refill the system.

A federal funding freeze is causing delays on a #BlueRiver habitat restoration project in Silverthorne — Summit Daily

Map of the Blue River drainage basin in Colorado, USA. Made using USGS data. By Shannon1 – Own work, CC BY-SA 4.0, https://commons.wikimedia.org/w/index.php?curid=69327693

Click the link to read the article on the Summit Daily website (Ryan Spencer). Here’s an excerpt:

March 29, 2025

While a federal judge has ordered the Trump Administration to unfreeze federal funds, the National Council of Nonprofits says its continues to receive reports of nonprofits struggling to access federal grant money

habitat restoration project aimed at restoring Gold Medal fishing status along a stretch of the Blue River that flows through Silverthorne is being impacted by a federal funding freeze. The Blue River Watershed Group — a local nonprofit that received $1.8 million in grant federal funding for the restoration project in December 2023 — told the Silverthorne Town Council earlier this month that the federal government has paused disbursement of those funds.

“Grant funding for this project through the Bureau of Reclamation’s WaterSMART Aquatic Ecosystem Project grant is affected by the recent pauses in federal grant funding,” Blue River Watershed Group executive director Vanessa Logsdon said in a statement Thursday, March 28.

The Blue River Watershed Group has partnered with Trout Unlimited and the town of Silverthorne, which has provided $150,000, on the project. The $1.8 million federal grant is to complete the engineering and design for the habitat restoration project, which focuses on the stretch of the Blue River from the Dillon Reservoir to the Columbine Campground north of Silverthorne. Studies have shown that that stretch of river is impacted by unnatural temperatures from dam releases that can be too warm in the winter and too cold in the summer, disrupting the life cycles of aquatic organisms such as trout. The project aims to get the Blue River back to a more natural cycle and restore the Gold Medal fishing status that stretch of river lost in 2016.

Predictions for 2025 river flows, reservoir levels slightly below last year — Steamboat Pilot & Today #snowpack #runoff

Click the link to read the article on the Steamboat Pilot & Today website (Suzie Romig). Here’s an excerpt:

March 27, 2025

State officials at the Division of Water Resources office in Steamboat Springs are predicting river flows and reservoir levels — which are key for agricultural, municipal and recreational uses — to land this year slightly below conditions of 2024. That means, based on current snowpack and water supply forecasts, the water season for 2025 should land about in the middle, or at median, of the past 34 years of record keeping of water flows down the Yampa River, said William Summers, water resources assistant division engineer in Steamboat…

Last year, Stillwater, Yamcolo, Stagecoach, Fish Creek and Elkhead reservoirs all filled to capacity. However this year, Stillwater, Yamcolo and Stagecoach reservoirs in southern Routt County “are a little uncertain, probably pretty close,” Summers said. The engineer noted Fish Creek Reservoir east of Steamboat Springs and Elkhead Reservoir on the border of Routt and Moffat counties “pretty much fill every year.”

[…]

SNOTEL stations for snow telemetry information record snow water equivalent amounts in the area for March 23, 2025. Credit: NRCS

The Yampa-White-Little Snake River basins currently sit at 101% of median snowpack water equivalent based on Natural Resources Conservation Service data from 1991 to 2020. The data is collected by eight area snow telemetry stations, or SNOTEL, that help forecast water supply and drought conditions. Looking more closely at individual SNOTEL stations on March 23, Dry Lake SNOTEL near Buffalo Pass registered 120% of median, while on the lower end Bear River SNOTEL by Stillwater Reservoir was at 95% of median.

Yampa River Basin via Wikimedia.

On President Trump & tirades; April 1 #snowpack update; Also, Oil executives blast White House econ policies — Jonathan P. Thompson (LandDesk.org)

Horse near Aneth. Photo illustration by Jonathan P. Thompson

Click the link to read the article on the Land Desk website (Jonathan P. Thompson):

April 1, 2025

🤯 Trump Ticker 😱

Last week, one of the Land Desk’s more conservative readers cancelled his paid subscription. He wrote that he appreciated my passion for public lands, but was no longer interested in reading what he called a “tirade against Trump.”

This type of thing happens all the time in this business, and, unlike Elon Musk, I’m not looking for your pity. But I was a bit saddened, given that this person had been a paid subscriber since the Land Desk was launched, and because I really do appreciate having readers and commenters from across the political spectrum.

Besides, while I’m prone to a rant now and then, I do think “tirade” is taking it a little too far. Anyway, my point in telling y’all this is to let you know that writing about Trump’s shenanigans every dispatch is just about the last thing I want to be doing with my time. I’d much rather be delving into old maps, getting into the nuances of Western water, exploring the history of floods and droughts and wildfires, taking contrarian views on the housing crisis, or dissecting the contradictions of oil and gas markets. And I will continue to do all of that.

At the same time, it’s impossible for me to ignore the barrage of destruction, corruption, chaos, authoritarianism, and incompetence emanating from the White House. My passion for public lands — and for justice, truth, reason, morality, decency, intelligence, and kindness — demands that I document these egregious acts, and do my part to resist them, even if it is just by informing my readership about what’s happening.

I am not impartial, not by any means. I am partial to the planet and its survival, toward my fellow human beings, toward peace and justice and compassion and truth. [ed. emphasis mine] I am not, however, partisan: I will scrutinize Democrats and Republicans equally, fact-check the left and the right, and give credit where credit is due — even to Donald Trump.

***

Hopi tribal members cross Havasu Creek. Photo credit: From the Earth Studio

And on that note: The Trump administration appears to have unfrozen nearly $4.2 million in federal funding to help the Hopi Tribe build a solar-powered microgrid to run two remote wells and associated infrastructure that will provide water to Upper and Lower Moenkopi. The funding was approved by the Biden Energy Department, Trump froze it as part of a larger stop on Infrastructure and Inflation Reduction law money, but now it has been released. So good on you, Donny!

Now, how about you direct your Environmental Protection Agency to release funding for the Walker River Paiute Tribe to expand access to clean water and electric power infrastructure, and for Navajo Power’s program to bring solar to off-grid homes.

***

Though it may be inadvertent, Trump’s economic policies may ultimately benefit the environment in some ways. The haphazard, on-again, off-again tariffs, for example, along with the gutting of the federal government’s workforce, have sent the stock market into a tailspin. Meanwhile, the tariffs — along with reciprocal tariffs levied by the U.S.’s trading partners — will increase prices on most consumer goods. People will buy less, travel less, which will mean less pollution and environmental impacts.

***

And yet more kudos for Trump! Seriously. Despite all of his bluster, Trump has managed to really piss off oil and gas executives — the same ones that were throwing money at his campaign just a few months ago — and possibly dampen drilling on public lands.

See, the thing about tariffs is that they very well may raise the price you pay for gasoline (depending on where your local refinery gets its crude oil), but the economy-dampening part of tariffs actually brings down the price of oil, while also raising the cost of steel pipes and other supplies. That’s no bueno for petroleum companies, whose profit margins are directly proportional to the price of crude.

Many of these folks won’t criticize Trump in public, given his vindictive and authoritarian leanings, but give them the cover of anonymity, as a Dallas Federal Reserve survey did, and they go off on the White House’s herky-jerky non-policies. Here’s a sampling:

There was only one mention of regulations getting in the way of the oil business, and that wasn’t federal rules, but state ones:

Well, there you have it, folks.

***

Oh, and these oil companies might also be angry that the MAGAs are all buying Teslas — or at least pretending to — in order to “own the libs.” Which is pretty funny, given the amount of gibberish Trump devoted to dissing electric vehicles during his campaign rallies. Tesla also stands to benefit the most from Trump’s tariffs, another dig at the internal combustion fans.

***

Maybe the national parks will be a bit less crowded this summer, as well, as international travel ebbs.

Anyone who’s traveled the Western national park service knows that they are popular with overseas visitors. On a single grocery run at the Page, Arizona, Safeway recently, I heard no fewer than three different languages spoken, in addition to Navajo and English, and that was in the off-season. In 2018 (the last year that data is available), more than 14 million international travelers visited U.S. national parks and monuments. About 14% of the Grand Canyon National Parks’ visitors were from overseas, with about 6% of Zion’s visitation from overseas.

Tourism Economics is predicting that international travel to the U.S. will be down significantly this year, thanks not only to the administration’s hostile economic moves, but also “polarizing Trump administration policies and rhetoric.” Also, there’s that thing where travelers have been detained at the border, even thrown in jail, simply for trying to get a visa. This decline undoubtedly will impact Western U.S. tourism and national park and monument visitation numbers. Not good for the tourism economy, but it might give the parks a much needed rest.

🥵 Aridification Watch 🐫

It’s first-of-the-month snowpack update time again, and this will likely be the last of the season barring some freak climatic shift over the next several weeks. Snowpack levels typically peak in mid-elevation areas in mid- to late-March, and in the high country in mid- to late-April, meaning we are now headed into spring runoff season.

Generally speaking, it’s looking like runoff will be average to paltry, depending on which side of the snow-divide your watershed falls. It is a very jagged line, by the way, with places in the west and north having average to above average snowpack, while the southern-Interior West generally had a super dry winter. But even within those areas there are sort of outliers: The Grand Traverse ski race between Aspen and Crested Butte was canceled due to lack of snow for the first time in its 26-year history.

And there’s big variations over short distances. Red Mountain Pass is still just below median, for example, while the southern San Juan Mountains, just a few dozen miles away, are experiencing a severely dry winter.

Before I get to the graphics, however, a quick note. The snowpack and precipitation plots I run here come from the USDA’s Natural Resources Conservation Service. It’s just one of the valuable services they provide. I haven’t found any stats on whether DOGE has gone after NRCS’s staff, yet. But the DOGE website says it has or will cancel the leases for the following NRCS offices. Whether they and their staffs will simply go away, be absorbed into another facility, or what, isn’t disclosed.

  • Natural Resource Conservation Service offices slated for lease cancellations: Missoula, Montana; Wasilla and Fairbanks, Alaska; Logan, Utah; Gallup and Raton, New Mexico; Yuma, Arizona; Dayton, Puyallup, and Renton, Washington; Portland, Oregon; and Woodland, Yreka, Salinas, Oxnard, and Blythe, California.

Hopefully the staff of these offices and services they provide will endure.

Now to the snowpack plots. I included the plots for 2021 and 2023 because those were the most recent big and crappy years for snowpack.

The watersheds that feed Lake Powell are not in terrible shape, sitting at 88% of the median just six days before the typical peak. However, levels are lower than they were in 2021 at this time, and 2021 was not a good year for the Colorado River. Source: NRCS.
The North Fork of the Gunnison has followed a snow accumulation pattern similar to the Upper Colorado River’s.
Red Mountain Pass is one of the few bright spots in the Four Corners region. Snow levels have tracked right around normal for most of the winter. Though it’s now down to 90% of median, there are potentially still over three weeks left in the snow accumulation season, meaning an above-average season is still possible; snow is forecast for much of this week there.
This SNOTEL site, in the San Francisco Peaks north of Flagstaff, is the comeback story of the year, rebounding from ultra-dry to average over the course of several weeks. It’s one of the only sites in Arizona that received measurable snow accumulation this season.
The drought has spread and intensified over the last year.
And it doesn’t look like it will get better anytime soon …

If you want to know more about the drought and the Colorado River basin, I’d suggest checking out the Wright-Ingraham Institute’s interactive Drought Interfaces app. It’s super cool and informative.