#Drought news April 17, 2024: Increases in drought coverage occurred in parts of southern #Texas, #NewMexico, much of #Colorado, and parts of #Kansas, #Nebraska and northern #SouthDakota

Click on a thumbnail graphic to view a gallery of drought data from the US Drought Monitor website.

Click the link to go to the US Drought Monitor website. Here’s an excerpt:

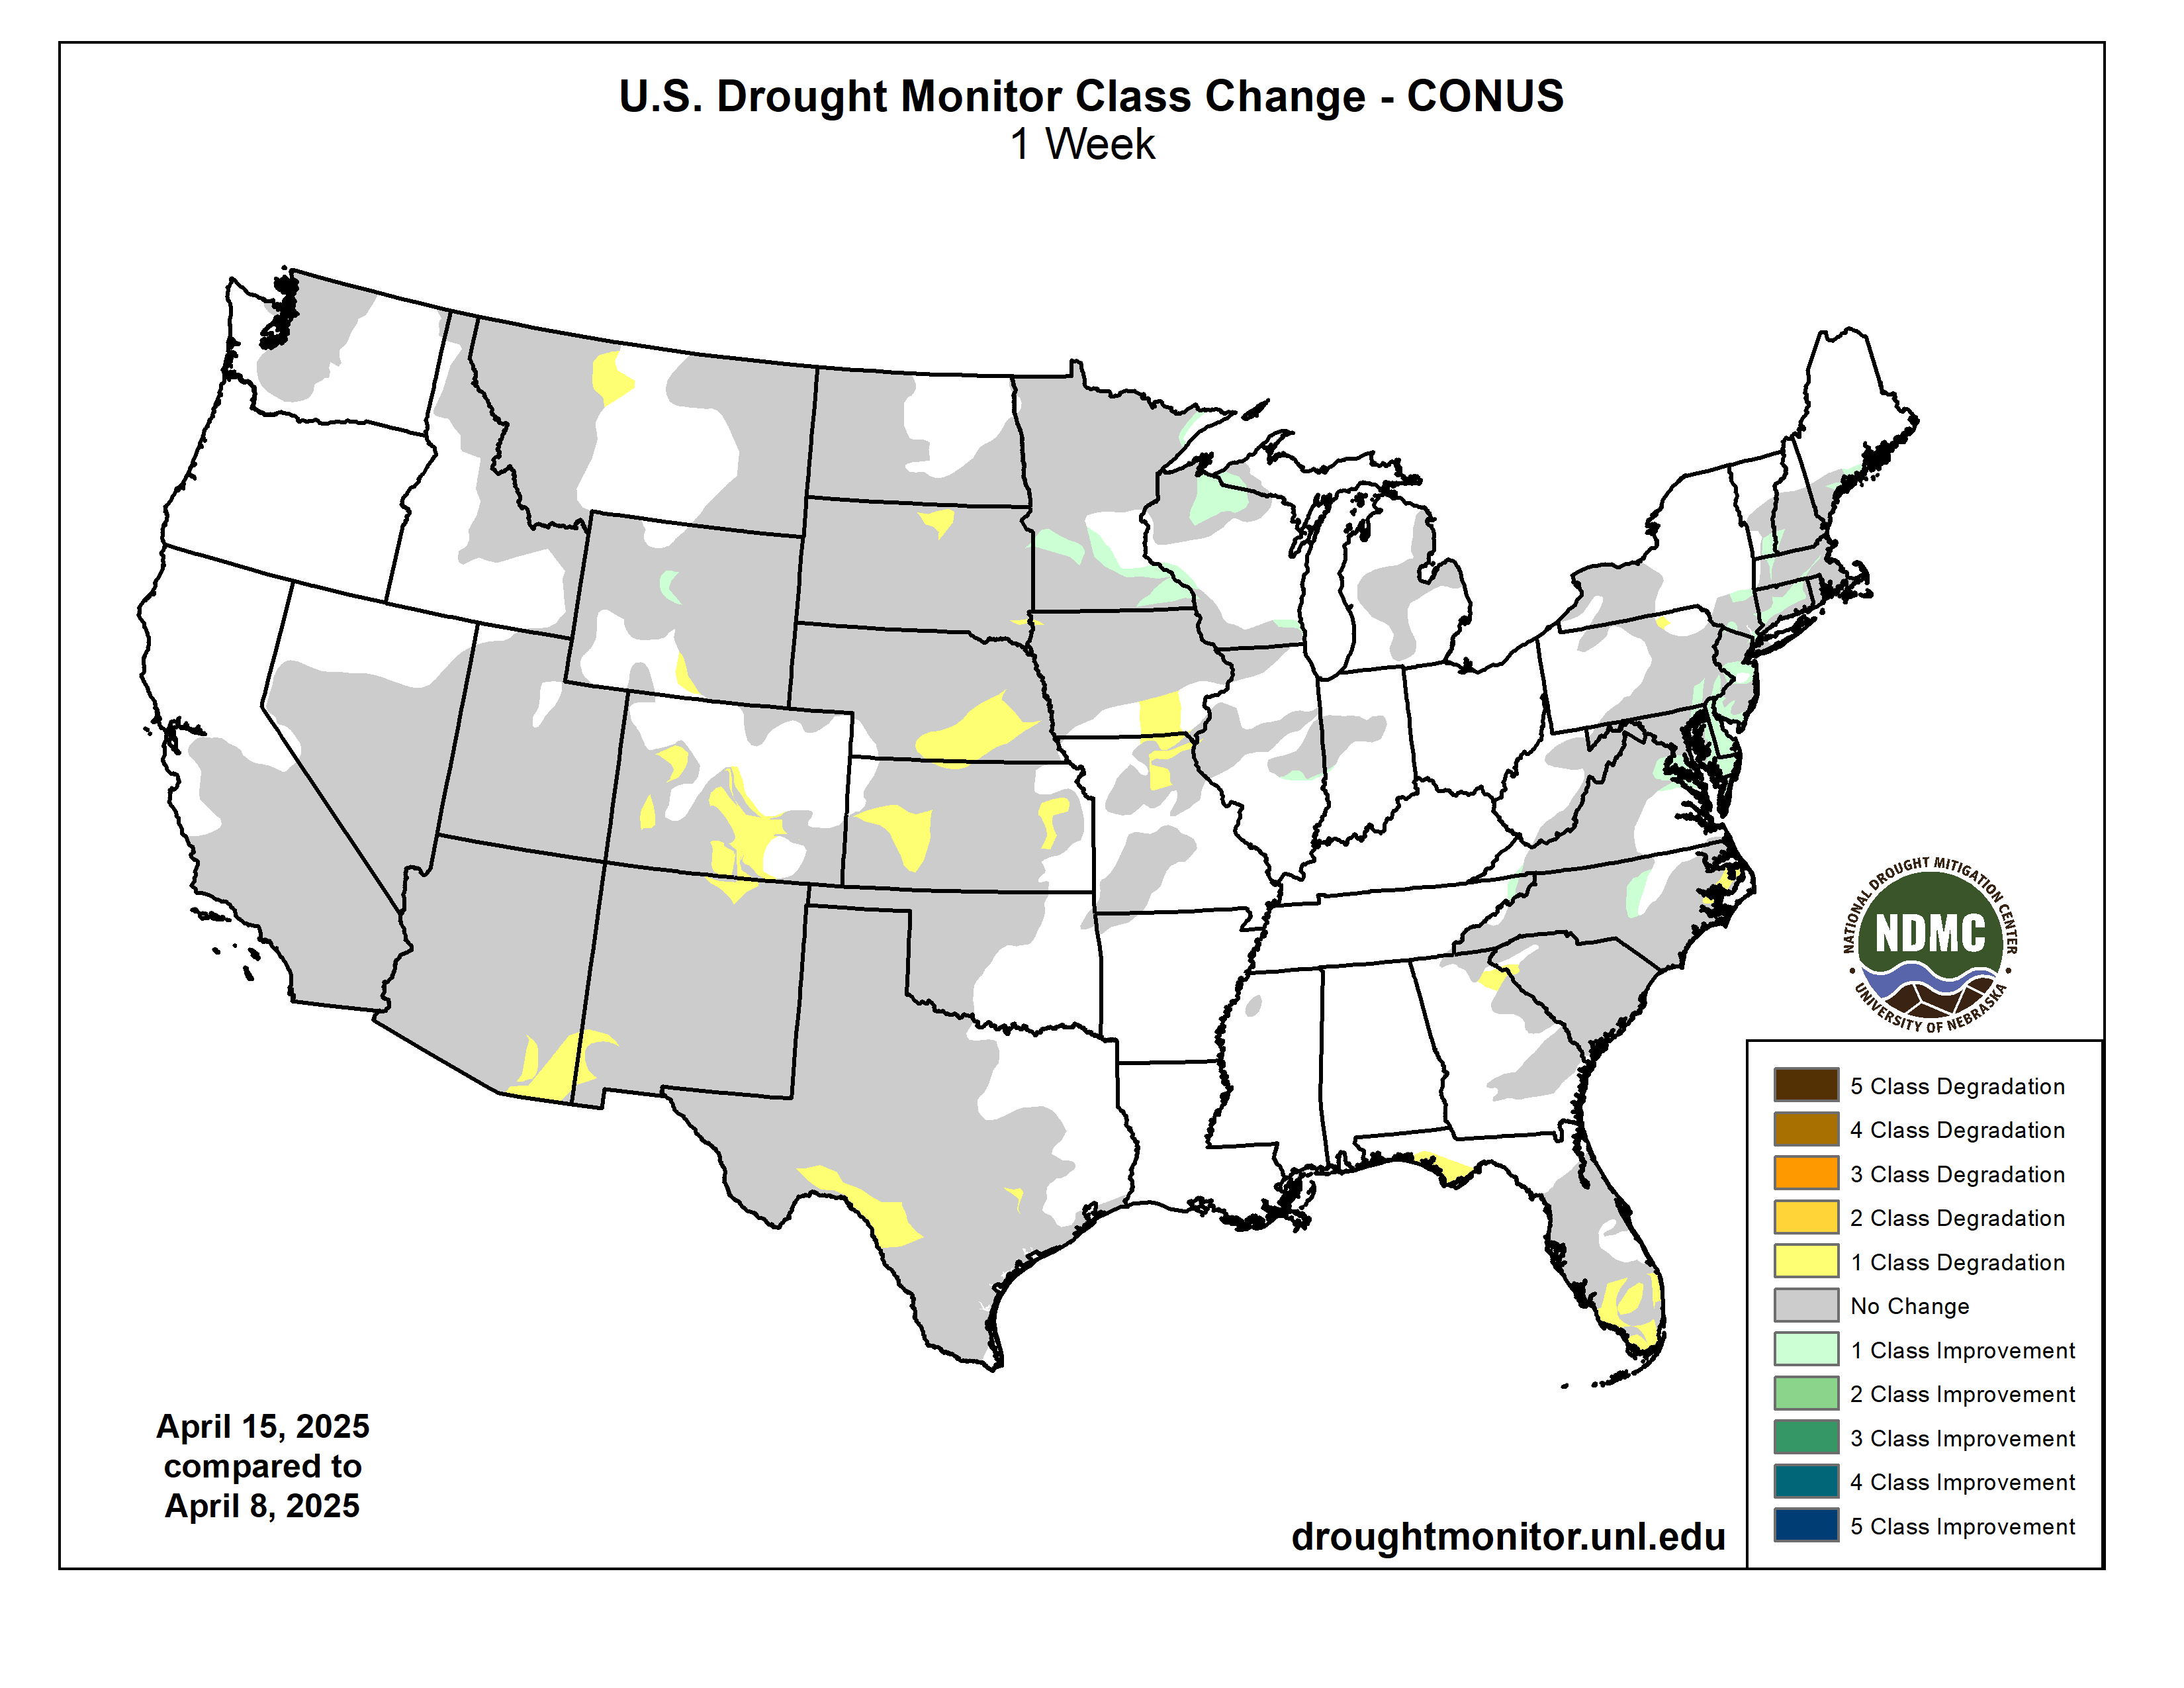
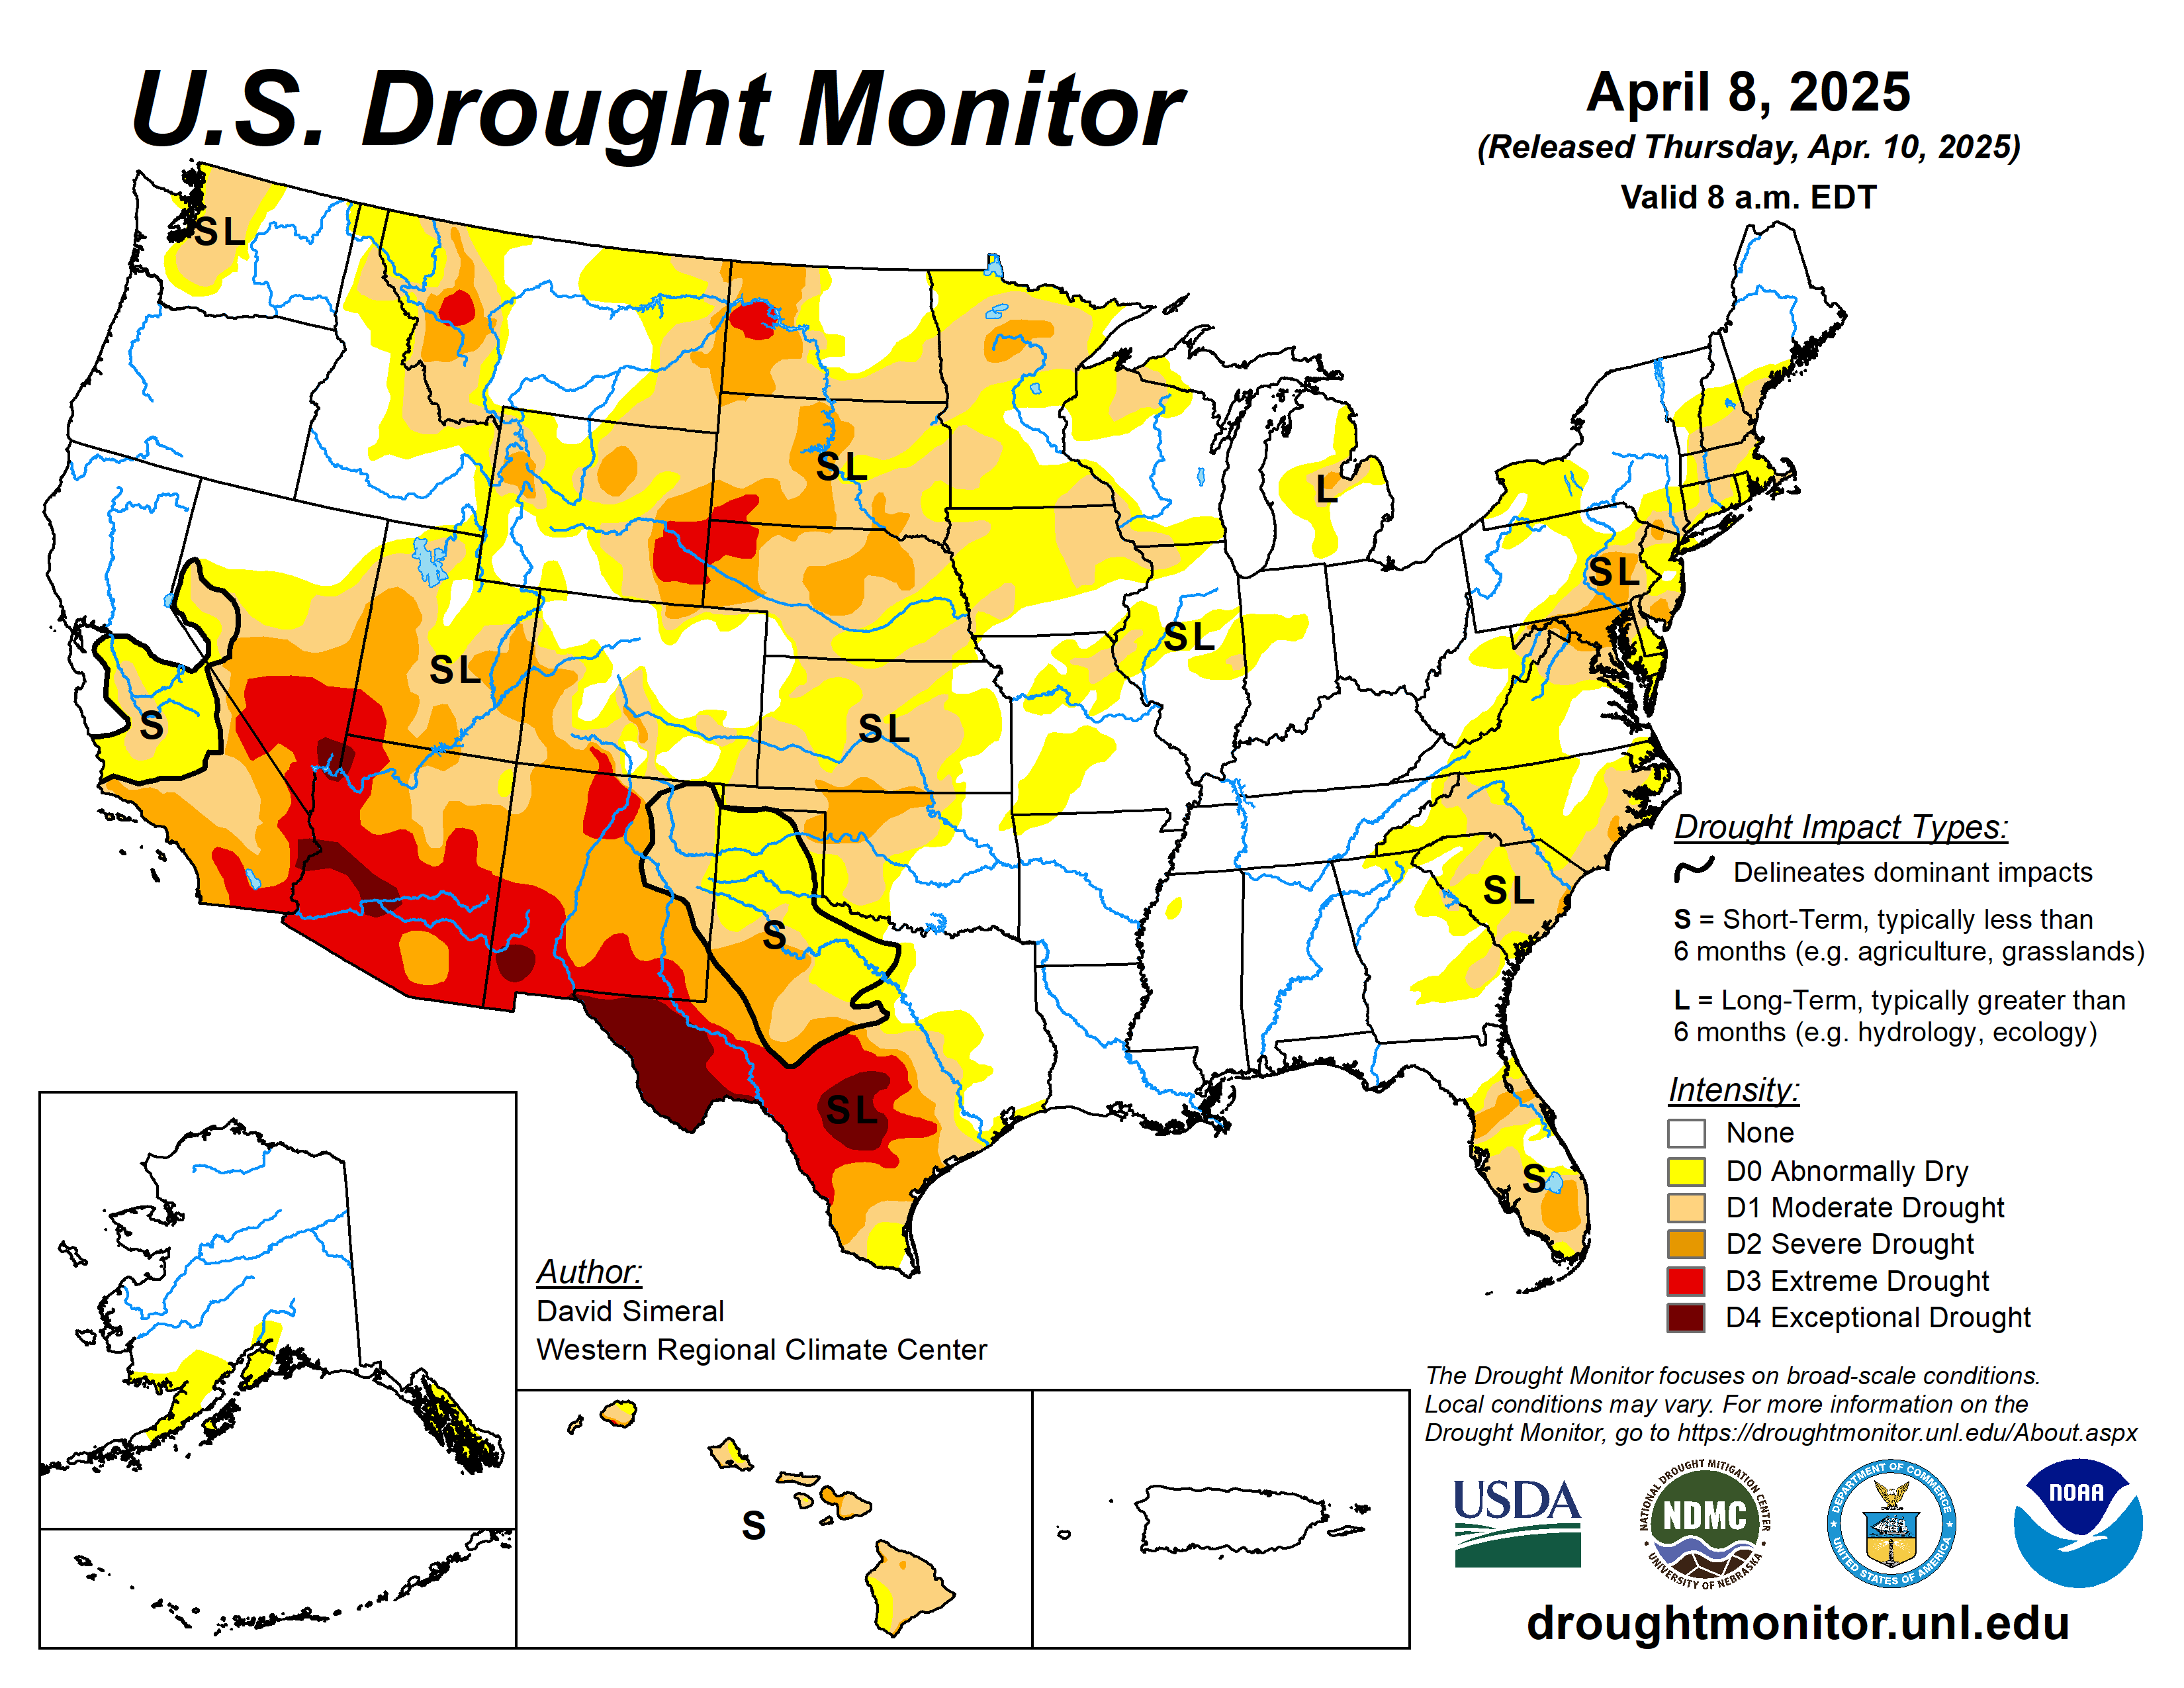
This Week’s Drought Summary

During the week of April 8-14, temperatures across the Contiguous U.S. were split into above-normal readings in the western U.S., below-normal readings east of the Mississippi River, and near-normal temperatures in the Mississippi River Valley. Temperatures across the western Great Plains, the Rocky Mountains, and the Intermountain West ranged from 3-12 degrees warmer than normal. In the Upper Ohio River Valley and Appalachian Mountains, temperatures from 6-12 degrees cooler-than-normal were widespread. Dry weather occurred over much of the Great Plains and western U.S., except for parts of North Dakota, Montana, northern Idaho and western Washington. Some moderate precipitation amounts, locally exceeding an inch or two, occurred in parts of the eastern U.S., especially in the Mid-Atlantic, though precipitation was mostly light east of the Mississippi River otherwise.

Changes to the U.S. Drought Monitor depiction were somewhat limited this week compared to the last few. Increases in drought coverage occurred in parts of southern Texas, New Mexico, much of Colorado, and parts of Kansas, Nebraska and northern South Dakota. Dry weather and high fire danger continued in south Florida this week, leading to further degradation and the development of localized extreme drought. The higher precipitation amounts in the Mid-Atlantic and Northeast led to some localized improvements in ongoing drought and abnormal dryness. Heavier precipitation over the last month has quickly improved conditions in this region, with lessened precipitation deficits and increasing groundwater in many areas…

High Plains

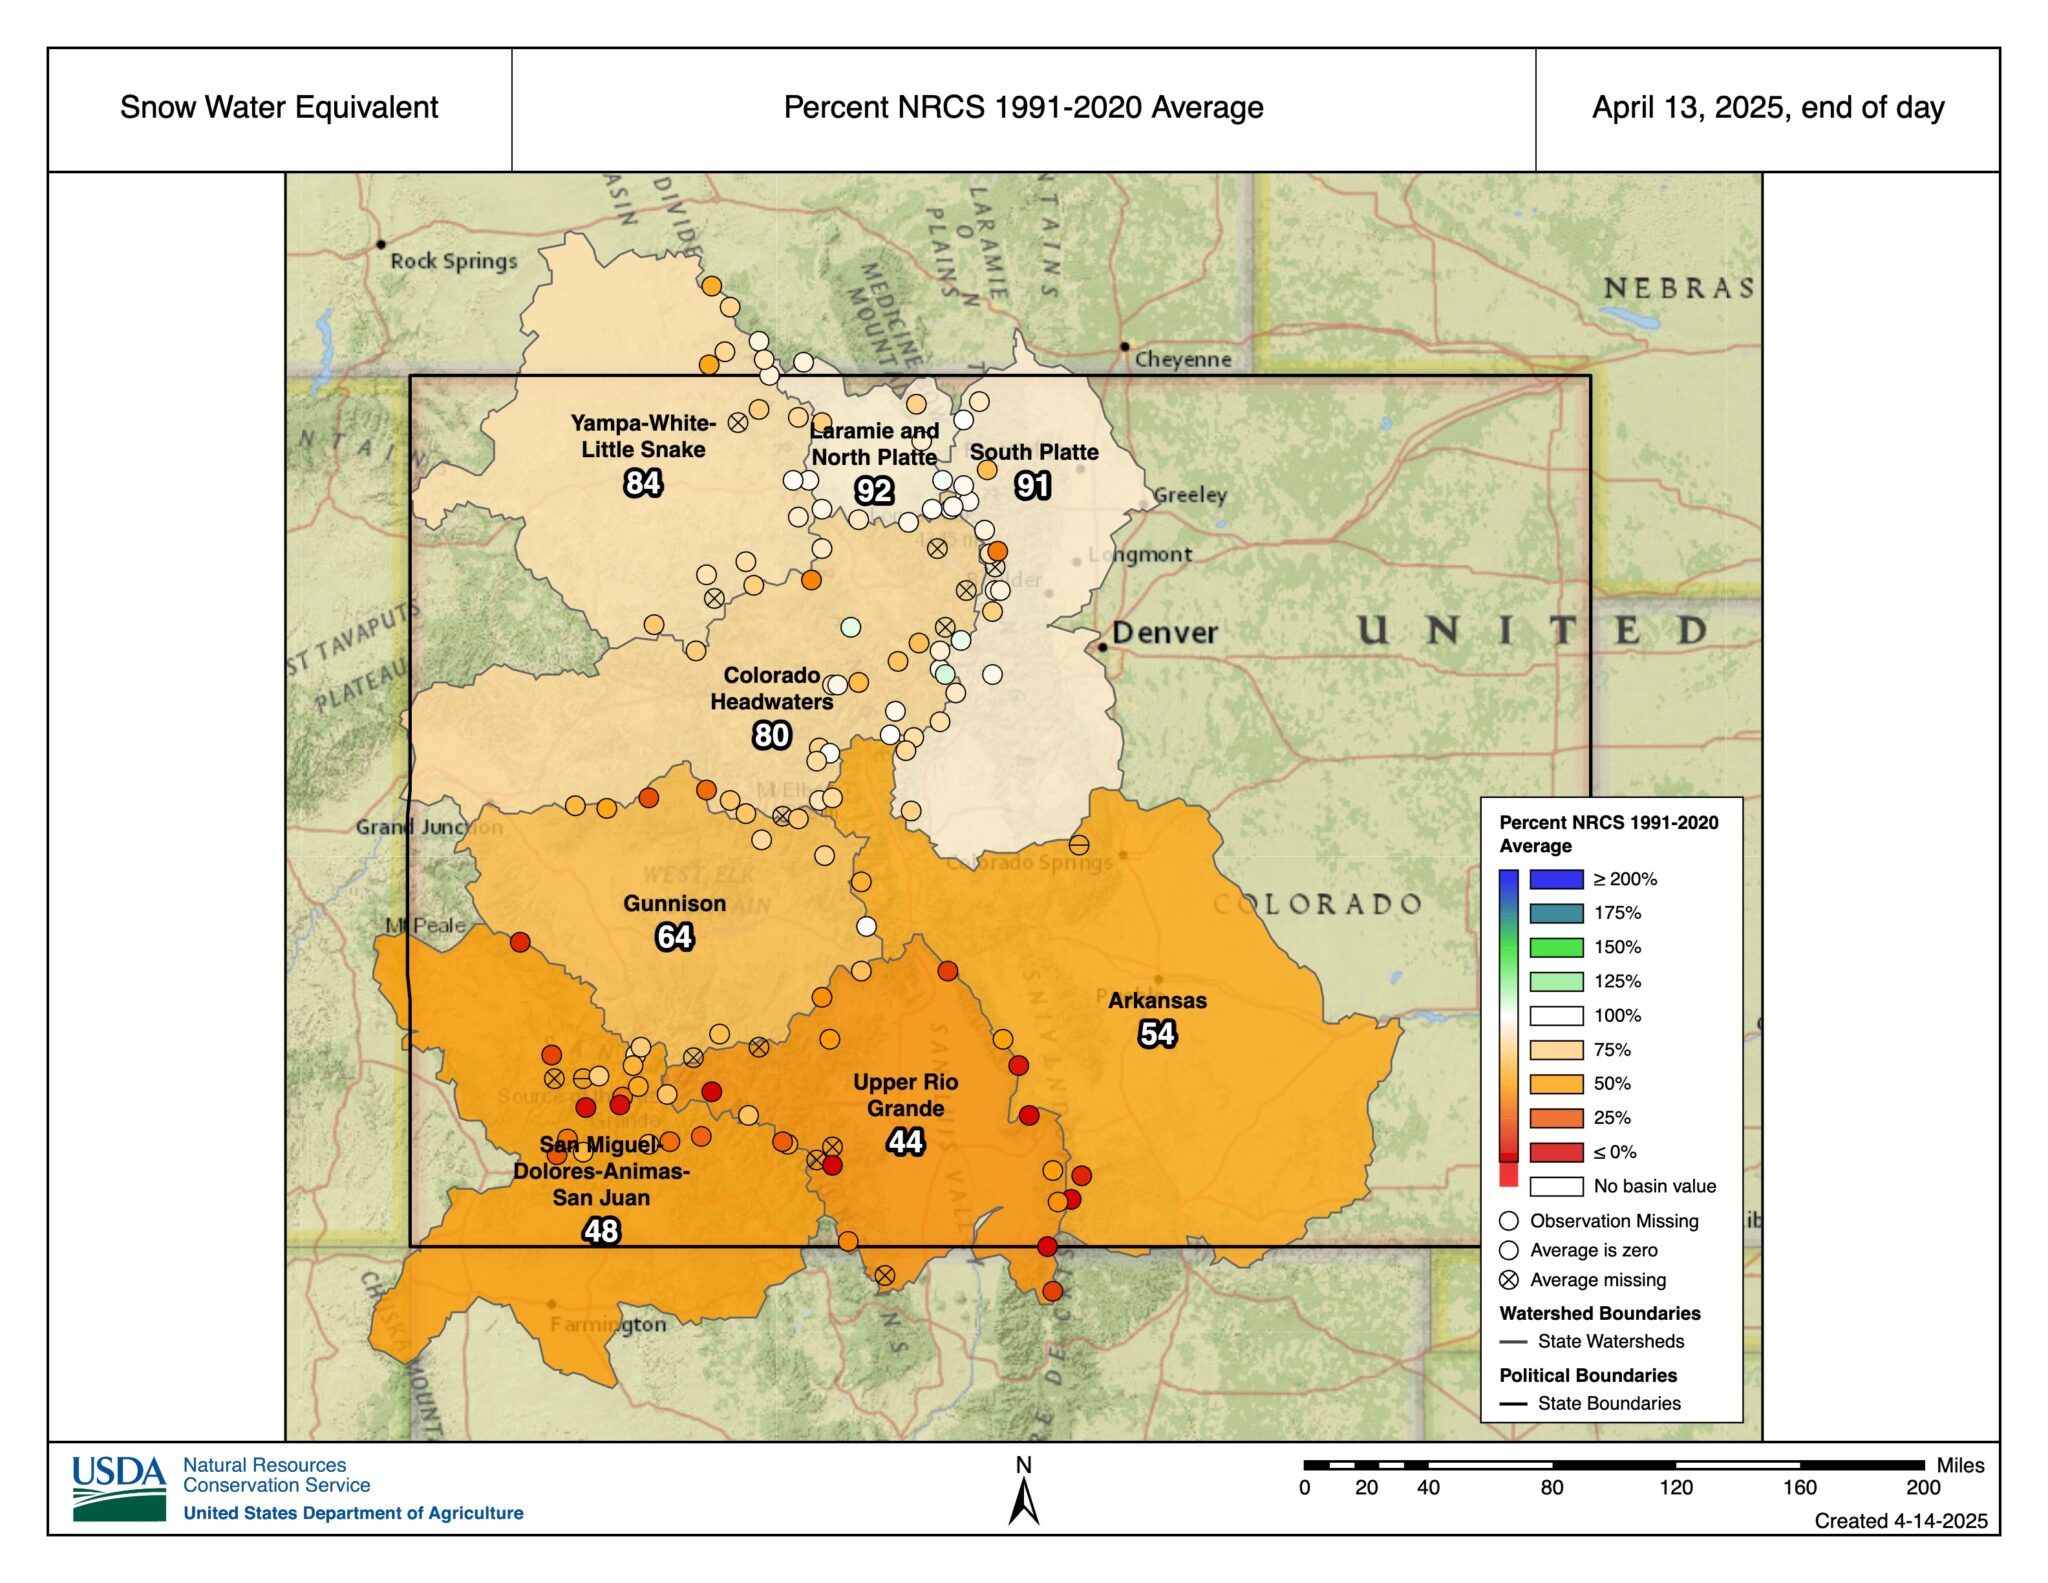
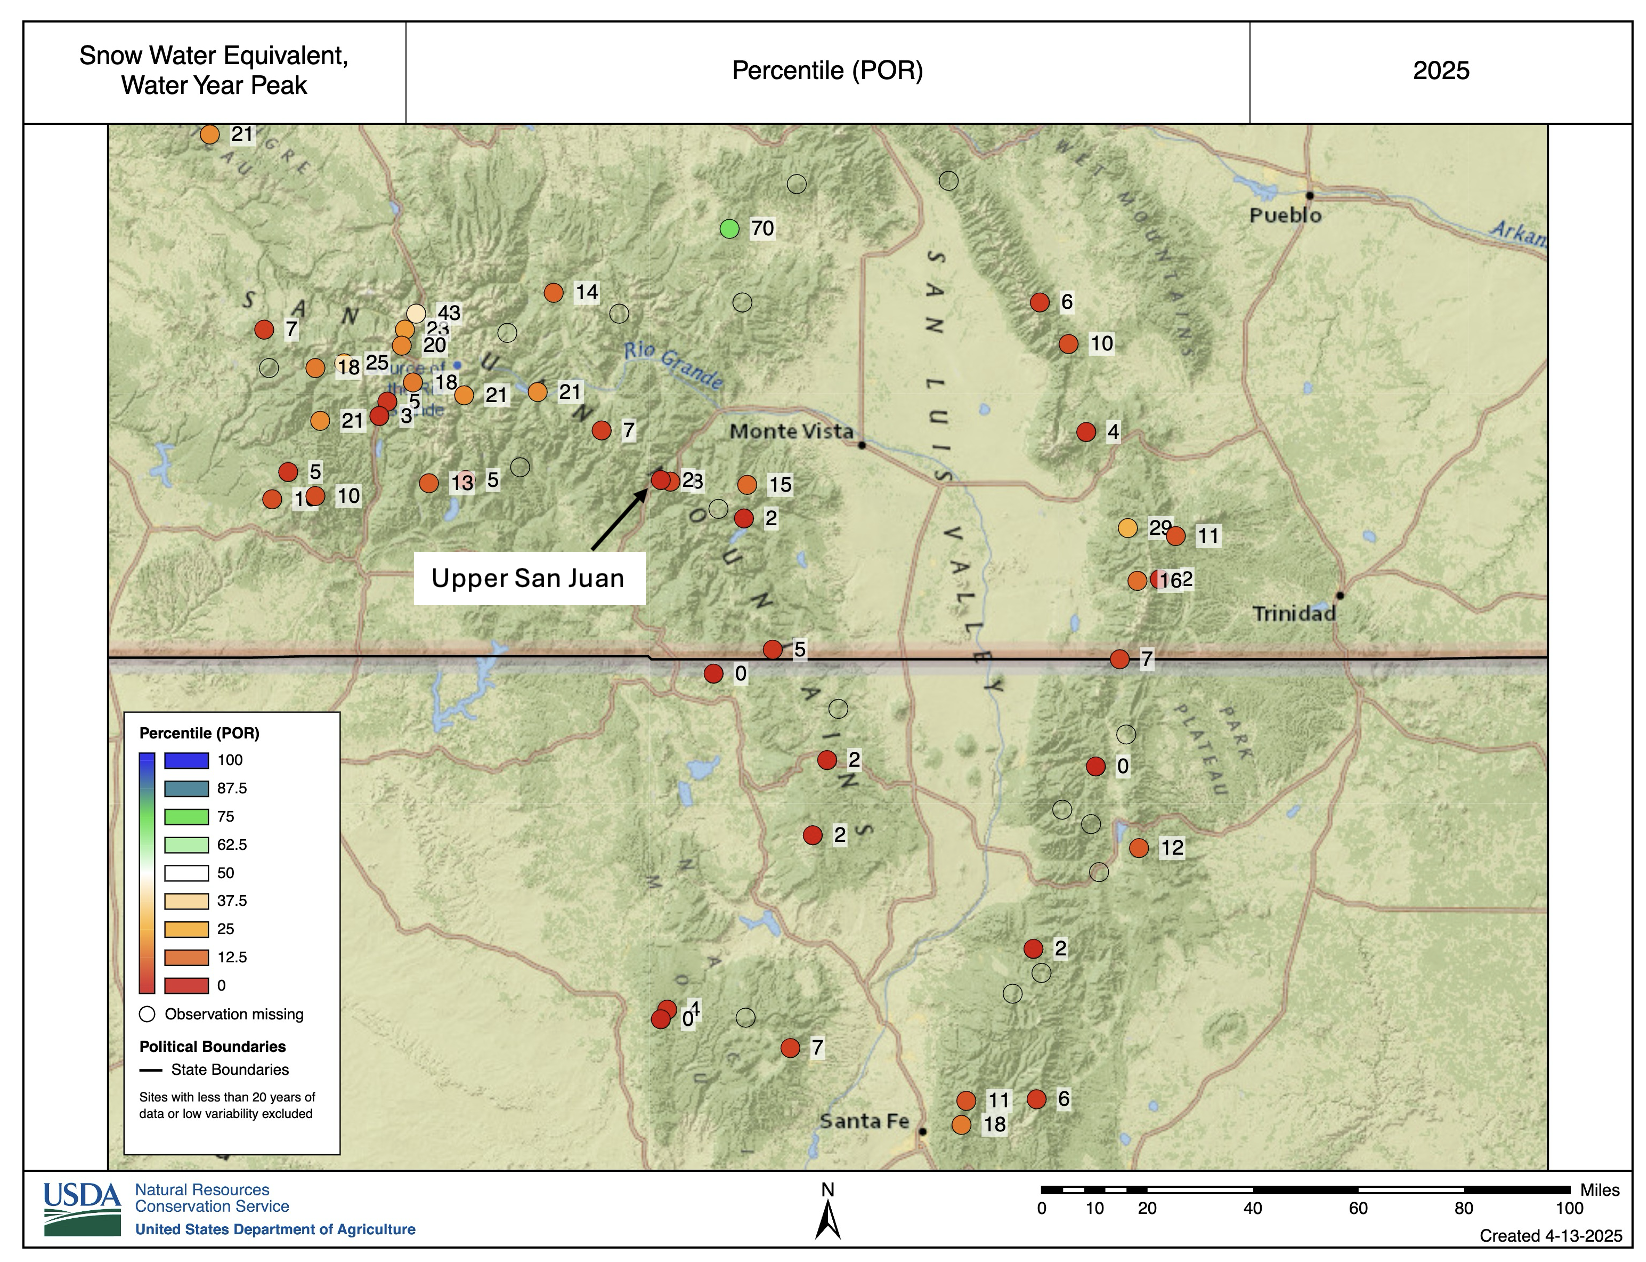
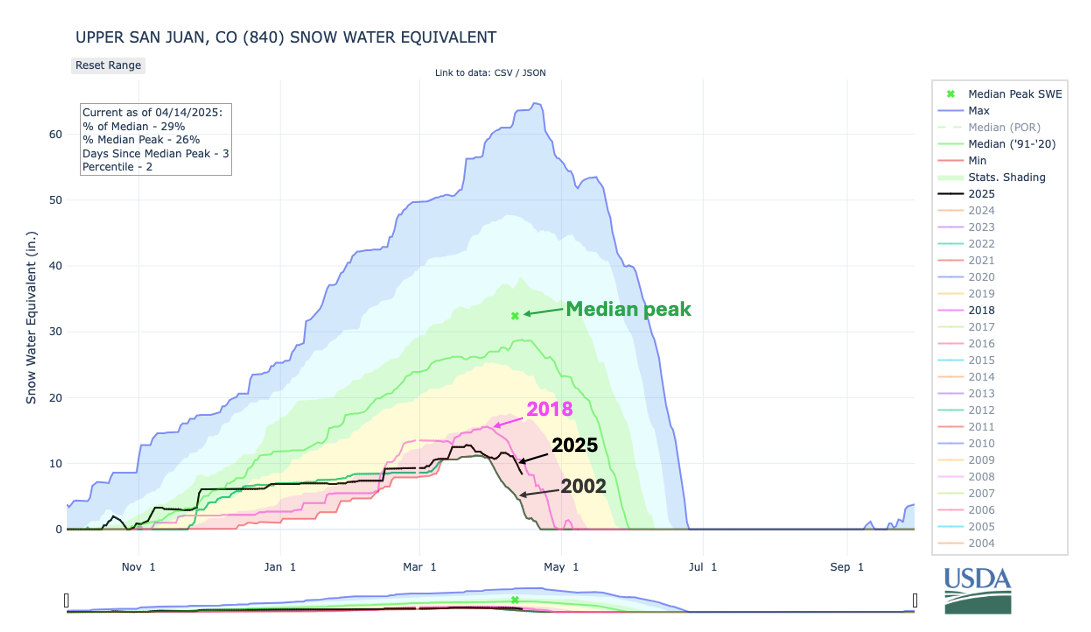
Across the High Plains, ongoing drought or abnormal dryness mostly stayed the same or worsened after dry weather occurred across the region (excluding North Dakota) and warmer-than-normal temperatures overspread the Great Plains and central Rocky Mountains. Temperatures from 3-12 degrees above normal occurred across the region, with the warmest readings occurring in the western Great Plains and in the Colorado Front Range area. Widespread degradation in drought conditions, due to low snowpack and short- and long-term precipitation deficits, occurred in the central and southern Rocky Mountains in Colorado. Moderate drought expanded in western and east-central Kansas this week, where streamflow and soil moisture dropped amid growing precipitation deficits. Similar conditions existed from south-central into eastern Nebraska, where moderate drought became re-established. Localized degradations to drought conditions occurred in north-central South Dakota amid growing precipitation deficits, though conditions across most of the Dakotas remained unchanged this week. Moderate drought coverage decreased slightly southwest of the Bighorn Mountains in Wyoming, where precipitation deficits lessened and soil moisture conditions improved…

Colorado Drought monitor one week change map ending April 15, 2025.

West

A mix of near-, below- and above-normal temperatures occurred in northern Idaho and in Washington. Otherwise, temperatures across the West were warmer than normal this week, with widespread readings of 6-12 degrees above normal in parts of central and eastern California, Nevada, Utah, Arizona and New Mexico. Mostly dry weather, with a few exceptions in Montana, northern Idaho, western Washington and northwest Oregon, occurred across the West this week. In northern New Mexico, soil moisture levels dropped and short-term precipitation deficits grew, leading to an expansion of severe drought (concurrent with expansions of drought coverage in Colorado). Extreme and exceptional drought grew in coverage in far southwest New Mexico and southeast Arizona, where very dry surface conditions and high evaporative demand continued amid severe precipitation deficits…

South

Mostly dry weather occurred across the South region this week, aside from eastern Tennessee and scattered light rain amounts in northern Mississippi and central and western Tennessee. Temperatures ranged from 3-9 degrees below normal in areas east of the Mississippi River and in southern Louisiana and southeast Texas, to 3 to locally 9 degrees or more above normal in western parts of Oklahoma and Texas. Given recent very wet weather in the eastern half of the region, no changes occurred in drought or abnormal dryness in the eastern part of the region other than a slight reduction in abnormal dryness in eastern Tennessee after recent rains. In southern Texas, severe drought expanded in a small area between San Antonio and Houston where streamflow and soil moisture decreased and short-term precipitation deficits grew. Exceptional drought grew in coverage from near Eagle Pass to northwest of Del Rio in southern Texas, where short- and long-term precipitation deficits worsened, soil moisture and groundwater levels worsened, and reservoir levels were at or near record-low levels. Stage 3 restrictions were in effect for the San Antonio Water System, and Stage 4 restrictions were present for farmers and pumpers operating in the Edwards Aquifer…

Looking Ahead

Between Wednesday, April 16 and the evening of Monday, April 21, the National Weather Service Weather Prediction Center is forecasting widespread heavy rainfall in parts of the central U.S., especially along east and south of the Interstate 44, 35 and 70 corridors in Oklahoma, Kansas, Missouri, Arkansas, Illinois and Indiana. Precipitation amounts may reach or exceed 3 inches from eastern Oklahoma northeast through St. Louis into eastern Illinois. The forecast calls for precipitation amounts from 0.25-1 inches in parts of the Rocky Mountains, with locally higher amounts possible, especially from far northern New Mexico north to southern Montana. Precipitation amounts from 0.5-1.25 inches, with localized higher amounts, are forecast from southeast Minnesota east through Wisconsin and Michigan. Farther east, weather along the Atlantic Coast is forecast to be mostly dry.

For the period from April 22-26, the National Weather Service Climate Prediction Center forecast favors above-normal precipitation in much of the central and southern U.S., especially in Oklahoma, Texas, Arkansas and Louisiana. Warmer-than-normal temperatures are also favored across most of the contiguous U.S., especially in the Southeast. Drier-than-normal weather is slightly favored in northwest California and coastal areas of Oregon and Washington.

In Hawaii, warmer- and wetter-than-normal weather is strongly favored from April 22-26. In Alaska, above-normal precipitation is favored for April 22-26 in most areas outside of the North Slope. Colder-than-normal temperatures are favored in the central and eastern thirds of Alaska, while warmer-than-normal temperatures are likelier in southwest Alaska and the Aleutian Islands.

US Drought monitor one week change map ending April 15, 2025.

#Kansas Farmers Dramatically and Profitably Pare Water for Irrigation: Much lower draw on #OgallalaAquifer has not hindered region’s giant farm economy — Brett Walton (circleofblue.org)

A corn crop is harvested in the U.S. Great Plains, where center-pivot irrigation systems draw water from the Ogallala Aquifer. Photo © Brian Lehmann / Circle of Blue

Click the link to read the article on the Circle of Blue website (Brett Walton):

April 14, 2025

To save a dying aquifer – or at least their piece of it – a group of roughly 60 farmers in northwest Kansas decided on a self-imposed diet.

The move a dozen years ago to voluntarily restrict the water they pumped from the Ogallala Aquifer, the lifeblood of the High Plains, was seen by some as a risky proposition. In the semi-arid region, farmers might have gone bankrupt without water drawn from deep underground. But they were skilled and savvy land managers, and thought they could survive a 20 percent water cut.

Years of scholarship and economic analysis have proved them correct – in more ways than one.

The farmers in northwest Kansas not only remain profitable. They are practicing irrigated agriculture with a significantly lighter environmental footprint. Fewer carbon emissions, less fossil energy use. Annual groundwater declines of 1.5 to 2 feet before the restrictions are now a half foot or less. In some years, the groundwater level has inched up. Their part of the Ogallala is not quite stable, but a balance between recharge and extraction is closer than it has been in generations.

In light of these successes, the experiment in little Sheridan County is instructive, illustrating a plan of attack for other areas of the planet where agriculture – the biggest consumer of water – is exceeding the limits of a finite resource. Northern India, California’s Central Valley, Iran, and the North China Plain – all are arid and semi-arid farming hot spots and epicenters of groundwater depletion that could learn from Kansas, where four additional groundwater management areas with varying conservation targets have been established following the Sheridan model. For an ag industry that can be leery of untested practices and new methods, the undisputed achievement on the High Plains is a compelling proof of concept.

“I think it’s been pretty transformational, particularly in the area of Kansas water policy and management, but certainly in adjacent states as well, because I think it helped to allay fears of the producers of trying to tackle change,” said Jean Steiner, an adjunct professor of agronomy at Kansas State University.

McGuire, V.L., and Strauch, K.R., 2022. Data from U.S. Geological Survey.

The importance of the Ogallala Aquifer to the economy of the High Plains is difficult to understate. Spanning eight states from South Dakota in the north to Texas in the south, the Ogallala is North America’s largest source of underground fresh water. In a region with few flowing rivers and sporadic rain, its groundwater nurtures vast harvests of cotton, corn, soybeans, and wheat, in addition to some of the nation’s biggest cattle feedlots. All told, the Ogallala supports an agriculture industry worth $35 billion.

Because of limited precipitation, the Ogallala as it has been managed is essentially a finite resource, a bank account slowly being drawn down to produce immense quantities of grain. Some areas on the aquifer’s fringe are already too depleted for irrigation.

Seeing the trend lines and wanting to delay or avoid that fate, farmers in Sheridan County said enough. In 2013, they became the first group in the state to adopt a new conservation tool, called a Local Enhanced Management Area.

The LEMA was locally designed but came with the force of law. It bound farmers in the 99-square-mile management area to a 20 percent cut in groundwater pumping. To help farmers cope, the volume restrictions were paired with more flexible rules for water use. If they did not need a portion of their water allocation one year – because of sufficient rain or a different crop mix – farmers could carry it over to the next. The change allowed them to take advantage of a wet year by saving their pumping for a drier period in the future.

What benefits did this bring? Previous studies found that pumping restrictions did not hurt farm profitability. Farmers cut their operational costs – less money spent on seeds, fertilizer, energy –  or shifted from corn to less water-intensive crops, and were less wasteful with the water they had, producing yields that were a bit smaller than before but not drastically so. The dollars and cents penciled out.

“We can safely say it’s not economically detrimental to reduce water use,” said Bill Golden, a Kansas State University agricultural economics professor who conducted the research.

The Ogallala Aquifer crosses eight states and is North America’s largest underground source of fresh water. Map: Erin Aigner for Circle of Blue

To the economic gains, now add ecological benefits.

Steiner is a co-author on a new study that is the first to assess the LEMA’s effect on the environment. The study, using computer models that simulated resource inputs and crop outputs, found a host of co-benefits to reducing water use.

Compared to nearby farmland that had no water limits, the Sheridan LEMA came out ahead. Fossil energy use – natural gas is the most common fuel source for the groundwater pumps – was 22 percent lower. Greenhouse gas emissions were 20 percent lower. Losses of reactive nitrogen, linked to fertilizer use, were down 1.4 percent.

Because yields were smaller in the LEMA, the numbers were slightly less impressive when measured per unit of grain produced. Reactive nitrogen losses were even a touch higher than the control group without water limits. Still, the benefits were impressive overall, Steiner said.

“Replicating LEMA-type policies more widely across the region can be a viable solution (environmental and economic) to stabilize the Ogallala Aquifer water levels for the next few decades, as demonstrated by this and previous research,” the study concluded.

Stabilizing the aquifer is a main reason the Sheridan farmers went on their water diet. They wanted to preserve the aquifer for their children and grandchildren. That outcome appears to be happening.

Before the LEMA went into effect in 2013, annual water level declines in the area averaged 1.5 feet, sometimes as much as 3 feet, said Brownie Wilson of the Kansas Geological Survey, which conducts annual groundwater monitoring. Now the declines are roughly a half foot, and some years the water level has increased.

“You can definitely see a shift in water use and a shift in water level,” Wilson said.

Shifting behaviors are another measurement of the LEMA’s success. The concept is spreading through the state. Sheridan County farmers have twice extended their LEMA agreement, which now runs through 2027. Four other LEMAs have been established, including all of Groundwater Management District 4, which is the district that contains Sheridan County.

Golden is working on an economic analysis for Wichita County, which established a LEMA in 2021. He is finding similar results as in Sheridan County: no decrease in net revenue.

State officials are also looking for ways to reward this locally driven conservation. Last year representatives from the office of Gov. Laura Kelly and the Kansas Water Authority held public meetings to gather suggestions for a state water infrastructure funding program. The blueprint, published in December, recommends that farmers participating in a LEMA should have top priority for irrigation funding.

No good news in the #snowpack and water supply numbers — Russ Schumacher (#Colorado Climate Center)

Click the link to read the article on the Colorado Climate Center website (Russ Schumacher):

April 14, 2025

The peak in mountain snowpack (the amount of water stored in the snow) is typically in early April in Colorado’s southern mountains, and later in April in the north. Looking at the conditions right now, we’ve almost certainly passed the peak for this year. And the numbers don’t look good, especially in the southern part of the state.

To recap how we got here, the snow season got off to a huge start in November, then came one of the driest winters on record in the mountains. March was a little more active, but was also quite warm.

As of April 13, the mountains that feed water into the southern river basins had less than half of the usual snowpack they would usually have on that date. The numbers aren’t as bad in the northern mountains, with 80-90% of average snowpack. But keep in mind that in the northern basins, the average is still going *up* in mid-April, but the snow this year is already starting to decline. So with warm, sunny days and no new snow falling, these numbers are also going to get smaller as April goes on. From the perspective of “snow drought” and water supply for the coming summer, this is not what you want the snowpack map to look like in mid-April.

Snow water equivalent as a percent of the 1991-2020 median for the major river basins in Colorado as of April 12, 2025. Source: USDA/NRCS interactive map.

Since we’re almost certainly past the peak, we can also see how this year’s peak stacks up compared to past years. In many locations, these numbers make the picture look even worse. This map shows the percentile rank of the peak snow water equivalent (SWE) compared to all past years at each SNOTEL station, focusing on southern Colorado and northern New Mexico. On this map, if you see 50 it means it’s right in the middle of the historical distribution; 100 means the highest on record, and 0 the lowest. Through the San Juan and Sangre de Cristo mountains, many stations are below the 10th percentile, and several had their lowest or 2nd-lowest peak snowpack since they were installed (most were established in the late 1970s or early 80s).

Water year peak snow water equivalent percentile ranking in southern Colorado and northern New Mexico. Source: USDA/NRCS interactive map.

For example, at the Upper San Juan SNOTEL station near Wolf Creek Pass, it’s the 2nd-lowest peak SWE since the station was established in 1979, worse than even 2018 (which was a terrible drought and wildfire year in southwestern Colorado), though still ahead of the historic 2002 drought year. With record-warm conditions in recent days and sunny conditions that increase sublimation, what snowpack remains is going to continue declining rapidly.

Time series of snow water equivalent at the Upper San Juan SNOTEL station in southwestern Colorado. The 2025 time series is shown in black, with comparison to other very bad snow years of 2018 (magenta) and 2002 (gray). The median peak is shown in green. Source: USDA/NRCS.

In the northern parts of the San Juan mountains, the snowpack numbers aren’t quite as bleak, but overall it is shaping up to be a very poor year for streamflow and water supply in southwest Colorado (and throughout the southwest US). The water supply forecasts from the Colorado Basin River Forecast Center bear this out. The predicted river flows for April through July (when the vast majority of the annual flow occurs) are not so bad in the headwaters of the Colorado River in Colorado, where the projection is for 80-100% of average water supply. But in the southwestern Colorado rivers like the Animas, San Juan, and Dolores, flows will be much lower than average, and Lake Powell is expected to see less than 70% of its average inflow. Lake Powell levels aren’t quite at the historic lows from a few years ago, but the lake is still far lower than its historical average and will likely see further declines this year with poor inflows and continued high demand for water.

Water supply forecast from the Colorado Basin River Forecast Center on April 1, 2025. Obtained from https://www.cbrfc.noaa.gov/wsup/pub2/discussion/current.pdf

Where does this fit in to recent trends?

The poor mountain snowpack and early melt-out this year align with the trends in Colorado’s southern mountains over the last 40+ years. We’ve analyzed the trends at the SNOTEL stations that have data back to at least 1979, for both the peak SWE and the date of the peak SWE. If you see opaque circles on the maps below, there is a statistically significant trend over this time period; if the circles are transparent the trend is not significant. In Colorado’s northern mountains, trends over the last 45 years are fairly modest overall, with some mixed signals. But in the southern mountains, the data make a very clear statement: snowpack is declining, and the peak is happening earlier. At many of the stations in the San Juan and Sangre de Cristo mountains, the peak SWE has declined by 3-5% per decade, and the peak has shifted 2-4 weeks earlier. (When this year’s poor snowpack gets incorporated, these trends might look even steeper.) A combination of factors are responsible for these trends, including that the 1980s were unusually wet, so the recent declines look even worse; rising temperatures globally and especially in the interior west, and increases in dust-on-snow that reduces the ability of snow to reflect sunlight. Heat waves in April, like the one we’ve experienced in recent days, don’t help the situation either, as discussed in this paper about a similar heatwave in April 2021. You might recall that we had one last year too.

Trends in snow water equivalent at Colorado SNOTEL stations from 1979-2024. Trend in water year peak SWE, as a change in the percent of median per decade. Credit: Colorado Climate Center
Trend in the date of the peak SWE, in days per decade. The size of the circles is proportional to the magnitude of the change (i.e., it provides the same information as the color shading). Trends are calculated using the Theil-Sen slope; if the trend is statistically significant at the 95% confidence level, the circle has opaque color shading, otherwise the shading is semi-transparent. Background shading is elevation, with blue and white colors indicating higher elevation. Credit: Colorado Climate Center

The overall downward trend doesn’t mean we can’t still get years with big snowpack — some of the same locations that are near record lows this year were near record *highs* in 2019 and 2023. But the bad years are outnumbering the good ones over time.

Could there be a “Miracle May” to improve the situation like what happened in 2015? In western US weather and climate, anything is possible! But it does not appear to be very likely. Although La Niña conditions that have been in place through the winter are waning, the NOAA Climate Prediction Center outlook shows high confidence for continued drier-than-average conditions through the spring and early summer. It would be nice if we could find some better news about drought and water in Colorado to share, but right now unfortunately there isn’t much good news to find.

Governor Gavin Newsom takes on President Trump over tariffs he says are hurting #California — Alexei Koseff (CalMatters.org)

CMA CGM Benjamin Franklin, the largest ship to dock at the port of Los Angeles. By Eric Garcetti – https://www.flickr.com/photos/99292716@N06/24241496311/, CC BY 2.0, https://commons.wikimedia.org/w/index.php?curid=47133889

By Alexei Koseff, CalMatters

In summary: Gov. Gavin Newsom and Attorney General Rob Bonta announced the lawsuit Wednesday, saying the tariffs hurt “states, consumers and businesses.”

This story was originally published by CalMatters. Sign up for their newsletters.

With the state budget hanging precariously in the balance, Gov. Gavin Newsom filed a lawsuit today to block President Donald Trump’s tariff powers.

The lawsuit, which Newsom and Attorney General Rob Bonta filed in federal court in San Francisco, argues that Trump does not have the constitutional authority to unilaterally enact tariffs. Trump cited the United States’ large trade deficit to declare a national emergency earlier this month and impose sweeping import taxes on the rest of the world.

Visiting an almond farm in Turlock, which stands to lose export business to retaliatory tariffs, Newsom expressed anger over the “toxic uncertainty” of the president’s trade policy. He said the policies are harming California more than any other state and called the tariffs a betrayal of the voters who supported Trump because of his promise to bring down the cost of living. 

“This is recklessness at another level. The geopolitical impacts are outsized. The trade impacts are outsized,” Newsom said. “No rationale, no plan, no conscience to what it’s doing to real people.”

In a matter of days in early April, Trump invoked the International Emergency Economic Powers Act of 1977 to establish a universal 10% tariff on all countries importing goods to the United States, with even higher reciprocal tariffs on some nations, then abruptly reversed course hours after they took effect, pausing most of the reciprocal tariffs while ratcheting up the import tax on China to 145%.

The chaos tanked the stock market, a huge risk for California’s forthcoming budget, which depends disproportionately on income tax revenue from capital gains earned by the wealthiest taxpayers. The state is also particularly vulnerable to other economic pain from the tariffs, because China is California’s largest trading partner, propping up manufacturing, agriculture, tourism and major ports in Los Angeles, Long Beach and Oakland.

Other significant potential impacts for California include driving up the cost of construction materials just as Los Angeles begins rebuilding from a series of devastating fires that flattened several neighborhoods in January.

California’s economic outlook is declining

Newsom said today that, anticipating higher inflation and higher unemployment from the tariffs, he has downgraded California’s economic outlook in a revised budget proposal that he plans to unveil next month. Though did not speak to Trump about the lawsuit, he said he gave the White House a heads up.

In a statement, the White House slammed Newsom for undermining Trump’s efforts to rescue American industry.

“Instead of focusing on California’s rampant crime, homelessness, and unaffordability, Gavin Newsom is spending his time trying to block President Trump’s historic efforts to finally address the national emergency of our country’s persistent goods trade deficits,” spokesperson Kush Desai said.

In their lawsuit, the fifteenth that California has filed against the Trump administration since January, Newsom and Bonta asked a judge to immediately pause Trump’s tariffs.

The state contends that the International Emergency Economic Powers Act specifies many remedies a president can take in response to a foreign economic threat, but tariffs are not among them. Without this specific authorization from Congress, the lawsuit argues, Trump’s actions are “unlawful” and “unprecedented.”

Joining Newsom in Turlock, Bonta said Trump was “attempting to override Congress and steamroll the separation of powers” and that his “rogue and erratic tariffs” must be stopped to prevent further damage to California’s economy.

“Trump has had to resort to creating bogus national emergencies that defy reason,” Bonta said. “Bottom line: Trump doesn’t have the singular power to radically upend the country’s economic landscape. That’s not how democracy works.”

Alan Sykes, who teaches international trade law at Stanford Law School, told CalMatters that California’s case has merits, but it may be difficult to win.

He said the international powers act is ambiguous about tariffs; they are not explicitly mentioned in the law, though there is language allowing for the regulation of imports and exports. But Congress has also passed other laws over the years giving away their constitutional power to set tariffs. Sykes noted that Trump could shift to citing those statutes instead if his tariffs are struck down.

“Congress has badly over-delegated authority to the president in this regard,” Sykes said. “I’m not terribly optimistic that the courts are going to rein that in.”

The lawsuit continues Newsom’s shift back toward a more aggressively confrontational stance against the Trump administration. After the Los Angeles wildfires, the governor sought to reset his relationship with Trump as he lobbied for federal disaster aid.

But even though Congress has yet to approve any further assistance for Los Angeles, Newsom has begun more vocally opposing the president’s economic policies in recent weeks. 

In the wake of Trump’s tariffs announcement earlier this month, Newsom said California would pursue its own “strategic partnerships” on international trade. The state this week launched a new tourism campaign in Canada, which has been the second largest source of international visitors to California but has already seen a steep decline this year.

Newsom was unusually harsh when speaking about Trump’s tariffs in Turlock, calling them the “poster child” for stupidity and an example of “crony capitalism” because of the president’s willingness to exempt products from favored industries such as electronics manufacturing.

“This is the personification of corruption,” Newsom said. “How in the hell are we sitting by and letting this happen?”

This article was originally published on CalMatters and was republished under the Creative Commons Attribution-NonCommercial-NoDerivatives license.

Who will give up their water? #Colorado farmers fear Colorado Spring’s need for more to feed development — The #Denver Post

Straight line diagram of the Lower Arkansas Valley ditches via Headwaters Magazine

Click the link to read the article on The Denver Post website (Elise Schmelzer). Here’s an excerpt:

April 6, 2025

Colorado Springs’ latest annexations, now under challenge, have left Arkansas River communities wary

As a worker maneuvered a massive leveler in the fields behind their house, Alan and Peggy Frantz pondered the future of their Rocky Ford farm — and their larger agricultural community strung along the Lower Arkansas River east of Pueblo. The collapse of it all doesn’t feel too far out, too improbable, Alan Frantz said. Maybe not in their lifetimes, the couple said, but they’ve made sure to send their kids to college in case it all goes away.

“At some point, the cities just have to stop growing,” Alan Frantz said. “If you want a Dust Bowl like the ’30s, go ahead and take all the water, dry this all up.”

Flood irrigation in the Arkansas Valley via Greg Hobbs

Colorado Springs is one of the cities Frantz and many of his neighbors worry most about — and now they fear a proposed 6,500-home annexation to that city will increase pressure on its utilities to source more water from the Arkansas. The farmers use the river to irrigate more than 220,000 acres of farmland, the economic backbone of the region. Already, Colorado Springs Utilities estimates it will need 34,000 more acre-feet of water — or 11 billion gallons — annually to meet population growth for when the city fully develops inside its current boundaries, estimated to occur around 2070. Every annexation of land into the state’s second-largest city adds to that future gap. Without water, there is no farming. And without farming, Frantz said, there would be no towns along the Lower Arkansas as it stretches from Pueblo to the Kansas border…

The controversy around the Colorado Springs annexation is the most recent flashpoint illustrating one of the central tensions in the state: Colorado’s cities do not have enough water to meet projected growth and climate change is shrinking the finite amount of water available. Where should the cities go for more supply? Who will give up their water? The decades-old battle plays out across the state as growing Front Range communities seek new water sources. Communities on the Western Slope fear more of their water will be routed east across the Continental Divide, especially as the region’s largest river shrinks. Farmers and ranchers in the San Luis Valley successfully fought off an attempt by a company to pipe water from the valley’s depleting aquifer to ever-growing Douglas County. Aurora’s $80-million purchase of Otero County water rights last year rankled water leaders in southeastern Colorado, prompting threats of litigation.

Colorado transmountain diversions via the State Engineer’s office