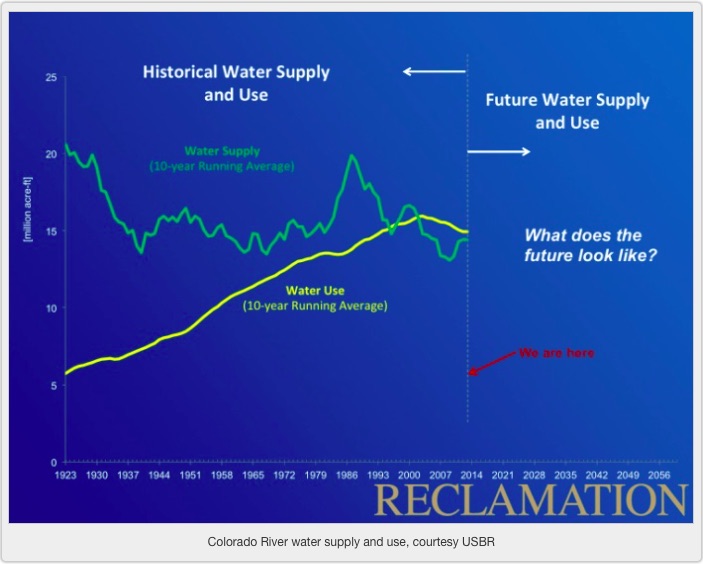
The green line is scary as hell, as is the gap between green and yellow. We’re using more water than the system seems capable of providing. But if we’re going to make sense of the decline in Lake Mead, we also have to think through why the yellow line, the line showing water use in the Colorado River Basin, is bending down…
The basic message, seen time and again in arid western North America, is that people tend to speed recklessly toward the water supply cliff, but when they near it, they almost inevitably hit the brakes. It would be great if we weren’t so reckless in the speeding part, but that seems to be an inevitable result of historical contingency, the problem of path dependence, and human nature. Blame our historical selves if you must, but whatever. That’s done. The key here is the “hitting the brakes” part.
So what bent the yellow curve down?
The first thing is the undertold story of the reduction in California’s Colorado River allocation. Up until 2002, California regular was allocated more than 5 million acre feet of water from the river, for use in desert farming and urban/suburban communities. In 2002, it peaked at 5.3 maf. In 2003, that was cut to 4.4 maf. In response, Southern California showed remarkable adaptive capacity with conservation, conjunctive ground-surface water management, innovative ag-to-urban transfers and a bunch of other stuff. (Buy my book! As soon as I quit with all the blogging and write the damn thing!)
The second thing is just same old same old in the Upper Basin. As Mike Cohen likes to remind me, when you’re up at the headwaters part of the system without a big reservoir above you, when there’s less snow in the mountains above you, you use less water. “Shortage” is a normal part of variability. These people have the “adaptive capacity” already built in.
There are two common themes that emerge here. The first is a boundary condition: once the water gets scarce, people use less water. The second is the nature of the adaptive capacity, which is a bunch of fuzzy social and human and institutional stuff that you’ve got to be able to call on to either succeed or fail when the boundary condition whacks you upside the head and says, “Yo, less water this year!” It’s that adaptive capacity (the ability to pivot to conservation, or ag-urban transfers, or some such) that determines whether you succeed or fail.
The yellow line on Terry’s graph suggest we’re already stomping on the brakes, but yellow is still above green, meaning water use still exceeds supply. What can we learn from the stuff that’s already working to help us step on the brakes a bit harder?
The Pueblo Board of Water Works has filed a substitute water supply plan with the Colorado Division of Water Resources in order to supply water to the Historic Arkansas Riverwalk of Pueblo.
The plan is to replace water to HARP that is now being diverted by Black Hills Energy, which supplied HARP through a tailwater right, according to Bill Paddock, attorney for Pueblo Water.
Black Hills is planning on tearing down old Stations 5 & 6, the Downtown power plant, which would throw the diversion into question.
Pueblo Water has a 1993 water right for 30 cubic feet per second which provides the base flow for HARP. It is planning to supply another up to 90 cfs next year in order to prevent weeds and algae from growing and to maintain water quality.
Pueblo Water plans to use its fully consumable water rights, mainly those from transmountain diversions, but including some in-basin rights that have been converted, to supply HARP.
Documents in the case were filed Wednesday and are subject to comments from other water users who might be injured.
HARP water is diverted just upstream of the Downtown Whitewater Park near the East Fourth Street bridge. The intake became a matter of concern during discussions of the Pueblo Conservancy District in May regarding reconstruction of the levee through the area.
Pueblo County is in line for a little shelter from the storm.
Colorado is requesting disaster designation for 11 counties after heavy rainfall and flooding caused extensive damage in May and June.
Gov. John Hickenlooper signed the declaration Thursday based on initial assessments of about $20 million in damage from the storms. That request goes to the Federal Emergency Management Agency, which will forward it to President Barack Obama for final approval.
The bulk of damage was reported in El Paso County, which claimed $13.9 million. Pueblo County was assessed at $685,000 in damage, with about $280,000 of that in city limits, according to the state Division of Homeland Security and Emergency Management.
“The amount could go up, and it’s not guaranteed,” said Chief Mark Mears of the Pueblo County sheriff’s emergency services bureau.
The major areas of damage in Pueblo County were Overton Road on Fountain Creek about 10 miles north of Pueblo and North Creek Road in Beulah. Funds for those projects could also come through a federal highway fund, Mears said.
Damage assessments in other Southeastern Colorado counties were Fremont, $626,000; Baca, $140,000; and Saguache, $22,000. Other counties were Elbert, Logan, Morgan, Sedgwick and Yuma.
The money is for debris removal, emergency protective measures and the repair, replacement or restoration of disaster-damaged, publicly owned facilities and infrastructure. Private claims aren’t covered.
According to state documents submitted to FEMA, Pueblo County reported rainfall on 54 of 70 days from April 20-June 28, with up to 13 inches cumulative at one reporting station.
County commissioners declared a disaster on May 22, after losing part of Overton Road to Fountain Creek.
There was also damage to North Creek Road in Beulah.
The city of Pueblo reported damage to flood control structures and trails along Fountain Creek.
El Paso County’s request included damage in Manitou and Colorado Springs, as well as in the county.
In Fremont County, the towns of Coal Creek, Rockvale and Williamsburg also reported damage.
Grand Falls Little Colorado River
Here’s the release from the Environmental Protection Agency (Soledad Calvino/Rick Abasta):
The U.S. Environmental Protection Agency and the Navajo Nation EPA announced a pair of settlements with the Navajo Tribal Utility Authority to bring its wastewater treatment facility in Window Rock into compliance both with the federal Clean Water Act and the Navajo Nation Clean Water Act.
EPA’s agreement backs up a recent ground-breaking NNEPA settlement that required the NTUA to pay a $25,000 penalty. This is the first time that a tribally-owned entity has paid a penalty for violations of the Navajo Nation Clean Water Act. The NTUA has committed to bring the Window Rock facility into full compliance by December 31, 2015, or face additional penalties. NTUA has also agreed to build new infrastructure for the treatment plant at the site.
“For over 35 years we have partnered with the Navajo Nation to protect public health and the environment,” said Jared Blumenfeld, EPA’s Regional Administrator for the Pacific Southwest. “EPA applauds the Navajo Nation EPA for its leadership in setting this precedent that protects the Nation’s precious water resources.”
“The Navajo Nation Clean Water Act was created to protect the public health and the environment. These laws must be complied with by everyone within the Navajo Nation,” said Dr. Donald Benn, Executive Director of NNEPA. “The Window Rock Facility was out of compliance for a long time, prompting NNEPA’s Water Quality program to initiate an enforcement action. The parties have reached an agreement and Navajo EPA appreciates the cooperation by NTUA to implement a long term goal for compliance.”
An EPA inspection revealed that since at least 2011 NTUA had been discharging pollutants above its permit limits to Black Creek, a tributary of the Puerco River that feeds into the Little Colorado River. Other violations of the NTUA’s National Pollutant Discharge Elimination System permit included its failure to submit complete and timely reports while inadequately operating and maintaining its existing treatment system. The plant collects and treats sanitary sewage from a population of about 13,300 in Apache County, Ariz., within the boundaries of the Navajo Nation.
The settlements require the NTUA to conduct sampling, submit quarterly reports, train and certify the plant’s operators, and hold regular compliance meetings with senior officials of EPA and NNEPA. The NTUA will also submit a plan for EPA and NNEPA’s approval for the construction of an entirely new treatment plant including a detailed schedule for commissioning and bringing the new facility on-line. Approximately $10 million in funding for the new facility was provided through the U.S. Department of Agriculture’s Rural Utilities Service Water and Waste Disposal Loans and Grants Program
For more information on Navajo Nation EPA, please visit: http://navajonationepa.org/ or call the Administration Office for assistance at (928) 871-7692.
More Environmental Protection Agency coverage here
The United States is currently experiencing the third strongest summertime El Niño since 1950, and it could strengthen.
“Basically since mid-May things have coalesced into a very strong El Niño and I would say we are on the verge of calling it a super El Niño. That may take a few months to be certain, but that’s where it’s drifting,” said University of Colorado, Boulder researcher Klaus Wolter.
“Certainly this is the biggest event since 1997/1998 which was the last super El Niño.”
What Makes An El Niño ‘Super’?
Researchers use complex modeling including data from buoys in the tropical Pacific to predict large climate events like El Niño – all while keeping an eye on the past. According to Wolter, a big indicator is temperature. If sea surface temperatures keep going up in the tropical Pacific, so does the likelihood of a super El Niño…
What Does A Super El Niño Mean For Colorado?
Between the typical monsoon season, from July to September, along with the strong El Niño, Colorado will see a wet fall. That might test some rain-weary Coloradans, but in drier parts of the West it will be welcome.
“It makes a much bigger difference for California,” Wolter said. “They have a much better shot at recovering from the drought this winter with a super El Niño situation than with a weak to moderate one.”
According to past events, Wolter said the hallmark of an El Niño and a monsoon is the landfalling hurricanes in the eastern Pacific, most commonly in September, which equates to heavy downpours on the western slope…
How Will A Super El Niño Affect Colorado’s Snowpack?
If the El Niño continues into the winter, it will affect the frequency of storms, said Wolter.
“You actually might get some fairly big snowstorms pretty early in the season, which can set the base. If you don’t get that, if you don’t have a string of storms in Oct. or even Nov. going into the winter, then the chance of recovering [the snowpack] during the winter is minimal.”
But if the El Niño holds together into spring 2016, the snowpack could recover.
“The super El Niño in 1983 went right into the summer. That’s really the best case scenario. If you get a reasonably wet fall, put some good snow down early in the season, make it through the winter on a shoestring if you will, then get that wet spring, that can more than make up for a dry winter,” Wolter said.
That situation would benefit both the ski industry and the parched southwest, including Lake Mead, which relies on the Colorado River basin for water.
Colorado has seen false starts in El Niño-related weather before. During the spring of 2014, weather patterns and conditions seemed to point to a strong event, but the El Niño did not progress over the summer.
But this 2015 El Niño is different.
“There’s no way it’s going to disappear any time soon,” Wolter said. “The question is will it last well into the spring, or is it going to die early next year. But it will be around for the next 6 months, there’s no question about that.”
By October, Wolter will know for sure.
“Right now I’m thinking it’s a 70 to 80 percent chance of a super El Niño.”
…El Nino is part of a complex global weather pattern and cannot be singled out as the cause for a specific type of weather feature. For Colorado, and the US, we have many dominate weather patterns tied to other events similar to the El Nino Southern Oscillation (ENSO).
I speak often of the Pacific Decadal Oscillation (PDO) and the Atlantic Multi-Decadal Oscillation (AMO) as they control our drought frequencies over periods of decades. These are ocean areas that control weather patterns depending on how warm, or cold, the water is. Like ENSO, if warm they bring one type of weather, and if cold can bring another type. I point out these other features now as a possible explanation at a later date – you are about to see why when I show you just how little affect El Nino actually brings to the state.
Simply looking at only ENSO’s impact on Colorado, I’ve found some very interesting things that will defy many of your “beliefs” and memories of El Nino years in the past…
We currently have a strong El Nino signal coming from a very warm Pacific Ocean in the ENSO region. This will likely persist through the end of 2015 and into the first half of 2016 based on current climate modeling.
So, what does this mean for Denver? This is where you may be surprised. Denver, and Colorado, is mostly impacted by El Nino in the fall and spring, not the winter.
Since El Nino is commonly misconstrued as causing bad winters, let’s talk about the snowfall seasons with El Nino versus a neutral pattern or a La Nina.
I looked at Denver’s snowfall data back to 1882. El Nino snowfall seasons are just a bit snowier than average (2-inches snowier) and La Nina’s have a bit less snow (4-inches below average). The difference is likely much less than you were thinking. We are talking the difference of a single snow, or a couple smaller snow storms… not all that oppressive. Note: Boulder, Castle Rock, and other higher suburbs do have a more significant increase in the odds of bigger snow storms during El Nino…
There is some accuracy to say that yes El Nino years can bring bigger snowstorms than La Nina years. However, the season itself may not necessarily be snowier by much more than a few inches. That list alone shows that most of our biggest snows occurred in a neutral phase. Surprised yet?
At this point I’m not saying your memories of 1997 are invalid. There was a singular big snowstorm that pushed the season to 72-inches, 15-inches snowier than normal. However, that was due to one storm. Overall 1997-98 wasn’t known for its winter, it was known for a very active monsoon in the summer and fall.
The summer of 1997 was incredibly wet. The Front Range was 3.33 inches wetter than average. The fall was nearly 1.5-inches wetter than average, but then it stopped. The winter of 1997/98 was a quarter of an inch dry and the following spring was nearly an inch drier than average.
That’s using 1997 as an example, but that pattern is repeated in history. Other similar years had wetter summers and falls before drying out a lot in winter. Yes, that’s in an El Nino period…
If you are interested in how El Nino has impacted our mountains I’m going through all that data right now. It appears to be a similar connection to the Denver area. The strong El Nino of 1997 didn’t bring the mountains much snow. In fact, much of that winter into 1998 had only 50-90% of average mountain snowpack.