Gov. Hickenlooper and #Colorado Energy Office award $10.33 million grant to build electric vehicle fast-charging stations across the state #ActOnClimate

Leaf, Berthoud Pass Summit, August 21, 2017.

Heres the release from Governor Hickenlooper’s office:

Governor John Hickenlooper today announced a $10.33 million ALT Fuels Colorado grant through the Colorado Energy Office (CEO) to ChargePoint to build electric vehicle (EV) fast-charging stations along the state’s major transportation corridors. The fast-charging stations will be located in communities at 33 sites across six Colorado corridors comprised of Interstate, State and U.S. highways.

“Fast-charging stations give EV drivers the confidence to reliably travel to all corners of the state,” said Governor John Hickenlooper. “The future of EV travel in Colorado is bright thanks to this new partnership with ChargePoint.”

A lack of EV fast-charging stations along major transportation corridors limits the ability of EV drivers to engage in intra-and interstate travel and represents a major barrier for current and prospective EV owners. The Colorado Electric Vehicle Plan requires the State to build out Colorado’s EV fast-charging infrastructure through public-private partnerships. In April, CEO issued a request for ALT Fuels Colorado grant applications to directly address this requirement. This ALT Fuels Colorado grant also helps implement Colorado’s Beneficiary Mitigation Plan and the State’s commitment to the multi-state Regional Electric Vehicle West Memorandum of Understanding.

“ChargePoint brings technology built for today but capable of serving the next generation of EVs as well, said Colorado Energy Office Executive Director Kathleen Staks. “Charging stations will be placed with well-known site hosts in locations that provide easy access, proximity to amenities and 24/7 charging availability.”

ChargePoint is a national leader in EV charging. The company designs, builds and supports all the technology that powers its charging networks, from charging station hardware to energy management software.

“The transition to electric mobility is upon us, and pioneering states like Colorado are leading the way by supporting a broad charging network that enables long distance electric travel,” said Pasquale Romano, ChargePoint President and CEO. “We share the State of Colorado’s vision of a cleaner, more sustainable electric mobility future, and we look forward to working with the Colorado Energy Office to expand EV charging in the state.”

Woo hoo! DC Fast Charging!

#Drought news: D3 (Extreme Drought) trimmed in Routt County

Click here to go to the US Drought Monitor website. Here’s an excerpt:

Summary

A series of upper-level weather systems, and their associated surface lows and fronts, moved across the contiguous U.S. (CONUS) during this U.S. Drought Monitor (USDM) week. They brought beneficial precipitation to much of the Pacific coast; parts of the northern and central Rockies, central Plains, Midwest, and Gulf of Mexico coast; and much of the Mid-Atlantic to Northeast. But they missed much of the Southwest, northern Plains, and southern Plains, where no precipitation, or less than a tenth of an inch, fell. Based on precipitation recorded through the 12z (7:00 a.m. EST) cutoff on Tuesday morning, the precipitation was less than the weekly normal across parts of the interior Pacific Northwest and northern New England, and much of the Midwest and Southeast. While beneficial, the precipitation in the West was mostly not enough to overcome months of precipitation deficits. Slight contraction of drought or abnormal dryness occurred in parts of Arizona (a reassessment), Colorado, and Montana, while expansion occurred in southern California and Nevada. Building precipitation deficits prompted expansion in the southern Plains. Rain and snow from the weather systems this week – and previous weeks to the last 6 months – have built up precipitation surpluses across much of the country east of the Mississippi River, with streamflow mostly above normal and November 25 reports from the U.S. Department of Agriculture (USDA) showing soil moisture surpluses in most states here, Florida and coastal Georgia and South Carolina being the exceptions. Contraction and expansion of abnormal dryness occurred in coastal Georgia and South Carolina to accommodate a variable precipitation pattern…

West

The Pacific weather systems brought beneficial rain and snow to coastal Washington and Oregon, and parts of central to northern California and the Sierra Nevada range. Widespread amounts of 2-4 inches occurred, with locally up to 5 inches in parts of northern coastal California and the Sierra, and 5-10 inches in the Olympic Peninsula of western Washington. Some parts of the Sierra Nevada measured more than a foot of new snow. The rain helped firefighters contain the Camp wildfire and snow improved mountain snowpack. But it wasn’t enough to overcome precipitation deficits which have built up over many months. While the week was wetter than normal in California, coastal Washington, and parts of Oregon, the water year to date (October 1-November 27), and even month to date (November 1-27), were still drier than normal in most areas. The precipitation was enough to prevent further expansion of drought areas, but not enough for improvement this week. Little to no precipitation fell further south. In southern California and southern Nevada, D1 expanded across parts of Nye, Esmeralda, and Inyo Counties where dryness this week and the last several weeks, as well as long-term dryness, were reflected in the SPI, SPEI, soil moisture models, and groundwater indices.

Half an inch to locally over 2 inches of precipitation fell across parts of the northern to central Rockies as the weather systems moved past, improving the snowpack half a foot to a foot in many places. In Colorado, D3 was trimmed in Routt County where recent precipitation has dropped SPIs and snowpack has improved. But further south, except for the northern Utah and Colorado mountains, little to no precipitation occurred across the Four Corners States. Some improvement occurred in southwest Arizona as a re-assessment of conditions. D1 was trimmed in Maricopa to Yuma Counties, and D2 reduced in La Paz County, where the heaviest rains fell over the last 2 months. The SPI shows wet conditions across much of Arizona, especially the southern portions, for the last 2 to 9 months and even 24 months. However, how and when the precipitation fell is very important. A lot of the rain fell in only a couple heavy rain events in the first 2 weeks of October. Much of the rain probably just ran off and didn’t get a chance to really contribute to the total moisture status, but it shows up in the SPI as wet. Also, the hot temperatures of recent months and years have enhanced evapotranspiration (ET), and this is reflected in very dry SPEI values, especially at time scales of 6 months and longer. The drought depiction in Arizona reflects these longer-term drought conditions…

High Plains

Half an inch to an inch of precipitation fell in areas across Wyoming, Nebraska, and northern Kansas, with little to no precipitation occurring in the Dakotas and the High Plains of Montana. The precipitation was not enough to affect the D0-D1 lingering in northeast Kansas. Even though the week was drier than normal in north central Montana, the D0 there was trimmed to reflect a reassessment of the impact of precipitation in recent weeks. The D0-D1 in the Dakotas reflected lingering long-term dryness…

South

Half an inch of precipitation fell across parts of coastal Texas and Louisiana, parts of Mississippi, and extreme northeastern Arkansas. But most of Texas and Oklahoma received no precipitation this week, and have been drier than normal for most of the last 4-7 weeks. Mounting dryness over the last 3-6 months prompted expansion of D0-D1 in northeast Oklahoma into northwest Arkansas, with some D0 expanding into adjacent southwest Missouri and bleeding slightly into adjacent southeast Kansas. The areas of D0-D1 in Texas remained unchanged this week…

Looking Ahead

A Pacific weather system was moving across the West during Tuesday and Wednesday after the 12z cutoff time of the USDM, bringing more beneficial rain and snow to the drought areas of the Pacific coast to Great Basin; another was poised to move into the West Coast by the release time of this USDM report; a third is expected to bring more precipitation to the West over the weekend; while a fourth Pacific front is forecast to reach the coast by Tuesday morning. These weather systems will cross the Rockies and re-energize when they reach the Plains, picking up Gulf of Mexico moisture to bring precipitation to the central and eastern portions of the CONUS. The NWS Quantitative Precipitation Forecast (QPF) for November 28-December 4 calls for 3-6 inches of new precipitation across the Sierra Nevada to northern California, and in spotty areas of coastal Oregon and Washington, with 2+ inches in parts of the Midwest, in a couple strips across the Southeast, speckled across the Four Corners States, and in parts of southwest Alaska. Half an inch to 2 inches of precipitation is predicted for the Great Basin to central and southern Rockies, much of the Midwest, and parts of the Northeast. Outside these areas, 0.25 to 0.50 inch is expected to fall, except little to no precipitation is forecast for southern portions of the Southwest, much of Texas and Oklahoma, much of the northern Plains, and eastern Alaska. Above-normal temperatures will precede the fronts, especially in the eastern CONUS, with below-normal temperatures following them, spreading across most of the CONUS by the end of the period. The outlook for December 4-12 has colder-than-normal temperatures dominating the CONUS with warmer-than-normal temperatures across Alaska as a classic ridge/trough upper-level weather pattern sets up. Late in the period, warmer-than-normal air moves into the West as the trough migrates further east. Odds favor below-normal precipitation along the northern tier states and Alaska panhandle, and above-normal precipitation along the southern tier states, across much of the West, and the rest of Alaska.

#ClimateChange signals and impacts continue in 2018 — World Meteorological Organization #ActOnClimate

Here’s the release from the World Meteorological Organization:

The long-term warming trend has continued in 2018, with the average global temperature set to be the fourth highest on record. The 20 warmest years on record have been in the past 22 years, with the top four in the past four years, according to the World Meteorological Organization (WMO).

Other tell-tale signs of climate change, including sea level rise, ocean heat and acidification and sea-ice and glacier melt continue, whilst extreme weather left a trail of devastation on all continents, according to the WMO provisional Statement on the State of the Climate in 2018. It includes details of impacts of climate change based on contributions from a wide range of United Nations partners.

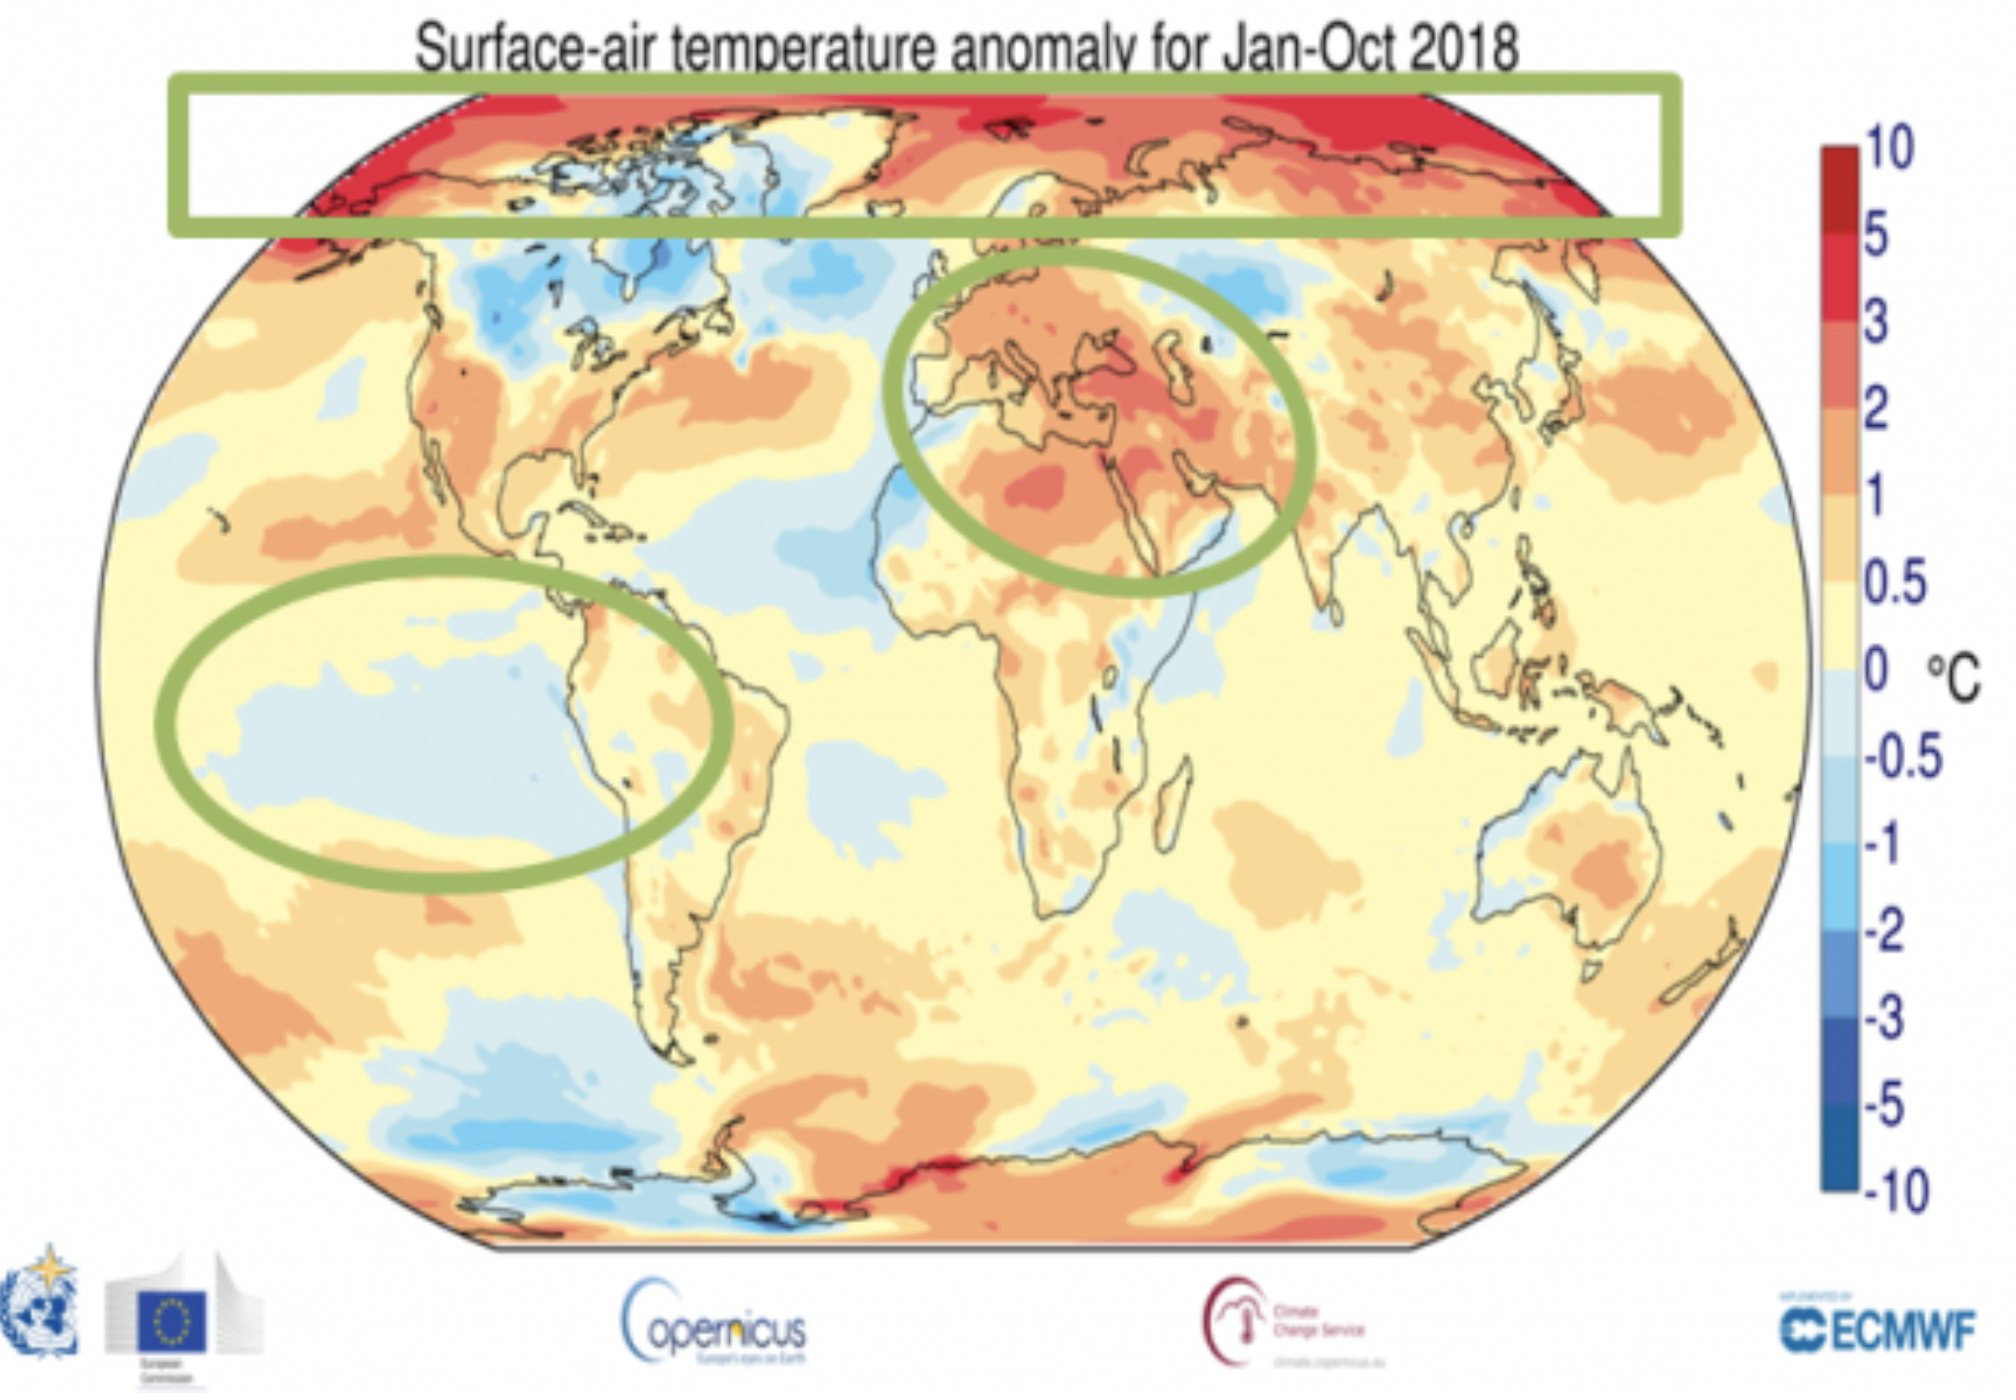
The report shows that the global average temperature for the first ten months of the year was nearly 1°C above the pre-industrial baseline (1850-1900). This is based on five independently maintained global temperature data sets.

“We are not on track to meet climate change targets and rein in temperature increases,” said WMO Secretary-General Petteri Taalas. “Greenhouse gas concentrations are once again at record levels and if the current trend continues we may see temperature increases 3-5°C by the end of the century. If we exploit all known fossil fuel resources, the temperature rise will be considerably higher,” he said.

“It is worth repeating once again that we are the first generation to fully understand climate change and the last generation to be able to do something about it,” said Mr Taalas.

The Intergovernmental Panel on Climate Change (IPCC) special report on Global Warming of 1.5°C reported that the average global temperature for the decade 2006-2015 was 0.86°C above the pre-industrial baseline. The average increase above the same baseline for the most recent decade 2009-2018 was about 0.93°C and for the past five years, 2014-2018, was 1.04°C above the pre-industrial baseline.

“These are more than just numbers,” said WMO Deputy Secretary-General Elena Manaenkova.

“Every fraction of a degree of warming makes a difference to human health and access to food and fresh water, to the extinction of animals and plants, to the survival of coral reefs and marine life. It makes a difference to economic productivity, food security, and to the resilience of our infrastructure and cities. It makes a difference to the speed of glacier melt and water supplies, and the future of low-lying islands and coastal communities. Every extra bit matters,” said Ms Manaenkova.

The WMO report adds to the authoritative scientific evidence that will inform UN climate change negotiations from 2-14 December in Katowice, Poland. The key objective of the meeting is to adopt the implementation guidelines of the Paris Agreement on Climate Change, which aims to hold the global average temperature increase to as close as possible to 1.5°C.

The IPCC report on Global Warming of 1.5°C said that this target was physically possible but would require unprecedented changes in our lifestyle, energy and transport systems. It showed how keeping temperature increases below 2°C would reduce the risks to human well-being, ecosystems and sustainable development.

National meteorological and hydrological services have been contributing to national climate assessments. A new U.S. federal report detailed how climate change is affecting the environment, agriculture, energy, land and water resources, transportation, and human health and welfare, with a risk that it will lead to growing losses to American infrastructure and property and impede the rate of economic growth over this century.

A UK assessment published 26 November warned summer temperatures could be up to 5.4°C hotter and summer rainfall could decrease by up to 47% by 2070, and sea levels in London could rise by 1.15m by 2100. A Swiss report on climate scenarios released on 13 November said that Switzerland is becoming hotter and drier, but will also struggle with heavier rainfall in the future and its famed ski resorts will have less snow.

“The WMO community is enhancing the translation of science into services. This will support countries in generating national climate scenarios and predictions and developing tailored climate services to reduce risks associated with climate change and increasingly extreme weather. WMO is also working to develop integrated tools to monitor and manage greenhouse gas emissions and carbon sinks,” said WMO Chief Scientist and Research Director Pavel Kabat.

Highlights of the provisional statement on the state of the climate

Temperatures: 2018 started with a weak La Niña event, which continued until March. By October, however, sea-surface temperatures in the eastern Tropical Pacific were showing signs of a return to El Niño conditions, although the atmosphere as yet shows little response. If El Niño develops, 2019 is likely to be warmer than 2018.

Greenhouse gases: In 2017, carbon dioxide, methane and nitrous oxide concentrations reached new highs, according to WMO Greenhouse Gas Bulletin. Data from a number of locations, including Mauna Loa (Hawaii) and Cape Grim (Tasmania) indicate that they continued to increase in 2018.

Oceans: The oceans absorb more than 90% of the energy trapped by greenhouse gases and 25% of anthropogenic CO2 emissions, making them warmer and more acidic. For each 3-month period until September 2018, ocean heat content was the highest or second highest on record. Global Mean Sea Level from January to July 2018 was around 2 to 3 mm higher than the same period in 2017.

Sea ice: Arctic sea-ice extent was well below average throughout 2018 with record-low levels in the first two months of the year. The annual maximum occurred in mid-March and was the third lowest on record. The minimum extent in September was the 6th smallest on record, meaning that all 12 smallest September extents have been in the past 12 years. Antarctic sea-ice extent was also well below average throughout 2018. The annual minimum extent occurred in late February and was ranked as one of the two lowest extents.

Extreme Weather

Tropical Storms: The number of tropical cyclones was above average in all four Northern Hemisphere basins, with 70 reported by 20 November, compared to the long-term average of 53, leading to many casualties. The Northeast Pacific basin was especially active, with an Accumulated Cyclone Energy that was the highest since reliable satellite records began.

Two of the strongest tropical cyclones were Mangkhut, which impacted the Philippines, Hong Kong SAR and China, and Yutu, which brought devastation in the Mariana Islands. Jebi was the strongest typhoon to hit Japan since 1993, Son-Tinh caused flooding in Viet Nam and Laos, whilst Soulik contributed to flooding on the Korean peninsula. Hurricanes Florence and Michael were associated with huge economic damage and considerable loss of life in the United States. Gita, in the South Pacific, was the most intense and most expensive cyclone to ever hit Tonga.

Floods and rainfall: In August, the southwest Indian state of Kerala suffered the worst flooding since the 1920s, displacing more than 1.4 million people from their homes and affecting more than 5.4 million. Large parts of western Japan experienced destructive flooding in late June and early July, killing at least 230 people and destroying thousands of homes. Flooding affected many parts of east Africa in March and April. This included Kenya and Somalia, which had previously been suffering from severe drought, as well as Ethiopia and northern and central Tanzania. An intense low-pressure system in the Mediterranean Sea in late October brought flooding, high winds and loss of life.

Heatwaves and drought: Large parts of Europe experienced exceptional heat and drought through the late spring and summer of 2018, leading to wildfires in Scandinavia. In July and August, there were numerous record high temperatures north of the Arctic Circle, and record long runs of warm temperatures., including 25 consecutive days above 25 °C in Helsinki (Finland). Parts of Germany had a long spell of days above 30°C, whilst a heatwave in France was associated with a number of deaths. It was also an exceptionally warm and dry period in the United Kingdom and Ireland. A short but intense heatwave affected Spain and Portugal in early August.

Dry conditions were especially persistent in Germany, the Czech Republic, western Poland, the Netherlands, Belgium and parts of France. The Rhine approached record low flows by mid-October, seriously disrupting river transport.

Eastern Australia experienced significant drought during 2018, especially New South Wales and southern Queensland, with much of the region receiving less than half its average rainfall for the period from January to September. Severe drought affected Uruguay, and northern and central Argentina, in late 2017 and early 2018, leading to heavy agricultural losses.

Both Japan and the Republic of Korea saw new national heat records (41.1 °C and 41.0°C respectively.)

Oman reported one of the highest known minimum overnight temperature of 42.6 °C in June. Algeria saw a new national of 51.3 °C in July.

Cold and snow: One of the most significant cold outbreaks of recent years affected Europe in late February and early March.

Wildfires: Major wildfires affected Athens (Greece) on 23 July, with many fatalities. British Columbia in Canada broke its record for the most area burned in a fire season for the second successive year. California suffered devastating wildfires, with November’s Camp Fire being the deadliest fire in over a century for the U.S.A.

Other Impacts

The provisional statement contained details of impacts of climate change, based on contributions from the Food and Agriculture Organization (FAO), International Organization for Migration (IOM), UN Environment Programme (UNEP), UNESCO’s Intergovernmental Oceanographic Commission (IOC), UN High Commission for Refugees UNHCR) and World Food Programme (WFP). This section will be expanded in the final statement, to be released in March 2019.

Exposure of agriculture sectors to climate extremes is threatening to reverse gains made in ending malnutrition. New evidence shows a rise in world hunger after a prolonged decline. In 2017, the number of undernourished people was estimated to have increased to 821 million, according The State of Food Security and Nutrition in the World 2018, by to FAO, WFP, the International Fund for Agricultural Development, the UN Children’s Fund and the World Health Organization. Africa is the region where climate events had the biggest impact on acute food insecurity and malnutrition in 2017, affecting 59 million people in 24 countries and requiring urgent humanitarian action. Much of the vulnerability to climate variability is associated with the dryland farming and pastoral rangeland systems supporting 70–80% of the continent’s rural population.

Out of the 17.7 million Internally Displaced Persons tracked by the IOM, 2.3 million people were displaced due to disasters linked to weather and climate events as of September 2018. In Somalia, some 642 000 new internal displacements were recorded between January and July 2018 by UNHCR, with flooding the primary reason for displacement (43%), followed by drought (29%), and conflict (26%).

UN agencies including UNESCO-IOC and UNEP are tracking environmental impacts associated with climate change include coral bleaching, reduced levels of oxygen in the oceans, loss of “Blue Carbon” associated with coastal ecosystems such as mangroves and salt marshes. Climate change also exposes peatlands currently protected by permafrost to thawing and possible increased methane emissions and loss of carbon, and the associated sea-level rise increases the risks of coastal erosion and salination of freshwater peatlands.

@NASA: Scarcity Of Water Will Be The Environmental Challenge Of The Century

Groundwater storage trends for Earth’s 37 largest aquifers from UCI-led study using NASA GRACE data (2003 – 2013). Of these, 21 have exceeded sustainability tipping points and are being depleted, with 13 considered significantly distressed, threatening regional water security and resilience.
Credits: UC Irvine/NASA/JPL-Caltech

From PulseHeadlines.com (Pablo Luna):

A recent NASA study was performed to track global freshwater trends from 2002 to 2016 by collecting from the NASA Gravity Recovery and Climate Experiment. James Famiglietti, of the NASA Jet Propulsion Laboratory in California, explained, “What we are witnessing is major hydrologic change. We see for the first time a very distinctive pattern of the wetland areas of the world getting wetter, in the high latitudes and the tropics, and the dry areas in between getting drier. Within the dry areas, we see multiple hotspots resulting from groundwater depletion.” One of the areas that has been most affected is Antarctica, where 10% of its glaciers are in retreat.

According to those involved with the study, there is “clear human fingerprint” on the global water cycle. NASA has a first-of-its-kind satellite, showing that over 30 parts of the globe show dramatic depletion of fresh water. “This report is a warning and an insight into a future threat. We need to ensure that investment in water keeps pace with industrialisation and farming. Governments need to get to grips with this,” said Jonathan Farr, a senior policy analyst at the charity WaterAid. Farr says, “We have been solving the problem of getting access to water resources since civilisation began. We know how to do it. We just need to manage it, and that has to be done at a local level.”

Both the climate crisis and human activity are the two main factors causing water scarcity today, calling upon greater action and better water management by humans before the issue gets worse.