
Click on a thumbnail graphic below to view a gallery of snowpack data from the NRCS.

Colorado Statewide basin-filled map April 1, 2019 via the NRCS.

Statewide Basin High/Low graph April 1, 2019 via the NRCS.

South Platte River Basin High/Low graph April 1, 2019 via the NRCS.

San Miguel, Colorado, Animas, and San Juan Basin High/Low graph April 1, 2019 via the NRCS.

Arkansas River Basin High/Low graph April 1, 2019 via the NRCS.

Upper Colorado River Basin High/Low graph April 1, 2019 via the NRCS.

Laramie and North Platte Basin High/Low graph April 1, 2019 via the NRCS.

Gunnison River Basin High/Low graph April 1, 2019 via the NRCS.

Yampa and White Basin High/Low graph April 1, 2019 via the NRCS.

Upper Rio Grande River Basin High/Low graph April 1, 2019 via the NRCS.
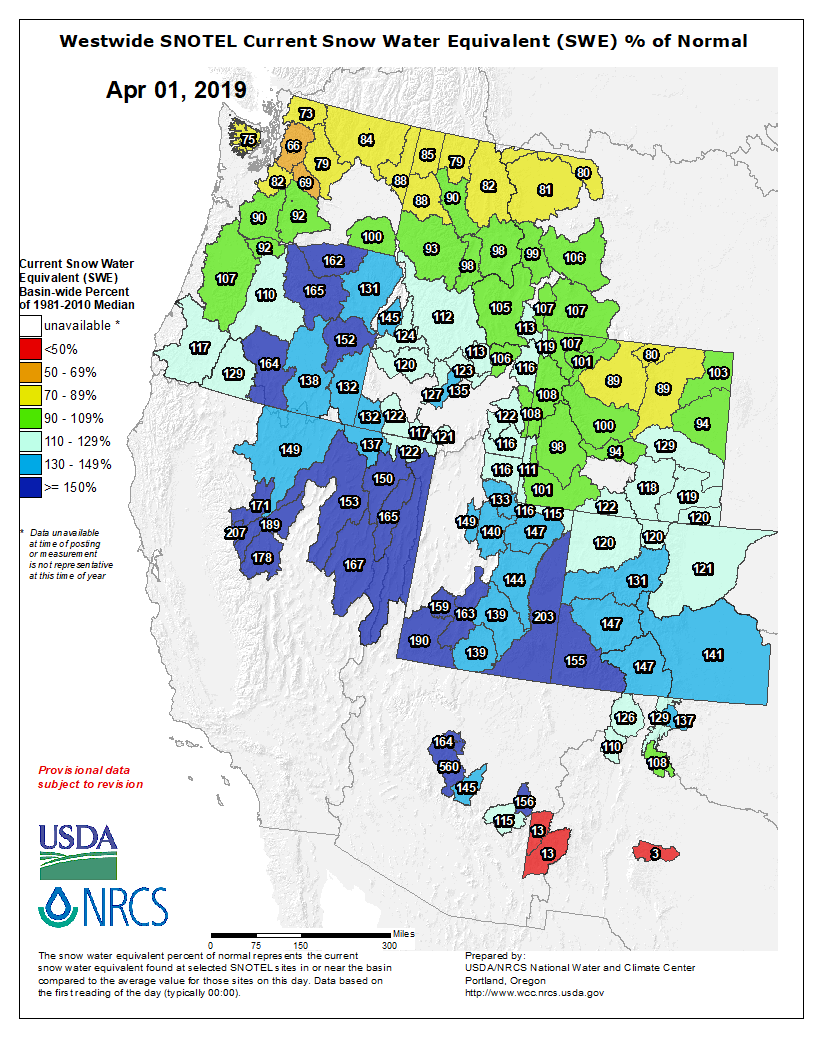
And here’s the Westwide basin-filled map for April 1, 2019 via the NRCS.
And just for grins here’s a gallery of early April snowpack maps from the NRCS.

Colorado Statewide basin-filled map April 1, 2019 via the NRCS.

Statewide snowpack April 3, 2018 via the NRCS.

Statewide snowpack basin-filled map April 4, 2017 via the NRCS.

Statewide snowpack map April 10, 2016 via the NRCS.

Statewide snowpack map Basin High/Low Graph April 1, 2015 via the NRCS

Statewide snowpack April 1, 2014 via the NRCS

Statewide snowpack April 1, 2013 via the NRCS

Statewide snowpack April 2, 2012 via the NRCS

Colorado snowpack basin-filled map April 3, 2011 via the NRCS.

Colorado snowpack basin-filled map April 1, 2010 via the NRCS.