
Click on a thumbnail graphic below to view a gallery of snowpack data from the NRCS.

Statewide snowpack basin-filled map April 22, 2019 via the NRCS.

Statewide Basin High/Low graph April 22, 2019 via the NRCS.

Upper Rio Grande River Basin High/Low graph April 22, 2019 via the NRCS.

San Miguel, Dolores, Animas, and San Juan Basin High/Low graph April 22, 2019 via the NRCS.

Gunnison River Basin High/Low graph April 22, 2019 via the NRCS.

Yampa and White Basin High/Low graph April 22, 2019 via the NRCS.

Upper Colorado River Basin High/Low graph April 22, 2019 via the NRCS.

South Platte River Basin High/Low graph April 22, 2019 via the NRCS.

Laramie and North Platte Basin High/Low graph April 22, 2019 via the NRCS.

Arkansas River Basin High/Low graph April 22, 2019 via the NRCS.
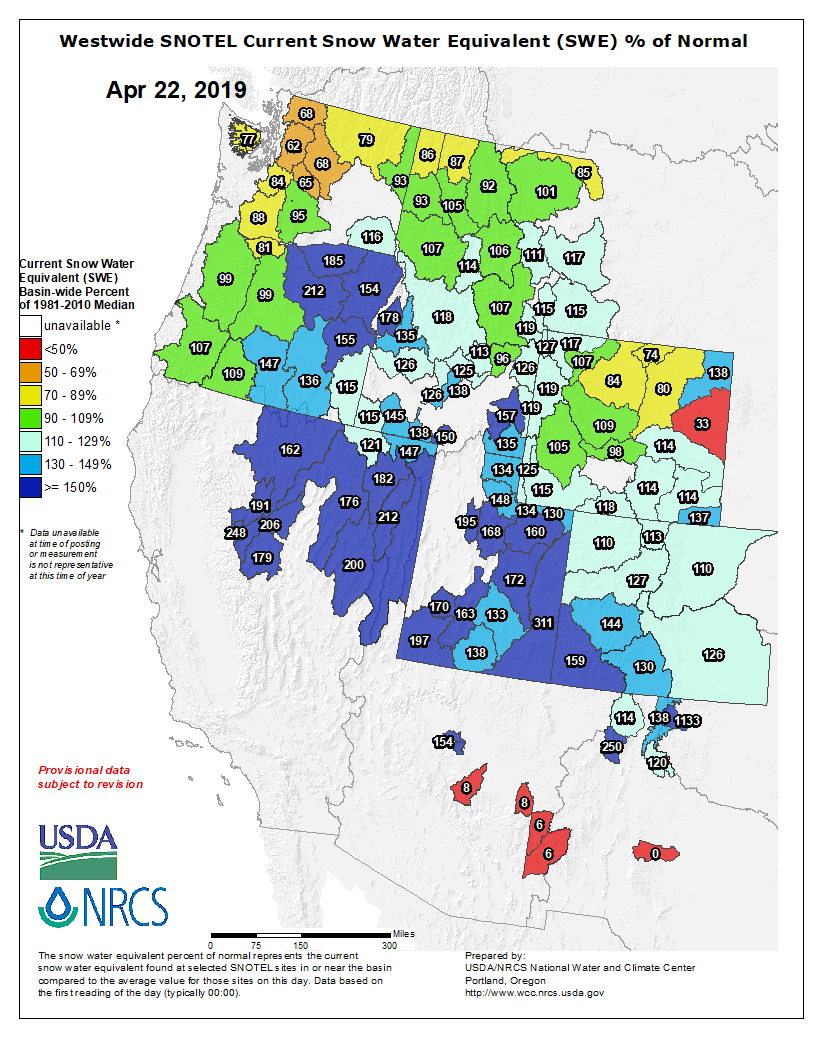
Here’s the Westwide SNOTEL basin filled map for April 22, 2019 from the NRCS.
Streamflow is looking normal and above for those gages that are reporting. Below is a screenshot of the USGS Water Watch website from this morning.
