Click the link to access the report on the Colorado Climate website (Russ Schumacher, Becky Bolinger, Peter Goble, Alistair Vierod). Some highlights:


Click the link to access the report on the Colorado Climate website (Russ Schumacher, Becky Bolinger, Peter Goble, Alistair Vierod). Some highlights:
Click the link to read the article on the USFS website (Randy Moore):
November 24, 2023: In January 2022, we launched our Wildfire Crisis Strategy. This strategy provided a vision for what it will take to meaningfully change how people, communities and natural resources experience risk from wildfire. Its implementation to this point has been funded by the historic down payments Congress made through the Bipartisan Infrastructure Law and the Inflation Reduction Act.
I’m pleased to report that we have made significant progress in implementing this daring and critical strategy.
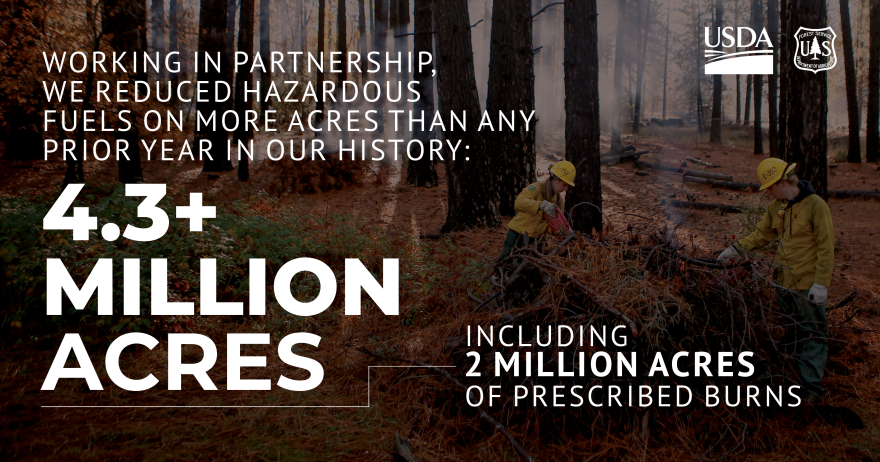
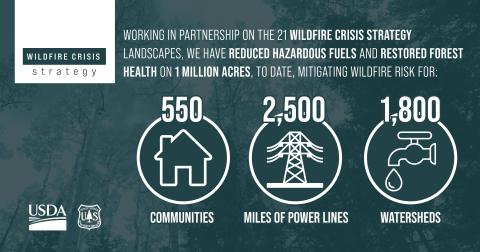
We are focusing our initial efforts on the 250 highest risk firesheds in the West, which account for roughly 80% of the wildfire risk to communities. Our employees and partners have now collectively treated more than 1 million acres within the 21 Wildfire Crisis Strategy priority landscapes. This initial accomplishment is commendable, and I am incredibly proud of our agency. It has come as result of tremendous effort from thousands of employees across all parts of the agency. Our diligent work to reduce hazardous fuels and restore forest health in these landscapes directly translates to mitigating wildfire risk for 550 communities, 2,500 miles of power lines and 1,800 watersheds. In addition, we were able to exceed our national 4-million-acre fuels reduction target, including a record 1.9 million acres treated with prescribed fire. Going into this year, we know we must keep our focus and build upon this accomplishment. With more than 19 million acres still left to treat, this year we plan to exceed last year’s accomplishments as we realize the capacity we built throughout the past year.
This includes efforts by 148 unique partner organizations, including tribal nations, state agencies, non-government organizations, and finance and industry partners. Programs like the Collaborative Forest Landscape Restoration Program and Joint Chiefs’ Landscape Restoration Partnership helped bolster these efforts in and around high-risk firesheds.
As you know, the number of acres treated represents just one piece of the larger effort to confront the wildfire crisis. We are assisting at-risk communities with planning for and mitigating wildfire risk through the new Community Wildfire Defense Grant Program. This year alone we’ve invested $197 million of Bipartisan Infrastructure Law funding into projects spanning 22 states and seven tribes. In June, we invested more than $43 million in 123 projects nationwide through the Community Wood Grants Program and Wood Innovations Grant Program. These investments will directly support the strategy to reduce risk in the places where it poses the most immediate threats to communities.
While we strive to limit the severity of future wildfires, another agency priority is reforesting areas after our past wildfires. These two priorities go hand in hand—reducing risk of future wildfires and restoring areas impacted by the historic wildfires over the past years. We have identified 4 million acres of National Forest System lands in potential need of reforestation, which is key to long-term forest recovery and mitigating the effects of climate change. While this need is largely caused by wildfires, additional reforestation needs have also been created by insect infestations, diseases and drought.
To address this reforestation backlog, we released the National Forest System Reforestation Strategy in July 2022. This strategy outlines the goals and objectives that are necessary for successful reforestation, including robust framework to increase the pace and scale of reforestation, address existing needs, anticipate future events and meet the requirements of the Repairing Existing Public Land by Adding Necessary Trees, or REPLANT, Act of 2021.
Accomplishing this work has taken the dedication, time and energy of employees like you. It has required each of us to work in new ways. We have experienced growing pains and challenges, but we are already seeing meaningful results. I want to extend my sincere thanks and gratitude to all of you who have contributed to these efforts. You are making a difference for the American public whom we serve and the natural resources we manage.
We know that fully achieving the vision laid out by the Wildfire Crisis Strategy will require further investments and that those investments need to be sustained. In the coming years, continued funding will allow us to build upon the work we’ve already accomplished. We will continue ramping up the pace and scale of our hazardous fuel reduction and forest management treatments to confront the crisis, using every tool and authority at our disposal and growing the list of partners we work with.
Our goal is a great challenge, but one I know our agency and partners are up for.
Editor’s Note: Provide feedback about this column, submit questions or suggest topics for future columns through the FS-Employee Feedback inbox.

Click the link to read the article on the NOAA website:
October Highlights:
- January–October 2023 ranked as the warmest such period on record, and there is a greater than 99% chance that 2023 will be the warmest year in NOAA’s 174-year record.
- For the seventh consecutive month, global ocean surface temperature set a record high.
Antarctica had its sixth consecutive month with the lowest sea ice extent on record.- Fifteen named storms occurred across the globe in October, which was above the 1991–2020 average of 12.
Globally, October 2023 was the warmest October in the 174-year NOAA record. The year-to-date (January–October) global surface temperature ranked as the warmest such period on record. October 2023 marked the fifth consecutive month of record-warm global temperatures. According to NCEI’s Global Annual Temperature Outlook and data through October, there is a greater than 99% probability that 2023 will rank as the warmest year on record.

This monthly summary, developed by scientists at NOAA’s National Centers for Environmental Information, is part of the suite of climate services NOAA provides to government, business, academia and the public to support informed decision-making.
Monthly Global Temperature
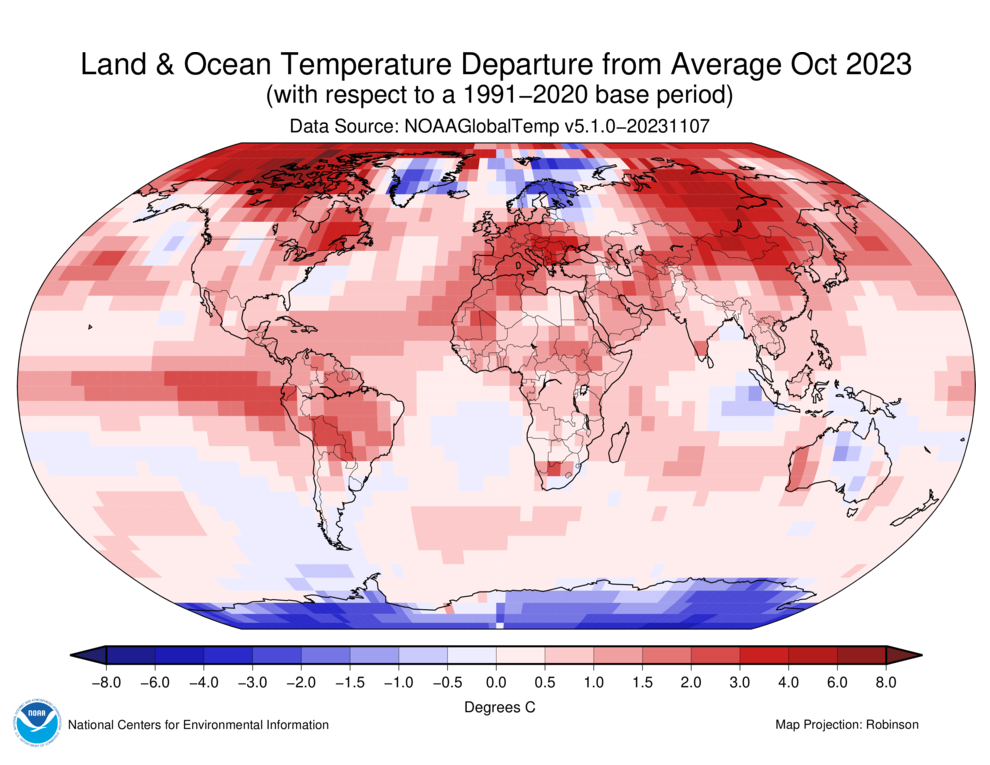
The October global surface temperature was 2.41°F (1.34°C) above the 20th-century average of 57.1°F (14.0°C) and ranks as the warmest October in NOAA’s 174-year record. This was 0.43°F (0.24°C) above the previous record from October 2015. October 2023 marked the 47th consecutive October and the 536th consecutive month with temperatures above the 20th-century average. The past 10 Octobers (2014–2023) have been the warmest Octobers on record.
South America and Asia had their warmest Octobers on record. North America, Africa and Europe each had their second-warmest Octobers, while October in Oceania ranked 15th warmest on record. October in the Arctic ranked fifth warmest while the Antarctic region had its sixth-coldest October on record. For the seventh consecutive month, global ocean surface temperature set a record high.
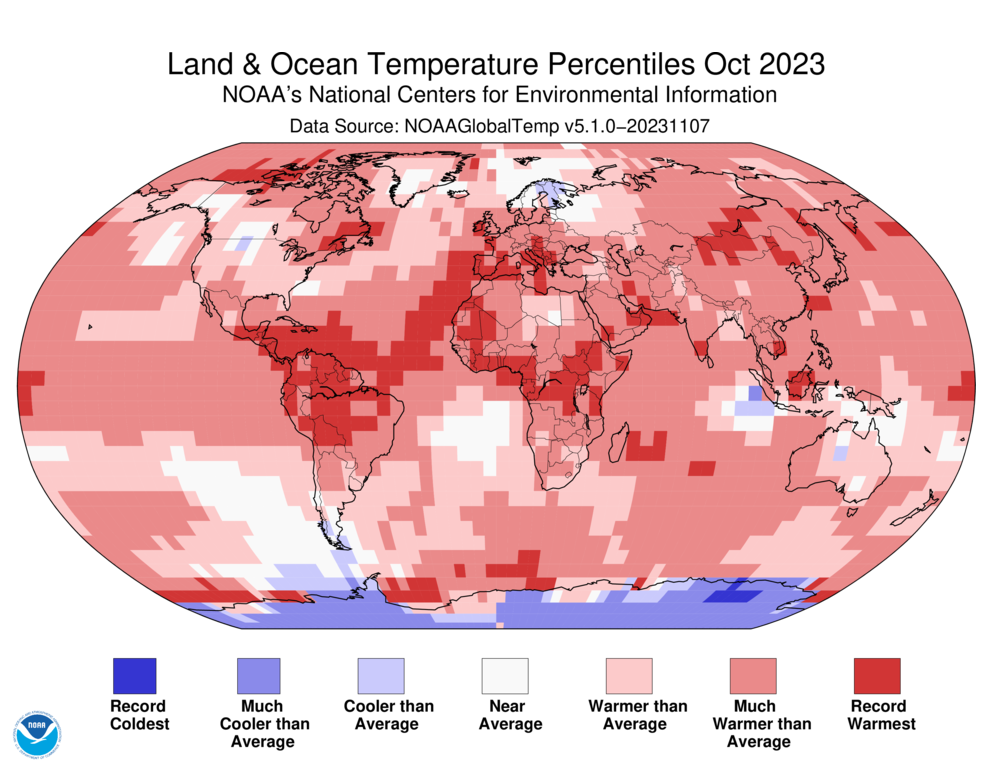
Temperatures were above average throughout most of North America, South America, western, southern and eastern Europe, Africa, Asia, Oceania and the Arctic. Parts of Central and South America, Africa, Europe, northeastern North America and central Asia experienced record-warm temperatures this month. Sea surface temperatures were above average across much of the northern, western and southwestern Pacific as well as the northern Atlantic and the Indian Oceans. Record-warm temperatures covered nearly 11% of the world’s surface this October, which was the highest percentage for October since the start of records in 1951.
Temperatures were near to cooler than average across parts of Antarctica, southern South America, north-central North America, the Nordic countries, Greenland and northern Oceania. Sea surface temperatures were near to below average over parts of the southeastern Pacific Ocean, the eastern Indian Ocean and the southern Atlantic Ocean. Less than 1% of the world’s surface had a record-cold October.
Snow Cover and Sea Ice Extent
October 2023 set a record for the lowest global October sea ice extent on record. This primarily resulted from record-low sea ice extent in the Antarctic, which saw its sixth consecutive month with the lowest sea ice extent on record. Globally, October 2023 sea ice extent was 380,000 square miles less than the previous record low from October 2016.
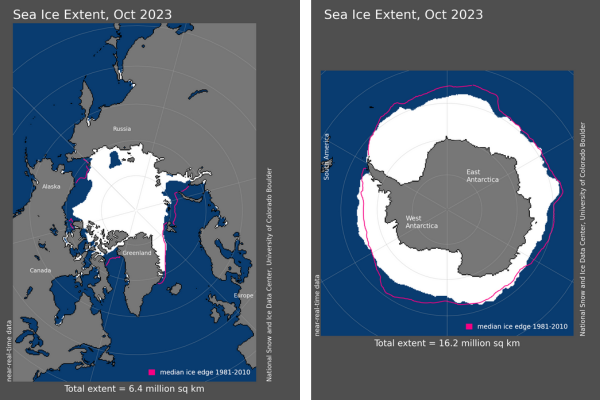
The Arctic sea ice extent for October 2023 ranked as the seventh smallest in the satellite record at 2.46 million square miles, or 430,000 square miles below the 1991–2020 average. October sea ice extent in the Antarctic ranked lowest on record at 6.25 million square miles, which was 780,000 square miles below the 1991–2020 average. Eight of the first 10 months in 2023 have seen Antarctic sea ice extent at record-breaking low levels.
According to data from NOAA and analysis by the Rutgers Global Snow Lab, the Northern Hemisphere snow cover extent during October was 170,000 square miles below the 1991–2020 average. This ranks as a near-average Northern Hemisphere snow cover extent for October. Extent was slightly below average in both North America and Eurasia.
Global Precipitation
In general, rainfall anomaly patterns followed the current El Niño and Indian Ocean Dipole patterns, ranging from floods in eastern Africa to drought in Central and South America. Above-average precipitation in Europe somewhat alleviated drought conditions in the region, with floods affecting Italy and the United Kingdom. The mean global precipitation for this October set the record for this month with a value 6% above the long-term average, and the intensity of the global Intertropical Convergence Zone also set a record for October due to global warming and current El Niño conditions.
Global Tropical Cyclones
Across the globe in October, 15 named storms occurred, which was above the 1991–2020 average of 12. Nine of those reached tropical cyclone strength (≥74 mph), and seven reached major tropical cyclone strength (≥111 mph). Super Typhoon Bolaven in the West Pacific and Hurricane Otis in the East Pacific both reached Category 5 strength (≥157 mph). The global accumulated cyclone energy, which is an integrated metric of the strength, frequency, and duration of tropical storms, was about 34% above the 1991-2020 average for October.
For a more complete summary of climate conditions and events, see our October 2023 Global Climate Report or explore our Climate at a Glance Global Time Series.