

From Colorado State University (Kate Hawthorne Jeracki):
How much rain fell on Colorado this week? And where? Colorado residents can help the weather experts at Colorado State University answer these questions.
In response to the incredible recent rains and flooding in parts of the state, the Colorado Climate Center will be mapping rainfall totals and graphing hourly intensities for the entire state for the period beginning Sunday, Sept. 8 (as storms first developed over southern Colorado) through the end of the storm later this weekend
“As is typical of Colorado storms, some parts of the state were hard hit and others were untouched. Still, this storm is ranking in the top ten extreme flooding events since Colorado statehood,” said Nolan Doesken, State Climatologist at CSU. “It isn’t yet as extreme or widespread as the June 1965 floods or as dramatic as the 1935 floods but it ranks right up there among some of the worst.”
Among the worst, according to Climate Center data, occurred in May 1904, October 1911, June 1921, May 1935, September 1938, May 1955, June 1965, May 1969, October 1970, July 1976, July 1981, and, of course, the Spring Creek Flood of July 1997 that ravaged Fort Collins and the CSU campus. “Every flood event in Colorado has its own unique characteristics,” said Doesken. “But the topography of the Colorado Front Range makes this area particularly vulnerable when the necessary meteorological conditions come together as they did this week.”
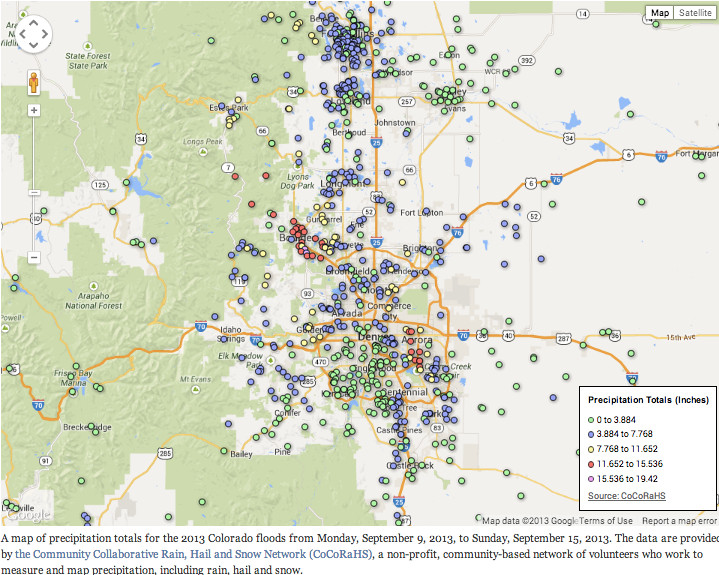
Data from automated rain gauges maintained by several federal and local agencies will be combined with data from the National Weather Service’s weather radar system and their volunteer Cooperative Observer and storm spotter networks. This will be compiled with rain gauge reports from over 1,000 volunteers who are active participants in the Community Collaborative Rain Hail and Snow Network (CoCoRaHS), which was formed in response to the Spring Creek Flood.
“While this may be the most thoroughly documented storm in our history with so much technology and observational data available, we still have many parts of our state where we don’t know how much rain has fallen,” Doesken said. “We realize that many people have weather stations and cameras, and sharing that data could help fill in the gaps to better document the timing of rainfall and its intensity and the patterns of subsequent flooding. Even just a measurement from a bucket that was left outdoors could be helpful — provided you tell us the dimensions of the bucket.”
Rain gauge measurements, personal anecdotes about this storm and unique photos that will help to document this storm should be sent to coflood2013@gmail.com. “This type of information is incredibly important for future construction, engineering, transportation, communication as well as energy and water infrastructure for Colorado,” Doesken added. Floods have happened before and they will happen again, but the more we know about them the better we can prepare for the next one.”
Daily and storm total rainfall patterns will be available on the Colorado Climate Center website http://ccc.atmos.colostate.edu. Rainfall maps for the entire U.S. and parts of Canada are updated daily at http://www.cocorahs.org.
From The Denver Post (William Porter):
The torrential rain and floods swamping vast swaths of Colorado have been described as “biblical” and bona fide a 100-year storms. The numbers are staggering. Consider:
• Boulder’s 25 square miles were awash in an estimated 4.5 billion gallons of water as of Friday morning, according to reports in The Denver Post.
• An acre-foot of water — the amount of water covering 1 acre with a foot of water — equals 326,000 gallons. The equivalent of 13,803 acre-feet of water fell in the Boulder area.
A football field is roughly 1 acre.
• Boulder Creek hit a flow rate of 4,500 cubic feet per second, more than doubling the previous high flow recorded during the last quarter century, according to the U.S. Geological Survey gauging station. The river usually runs at 100 to 300 cfs.
A cubic foot of water weighs 62.4 pounds. That means that at one point Boulder Creek was roaring with 280,800 pounds of water a second, or just over 140 tons. The standard railroad locomotive weighs 120 to 240 tons, depending on the model.• The velocity and churn of the water in Boulder Creek was the equivalent of a Class IV rapid, an “expert” level typically encountered on the Arkansas and Colorado rivers during runoff season.
• During flash floods, 2 feet of water can move with enough force to wash away a car. Just 6 inches of water can knock a Denver Bronco-sized adult off his or her feet.
• Converting an inch of rainwater into the equivalent amount of snow is a bit tricky, given the variables. One inch of rain will produce 3½ to 4 inches of wet snow, but potentially 10 to 12 inches of light powder. With the amount of rain in Boulder, a powdery snow could have been up to the eaves of single-story homes.
• Car engines will generally flood if water reaches halfway up the wheels — less than that if the vehicle is in motion, because of surging water.
• Flood stage in the Big Thompson River is 6 feet. Water in the Big Thompson crested at 10.55 feet at 6:30 a.m. Friday. That’s more than the 9.31-foot peak in the 1976 flood that killed 144 people.
Here’s the latest Denver Post map of rainfall totals.
Boulder on verge of breaking all-time annual precipitation record http://t.co/Ou49zkHsJs
— ChieftainNews (@ChieftainNews) September 16, 2013
Story's up, Colorado's oil and gas industry shuts down 100s of wells as of Monday morning. http://t.co/Ht9l0pwTMf
— Cathy Proctor (@CProctorDenBiz) September 16, 2013
7 Day Precipitation Estimates – http://t.co/lmkUr7A6Rp
— NWS Boulder (@NWSBoulder) September 16, 2013
Portions of South Platte are at 49,000 cfs, which roughly equates to the Mississippi River. More than a mile across in some areas. #coflood
— Luke Runyon (@LukeRunyon) September 16, 2013
Colorado flood health hazards: How to avoid them http://t.co/02kXEbI6Sn
— Denver Post Breaking (@DenverPostBrk) September 16, 2013
My basement was flooded due to the storms. I had water come into the basement two times in one week. It was devastating to see and the cleanup is still ongoing.