
Click on a thumbnail graphic to view a gallery of snowpack data from the NRCS.

Statewide basin-filled snowpack map February 5, 2018 via the NRCS.

Statewide Basin High/Low graph February 4, 2018 via the NRCS.

Yampa and White Basin High/Low graph February 4, 2018 via the NRCS.

San Miguel, Dolores, Animas, and San Juan Basin High/Low graph February 4, 2018 via the NRCS.

Upper Rio Grande River Basin High/Low graph February 4, 2018 via the NRCS.

Laramie and North Platte Basin High/Low graph February 4, 2018 via the NRCS.

Gunnison River Basin High/Low graph February 4, 2018 via the NRCS.

Upper Colorado River Basin High/Low graph February 4, 2018 via the NRCS.

Arkansas River Basin High/Low graph February 4, 2018 via the NRCS.

South Platte River Basin High/Low graph February 4, 2018 via the NRCS.
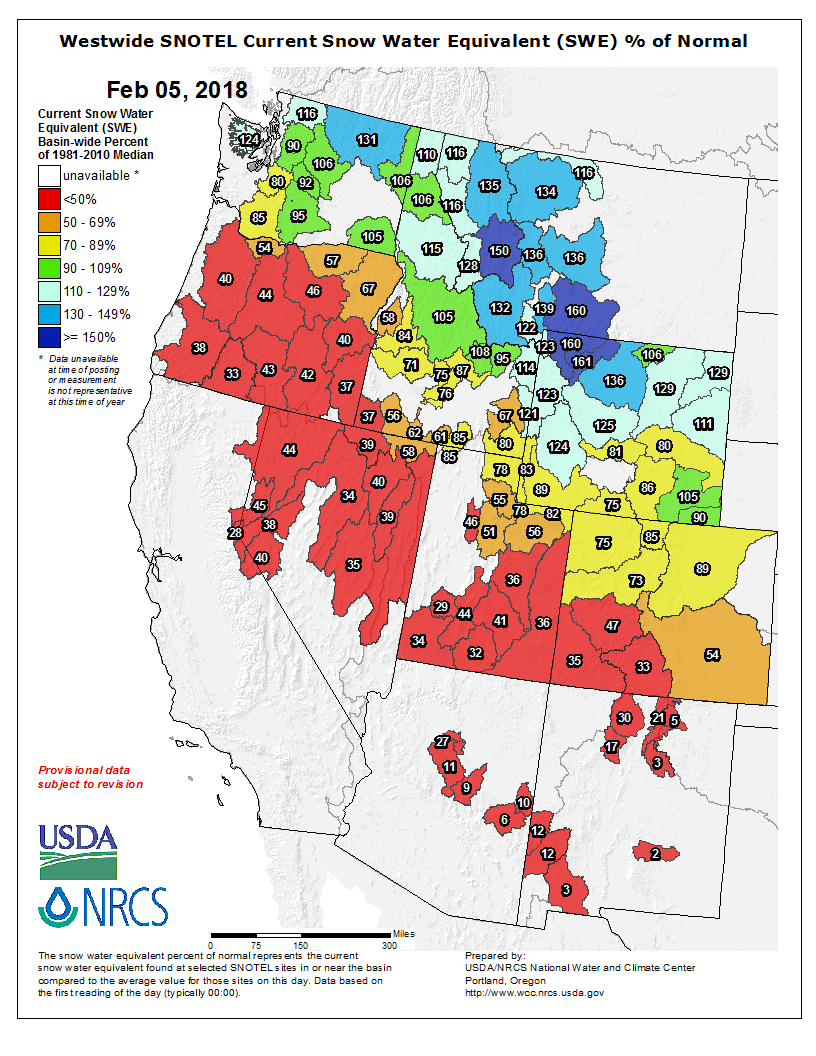
Here’s the Westwide SNOTEL basin-filled map for February 5, 2018 from the NRCS.
And here’s the situation in California where they perform their own snow course measurements independent of the NRCS.

Do you generate these NRCS snowpack summary graphs or is there a place where you pull them from pre-generated? I am trying to learn how to make graphs that look like these, but with different water years selected for comparison purposes? Thanks!
The NRCS generates them: https://www.nrcs.usda.gov/wps/portal/nrcs/detail/co/snow/?cid=nrcs144p2_063301