From The Conversation (Robert B. Richardson):
Experts widely agree that human activities are harming the global environment. Since the Industrial Revolution, the world economy has grown dramatically. Overall this is a success story, since rising incomes have lifted millions of people out of poverty. But it has been fueled by population growth and increasing consumption of natural resources.
Rising demand to meet the needs of more than 7.6 billion people has transformed land use and generated unprecedented levels of pollution, affecting biodiversity, forests, wetlands, water bodies, soils and air quality.
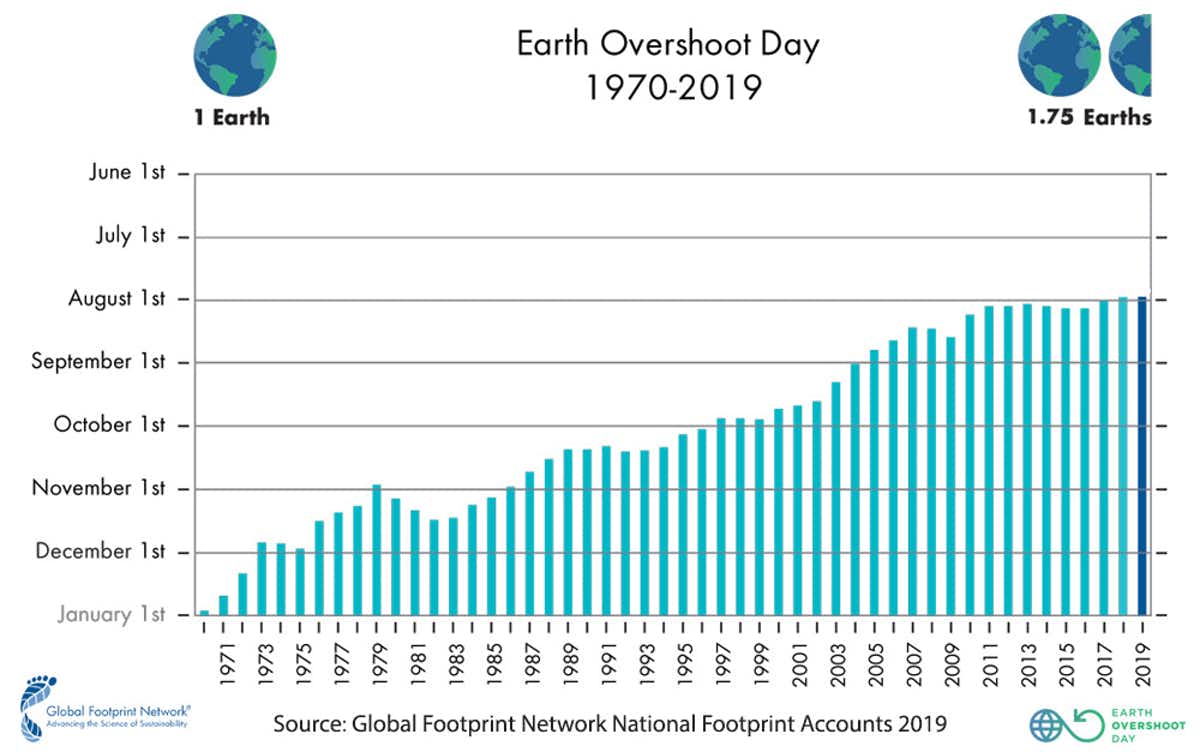
It’s pretty certain that humans are consuming more resources than the Earth can regenerate. An updated estimate of how fast that consumption is happening suggests it’s more rapid this year than in the past 50, according to the California-based Global Footprint Network. This environmental nonprofit calculates the annual arrival of Earth Overshoot Day – the date when humanity’s demands on nature exceed what the network’s analysts estimate the Earth can regenerate over the entire year. This year they peg the date as July 29 – the earliest date since ecological overshoot began in the early 1970s.
As an ecological economist and scholar of sustainability, I am particularly interested in metrics and indicators that can help us understand human uses of Earth’s ecosystems. Better measurements of the impacts of human activities can help identify ways to sustain both human well-being and natural resources.
Earth Overshoot Day is a compelling concept and has raised awareness of the growing impact of human activities on the planet. Unfortunately, the methodology used to calculate it and the ecological footprint on which it is based is conceptually flawed and practically unusable in any science or policy context. In my view, the ecological footprint ultimately does not measure overuse of natural resources – and it may very well underestimate it.
Rising demands, finite resources
The Global Footprint Network estimates when Earth Overshoot Day will arrive based on its National Footprint Accounts. These include extensive data sets that the organization uses to calculate two overarching indicators:
The ecological footprint, perhaps the most commonly used metric of the environmental impacts of human resource use. Each country’s ecological footprint is an estimate of the biological resources required to meet its population’s consumption demands and absorb its carbon emissions National biocapacity, which is an estimate of how well each country’s ecosystems can produce the natural resources consumed by humans and absorb the waste and pollution that humans generate. Both of these measures are expressed in global hectares. One hectare is equal to 10,000 square meters, or about 2.47 acres.
Going into overshoot
To estimate when Earth Overshoot Day will arrive, the Global Footprint Network calculates the number of days in a given year for which Earth has enough biocapacity to provide for humans’ total ecological footprint.
When the footprint of consumption worldwide exceeds biocapacity, the authors assert that humans are overshooting, or exceeding the regenerative capacity of Earth’s ecosystems. This year, they estimate that humans are using natural resources 1.75 times faster than ecosystems can regenerate – or, put another way, consuming 1.75 Earths.
As an example, the ecological footprint for the United Kingdom is 4.4 global hectares per person, and global biocapacity is 1.63 hectares per person. Therefore, it would take (4.4 /1.63) 2.7 Earths if everyone lived like the British.
The U.K.‘s Overshoot Day would be estimated as 365 x (1.63 /4.4) = 135, or the 135th day of the year, which is May 17 based on 2016 data. The United States reached overshoot even earlier, on March 15.
What to count?
However, there are some fundamental and misleading shortcomings in these calculations. In a 2013 paper, six authors from academia, The Nature Conservancy and the California-based Breakthrough Institute analyzed how the Ecological Footprint falls short. In their view, it primarily measures humans’ carbon footprint but does not fully address other key impacts.
To calculate ecological footprints, the Global Footprint Network estimates the supply and demand of renewable biological resources across six land use types: forests, fishing grounds, croplands, grazing lands, developed lands and the area of forest required to offset human carbon emissions – that is, the carbon footprint. According to the network’s own analysis, each of these land use types is nearly in balance or in surplus, except for the carbon footprint.
The two key categories for producing food – cropland and grazing land – are defined in such a way that they can never be in deficit. And the analysis does not reflect environmental consequences of human use of these lands, such as soil erosion, nutrient runoff or overuse of water. It measures only land area.
For example, the ecological footprint for Indonesia is 1.7 global hectares per person, which is among the lowest 30% of all countries. But according to a 2014 study, Indonesia has the highest deforestation rate in the world.
Furthermore, the footprint calculation does not consider whether stocks of natural resources are decreasing or increasing as a result of human consumption. This question is critical for understanding ecological impacts.
These national ecological footprint calculations also conflate sustainability with self-sufficiency. They assume that every nation should produce all of the resources it consumes, even though it might be less expensive for countries to import some goods than to produce them at home.
As an example, the network lists Canada as an “ecological creditor” whose biocapacity exceeds its population’s ecological footprint. However, Canada is among the top 5 oil-producing countries in the world, and exports much of that oil for foreign consumption. Most of it goes to the United States, an “ecological debtor” that consumes more resources than it produces.
Thinking purely in terms of generic “resources,” everyone is better off when debtor countries can import resources from nations with supplies to spare. There are real and important environmental impacts associated with producing and consuming oil, but the network’s calculations do not address them. Nor do they reflect the decline in natural capital from extracting a nonrenewable resource.
Measuring sustainability
The Global Footprint Network asserts that “You can’t manage what you can’t measure,” but it may be impossible to create a single metric that can capture all human impacts on the environment. Earth Overshoot Day highlights unsustainable uses of natural resources, but we need scientifically robust ecological indicators to inform environmental policy, and a broader understanding of ecological risks.
Better measurements of sustainability should reflect changes in our supplies of natural capital, include estimates of uncertainty and incorporate multiple pathways to reduce carbon footprints. The best tool for measuring human impacts on the planet may be a dashboard of environmental indicators, not a footprint.