
Click on a thumbnail graphic to view a gallery of snowpack data from the NRCS.

Colorado snowpack basin-filled map November 25, 2019 via the NRCS.

Arkansas River Basin High/Low graph November 25, 2019 via the NRCS.

Upper Colorado River Basin High/Low graph November 25, 2019 via the NRCS.

Gunnison River Basin High/Low graph November 25, 2019 via the NRCS.

Laramie and North Platte Basin High/Low graph November 25, 2019 via the NRCS.

Upper Rio Grande River Basin High/Low graph November 25, 2019 via the NRCS.

San Miguel, Dolores, Animas, and San Juan Basin High/Low graph November 25, 2019 via the NRCS.

South Platte River Basin High/Low graph November 25, 2019 via the NRCS.

Yampa and White Basin High/Low graph November 25, 2019 via the NRCS.

Statewide Basin High/Low graph November 25, 2019 via the NRCS.
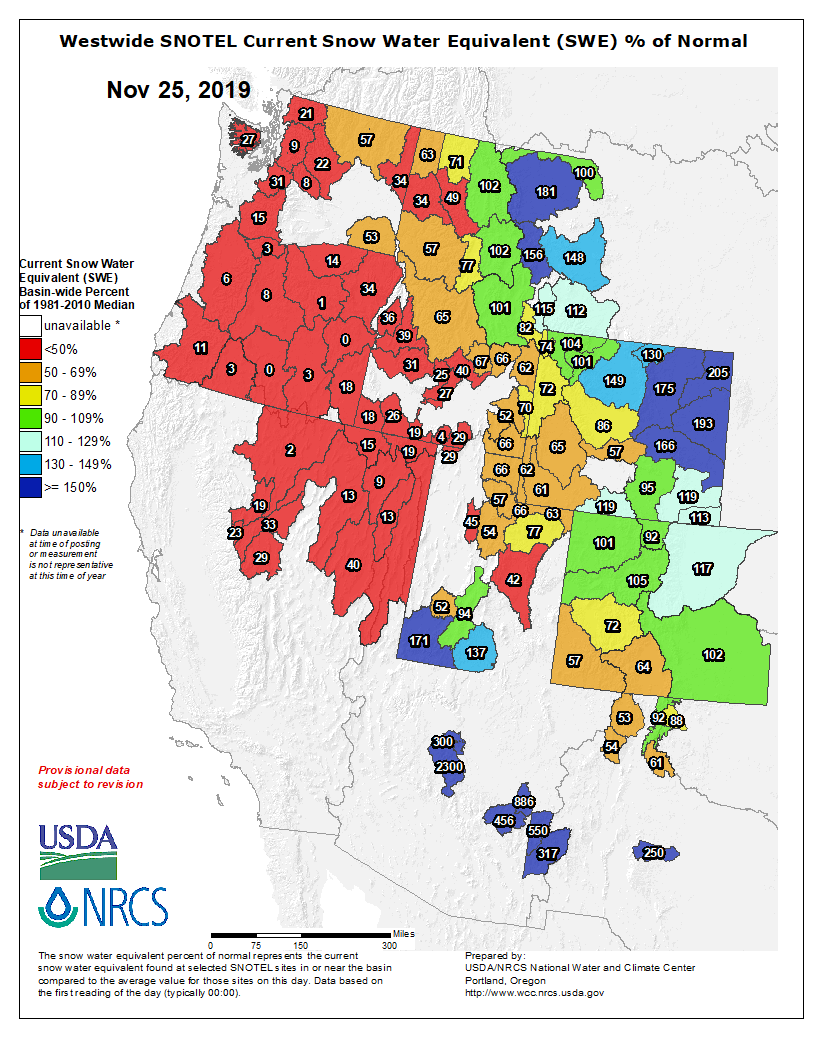
Here’s the Westwide SNOTEL basin-filled map for November 25, 2019 from the NRCS.
Finally, here’s the 7-day percent of normal precipitation map for the W. U.S. from the High Plains Regional Climate Center. The Colorado River Basin did OK as a percent of normal.
