Heron Lake, part of the San Juan-Chama Project, in northern New Mexico, looking east from the Rio Chama. In the far distance is Brazos Peak (left) and the Brazos Cliffs (right), while at the bottom is the north wall of the Rio Chama Gorge. By G. Thomas at English Wikipedia – Transferred from en.wikipedia to Commons., Public Domain, https://commons.wikimedia.org/w/index.php?curid=1598784
Three agencies will use water from the Albuquerque Bernalillo County Water Utility Authority to protect Rio Grande silvery minnow habitat this fall.
On Wednesday, the water authority approved a lease of up to 7,000 acre-feet, or about 2.9 billion gallons, of its San Juan-Chama water to the U.S. Bureau of Reclamation at a cost not to exceed $700,000.
The San Juan-Chama project uses a series of tunnels and reservoirs to route Colorado River water into the Rio Grande Basin. Several cities, counties, pueblos and irrigation districts rely on the project for drinking water and agriculture.
The Bureau of Reclamation will pay $350,000 for the water. The Middle Rio Grande Conservancy District contributed $250,000 to the lease and the New Mexico Interstate Stream Commission contributed $100,000…
In 2016, the U.S. Fish and Wildlife Service released a new biological opinion regarding water management and endangered and threatened species such as the Rio Grande silvery minnow, southwestern willow flycatcher and the yellow-billed cuckoo.
Rio Grande Silvery Minnow via Wikipedia
Yellow-billed cuckoos have nearly been extirpated from the western U.S. Photo courtesy Rocky Mountain Bird Observatory.
Southwestern Willow flycatcher
Water agencies now manage the river to improve fish densities, but are not required to maintain certain river flow targets.
This year’s drought and minimal runoff have left water agencies scrambling to supply water to farmers and fish.
The MRGCD used 10,000 acre-feet from the water authority in June. The irrigation district had “repaid” that water to ABCWUA in late 2019 as a payment for a water loan from the early 2000s. But the district was forced to ask for the water payment back after running out of storage water.
Another release of stored water from El Vado Reservoir in July helped extend the irrigation season by nearly three months…
Under the lease, the water can be released from Abiquiu Reservoir through the end of 2022. Revenue from the lease will help fund the water authority’s program to plan for future water supply and demand.
The water authority has a contract with the U.S. Secretary of the Interior for about 15 billion gallons of San Juan-Chama water each year – making it the largest user of the project.
With five of Greeley’s six high mountain reservoirs in the burn area, erosion is expected to carry sediment into Greeley’s water supply. Left untreated, that could affect the city’s water quality. But officials are already planning to make sure that doesn’t happen.
The Cameron Peak fire ignited on August 13 on the Arapaho and Roosevelt National Forest near Cameron Pass and Chambers Lake. Credit: Inciweb
“When fires burn, if they’re hot enough, they can actually burn underbrush and soil,” said Adam Jokerst, Greeley’s deputy director of Water Resources, adding that vegetation is burned up as well. “With the lack of the vegetation … you can get increased erosion when it rains or when the snow melts.”
That erosion carries sediment into the Poudre River, which pulls water from the reservoirs to supply water for the city. Water with high sediment content can be harder to treat, Jokerst said, but it is possible to treat safely.
For better or for worse, Jokerst said, Greeley water officials have a lot of experience handling erosion into the water supply after dealing with the impacts of the High Park Fire in 2012. That fire burned more than 87,000 acres, making it the sixth-largest in state history.
There are at least a few steps to take to mitigate erosion impacts: aerial mulching, felling trees and adding flocculants during the treatment process. For aerial mulching, crews drop shredded wheat chips or straw from a helicopter. The mulch reduces erosion and helps with revegetation. Cutting down the burned trees and letting them fall into the gullies and rills — the channels created in the soil by water erosion — prevents stormwater and meltwater from carrying added erosion into the water supply.
Jokerst said it’s common to see the water get murkier during the runoff season every year. To provide clean, clear drinking water when that happens, crews use more flocculants, which are chemicals that help to separate the water from the sediment, in the treatment process. If there’s very high sediment content at the Bellvue Treatment Plant, officials can turn off the plant so it stop pulling water from the Poudre, Jokerst said. The city can then use the Boyd Treatment Plant…
If the fire keeps on into snowfall season in the winter, Jokerst said crews will have to wait until the spring to start on erosion control measures. Greeley officials are working with the city of Fort Collins, Northern Water and the Coalition for the Poudre River Watershed, a nonprofit Jokerst said will be a key entity in the post-fire recovery.
Long Draw Reservoir
Chambers Reservoir July 2016. Photo credit: Greg Hobbs
Marybeth Arcodia is an Atmospheric Science Ph.D. Candidate at the University of Miami Rosenstiel School of Marine and Atmospheric Science. She works with Dr. Ben Kirtman (previous ENSO Blog guest writer) studying climate variability and predictability. Along with a few members from her lab group, Marybeth helped create a subseasonal-to-seasonal forecasting blog called Seasoned Chaos, for scientists and non-scientists alike. Her research looks at how particular atmospheric and oceanic conditions in the tropical Indian and Pacific Oceans can affect weather and extreme events in the United States to lead to more confident climate forecasts on two week to two month time scales. She received her BA in Mathematics from Georgetown University in 2014.
The famous Beach Boys lyric “Catch a wave and you’re sitting on top of the world” has a lot more to do with atmospheric science than one may realize. Our latest research has found that two atmospheric wave patterns forced from tropical systems, ENSO and the Madden-Julian Oscillation, work together to affect rainfall patterns in the United States, sometimes leading to extreme flooding or drought events (Arcodia et al. 2020). Luckily, climate forecasters can analyze these large-scale waves to make predictions weeks and months in advance.
The MJO launches into action
Particularly important to U.S. weather and climate are atmospheric waves that start in the tropics and travel to the midlatitudes. One major source of these waves is the Madden-Julian Oscillation (MJO). The MJO sounds fancy and, let’s be honest, boring, but it’s not! The MJO is a system of very tall or deep convective clouds (storminess) that travels eastward along the tropical Indian and Pacific Oceans approximately every 30-60 days. The convective region of the MJO has enhanced storms and rainfall, and it is usually sandwiched to the east and west by dry, sunny areas.
Averages of all January–March MJO events from 1979–2016. Green shading shows below-average OLR (outgoing longwave radiation, or heat energy) values, indicating more clouds and rainfall, and brown shading identifies above-average OLR (drier and clearer skies than normal). The purple contours show the location and strength of the Pacific jet at the 200-hPa level (roughly 38,000 feet at that location). Note the eastward movement of the wet and dry areas. How far the Pacific jet extends past the international dateline also changes with the phase of the MJO. NOAA Climate.gov animation, adapted from original images provided by Carl Schreck.
These convective storms form from surface convergence of winds, which then rise and diverge at the top of the troposphere. The convection disrupts the air at the top of the atmosphere, which results in long, planetary scale (~5,000 miles) waves that travel away from their tropical source into the midlatitudes near the top of the troposphere, like waves that ripple away on top of a lake from skipping stones. (1) These large-scale waves, known as Rossby waves, are due to the rotation of the Earth and characterized by north-south undulations around high and low pressure systems. Like most waves, these waves carry signals: radio waves carry classic rock to your car, microwaves carry microwave radiation to heat your frozen dinner, and atmospheric waves carry temperature, pressure, and wind signals that can alter the weather.
The atmospheric waves produced by the MJO can have different effects on the mid-latitudes depending on where the MJO convection (storminess) is on its journey from the Indian Ocean to the central Pacific (2). Our study analyzed the influence of the MJO during the Northern Hemisphere winter months, November-April, as this is when the MJO is typically strongest. We specifically focus on U.S. rainfall impacts since both drought and flooding events have vast societal, economic, and environmental impacts. While most prior studies investigated influences from the MJO on the West Coast, we focused on a strong relationship we discovered in the Southeast U.S. When the MJO starts out in the Indian Ocean and makes its way across Indonesia, the ripples it causes in the upper atmosphere often lead to a change in U.S. pressure patterns. Warm, moist air from the Gulf of Mexico is pushed over the Southeastern states, leading to rainfall. As the MJO makes its way into the central Pacific, the opposite pressure patterns head cool, dry air from the north to cause dryness in the Southeast U.S.
Another defining characteristic of the MJO is the dryness on both the east and west sides of the enhanced rainfall on the equator. These dry regions also create waves because of the sinking motion at the top of the atmosphere. An exciting area of research that others in our field are working on is how the waves from the rainy and dry regions of the MJO interact and influence North American weather patterns as the MJO is travelling around the globe (Lin et al., 2010, Tseng et al., 2011).
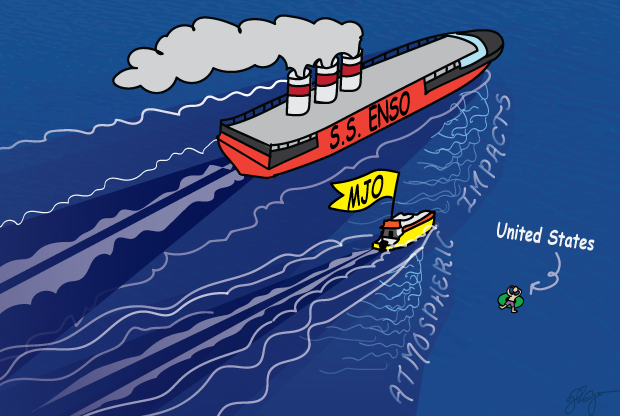
The S.S. ENSO cruise ship and MJO speedboat making their way across the “harbor” of the tropical Pacific Ocean. The cruise ship represents the stationary ENSO pattern creating steady, rolling waves. The speedboat represents the rapidly moving MJO travelling through the waves created by the S.S. ENSO, altering the wake that the MJO speedboat is producing. The floating person represents the United States that feels the impact from the both the cruise ship’s wake and the speedboat’s modified wake. Note that United States refers to just a specific region in the U.S. that changes with time. The impacts from the MJO and ENSO wave interference can vary both in space and time. Climate.gov cartoon by Emily Greenhalgh.
MJO & ENSO synergy
Things get really choppy when we add ENSO to the mix. ENSO is a stationary pattern in the tropics, but the MJO is a traveling pattern roughly following the equator. In fact, ENSO is controlling the background through which the MJO is moving. Specific MJO events can vary depending on the state of ENSO. The strength of the MJO convection, how fast it moves eastward, and how far it travels all change based on ENSO conditions. These ENSO-modified MJO events then lead to varied impacts on U.S. rainfall.
Imagine a massive cruise ship very slowly making its way back and forth through a harbor. As it moves, it creates steady, rolling waves. The MJO is then a speedboat, passing through the wake of the cruise ship. There are now two boats forcing waves in the same water. ENSO (cruise ship) modifies the MJO (speedboat) by altering the environment that the MJO is moving through. Since the speedboat is moving through already wavy water, it changes the wake that the speedboat produces (3).
To complicate things further, these modified MJO waves and the ENSO waves are now both traveling at different speeds at the top of the atmosphere and interact with each other, in the same way the wakes from two boats interfere. The interaction of these waves and their signals plays a role in U.S. weather via changes in pressure, temperature, etc.
Two climate signals interfering (i.e., combining) with each other. Bold blue curve sketches the result of the combination. Horizontal bars indicate conceptual thresholds for occurrence of extremely wet and dry events. Animation adapted by Climate.gov from http://www.acs.psu.edu/drussell/Demos/superposition/superposition.html.
he waves from the MJO and the waves from ENSO together impact U.S. rainfall through constructive or destructive interference. Constructive interference occurs when two waves are in phase (4), and the resultant wave has a much larger amplitude, resulting in a stronger signal than either of the individual waves. The opposite, called destructive interference, occurs when two waves are out of phase and cancel each other (5). You may have experienced destructive signal interference when your radio signal gets interrupted by another station and you hear a mix of two stations or no sound at all.
We can analyze constructive and destructive interference from the MJO and ENSO by looking at each U.S. rainfall signal individually (6). We can specifically look at the U.S. rainfall contribution from both the MJO and ENSO, for example, when the enhanced MJO convection is over Indonesia and an El Niño is happening, or when the MJO convection is in the central Pacific and La Niña is occurring. Since the MJO changes phase much faster than ENSO, we often see U.S. conditions from ENSO persist for an entire season, whereas the rainfall from the MJO can change weekly.
Constructive interference from the MJO and ENSO occurs when either wet or dry conditions occur in the same region simultaneously from both phenomena. Their signals are added together and the result is a much wetter- or- drier-than-average region. Destructive interference occurs when the same region experiences opposite signals from the MJO and ENSO, partially or fully masking one another.
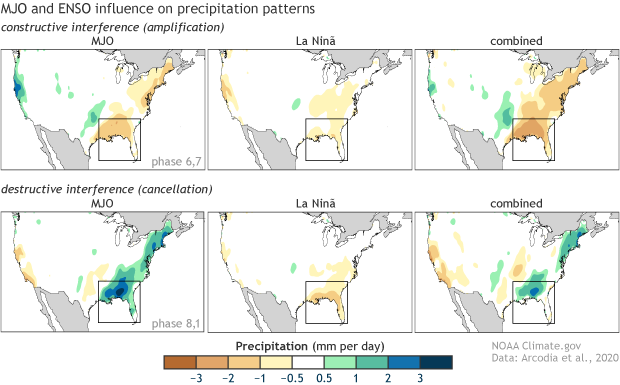
Precipitation in mm/day broken down by active MJO phase during the winter months (Nov-Apr) of the 1998-2001 La Niña event (cold ENSO phase). The plot shows MJO-only rain (left), ENSO-only rain (center), and MJO + ENSO rain (right). Black boxes denote prominent areas of constructive (top) or destructive (bottom) interference. This example shows that both constructive (amplified signal) and destructive (weakened signal) can happen during different MJO phases in the same ENSO event. Climate.gov image based on data from Arcodia et al. 2020.
Where have I seen this before?
Destructive interference can even lead to a total wipeout of a signal. We saw that during the 1998-2001 La Niña event. The wave from La Niña resulted in drier-than-normal conditions in the Southeast U.S., a common characteristic of La Niñas. However, when the MJO was either just forming or dissipating during the La Niña event, it brought wetter-than-average conditions to the same region. These two waves destructively interfered, essentially canceling each other out. (7) The result was simply average rainfall (no wetter- or drier-than-normal conditions) for that time period in the Southeast U.S.
Constructive interference can also have notable impacts since the result is an intensified signal. This occurred in December 2015 when both the MJO and ENSO signals brought large amounts of rain to the Mississippi basin region, leading to massive flooding (Arcodia et al., 2020) (8). Flash droughts, rapidly developing droughts that can persist for weeks to months, can also be attributed to constructive interference. One such example was the summer of 2000 flash drought in the Southern U.S. when an ongoing La Niña event and active MJO both likely contributed dry signals to the region.
Typical impacts of La Niña on U.S. winter temperature and precipitation. Such impacts have been associated with past episodes, but all impacts aren’t seen with every episode. NOAA Climate.gov drawing by Fiona Martin.
Analysis of these events shows just how connected the tropics and the United States can be. Understanding how these waves interfere can improve our one-to-two week and monthly climate forecasts of temperature and precipitation. A longer lead time in a forecast for massive flooding or drought events can save lives, property, and money if our climate models can catch the waves from the MJO and ENSO. These atmospheric waves may not have us sitting on top of the world like the Beach Boys told us, but they are traveling pretty close (top of the troposphere to be exact) and could still have a big impact on the California surf.
Lead edited by Tom Di Liberto
Footnotes
(1) This coupling between deep convection and a circulation pattern characterized by low-level convergence, upper-level divergence, and vice versa (sinking motion due to upper-level convergence and low-level divergence) is similar to the tropical Walker cell.
(2) The location of above-average and below-average tropical convection can be seen in this graphic on the CPC MJO page.
(3) It is also believed that since the MJO itself is altered, then so are the atmospheric waves it produces that travel to the U.S.
(4) In-phase waves have their highest and lowest points aligned.
(5) Out-of-phase waves will drastically reduce the amplitude, or height, of the waves which causes the resultant wave to be nearly flat and lose its signal.
(6) We analyze the signals based on the state of each system: location of convective storms for the MJO and sea surface temperatures for ENSO. We then calculate the amount of rainfall that each signal contributed during specific conditions in the tropics, that is whether each contributed to wetter or drier conditions than average.
(7) We saw this in California during the massive 2015-16 El Niño event. California often experiences much wetter-than-normal conditions during El Niños. During this event, however, the El Niño signal brought only a small amount of rain (Paek et al., 2017; Yang et al., 2018) and the MJO brought a dry signal to the California region. When the two are added together, the signals slightly cancel each other out and played a role in the drought in the California region during that time. During this particular case, El Niño did not bring the expected rain, and the MJO brought dryness, and the result contributed to a drought in California during a time when they expected a lot of rain.
(8) According to NOAA’s National Center for Environmental Information (https://www.ncdc.noaa.gov/sotc/national/201513 ), December 2015 was the only month in their 121-year period of record with both the title of warmest and wettest month. Furthermore, the severe precipitation events caused record flooding, severe weather, and heavy snowfall resulting in over 50 fatalities, the deadliest weather event of 2015.
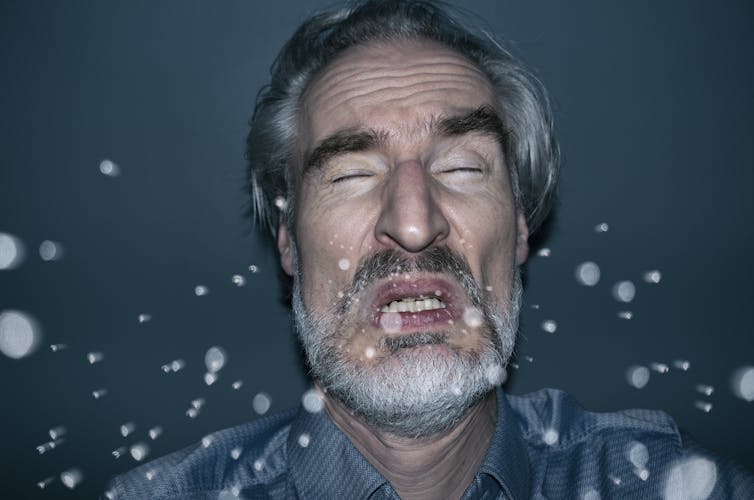
Scientists have been warning for months that the coronavirus could be spread by aerosols – tiny respiratory droplets that people emit when they talk or sneeze and that can linger in the air.
The Centers for Disease Control and Prevention appeared to acknowledge that risk on Sept. 18. It posted guidance on its website listing aerosols among the ways the virus spreads and saying there was growing evidence the airborne particles can remain suspended and travel beyond 6 feet. But three days later, that guidance was gone. A note in its place said a draft had been posted in error and that the CDC was still working on the update.
That kind of shifting by the government can be confusing. In the following five articles recently published in The Conversation, we turned to scientists to help explain what aerosols are, how airborne particles can transmit the coronavirus and how to protect yourself.
1. What you need to know about aerosols
When you talk or sing, the rush of air breaks up strands of mucus in your airways, sending droplets of it airborne.
While larger droplets quickly fall, tiny, light ones can linger in the air. If you’re infected, those droplets can contain the coronavirus, and early research suggests it can be viable for many minutes to hours.
They also discussed what people can do to protect themselves. “Wearing face coverings to decrease airborne exposure risk is critical,” they wrote, and “reducing the amount of time you spend in poorly ventilated, crowded areas is a good way to reduce airborne exposure risk.”
2. Is staying 6 feet apart enough?
The common advice for social distancing is to stay 6 feet apart. It’s easy to remember, but it doesn’t account for all aerosol risks – particularly indoors.
Because people infected with SARS-CoV-2 can transmit large amounts of the virus, there is no safe distance in a poorly ventilated room, Erath, Ferro, Ahmadi and their Clarkson University colleague Suresh Dhaniyala wrote in a second article. Air currents from a fan or ventilation system can spread respiratory droplets farther than 6 feet. So can speaking loudly or singing, as superspreader events have shown.
“Over time, it won’t matter where you are in the room,” they wrote. “While it’s not a perfect analogy, picturing how cigarette smoke moves through different environments, both indoors and outdoors, can help in visualizing how virus-laden droplets circulate in the air.”
A simulation shows the trajectories of droplets emitted by someone in a room with mixed ventilation. Credit: Goodarz Ahmadi and Mazyar Salmanzadeh / Clarkson University.
3. Airborne particles and superspreaders
A large number of COVID-19 cases have come from “superspreader” events where someone who is highly infectious spreads the virus to dozens of others.
Researchers in Hong Kong recently estimated that about 20% of the people infected there were responsible for 80% of the local coronavirus transmission. Choir practices, church services, nightclubs and a birthday party are just few of the documented superspreader events.
“The good news is that the right control practices specific to how pathogens are transmitted – hand-washing, masks, quarantine, vaccination, reducing social contacts and so on – can slow the transmission rate and halt a pandemic,” she wrote.
4. What airborne virus means for reopening
The way the virus spreads in the air is also a challenge for reopening businesses and schools.
“The evidence strongly suggests that airborne transmission happens easily and is likely a significant driver of this pandemic. It must be taken seriously as people begin to venture back out into the world,” he wrote.
With temperatures getting cooler, it’s going to be harder to keep windows open to bring fresh air into enclosed spaces, and that includes public transportation and school buses.
“Short trips. Masks for everyone. Far fewer passengers than before,” he wrote. “Those are my top recommendations for how America’s school buses should take kids to and from school during the pandemic.”
Editor’s note: This story is a roundup of articles from The Conversation’s archives.


 Rio Grande Silvery Minnow via Wikipedia
 Yellow-billed cuckoos have nearly been extirpated from the western U.S. Photo courtesy Rocky Mountain Bird Observatory.
 Southwestern Willow flycatcher