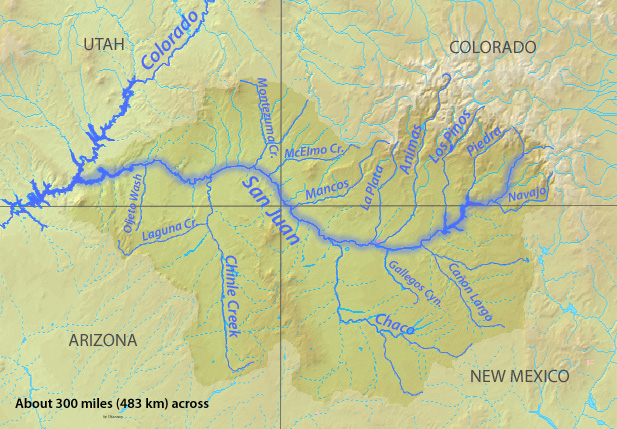
Click on a thumbnail graphic below to view a gallery of drought data from the US Drought Monitor.
Click here to go to the US Drought Monitor website. Here’s an excerpt:
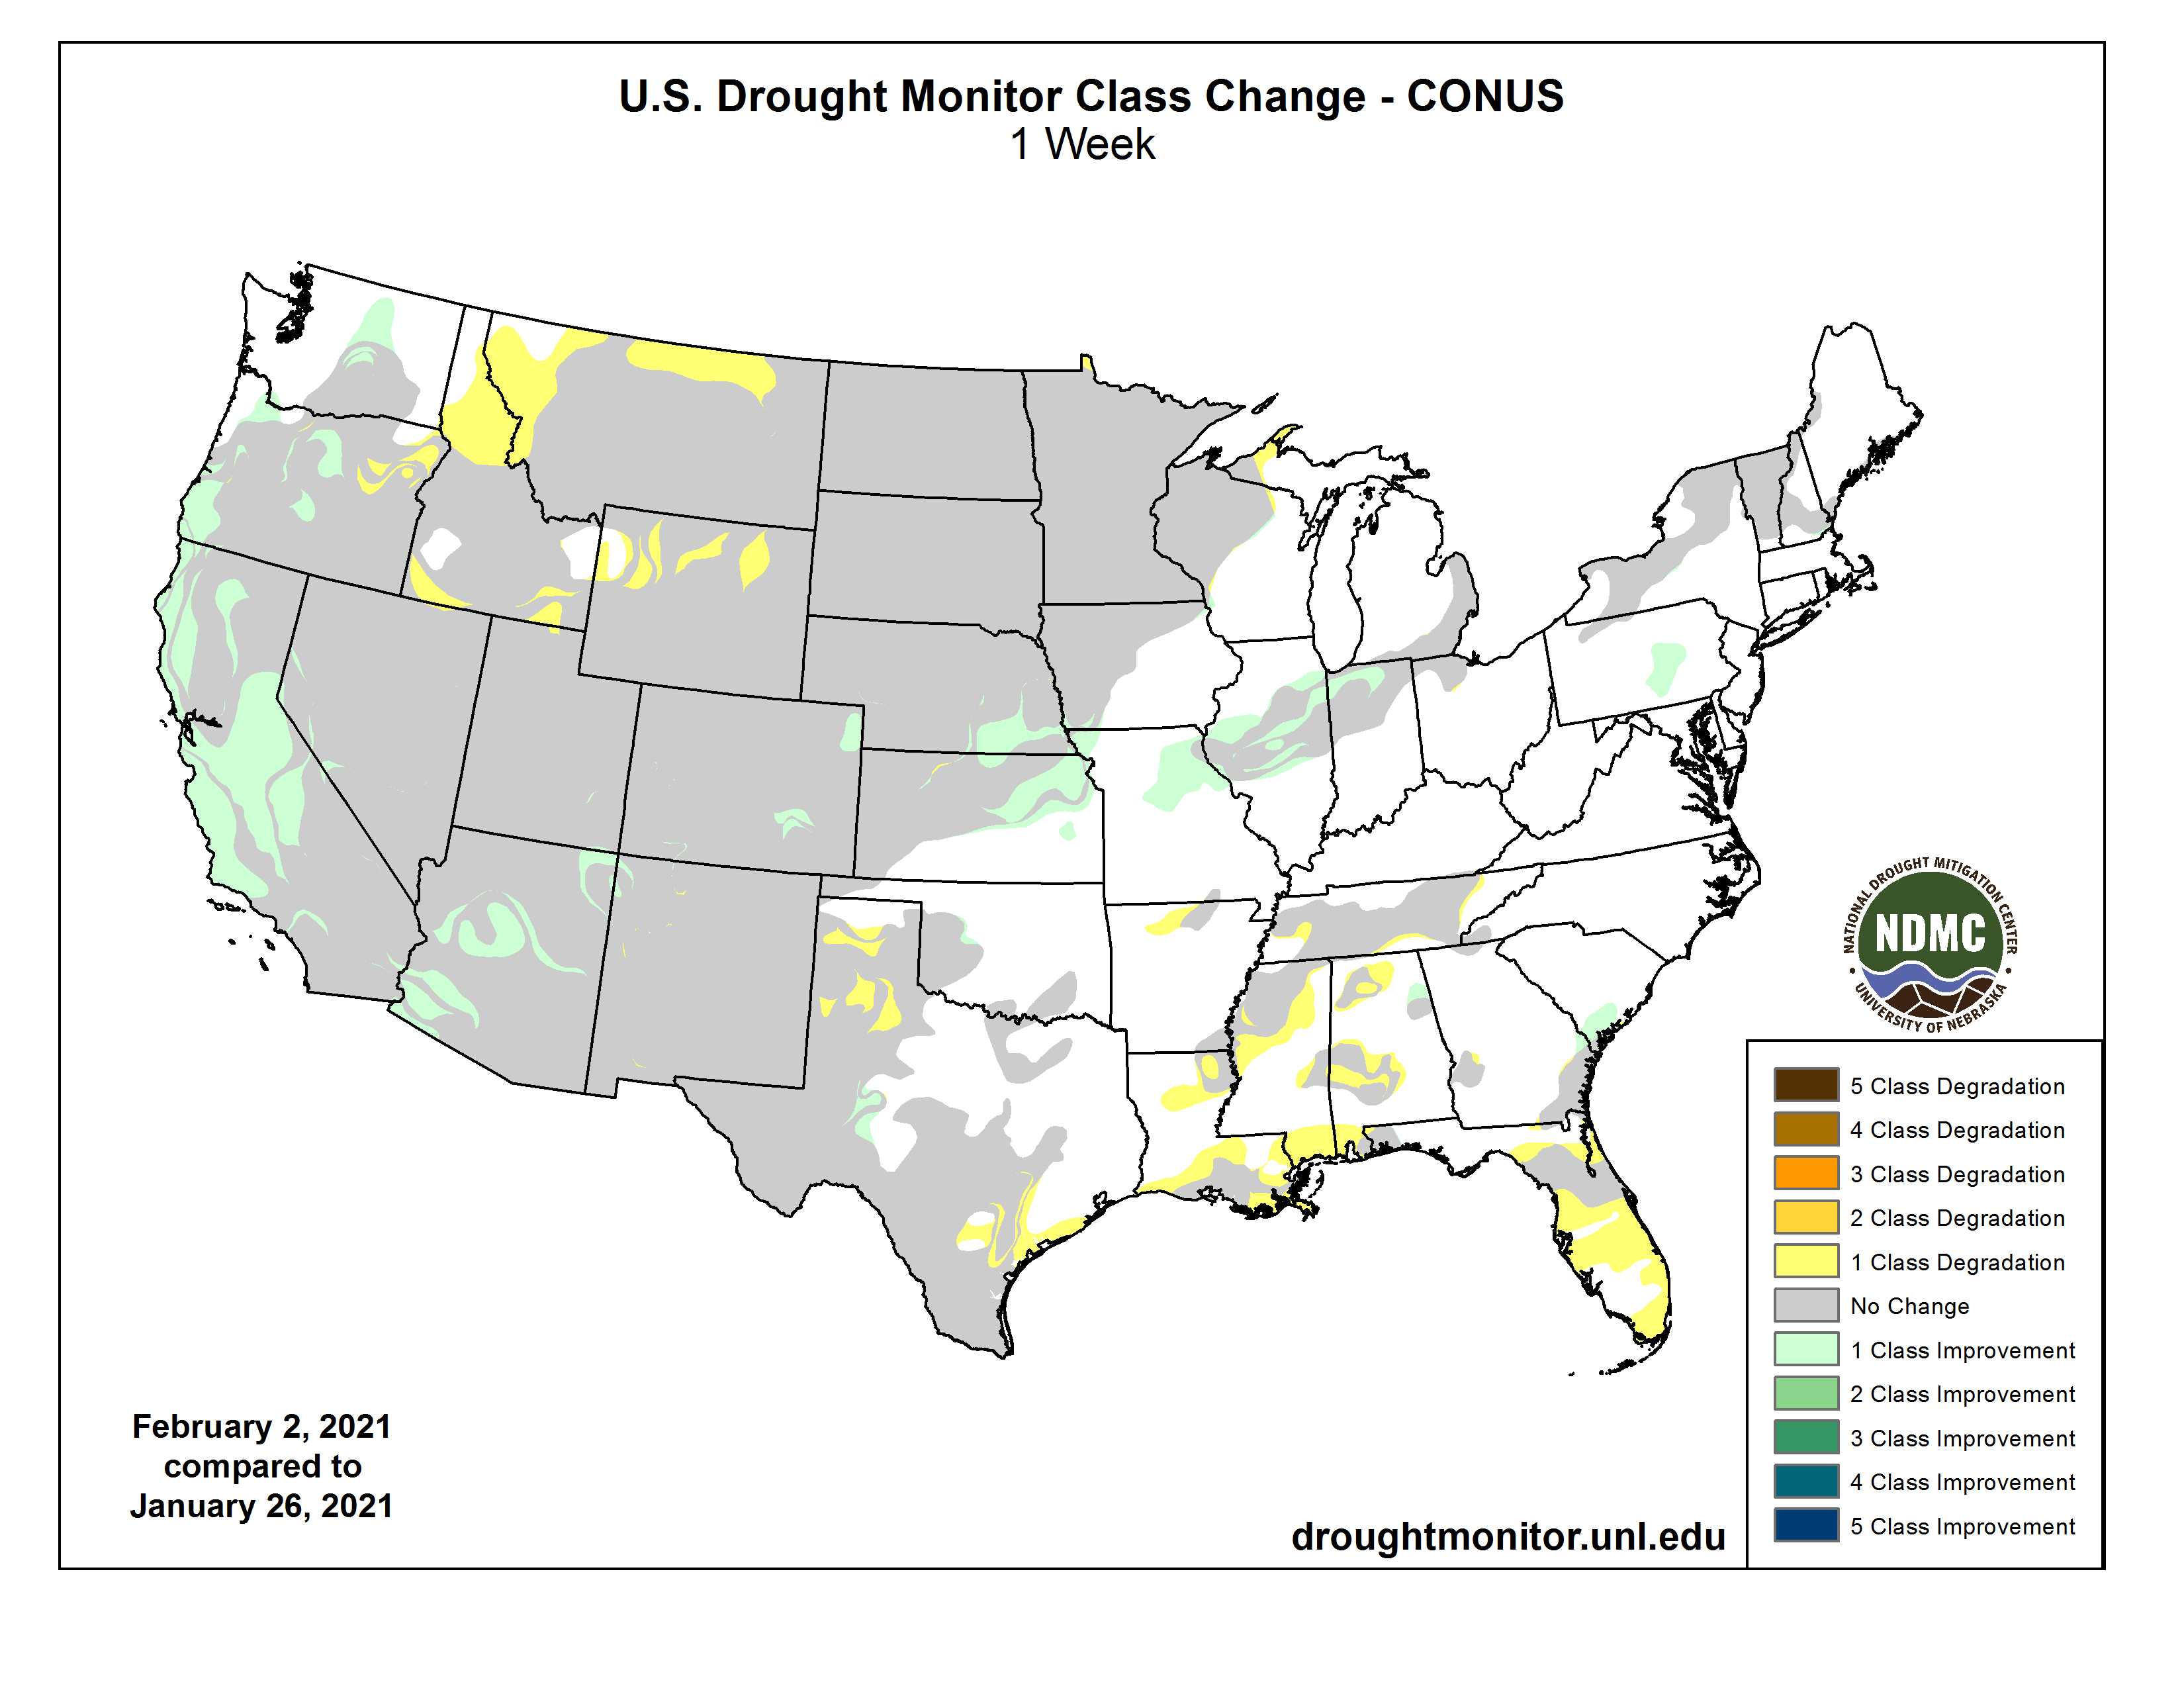
This Week’s Drought Summary
California’s most powerful storm of the season to date delivered drought-easing precipitation, including heavy mountain snow, but caused local flooding and landslides. Impacts from the multi-day storm system extended beyond California, adding to the benefit of other mid-winter weather systems in portions of the Western drought area. As the calendar turned from January to February, the Western storm finally turned eastward, producing wind and wintry precipitation in the Midwest and Northeast, as well as rain showers in the Southeast. As the drought-monitoring period ended, the former Western storm became a powerful low-pressure system along the middle and northern Atlantic Coast. In contrast, mostly dry weather prevailed throughout the 7-day period in several regions, including the northern Plains and the south-central U.S…
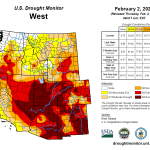
Much of the region settled into a cool, dry pattern, following the central Plains’ snowstorm that peaked on January 25. Further assessment of the that storm led to some additional reductions in drought coverage across the central Plains. In addition, a subsequent weather system clipped eastern Kansas with rain on January 30, helping to further reduce coverage of dryness (D0) and moderate drought (D1). For the areas that were affected by the January 25 storm, snow remaining on the ground into February has helped to boost topsoil moisture. (On January 24, just prior to that storm’s arrival, topsoil moisture was rated at least one-half very short to short in each of the states in the High Plains region, led by Wyoming at 90%, and followed by Colorado at 79%, North Dakota at 75%, South Dakota at 62%, Nebraska at 60%, and Kansas at 55%.) Daily-record snowfall totals in Nebraska for January 25 included 14.5 inches in Lincoln, 11.9 inches in Omaha, and 10.2 inches in Grand Island. For Lincoln, it was the snowiest January day on record (previously, 11.4 inches on January 3, 1971) and the snowiest day in any month since February 11, 1965, when 19.0 inches fell. Lincoln also achieved a January snowfall record, with 18.9 inches (previously, 15.6 inches in 2011). For Omaha, it was the snowiest day since January 10, 1975, when 12.1 inches fell…
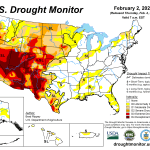
Heavy precipitation and high winds accompanied a sprawling, slow-moving storm, which primarily impacted California. According to the California Department of Water Resources, the average water equivalency of the high-elevation Sierra Nevada snowpack climbed to 12.5 inches (70% of normal) by February 2, up from about 6 inches (less than 40%) just 10 days earlier. In an average year, nearly 30 inches of liquid accumulates in the Sierra Nevada snowpack by April 1. As the storm arrived on January 27, snow fell on the Sacramento Valley floor, where Redding, California, reported 1.5 inches. From January 25-29, rainfall totaled 14.41 inches in Big Sur, California, about 20 miles north of where a section of State Route 1 slid into the Pacific Ocean. On January 27-28, consecutive daily-record totals were observed in California locations such as Paso Robles (1.39 and 2.94 inches, respectively); Modesto (2.49 and 0.94 inches); and Stockton (1.37 and 1.43 inches). Stockton clocked a southeasterly wind gust to 58 mph on January 27, while Marysville, California, recorded 65 mph. Farther inland, Reno, Nevada, received 10.5 inches of snow, spread across 7 days (January 23-29). Flagstaff, Arizona, reported 43.5 inches of snow from January 19-29, boosting its season-to-date total from 7.1 to 50.6 inches (from 17 to 97 percent of normal). Drought improvements were focused on California, but drought coverage was also reduced—in part based on further analysis of other January storms—in the Pacific Northwest and the Southwest. Meanwhile, dry weather deepened its grip across parts of the interior Northwest, where there were some increases in coverage of dryness (D0) and moderate to extreme drought (D1 to D3)…
Mostly dry weather prevailed, leading to some general expansion of dryness and drought. The region’s most significant drought persisted across western Texas, where modest increases in coverage of moderate to exceptional drought (D1 to D4) occurred. According to the U.S. Department of Agriculture, Texas led the Plains in late January with 41% of its winter wheat rated in very poor to poor condition. Farther east, short-term dryness led to some expansion of abnormal dryness (D0) and moderate drought (D1), mostly from the lower Mississippi Valley and the central Gulf Coast eastward…
Looking Ahead
On February 4-5, a storm system crossing the nation’s mid-section will result in wind-driven snow from the upper Midwest into the Great Lakes region. Parts of the Midwest and Northeast could experience freezing rain, while late-week rain showers will occur in the Southeast, including much of Florida. The Midwest’s coldest air of the season will trail the storm, with temperatures during the weekend and early next week possibly falling to 0°F or below as far south as the Ohio and middle Mississippi Valleys. In parts of Minnesota and North Dakota, temperatures may remain below 0°F for at least 3 consecutive days, from February 6-8. Significant precipitation will be limited after cold air engulfs much of the country, aside from weekend rainfall in the Southeast and some wintry precipitation farther north across the eastern U.S.
The NWS 6- to 10-day outlook for February 9 – 13 calls for the likelihood of colder-than-normal weather nearly nationwide, except for above-normal temperatures across the southern tip of Florida and parts of the Southwest. Meanwhile, drier-than-normal weather west of the Rockies and in the Midwest and Northeast should contrast with near- or above-normal precipitation across the High Plains and Deep South.
Just for grins here’s a gallery of early February US Drought Monitor maps for the past few years.