The climate emergency poses an existential threat to our businesses, farms, and communities but there is no shortage of things we can be doing to address it. These include climate action opportunities in agriculture, land-use, electricity and power, and shifts in policy and priorities to drive these solutions. This report provides useful information on the climate crisis and its impacts on the Gunnison River Basin. It also provides examples of available actions for individuals, businesses, and governments.
Note: Local snowpack readings and chart are now using the percent of median instead of percent of average.
Snowpack in the Roaring Fork basin, which is exceeding the basin-wide median seasonal snow-water equivalent peak of 17.1 inches that typically occurs in mid-April, reached an average of 21.9 inches of snow-water equivalent per site on March 26 or 145% of median according to NRCS. Snowpack gained about three inches of SWE since last week on average per site after recent snow storms.
SNOTEL sites that monitor snowfall throughout the winter measured the snowpack at Independence Pass at 106.6% of median on March 26 with a “snow water equivalent” (SWE) of 16.2 inches, up from 15 inches on March 19. Last year on March 26, the SNOTEL station up the pass (located at elevation 10,600 feet) recorded an SWE of 13.2 inches.
The monitoring station at McClure Pass located at elevation 8,770 feet recorded a SWE of 27.5 inches on March 26, or 181% of median. That’s up from a SWE of 24.1 inches on March 19. Snowpack has gained three inches of SWE since March 21. Last year, on March 26, the station measured a snowpack holding 16.6 inches of water.
On the northeast side of the Roaring Fork Basin, snowpack at Ivanhoe, which sits at an elevation of 10,400 feet, reached 16.9 inches of SWE on March 26, or 125.2% of median.
Snowpack at Schofield Pass, which boasts some of the largest SWE accumulations in the basin, reached 46 inches on March 26, which represents 160.8% of median. Snowpack at this site gained six inches of SWE last week, the largest increase of SWE among these five Roaring Fork basin stations over the past week. Schofield Pass sits at an elevation of 10,700 feet between Marble and Crested Butte.
Snowpack at that site has been exceeding its median seasonal peak of 35.1 inches since March 11, which typically doesn’t come until mid April. McClure Pass, which as we reported earlier in March is seeing especially high snowpack readings this winter like other mid elevations stations, topped its median seasonal peak of 16.6 inches on Feb. 14 this year.
Snow water equivalent — the metric used to track snowpack — is the amount of water contained within the snowpack, which will become our future water supply running in local rivers and streams.
Ruedi Reservoir on the Fryingpan River as seen on March 24, 2022 The reservoir was at its lowest level in nearly two decades. Reclamation is confident it will fill in 2023. CREDIT: HEATHER SACKETT/ASPEN JOURNALISM
Click the link to read the article on the Aspen Daily News website (Scott Condon). Here’s an excerpt:
Hydrologist Tim Miller said the current snowpack levels make him confident Ruedi Reservoir can be filled in the first week of July without releasing extraordinary amounts of water…The Colorado Basin River Forecast Center is forecasting runoff into Ruedi at 104% of median. In 2019, when the region was hit with an ongoing storm cycle in March that triggered numerous destructive avalanches, the forecasted runoff volume was 144% of median, he noted.
The Fryingpan Valley snowpack is currently ranging between 120% to 159% of median at three automated stations called Snotel sites operated by the U.S. Natural Resources Conservation Service. Miller said the sites provide a good gauge of snowpack at lower and middle elevation ranges. He checks the Independence Pass Snotel site east of Aspen as well. Although it is out of the Fryingpan River basin, its close proximity provides a good clue about upper elevation snowpack. The cumulative snowpack at Kiln, Ivanhoe and Independence sites is 126% of median, he said. There isn’t a one-to-one relationship between snowpack levels and runoff forecasts, according to Miller. Runoff projections consider factors such as soil moisture levels, which were low coming into this winter because of drought. Drier soils capture some of the water before it reaches rivers and streams…
“We should be able to fill that without a problem,” Miller said. “It generally fills the first week of July, almost always.”
Joe Charbonnet is an environmental engineer at Iowa State University who develops techniques to remove contaminants like PFAS from water. He explains what the proposed guidelines would require, how water utilities could meet these requirements and how much it might cost to get these so-called forever chemicals out of U.S. drinking water.
1. What do the new guidelines say?
PFAS are associated with a variety of health issues and have been a focus of environmental and public health researchers. There are thousands of members of this class of chemicals, and this proposed regulation would set the allowable limits in drinking water for six of them.
Two of the six chemicals – PFOA and PFOS – are no longer produced in large quantities, but they remain common in the environment because they were so widely used and break down extremely slowly. The new guidelines would allow for no more than four parts per trillion of PFOA or PFOS in drinking water.
Four other PFAS – GenX, PFBS, PFNA and PFHxS – would be regulated as well, although with higher limits. These chemicals are common replacements for PFOA and PFOS and are their close chemical cousins. Because of their similarity, they cause harm to human and environmental health in much the same way as legacy PFAS.
A few states have already established their own limits on levels of PFAS in drinking water, but these new guidelines, if enacted, would be the first legally enforceable federal limits and would affect the entire U.S.
Chemicals used to create water-repellent fabrics and nonstick pans often contain PFAS and leak those chemicals into the environment. Brocken Inaglory/Wikimedia Commons, CC BY-SA
2. How many utilities will need to make changes?
PFAS are harmful even at extremely low levels, and the proposed limits reflect that fact. The allowable concentrations would be comparable to a few grains of salt in an Olympic-size swimming pool. Hundreds of utilities all across the U.S. have levels of PFAS above the proposed limits in their water supplies and would need to make changes to meet these standards.
While many areas have been tested for PFAS in the past, many systems have not, so health officials don’t know precisely how many water systems would be affected. A recent study used existing data to estimate that about 40% of municipal drinking water supplies may exceed the proposed concentration limits.
Activated carbon is a charcoal-like substance that PFAS stick to quite well and can be used to remove PFAS from water. In 2006, the town of Oakdale, Minnesota, added an activated carbon treatment step to its water system. Not only did this additional water treatment bring PFAS levels down substantially, there were significant improvements in birth weight and the number of full-term pregnancies in that community after the change.
Ion exchange systems work by flowing water over charged particles that can remove PFAS. Ion exchange systems are typically even better at lowering PFAS concentrations than activated carbon systems, but they are also more expensive.
Another option available to some cities is simply finding alternative water sources that are less contaminated. While this is a wonderful, low-cost means of lowering contamination, it points to a major disparity in environmental justice; more rural and less well-resourced utilities are unlikely to have this option.
4. Is such a major transition feasible?
By law, the EPA must consider not just human health but also the feasibility of treatment and the potential financial cost when setting maximum contaminant levels in drinking water. While the proposed limits are certainly attainable for many water utilities, the costs will be high.
The federal government has made available billions of dollars in funding for treating water. But some estimates put the total cost of meeting the proposed regulations for the entire country at around US$400 billion – much more than the available funding. Some municipalities may seek financial help for treatment from nearby polluters, while others may raise water rates to cover the costs.
5. What happens next?
The EPA has set a 60-day period for public comment on the proposed regulations, after which it can finalize the guidelines. But many experts expect the EPA to face a number of legal challenges. Time will tell what the final version of the regulations may look like.
This regulation is intended to keep the U.S. in the enviable position of having some of the highest-quality drinking water in the world. As researchers and health officials learn more about new chemical threats, it is important to ensure that every resident has access to clean and affordable tap water.
While these six PFAS certainly pose threats to health that merit regulation, there are thousands of PFAS that likely have very similar impacts on human health. Rather than playing chemical whack-a-mole by regulating one PFAS at a time, there is a growing consensus among researchers and public health officials that PFAS should be regulated as a class of chemicals.
Lake Powell‘s storage dropped to its lowest level recorded since it began filling in the 1960s as of our last post, but water levels at the reservoir began their seasonal rise in mid-March as rising temperatures boosted snowmelt. On March 26, the reservoir was 22.05% full (with a total capacity based on a 1986 sedimentation survey) or 23.01% full (based on updated 2017-18 sedimentation data). That’s up from March 19, when the nation’s second-largest reservoir was at 21.86% of capacity (1986 data) or 22.8% (based on 2017-18 data).
On July 1, the Bureau of Reclamation revised its data on the amount of water stored in Lake Powell, with a new, lower tally taking into account a 4% drop in the reservoir’s total available capacity between 1986 and 2018 due to sedimentation. Aspen Journalism in July published a story explaining the that drop in storage due to sedimentation.
The reservoir’s capacity has fallen since last year, when on March 26, 2022, it was 24.02% full (based on 1986 data).
After the wet pattern continued in parts of the West this week, building off of widespread wet and snowy weather this winter, widespread improvements were made to the drought depiction, especially in northern California, northern Nevada, southern Idaho and Utah, with scattered changes, mostly improvements, also taking place in other western states. East of the Rockies, drought and abnormally dry conditions mostly stayed the same or worsened in the Texas and Oklahoma panhandles, northwest Oklahoma, and central and southeast Texas. The western edge of heavy rains this week fell mostly along and southeast of the Interstate 44 corridor in Oklahoma and western north Texas, leading to further tightening of an already tight drought condition gradient in these areas. Farther west in northwest Oklahoma and western Kansas, extreme and exceptional drought persisted or intensified. Very dry recent weather continued in the Florida Peninsula, where severe drought expanded in coverage and extreme drought developed in response to quickly increasing fire danger. In the Mid-Atlantic, short- and long-term drought and abnormal dryness grew a bit in coverage this week. Conditions also worsened in northwest Puerto Rico and the southern Puerto Rico coast, the latter of which reported nearby forest fires. For more specific details, please refer to the regional paragraphs below…
The High Plains region generally saw drier weather this week, with a few areas of the central and northern Great Plains seeing some precipitation. Heavier snows also occurred in some of the mountainous areas of Colorado and Wyoming, leading to some improvements to drought and abnormal dryness areas there. Colder-than-normal weather occurred over the entire region. Compared to normal, the coldest temperatures, in some cases 15 to 20 degrees below normal, occurred in North Dakota, western Wyoming and western Colorado. In southern Colorado, abnormal dryness and moderate drought lessened in coverage in the San Luis Valley and Sangre de Cristo Mountains. Recent precipitation and lessening long-term precipitation deficits, as well as deep snowpack in some areas, led to some localized improvements to ongoing drought areas in the Dakotas, western Nebraska and far northeast Colorado, while mounting precipitation deficits and low soil moisture led to localized worsening of conditions in eastern Nebraska and northeast North Dakota…
Colorado Drought Monitor one week change map ending March 28, 2023.
A wet pattern continued in parts of the West this week, especially western Oregon and Washington and coastal California and parts of the Sierra Nevada. Locally heavy precipitation amounts also fell in parts of Utah and central Arizona. Colder-than-normal temperatures also occurred over most of the West region this week. Temperatures generally ranged from 5 to 10 degrees below normal in the northern, western and southern parts of the region, while Nevada, Utah and southern Idaho experienced temperatures ranging from 10 to 20 degrees colder than normal. The recent snowfall in southern Colorado in the Sangre de Cristo Mountains also allowed for improvements to conditions across the border in New Mexico. Large areas of the Intermountain West saw improvements to drought conditions this week, as long-term precipitation deficits lessened, snowpack remained high or grew, soil moisture and streamflow increased or remained high and groundwater conditions improved. Extreme drought was removed from central Utah, while moderate and severe drought lessened in coverage there. Much of southern Idaho and northern Nevada saw improvements this week after hefty precipitation amounts this winter. Conditions also improved west of Las Vegas, where long-term precipitation deficits lessened and groundwater and soil moisture locally improved. Moderate drought was removed in parts of northern California as well, where long-term precipitation deficits continued to lessen. For similar reasoning, drought coverage lessened in a few parts of Montana as well. Due to recent precipitation and large snowpack and lessening long-term precipitation deficits, moderate drought and abnormal dryness lessened in coverage in western Oregon…
Aside from Oklahoma and southwest Texas, near-normal or warmer-than-normal temperatures were common across much of the South region, with some locations seeing temperatures 5-10 degrees warmer than normal. Parts of north-central Texas and Oklahoma (especially southeast of Interstate 44) saw moderate to heavy rain amounts from thunderstorms, exceeding an inch or two in a few spots. Over 2 inches of rain fell across large areas of Arkansas and Tennessee, while heavier rains farther south in Louisiana and Mississippi were more scattered in nature. Some of this rainfall was associated with a severe thunderstorm outbreak, which was responsible for a destructive tornado that reached a maximum intensity of EF4 in Rolling Fork, Miss. Most of the rest of Texas, and Oklahoma northwest of Interstate 44, remained mostly or completely dry. The recent dry weather, very low groundwater and streamflow and mounting long-term precipitation deficits in central Texas and parts of the Edwards Plateau led to the expansion of moderate, severe, extreme and exceptional drought in some areas. Short-term dryness and decreasing streamflow also led to expanding drought conditions farther east in Texas, except for areas that saw heavier rain amounts this week. Short- and long-term extreme and exceptional drought also increased in coverage in the Texas Panhandle, the Oklahoma Panhandle and parts of northwest Oklahoma, the latter of which has recently experienced blowing dust and sand and a struggling winter wheat crop. Along the Interstate 44 corridor, the gradient in drought conditions increased further, with areas west of Oklahoma City experiencing extreme drought, while southern suburbs of Oklahoma City are only abnormally dry now, with dryness-free conditions nearby to the southeast…
Looking Ahead
From the morning of Wednesday, March 29 through the evening of Monday, April 3, the National Weather Service Weather Prediction Center is forecasting precipitation in some of the higher elevation areas of California, with heavier amounts likely in western Oregon and Washington. Some mountainous areas of Idaho, Colorado, southwest Montana, Wyoming and Utah will likely see over 0.75 inches of precipitation, with some locally heavy amounts possible. Farther east, the southern Great Plains are likely to remain dry, while precipitation is likely from South Dakota into the Upper Great Lakes, and from the Lower Great Lakes southwest toward the Lower Mississippi Valley as a strong storm system traverses the central Great Plains and Midwest. Localized precipitation amounts at or exceeding 0.75 inches are possible for northeast New York and Vermont as well.
From April 4-8, the National Weather Service Climate Prediction Center forecast strongly favors colder-than-normal weather in the West and warmer-than-normal conditions in the Southeast, with the dividing line between warmer and colder than normal running from Chicago southwest to St. Louis southwest to the Texas Big Bend region. Northwest of this line, below-normal temperatures generally become more likely, with the opposite true southeast of this line. Below-normal temperatures are slightly favored in much of Alaska, especially in the southeast regions. Above-normal precipitation is favored across much of the contiguous U.S., excluding the Florida Panhandle, western Montana, southern Arizona, New Mexico, and the El Paso area. The highest confidence for above-normal precipitation for this time period is over South Dakota, North Dakota and Minnesota. Wetter-than-normal weather is also favored in Alaska.
US Drought Monitor one week change map ending March 28, 2023.
Colorado is awash in white this spring, with statewide snowpack topping 140% of average this week, well above the reading a year ago, when it stood at just 97% of normal.
“Conditions in the American West are way better than they were last year at this time,” said state climatologist Russ Schumacher at a joint meeting Tuesday of the state’s Water Availability Task Force and the Governor’s Flood Task Force. “In Colorado we went from drought covering most of the state to most of the state being out of drought.”
Like other western states, mountain snowpacks in Colorado are closely monitored because as they melt in the spring and summer, their runoff delivers much of the state’s water.
A drought considered to be the worst in at least 1,200 years has devastated water supplies across the West. While no one is suggesting the dry spell is over, Colorado water officials said 2023 will likely allow for a significant recovery in reservoirs and soil moisture.
Colorado snowpack basin-filled map March 29, 2023 via the NRCS.
The snow is deepest in the southwestern part of the state, where the San Juan/Dolores river basin is seeing a snowpack of 179% of average.
The Yampa Basin, in the northwest corner of Colorado, is also nearing historic highs, with snowpack registering 145% of average, according to the Natural Resources Conservation Service Snow Survey.
There is considerably less white stuff east of the Continental Divide in the Arkansas River Basin, where snowpack remains slightly below average and in the South Platte Basin, where snowpack is just above average.
The outlook for the seven-state Colorado River Basin has improved dramatically as well, with the U.S. Bureau of Reclamation, in its March 15 report, showing that Lake Powell is likely to see some 10.44 million acre-feet of new water supply by the end of September, or inflows at 109% average.
The Colorado River Basin includes seven states, with Colorado, New Mexico, Utah and Wyoming comprising the Upper Basin and Arizona, California and Nevada making up the lower basin. And it is in the mountains of the Upper Basin, especially in Colorado, where most of the water for the entire system is generated.
That Colorado is seeing such spectacular snow levels this spring, bodes well for everyone. “This is good news for the Colorado River Basin, no doubt about that,” Schumacher said.
Still the drought-strapped Colorado River system will see little storage recovery this year, according to Reclamation, which is forecasting that Lake Powell will see storage at just 32% of capacity by the end of the year. It had dropped to just 23% of capacity last year, prompting ongoing emergency releases from Utah’s Flaming Gorge Reservoir to help keep the system from crashing.
Within Colorado, statewide reservoir storage this month stands at 80% of average, up slightly from this time last year when it registered 75% of average.
Reservoirs within Colorado are expected to see a significant boost in storage levels. Colorado’s largest reservoir, Blue Mesa, was just 36% full earlier this month, but is projected to receive enough new water this year that it will be 71% full by the end of the year, according to Reclamation.
Flood task force officials said the deep snows, particularly in the southwestern and northwestern corners of the state, could cause flooding this spring and summer, especially if there is a series of hot, dry, windy days or major rain storms.
“We are blessed in large part because our snowpack tends to run off in a well-behaved manner,” said Kevin Houck, section chief of watershed and flood protection at the Colorado Water Conservation Board. “But I will say that I am watching things more closely this year. It’s not just the presence of snow that creates our problems. It needs to have a trigger as well. The classic trigger is the late spring warmup. And what can cause even more damage is when we get rain on snow as well.”
Jerd Smith is editor of Fresh Water News. She can be reached at 720-398-6474, via email at jerd@wateredco.org or @jerd_smith.
West snowpack basin-filled map March 29, 2023 via the NRCS
2023 GRANT FUNDS SUPPORT NUMEROUS PROJECTS THROUGHOUT UPPER GUNNISON BASIN
The Board of Directors of the Upper Gunnison River Water Conservancy District (UGRWCD) voted at the March 27th Board meeting to award $297,170 to organizations and individuals in the Upper Gunnison River Basin. These grant funds will be used for projects that will enhance water supply, improve stream and irrigation conditions, conserve water, provide water education benefits and restore wetlands. There was a diverse group of project applications from all over the Upper Gunnison River. Examples include a City of Gunnison native plant xeriscape project at 11th & Quartz Street intersection with educational signage, Coal Creek Dam Construction (Lake Irwin), and irrigation demonstration projects – one utilizing a combined plastic irrigation pipe, headwall, and turnout gate for improved irrigation water management and another utilizing an IntelliDitch HDPE Liner to prevent seepage loss.
All applicants were required to provide a 50 percent cost match and their projects had to be consistent with the District’s purpose, mission, and objectives.
UGRWCD General Manager Sonja Chavez noted during this year’s funding cycle, the District received requests for funding that totaled $370,613.
“It was a very competitive cycle and I strongly encourage those who were not funded to reach out to us to discuss their project and how they can make it stronger for the next cycle,” said Sonja.
Sonja also pointed out the District Grant Funding Program is a prime example of the District’s responsible allocation of tax revenues to directly benefit diverse water improvement projects in the basin. “I am delighted to report that during this cycle, our District grant funds were leveraged at a ratio of 1:3 with outside funding sources which just amplifies returns on District investment.
The UGRWCD Grant Program follows an annual cycle with applications due in February each year. General Manager Chavez urges potential applicants or individuals, even those just wondering about a water project, to reach out to the District now so that the District can help with infrastructure assessment or engineering that can assist in ensuring that the project can be funded. If you have a water project in mind, please call the District at (970) 641-6065 to schedule a consultation.
Bridge 40 Diversion. Photo credit: Upper Gunnison River Water Conservancy District
Chittendon Diversion Improvement. Photo credit: Upper Gunnison River Water Conservancy District
As a deadly tornado headed toward Rolling Fork, Mississippi, on March 24, 2023, forecasters saw the storm developing on radar and issued a rare “tornado emergency” warning. NOAA’s Weather Prediction and Storm Prediction centers had been warning for several days about the risk of severe weather in the region. But while forecasters can see the signs of potential tornadoes in advance, forecasting when and where tornadoes will form is still extremely difficult.
We asked Chris Nowotarski, an atmospheric scientist who works on severe thunderstorm computer modeling, to explain why – and how forecast technology is improving.
Why are tornadoes still so difficult to forecast?
Meteorologists have gotten a lot better at forecasting the conditions that make tornadoes more likely. But predicting exactly which thunderstorms will produce a tornado and when is harder, and that’s where a lot of severe weather research is focused today.
Often, you’ll have a line of thunderstorms in an environment that looks favorable for tornadoes, and one storm might produce a tornado but the others don’t.
The differences between them could be due to small differences in meteorological variables, such as temperature. Even changes in the land surface conditions – fields, forested regions or urban environments – could affect whether a tornado forms. These small changes in the storm environment can have large impacts on the processes within storms that can make or break a tornado.
One way scientists gather data for understanding tornadoes is by chasing storms. Annette Price/CIWRO, CC BY
One of the strongest predictors of whether a thunderstorm produces a tornado relates to vertical wind shear, which is how the wind changes direction or speed with height in the atmosphere.
How wind shear interacts with rain-cooled air within storms, which we call “outflow,” and how much precipitation evaporates can influence whether a tornado forms. If you’ve ever been in a thunderstorm, you know that right before it starts to rain, you often get a gust of cold air surging out from the storm. The characteristics of that cold air outflow are important to whether a tornado can form, because tornadoes typically form in that cooler portion of the storm.
How far in advance can you know if a tornado is likely to be large and powerful?
It’s complicated. Radar is still our biggest tool for determining when to issue a tornado warning – meaning a tornado is imminent in the area and people should seek shelter.
The vast majority of violent tornadoes form from supercells, thunderstorms with a deep rotating updraft, called a “mesocyclone.” Vertical wind shear can enable the midlevels of the storm to rotate, and upward suction from this mesocyclone can intensify the rotation within the storm’s outflow into a tornado.
If you have a supercell and it has strong rotation above the ground, that’s often a precursor to a tornado. Some research suggests that a wider mesocyclone is more likely to create a stronger, longer-lasting tornado than other storms.
Forecasters also look at the storm’s environmental conditions – temperature, humidity and wind shear. Those offer more clues that a storm is likely to produce a significant tornado. https://www.youtube.com/embed/R7CD6MpTefs?wmode=transparent&start=0 What radar showed as a tornado headed toward Rolling Fork on March 24, 2023.
The percentage of tornadoes that receive a warning has increased over recent decades, due to Doppler radar, improved modeling and better understanding of the storm environment. About 87% of deadly tornadoes from 2003 to 2017 had an advance warning.
The lead time for warnings has also improved. In general, it’s about 10 to 15 minutes now. That’s enough time to get to your basement or, if you’re in a trailer park or outside, to find a safe facility. Not every storm will have that much lead time, so it’s important to get to shelter fast.
What are researchers discovering today about tornadoes that can help protect lives in the future?
If you think back to the movie “Twister,” in the early 1990s we were starting to do more field work on tornadoes. We were taking radar out in trucks and driving vehicles with roof-mounted instruments into storms. That’s when we really started to appreciate what we call the storm-scale processes – the conditions inside the storm itself, how variations in temperature and humidity in outflow can influence the potential for tornadoes.
Scientists can’t launch a weather balloon or send instruments into every storm, though. So, we also use computers to model storms to understand what’s happening inside. Often, we’ll run several models, referred to as ensembles. For instance, if nine out of 10 models produce a tornado, we know there’s a good chance the storm will produce tornadoes.
The National Severe Storms Laboratory has recently been experimenting with tornado warnings based on these models, called Warn-on-Forecast, to increase the lead time for tornado warnings.
An early warning can be the difference between life and death for people in homes without basements or cellars. Chandan Khanna/AFP via Getty Images
There are a lot of other areas of research. For example, to better understand how storms form, I do a lot of idealized computer modeling. For that, I use a model with a simplified storm environment and make small changes to the environment to see how that changes the physics within the storm itself.
There are also new tools in storm chasing. There’s been an explosion in the use of drones – scientists are putting sensors into unmanned aerial vehicles and flying them close to and sometimes into the storm.
The focus of tornado research has also shifted from the Great Plains – the traditional “tornado alley” – to the Southeast.
What’s different about tornadoes in the Southeast?
In the Southeast there are some different influences on storms compared with the Great Plains. The Southeast has more trees and more varied terrain, and also more moisture in the atmosphere because it’s close to the Gulf of Mexico. There tend to be more fatalities in the Southeast, too, because more tornadoes form at night.
We tend to see more tornadoes in the Southeast that are in lines of thunderstorms called “quasi-linear convective systems.” The processes that lead to tornadoes in these storms can be different, and scientists are learning more about that.
Some research has also suggested the start of a climatological shift in tornadoes toward the Southeast. It can be difficult to disentangle an increase in storms from better technology spotting more tornadoes, though. So, more research is needed.
I missed posting about the 20th Anniversary of Coyote Gulch last year. Click the link to see the original post where I changed the name of the blog: https://radio-weblogs.com/0101170/2002/03/29.html
I apologize for the look on the linked post. I was using Radio Userland software and the company ceased operation in 2009. The former owner was able to get Automattic to host the blogs but many of the files were lost.
When Denver’s early settlers built the High Line Canal back in the 1880s, little did they know what the future would hold for the 71-mile man-made waterway that stretches from Waterton Canyon southwest of Littleton all the way to Aurora.
The High Line Canal was originally designed to deliver irrigation water to farmers on the dry plains of Denver. While Denver Water still owns and uses the canal to deliver irrigation water to customers, the canal corridor also has grown into a recreational asset and an ecological resource for the metro area.
On the recreational side, each year around 500,000 people walk, run and ride the canal’s 71-mile maintenance road that also serves as a popular trail. As an ecological resource, some sections of the canal structure itself are now being used for stormwater management.
The High Line Canal is an irrigation ditch built in the 1880s. Denver Water still uses the canal to deliver irrigation water to customers when conditions allow. Photo credit: Denver Water.
The evolution of the public’s use of the canal for recreation and stormwater management, along with its original role as a water delivery method, is one of the reasons why Denver Water and regional partners, including cities, counties, park and flood districts and stormwater management entities, have partnered with the High Line Canal Conservancy. The nonprofit organization’s mission is to preserve, protect and enhance the 71-mile canal in partnership with the public.
Denver Water plays an active role in the ongoing discussions about the canal’s future as it continues to serve its High Line customers. Because the canal has a junior water right and experiences high seepage and evaporation losses over large distances, Denver Water is looking for more reliable and efficient ways to deliver water to some of the High Line customers.
The High Line Canal in operation in May 2021. The canal is an inefficient means of delivering water long distances. It can get clogged with debris and loses 60% to 80% of its water to the ground due to seepage. Photo credit: Denver Water.
“As the canal’s role in the metro area evolves, Denver Water is committed to making sure it remains a beneficial asset to the community,” said Jeannine Shaw, Denver Water’s former government relations manager. “That’s why in 2020, the Denver Water Board of Commissioners approved an historic $10 million pledge to the High Line Canal Conservancy to invest in the long-term care and maintenance of the canal corridor.”
Included in the pledge is a piece of property and an office building located adjacent to the canal in Centennial for the Conservancy to use as its new headquarters.
The High Line Canal Conservancy’s new headquarters is located along the canal in Centennial. Denver Water provided the building to the nonprofit as part of a financial pledge in 2021. Photo credit: Denver Water.
As part of this evolution, the Conservancy, Denver Water and canal stakeholders are creating a new management structure called the Canal Collaborative to formally connect the regional partners as they guide the future of the canal.
Representatives from the Canal Collaborative pose with supporters for a picture to celebrate their work. Photo credit: High Line Canal Conservancy.
“The collaborative helps us do more together than any one entity can do alone,” said Suzanna Fry Jones, senior director of programs and partnerships for the High Line Canal Conservancy. “The collaborative management structure will ensure this treasured resource is preserved, protected and enhanced as a regional legacy for future generations.”
The formalized structure will benefit citizens and the environment along all 71 miles of the canal as it winds its way through Denver as well as Adams, Arapahoe and Douglas counties.
The Canal Collaborative includes the High Line Canal Conservancy, Denver Water, Arapahoe and Douglas counties, the cities of Aurora, Denver, Cherry Hills Village, Greenwood Village and Littleton, the Highlands Ranch Metro District, the Mile High Flood District, the Southeast Metro Stormwater Authority and South Suburban Parks and Recreation.
“The collaborative is important because we need to have a group that brings together all of the jurisdictions so we can hear from each one of those entities and their communities about what’s most important to them,” said Nancy Sharpe, Arapahoe County Commissioner for District 2, which includes Centennial, Greenwood Village, a portion of Aurora and unincorporated central Arapahoe County.
The Conservancy was formed in 2014 and has developed “The Plan for the High Line Canal,” which lays out guidance for repurposing the corridor along with over 100 recommendations for new projects.
Here’s a look at some of the developments along the canal in recent years.
Ecological resource
Under the new Stormwater Transformation and Enhancement Program, High Line Canal partners are looking at ways to allow and move stormwater through areas of the canal to improve water quality and manage local flooding in the South Platte River Basin. This is in addition to the canal’s existing irrigation delivery purposes.
Stormwater is any rain and snow that eventually flows off any impervious surface and into the canal.
Several structures have been built in or on the side of the canal to help manage the flow of stormwater through the channel.
The new structures that are located on the side of the canal help improve drainage on city streets and collect debris and trash before water enters the canal.
The structures being built inside the canal also help catch and stop debris and trash from flowing down the channel. They also temporarily slow down and detain water to filter out sediment.
These structures are designed to improve water quality before the water reaches receiving streams. Moving stormwater through the canal could provide an additional 100 days that the canal could be wet in some parts of the channel, which would benefit vegetation along the corridor while also enhancing the recreational user experience.
“Often times across the country, old utility and railroad corridors become degraded once their primary uses have been reduced, so we’re happy to see areas of the High Line Canal being maximized and transformed into green infrastructure,” Shaw said.
The City of Littleton built a stormwater management system on Windemere Street. Snow and rain drain through a grate on the street and into a pipe that flows into the High Line Canal. Photo credit: Denver Water.
The City and County of Denver built four “drive-through forebays” at the end of several streets next to the High Line Canal across from Eisenhower Park. Before the structures were built, stormwater would flow uncontrolled and unfiltered into the canal. The forebays act as pre-treatment structures that will slow water down and allow sediment and trash to settle onto the street before entering the canal. Photo credit: Denver Water.
The City and County of Denver built three concrete structures called water quality berms in the canal. This structure in the canal at Wellshire Golf Course will control the flow of water and catch trash and debris, making it easier to remove while providing cleaner water. Photo credit: Denver Water.
A new water quality berm with a headgate in the High Line Canal at Eisenhower Park in Denver. The berm temporarily detains stormwater to promote filtration of sediment before water passes through to improve water quality in the canal’s receiving streams. Photo credit: High Line Canal Conservancy.
When the High Line Canal is not in operation, gates are fully opened at stream crossings. This allows stormwater that’s been filtered in the canal to go into receiving streams such as Big Dry Creek at deKoevend Park in Centennial. Big Dry Creek eventually flows into the South Platte River. Photo credit: Denver Water.
Along with Littleton and Denver, stormwater projects are also being implemented in Centennial, Douglas County and Greenwood Village with additional projects in progress. Learn more about the Stormwater Transformation and Enhancement Program in this video.
Denver Water and its regional partners also are exploring other opportunities to allow the canal structure to be used. In areas where it has adequate stormwater capacity the canal could provide additional benefits to the neighboring communities and their surrounding environment to improve water quality in the South Platte River basin.
“As we navigate the evolving future for the lands the High Line Canal irrigates, Denver Water is excited to further the work with our regional partners to find additional utility for this cherished resource,” Shaw said.
The High Line Canal in September 2021, near the South Quebec Way trailhead in southeast Denver. The canal is dry most of the year when not in operation for irrigation deliveries. Moving stormwater through the channel improves water quality and could add an additional 100 days when the canal could be wet in some parts of the canal. Photo credit: Denver Water.
Tree canopy health
There are more than 23,000 mature trees along the High Line Canal, but many are at the end of their life span. The Conservancy is working with Denver Water and regional partners to remove dead trees and trim others to improve overall tree health and safety along the canal’s recreational trail.
To maintain the canal’s urban forest, the Conservancy’s Plan recommends planting 3,500 new trees by 2030. The species of trees being planted will be more drought tolerant than many of the old cottonwood trees currently along the canal.
In the fall of 2021, the Conservancy, along with the support of local volunteers and The Park People, planted 175 new, drought-tolerant trees. Photo credit: High Line Canal Conservancy.
Trail improvements
A major goal of the Conservancy and the Canal Collaborative is to make it easier, safer and more fun to walk or ride on the canal’s recreational trail. The Conservancy is working with local jurisdictions to add new pedestrian bridges, trailheads, underpasses, mile markers and wayfinding signs.
A biker rides through the new underpass that goes under South Colorado Boulevard and East Hampden Avenue next to Wellshire Golf Course in south Denver. The project provides a critical connection to allow safe passage under two busy streets, resulting in easier trail access and encouraging more users. The collaborative project was funded by the City and County of Denver, Cherry Hills Village and Arapahoe County along with funds from the federal government. Photo credit: Denver Water.
A new sign along the High Line Canal trail in Aurora installed in 2021 provides a map to help trail users navigate the corridor. Photo credit: Denver Water.
Arapahoe County Open Spaces opened a new trailhead on South Quebec Way in southeast Denver. The site includes parking, a bathroom, a trash can and a trail map. Adding new trailheads is major goal of the High Line Canal Conservancy to improve access and facilities for the public. Photo credit: Denver Water.
Canal Improvement Zones
Under The Plan, the Conservancy has worked with the community and jurisdictional partners to identify nine Canal Improvement Zones. These are locations where residents asked for trail enhancements to increase physical activity, foster community connections and create access points to nature.
Many of the sites are in diverse neighborhoods where the canal corridor has been historically under-utilized and lacked investment.
Enhancements may include pedestrian bridges, improved trail access, benches, signs, gathering spots and play areas.
The first location to see new projects is the Laredo Highline neighborhood in Aurora, thanks to a $180,000 grant from the Colorado Health Foundation and an additional $180,000 from Arapahoe County.
A rendering of enhancements to the High Line Canal trail in Aurora’s Laredo Highline neighborhood. The enhancements include a new pedestrian bridge to improve trail access and new play and seating areas. Image credit: High Line Canal Conservancy.
“I grew up in the Laredo Highline neighborhood and the canal has always helped bring the community together,” said Aurora resident Janak Garg. “We’re really looking forward to the new bridge and other improvements coming to the neighborhood.”
Janak Garg and his family stand at the spot where a new pedestrian bridge will be built across the canal in Aurora’s Laredo Highline neighborhood. Photo credit: Denver Water.
New mile markers
A very noticeable and welcome improvement to the trail is the addition of new mile markers. In the past, there were a variety of mile markers with different mileage from each jurisdiction, which made it confusing for hikers and bikers.
Now there are new Colorado red sandstone mile markers that line the trail from start to finish, paid for through donations by the Conservancy’s founding partners.
Most of the markers have a quote or message from the founding partners, like Al Galperin who lives near the South Quebec Way Trailhead, whose message reads: “Be the reason someone smiles today.”
“I hope it brings a little bit of extra joy to people on the trail,” Galperin said. “It’s nice to be able to help out and see all the new features coming to the canal.”
Al Galperin and his dog Brody stand next to one of the new mile markers along the High Line Canal trail. Galperin is one of the High Line Canal Conservancy’s Founding Partners who made a donation to help fund the mile marker project. Photo caption: Denver Water.
“It’s inspiring to see all these improvements and we’re excited for the future of the canal,” Shaw said. “The Conservancy and all of the partners are doing a great job leading the way and working with Denver Water and the community.”
Denver Water crews participate with volunteers to help clean up the canal in Aurora in April 2021. Photo credit: Denver Water.
Visit highlinecanal.org to sign up for monthly emails for information on events throughout the year. The website also provides information about history of the canal, new projects and volunteer opportunities.
Republican River in Colorado January 2023 near the Nebraska border. Photo credit: Allen Best/Big Pivots
Click the link to read the article on the Big Pivots Website (Allen Best):
Climate scientists issue their latest, stern warning while farmers in Colorado’s Republican River Basin grapple with how to be sustainable
The International Panel on Climate Change this week [March 20, 2023] issued its latest report, warning of a dangerous temperature threshold that we’ll breach during the next decade if we fail to dramatically reduce emissions. A Colorado legislative committee on the same day addressed water withdrawals in the Republican River Basin that must be curbed by decade’s end.
In both, problems largely created in the 20th century must now be addressed quickly to avoid the scowls of future generations.
The river basin, which lies east of Denver, sandwiched by Interstates 70 and 76, differs from nearly all others in Colorado in that it gets no annual snowmelt from the state’s mountain peaks. Even so, by tapping the Ogallala and other aquifers, farmers have made it one of the state’s most agriculturally productive areas. They grow potatoes and watermelons but especially corn and other plants fed to cattle and hogs. This is Colorado without mountains, an ocean of big skies and rolling sandhills.
Republican River farmers face two overlapping problems. One is of declining wells. Given current pumping rates, they will go dry. The only question is when. Some already have.
More immediate is how these wells have depleted flows of the Republican River and its tributaries into Nebraska and Kansas. Those states cried foul, citing a 1943 interstate compact. Colorado in 2016 agreed to pare 25,000 of its 450,000 to 500,000 irrigated acres within the basin.
Colorado has a December 2029 deadline. The Republican River Water Conservation District has been paying farmers to retire land from irrigation. Huge commodity prices discourage this, but district officials said they are confident they can achieve 10,000 acres before the end of 2024.
Rod Lenz and siblings moved to the Republican River Basin in 1974 to take advantage of new technology that allowed them to draft the then-vast stores of the Ogallala and other High Plains aquifers. Top, the main stem of the Republican River flows into Nebraska augmented by water from special wells and a pipeline constructed at a cost of $60 million. January 2023 photos/Allen Best
Last year, legislators sweetened the pot with an allocation of $30 million, and a like amount for retirement of irrigated land in the San Luis Valley, which has a similar problem. Since 2004, when it was created, the Republican River district self-encumbered $156 million in fee collections and debt for the transition.
It’s unclear that the district can achieve the 2030 goal. The bill unanimously approved by the Colorado House Agriculture, Water and Natural Resources Committee will, if it becomes law, task the Colorado Water Center at Colorado State University with documenting the economic loss to the region – and to Colorado altogether – if irrigated Republican River Basin agriculture ceases altogether. The farmers may need more help as the deadline approaches.
This all-or-nothing proposition is not academic. Kevin Rein, the state water engineer, testified that he must shut down all basin wells if compact requirements are not met. The focus is on the Republican’s South Fork, between Wray and Burlington.
Legislators were told that relying solely upon water that falls from the sky diminishes production 75 to 80 percent.
In seeking this study, the river district wants legislators to be aware of what is at stake.
Rod Lenz, who chairs the river district board, put it in human terms. His extended-family’s 5,000-acre farm amid the sandhills can support 13 families, he told me. Returned to grasslands, that same farm could support only two families.
An “evolution of accountability” is how Lenz describes the big picture in the Republican River Basin. “We all knew it was coming. But it was so far in the future. Well, the future is here now.”
Much of the agricultural production in the Republican River Basin supports livestock sectors, including this dairy near Holyoke. Photo/Allen Best
The district has 10 committees charged with investigating ways to sustain the basin’s economy and leave its small towns thriving. Can it attract Internet technology developers? Can the remaining water be used for higher-value purposes? Can new technology irrigate more efficiently?
“We do know we must evolve,” Lenz told me. The farmers began large-scale pumping with the arrival of center-pivot sprinklers, a technology invented in Colorado in 1940. They’re remarkably efficient at extracting underground water. Aquifers created over millions of years are being depleted in a century. Now, they must figure out sustainable agriculture. That’s a very difficult conversation.
The Republican River shares similarities with the better-known and much larger Colorado River Basin. The mid-20th century was the time of applying human ingenuity to development of water resources. Now, along with past miscalculations, the warming climate is exacting a price, aridification of the Colorado River Basin.
Observed (1900-2020) and projected (2021-2100) warming relative to pre-industrial temperatures (1850-1900). Projections relate to very low emissions (SSP1-1.9), low emissions (SSP1-2.6), intermediate emissions (SSP2-4.5), high emissions (SSP3-7.0) and very high emissions (SSP5-8.5). Temperatures are colour-coded from the pre-industrial average (blue-grey) through to current warming of 1.1C (orange) and potentially more than 4C by 2100 (purple). Source: IPCC (2023) Figure SPM.1
Globally, the latest report from climate scientists paints an even greater challenge. To avoid really bad stuff, they say, we must halve our greenhouse gas emissions by 2030. They insist upon need for new technologies, including ways to suck carbon out of the atmosphere, that have yet to be scaled.
We need that evolution of accountability described in Colorado’s Republican River Basin. We need a revolution of accountability on the global scale. [ed. emphasis mine]
Yuma and adjoining counties routinely rank among Colorado’s top producers of corn. Photo/Allen Best
Water. Those of us fortunate enough to have easy access to this essential resource might not think about how much we use or whether those uses are worthwhile. And if we do, we might not know what we can do to be better stewards.
In honor of World Water Day, March 22, SOURCE asked Colorado Water Center Director John Tracy a few questions – maybe even some that have been on your mind. His answers might surprise you. You could even see the glass as half full.
What does World Water Day mean to you?
World Water Day means reflecting on how we are interconnected through water. The water you use either evaporates into the air, which becomes somebody else’s water supply, or it goes down the drain to a water treatment plant and gets treated and sent back to the river, which is somebody else’s water supply. The water we use is somebody else’s supply, which means somebody else’s use is our supply.
How concerned should we be about the Colorado River drying up?
The Colorado River Compact was set up to allocate 17.5 million acre-feet a hundred years ago, and there never was 17.5 million acre-feet to allocate in the first place. It was an imaginary number that came about through a political agreement. Over the years, climate change has led to a decrease in overall water supply in the Colorado River. The last several years were very bad drought years, but if you looked at the total water supply, it was still about 12.5 million acre-feet. The idea of the river drying up completely, that’s just not within the realm of possibility now. In 100 years, who knows? But that’s not where we’re at right now. The question becomes: Who’s going to use less water? The second decisions are made and everybody has certainty with what they really have – both in terms of an agreement and in terms of what I call real water – with that level of certainty, people will be able to make good decisions and move forward.
Does Colorado have a water crisis?
We have continuing issues we have to deal with. It’s not so much a problem of not having enough water or knowing what we have to manage. We’re having to live with politically negotiated documents that don’t reflect either the physical situation or the value system we’re under right now. Climate change is affecting our snowpack, which is affecting our runoff, and it is making some management difficult because the snowpack is coming down a little earlier, there’s more consumptive water use higher up in the watershed, and it’s having real impacts. But there’s a lot of other issues that just have to do with living within the constraints of the compacts. It’s harder, and we’ve got to put more time and effort and money into it, but it’s not a crisis in my mind.
John Tracy, director of the Colorado Water Center, Colorado State University
What is Colorado’s biggest water issue?
Workforce. Everybody talks about infrastructure to solve our water problems. But when you build this infrastructure and you have all these management systems and you have to live within the constraints of our river compacts, you need a sophisticated workforce to understand how to operate and manage all of this. I think that’s where our challenge is. There’s not enough of a workforce development pipeline right now, and part of that is, it’s still a very traditionally white, male field. If you’re not recruiting from the entire workforce, which is much more diverse than it was 30 years ago, the pool you’re recruiting from is too small.
Do we have to worry about turning on the tap and not having water?
It depends on where you are and how well your water supply system is maintained. There are areas across the U.S. that have relied on shallow groundwater wells for water supplies that have seen groundwater levels drop enough that their wells can no longer produce water. The simplest solution to this problem is to dig a deeper well, but this can be expensive and in the long run results in “a race to the bottom” with the deepest well winning. This problem does exist for some homeowners in Colorado, but primarily for those who use self-supplied groundwater and live in areas with heavy agricultural groundwater use. For Coloradans living along the Front Range who receive their water supplies from municipal providers, this is not really a problem.
You have said that Colorado is using less water now than it was 20 years ago, despite population growth. How is that possible?
I am working with a class of undergraduate environmental data science students to have them analyze this situation. Here is a graph of overall water use for the U.S. and some of the fastest growing states since 1985. All states are reporting less water use since 2000, and this trend is continuing.
Graphic credit: Colorado State University
The simple answer is that this decline in water use is directly related to increased efficiency. But it should be stressed that there is a difference between water use reported to the USGS and consumptive water use, which relates to water that is used for economic gain. I have not seen any statistics on changes in consumptive water use, but new tools are being developed that will be much better at assessing this statistic.
What should we think about/do at the individual level to respect our water resources?
We need to be aware of the value (economic, ecological, social, spiritual) we are getting when we use water. Before 2000, we used a lot of water without getting any value for it. The more we pay attention to the value we receive from our water use – whether it is watering a section of lawn for our children to play on, having it flow in the Poudre River so we can float the river, irrigating our crops or simply enjoying a sunset over a lake – the more we will respect water and be better informed in our decisions on how to manage water as a society.
As snow keeps falling in Colorado, boosting some parts of the state to record-highs, plenty of powder has been stacking up in the state’s ski country. On March 23, Steamboat Resort took to social media to announce that their mid-mountain station had passed the 400-inch season total mark. Perhaps more impressive is the 500 inches of snow they report has landed on the ski area’s summit. Reported totals at the mid-mountain station and the summit are 401.5 inches and 507 inches, respectively…According to Steamboat Pilot and Today, this is only the 9th time the mid-mountain station has recorded more than 400 inches, with the last time being the 2012 to 2013 season, when 433 inches fell. The snowiest season on record was that of 2007 to 2008, when a total of 489 inches was hit…
The greater Yampa-White-Little Snake river basin that includes Steamboat Springs is currently at 147 percent of the 30-year to-date median snowpack. This isn’t a record high, but it’s close.
NEW RECORD: It's official. SNOTEL weather stations reached an average of 26.1 inches. This year now appears to have the largest snowpack since 1952, and in case you haven't notice, it's STILL snowing! Chart here: https://t.co/mbIzmWqIV5#utwxpic.twitter.com/Fvj0mr8O6w
My little boys are growing up. My older one starts kindergarten next month. My little one is charging out of toddlerhood, becoming more independent by the day. Life moves so fast, and the best way I know to slow things down and treasure the moments is to get out on a river.
My sons exploring outside together. Photo credit: Amy Souers Kober
So I took the boys to Oaks Bottom Wildlife Refuge. It’s in the heart of Portland, not far from our house.
A little piece of wildness on the Willamette River. An easy urban escape. It was cloudy, a welcome break from the record heat and drought we’ve had this summer. The alders and cottonwoods smelled so good as we walked the shady trails.
Walking down to the river, we talked, free of distractions. At home I feel as if I’m always trying to do five things at once and conversations are constantly interrupted. But here, it’s just us. No chores or emails, just walking and chatting. Just being, together. My five year old reaches out to hold my hand, and my heart melts. How much longer until he’s too old, too cool, for this?
As we walk, I’m thinking about a recent New York Times article, HOW WALKING IN NATURE CHANGES THE BRAIN. The story looks at how spending time in natural spaces reduces anxiety, worry and stress.
For me, rivers are medicine. I know when I need a break, when I need to get out for a float, swim, paddle, or streamside hike. If walking in nature changes our brains, then spending time on rivers must deliver an even bigger bang for the buck, right? I’m thinking of multi-day river trips. I’m thinking of finding peace and connection, of open hearts and strengthened spirits. Healing waters. I’m remembering floating on my back down the Salmon, nights in the Grand Canyon, early morning kayaking on the Potomac…
My boys, racing for the river’s steep bank, bring me back to earth. I snap out of my reverie and take their hands. Together, we carefully approach the eroded edge. A sailboat is anchored here, and kayaks paddle by. We wave, and they wave back.
My five year old asks if he can get a kayak for his birthday.
I think that’s his best birthday present request yet. And I’m game. Any excuse to get us out here more often. For fun, of course. But also to test our own mini science experiment that nature, that rivers, really are fundamental to our health, well-being, and relationships. That they are essential to our happiness, to who we are.
Without water, life on Earth could not exist as it does today. Understanding the history of water in the universe is critical to understanding how planets like Earth come to be.
Astronomers typically refer to the journey water takes from its formation as individual molecules in space to its resting place on the surfaces of planets as “the water trail.” The trail starts in the interstellar medium with hydrogen and oxygen gas and ends with oceans and ice caps on planets, with icy moons orbiting gas giants and icy comets and asteroids that orbit stars. The beginnings and ends of this trail are easy to see, but the middle has remained a mystery.
I am an astronomer who studies the formation of stars and planets using observations from radio and infrared telescopes. In a new paper, my colleagues and I describe the first measurements ever made of this previously hidden middle part of the water trail and what these findings mean for the water found on planets like Earth.
Star and planet formation is an intertwined process that starts with a cloud of molecules in space. Bill Saxton, NRAO/AUI/NSF, CC BY
Stars begin to form when parts of the collapsing cloud reach a certain density and heat up enough to start fusing hydrogen atoms together. Since only a small fraction of the gas initially collapses into the newborn protostar, the rest of the gas and dust forms a flattened disk of material circling around the spinning, newborn star. Astronomers call this a proto-planetary disk.
As icy dust particles collide with each other inside a proto-planetary disk, they begin to clump together. The process continues and eventually forms the familiar objects of space like asteroids, comets, rocky planets like Earth and gas giants like Jupiter or Saturn.
There are two potential pathways that water in our solar system could have taken. The first, called chemical inheritance, is when the water molecules originally formed in the interstellar medium are delivered to proto-planetary disks and all the bodies they create without going through any changes.
The second theory is called chemical reset. In this process, the heat from the formation of the proto-planetary disk and newborn star breaks apart water molecules, which then reform once the proto-planetary disk cools.
Normal hydrogen, or protium, does not contain a neutron in its nucleus, while deuterium contains one neutron, making it heavier. Dirk Hünniger/Wikimedia Commons, CC BY-SA
To test these theories, astronomers like me look at the ratio between normal water and a special kind of water called semi-heavy water. Water is normally made of two hydrogen atoms and one oxygen atom. Semi-heavy water is made of one oxygen atom, one hydrogen atom and one atom of deuterium – a heavier isotope of hydrogen with an extra neutron in its nucleus.
The ratio of semi-heavy to normal water is a guiding light on the water trail – measuring the ratio can tell astronomers a lot about the source of water. Chemical models and experiments have shown that about 1,000 times more semi-heavy water will be produced in the cold interstellar medium than in the conditions of a protoplanetary disk.
This difference means that by measuring the ratio of semi-heavy to normal water in a place, astronomers can tell whether that water went through the chemical inheritance or chemical reset pathway.
V883 Orionis is a young star system with a rare star at its center that makes measuring water in the proto-planetary cloud, shown in the cutaway, possible. ALMA (ESO/NAOJ/NRAO), B. Saxton (NRAO/AUI/NSF), CC BY
Measuring water during the formation of a planet
Comets have a ratio of semi-heavy to normal water almost perfectly in line with chemical inheritance, meaning the water hasn’t undergone a major chemical change since it was first created in space. Earth’s ratio sits somewhere in between the inheritance and reset ratio, making it unclear where the water came from.
To truly determine where the water on planets comes from, astronomers needed to find a goldilocks proto-planetary disk – one that is just the right temperature and size to allow observations of water. Doing so has proved to be incredibly difficult. It is possible to detect semi-heavy and normal water when water is a gas; unfortunately for astronomers, the vast majority of proto-plantary disks are very cold and contain mostly ice, and it is nearly impossible to measure water ratios from ice at interstellar distances.
A breakthrough came in 2016, when my colleagues and I were studying proto-planetary disks around a rare type of young star called FU Orionis stars. Most young stars consume matter from the proto-planetary disks around them. FU Orionis stars are unique because they consume matter about 100 times faster than typical young stars and, as a result, emit hundreds of times more energy. Due to this higher energy output, the proto-planetary disks around FU Orionis stars are heated to much higher temperatures, turning ice into water vapor out to large distances from the star.
Using the Atacama Large Millimeter/submillimeter Array, a powerful radio telescope in northern Chile, we discovered a large, warm proto-planetary disk around the Sunlike young star V883 Ori, about 1,300 light years from Earth in the constellation Orion.
V883 Ori emits 200 times more energy than the Sun, and my colleagues and I recognized that it was an ideal candidate to observe the semi-heavy to normal water ratio.
These results fill in the gap of the water trail forging a direct link between water in the interstellar medium, protostars, proto-planetary disks and planets like Earth through the process of inheritance, not chemical reset.
The new results show definitively that a substantial portion of the water on Earth most likely formed billions of years ago, before the Sun had even ignited. Confirming this missing piece of water’s path through the universe offers clues to origins of water on Earth. Scientists have previously suggested that most water on Earth came from comets impacting the planet. The fact that Earth has less semi-heavy water than comets and V883 Ori, but more than chemical reset theory would produce, means that water on Earth likely came from more than one source.
West snowpack basin-filled map March 26, 2023 via the NRCS.
Colorado snowpack basin-filled map March 26, 2023 via the NRCS.
Snow Water Equivalent in Colorado Headwaters graph March 27, 2023 via the NRCS.
Snow Water Equivalent in San Miguel, Dolores, Animas, and San Juan graph March 27, 2023 via the NRCS. Beck Bolinger from the Colorado Climate Center said of this graph over the weekend, “The San Juans are just showing off!”
The first is that the Valley’s sun is perfectly suitable for renewable solar energy and the cost to develop it is as low as it has ever been. The second is that transmitting the solar energy and sharing it with the rest of Colorado is the challenge due to the difficulty of establishing new transmission routes in the mountainous region.
“The SLV is generally regarded as having the best solar resource in Colorado, and among the best in the United States. The Valley’s flat, high-elevation geography and dry and sunny climate is conducive to large-scale solar developments,” Public Service Company of Colorado told the CPUC in February.
“In fact,” according to comments relayed by the Interwest Energy Alliance and Western Resource Advocates, “the National Renewable Energy Laboratory (NREL) identified the Valley as the premier site for Concentrated Solar Power (CSP) siting in the state of Colorado.”
The background
Last November the Colorado Public Utilities Commission opened a miscellaneous docket proceeding to look at the potential value in a new transmission solution into and out of the San Luis Valley. Then in December the CPUC board agreed to move forward with an investigatory proceeding to “examine alternative options for expanding transmission capacity within the San Luis Valley.”
The state regulatory agency has not signaled any additional steps since it closed its comment period in February on solar and transmission development in the San Luis Valley. The Colorado Public Utilities Commission will get a new director following the retirement of Doug Dean and the timing of when it proceeds with its San Luis Valley review is unclear.
‘Part of it is solar irradiance’
It’s the output of light energy from the entire disk of the Sun – or solar irradiance – that makes the sun in the Valley suitable for solar energy development. “It is imperative that this potential resource is not hampered by lack of transmission,” the Interwest Energy Alliance and Western Resource Advocates said in their joint comments.
“Larger transmission interconnection to the rest of Colorado and the wider western interconnect could have profound implications for job growth and diversification in the SLV as well,” they noted.
The Colorado Energy Office is also on board with solar and transmission development in the Valley. In comments to the CPUC, Colorado Energy Office said it is working through the U.S. Department of Energy to help secure funding for transmission development. The DOE, as part of the Bipartisan Infrastructure Law, announced a $10.5 billion investment to strengthen the electric grid in the United States through its Grid Resilience and Innovation Partnerships Program.
“Additional capacity will enable connecting new solar resources to the grid that can help advance the state’s transition to clean, renewable energy,” the Colorado Energy Office offered in its comments. “Additionally, the construction of transmission lines and the subsequent construction of solar facilities in the SLV would provide substantial economic benefits to a portion of the state that has historically had lower economic growth.”
Comments to the Colorado Public Utilities Commission note the ongoing reduction of irrigated agriculture as San Luis Valley farmers come into compliance with the state’s groundwater pumping rules and work to restore the aquifers of the Upper Rio Grande.
“By having a robust transmission system, landowners will have an alternative to put their property to good use and help create jobs for the area,” Monte Vista City Manager Gigi Dennis wrote in her comments to the CPUC. “And in considering water scarcity in Colorado and from the Rio Grande River, valuable land will be put to beneficial use with solar farms rather than a crop that is thirsty for water. This is good conservation.”
Transmission challenge
In a 2022 report, the National Renewable Energy Laboratory in Golden notes, “The cost of solar power in the Valley compares favorably to utilities’ current and recent historical costs” but that the market demand for a solar project is uncertain given the regulatory process.
“Many alternatives exist in Colorado that can serve the same demand at the same cost but with fewer transmission limitations. The game-changing factor would be a decision by Xcel Energy and the Tri-State Generation and Transmission Association to upgrade the 230kV line from the Valley to Poncha Springs, Colorado, which would add as much as 600 MW of new export capacity, or four times the solar capacity currently in the Valley.”
In comments to the CPUC, Public Service said “many factors have changed over the past decade that merit a thorough reconsideration of new investments transmission to unlock the Valley’s solar resources. Increasing cost-effectiveness of new renewable resources, load growth, the state and federal policies that promote or require carbon emissions reduction from electric generation required another paradigm shift in planning for the expansion of the transmission system.”
Identifying new transmission routes to match solar energy generation is separate from the ongoing work Xcel Energy is doing in upgrading the existing transmission system in the Valley through major line rebuilds. Public Service said it will invest around $115 million in modernizing the Valley’s transmission system, including an upcoming replacement of the Alamosa to Antonito transmission line.
There are three transmission lines that connect the Valley to Colorado’s transmission grid, Public Service notes. These three lines all begin in Poncha Springs in Chaffee County and enter the northern edge of the Valley over the 9,010-foot elevation Poncha Pass. “Today, transmission service to the Valley is radial in nature – the system is connected to the electric grid from one location and is not networked with other parts of the Public Service or neighboring transmission systems through a separate path.”
Public Service, Tri-State Generation and Transmission Association, the U.S. Department of Energy (DOE) and the Bureau of Land Management have all studied alternative transmission routes in the San Luis Valley. More than a decade ago, Public Service and Tri-State gained approval from the Colorado Public Utilities Commission to develop an approximately 95-mile “Calumet transmission line” on the eastern edge of the Valley but ran into concerns from private landowners, including Trinchera Ranch owner Louis Bacon.
Ultimately, following a legal challenge in Costilla County District Court, Public Service and Tri-State officially bowed out of the project. Blanca Ranch Holding, LLC and Trinchera Ranch Holdings, LLC have filed a notice of participation with Colorado Public Utilities Commission for the next round of discussions on where to site new transmission routes in the Valley.
“Transmission expansion in the SLV will require sustained attention and political capital by a broad variety of stakeholders and will entail the coordination of resources to solve challenges with reliability, technology, geography and land use, wildfire risk, and cost,” Public Service said in its comments.
As Tri-State notes, routing challenges exist along all five of the state highways out of the Valley: Highway 160 over Wolf Creek; Highway 114 over North Pass; Highway 285 north over Poncha Pass; Highway 160 east over La Veta Pass; and Highway 285 south toward New Mexico.
Rio Grande del Norte National Monument via the Bureau of Land Management
“Routing challenges exist along each of these highways as they each run through (or near) land held by the Bureau of Land Management (BLM), US Forest Service, National Park Service, Fish and Wildlife Service, Bureau of Reclamation, and Bureau of Indians Lands. Further, some land is subject to a conservation easement (in the case of Trinchera and Blanca Ranch), is part of a National Park (Great Sand Dunes), or is part of a National Monument (Rio Grande del Norte).”
And therein lies the challenge: The San Luis Valley has the sun to generate solar energy as a redundant source of power for itself and to share with the rest of the state. Transmitting it is where the problems begin.
JOIN US
Alamosa Citizen members get the Monday Briefing sent directly to their In boxes – plus a weekly newsletter on Thursdays that summarizes the top stories in the Valley. Member support keeps The Citizen free for all to read.
On March 3, 1923, President Warren G. Harding wielded the Antiquities Act to designate Hovenweep National Monument in southeastern Utah. The designation put a few hundred acres and a handful of Puebloan towers and other cultural sites under the auspices of the National Park Service, and was mainly aimed at protecting the sites from further looting and vandalism.
“Few of the mounds have escaped the hands of the destroyer,” T. Mitchell Pruden wrote of Hovenweep’s cultural sites in 1903. “Cattlemen, ranchmen, rural picnickers, and professional collectors have turned the ground well over and have taken out much pottery, breaking more, and strewing the ground with many crumbling bones.”
Jonathan P. Thompson photo.
The protections that come with a national monument arrived a little late and covered far too little ground and too few sites. Still, we can be thankful that some of the most prominent structures were kept from further destruction. But regardless of the national monument status, or which federal agency manages it, Hovenweep is a special place — one of my favorites. No one describes it better than the late scholar, potter, architect, and activist Rina Swentzell, Tewa, of Santa Clara Pueblo:
“I think that Hovenweep is the most symbolic of places in the Southwest…Hovenweep give me a feeling similar to what I feel when I’m participating in ceremonies which require a tacit recognition of realities other than the blatantly visual. During those times I know the nature and energy of the bear, of rock, of the clouds, of the water. I become aware of energies outside myself, outside the human context. At Hovenweep, I slide into a place and begin to know the flowing, warm sandstone under my feet, the cool preciousness of the water, the void of the canyon, and the all covering sky. I want to be a part of the place.” — Rina Swentzell, Tewa architect, potter and scholar, Santa Clara Pueblo.
At its March 9 meeting, the Pagosa Area Water and Sanitation District (PAWSD) Board of Directors ap- proved a 20-year capital investment plan for the district. At the meeting, board president Jim Smith highlighted the amount of work that had gone into the plan and the document’s effectiveness in showing the elements of PAWSD’s system and its mission. The plan details the improvements and replacements that will be needed to maintain and keep the PAWSD system operational over the next 20 years.
Among the largest items are an expected $50,760,382 in upgrades to the Vista wastewater treatment plant to upgrade equipment and maintain compliance with state regulations, an expected $45,982,570 for the construction of the new and expanded Snowball Water Treatment Plant, and an expected $10,969,000 in distribution system costs, much of which will be spent on replacing aging water mains and fire hydrants as well as the addition of a new pump station and the repainting of water storage tanks.
Delegates at the IPCC meeting in Interlaken, Switzerland, on 18 March 2023. Credit: IISD
Click the link to read the article on the Carbon Brief website (Aruna Chandra, Daisy Dunne, Orla Dwyer, Simon Evans, Robert McSweeney, Ayesha Tandon, and Giuliana Viglione)
The final part of the world’s most comprehensive assessment of climate change – which details the “unequivocal” role of humans, its impacts on “every region” of the world and what must be done to solve it – has now been published in full by the UN’s Intergovernmental Panel on Climate Change (IPCC).
The synthesis report is the last in the IPCC’s sixth assessment cycle, which has involved 700 scientists in 91 countries. Overall, the full cycle of reports has taken eight years to complete.
The report sets out in the clearest and most evidenced detail yet how humans are responsible for the 1.1C of temperature rise seen since the start of the industrial era.
It also shows how the impacts of this level of warming are already deadly and disproportionately heaped upon the world’s most vulnerable people.
The report notes that policies in place by the end of 2021 – the cut-off date for evidence cited in the assessment – would likely see temperatures exceed 1.5C this century and reach around 3.2C by 2100.
In many parts of the world, humans and ecosystems will be unable to adapt to this amount of warming, it says. And the losses and damages will “escalate with every increment” of global temperature rise.
But it also lays out how governments can still take action to avoid the worst of climate change, with the rest of this decade being crucial for deciding impacts for the rest of the century. The report says:
“There is a rapidly closing window of opportunity to secure a liveable and sustainable future for all…The choices and actions implemented in this decade will have impacts now and for thousands of years.”
The report shows that many options for tackling climate change – from wind and solar power to tackling food waste and greening cities – are already cost effective, enjoy public support and would come with co-benefits for human health and nature.
At a press briefing, leading climate scientist and IPCC author Prof Friederike Otto said the report highlights “not only the urgency of the problem and the gravity of it, but also lots of reasons for hope – because we still have the time to act and we have everything we need”.
Carbon Brief’s team of journalists has delved through each page of the IPCC’s AR6 full synthesis report to produce a digestible summary of the key findings and graphics.
The synthesis report is the final part of the IPCC’s sixth assessment cycle. It “integrates” the main findings of the three working group reports, which have been published over the last 18 months or so:
As the “mandate” was to produce a synthesis of existing material, “there is nothing that is in there that is not in the underlying reports”, author Prof Fredi Otto – a senior lecturer at the Grantham Institute for Climate Change and the Environment at Imperial College London – told a press briefing. This means that the report does not include any research or emissions pledges issued after the cut-off date for the WG3 assessment – which was 11 October 2021, several weeks before the COP26 climate summit in Glasgow.
The synthesis report is much shorter than the full assessment reports. The combined length of the “summary for policymakers” (SPM) – a short, non-technical synopsis – and the underlying report clocks in at 122 pages. This is longer than the 42.5 pages that were planned (pdf), but a fraction of the assessment reports that can top 3,000 pages. As with the assessment reports, the synthesis report has been through several rounds of review by experts and governments.
The report’s SPM was signed off via a line-by-line approval session involving authors and government delegates last week in Switzerland.
However, unlike the assessment reports, the session also approved the underlying full report “section by section”. It was also the IPCC’s first approval session since the Covid-19 pandemic that was held in person.
The approval process was scheduled to be completed on Friday 17 March, but overran – despite multiple “night sessions” and “round-the-clock deliberations”. The SPM was finally approved on the morning of Sunday 19 March in a “sparsely attended room”, as many developing country delegates had already left the venue, Third World Network reported. “People who have to contribute have left the meeting,” said India’s representatives in the early hours before the closing plenary.
Once the SPM was approved, there was then a “huge moment of panic” around whether “it would at all be possible to do the approval of the long report”, Otto said:
“We all almost died of adrenaline poisoning during [Sunday], but then it was approved quite straightforwardly.”
(The Earth Negotiations Bulletin has published a summary of the discussions during the approval session. This is referenced frequently in this article.)
The synthesis report shares the IPCC’s “calibrated language” that the assessment reports use to communicate levels of certainty behind the statements it includes.
The findings are given “as statements of fact or associated with an assessed level of confidence”, based on scientific understanding. The language indicates the “underlying evidence and agreement”, the report explains:
“A level of confidence is expressed using five qualifiers: very low, low, medium, high and very high, and typeset in italics, for example, medium confidence.
“The following terms have been used to indicate the assessed likelihood of an outcome or result: virtually certain 99-100% probability; very likely 90-100%; likely 66-100%; more likely than not >50-100%; about as likely as not 33-66%; unlikely 0-33%; very unlikely 0—10%; and exceptionally unlikely 0-1%. Additional terms (extremely likely 95-100%; more likely than not >50-100%; and extremely unlikely 0-5%) are also used when appropriate.”
The synthesis includes projections based on the latest generation of global climate models, produced as part of the sixth Coupled Model Intercomparison Project (CMIP6) for the AR6 cycle. However, it also brings together different approaches for how future pathways were considered in the assessment reports.
The WG1 report “assessed the climate response to five illustrative scenarios based on Shared Socioeconomic Pathways (SSPs) that cover the range of possible future development of anthropogenic drivers of climate change found in the literature”, the synthesis explains:
“The high and very high GHG emissions scenarios (SSP3-7.0 and SSP5-8.5) have CO2 emissions that roughly double from current levels by 2100 and 2050, respectively. The intermediate GHG emissions scenario (SSP2-4.5) has CO2 emissions remaining around current levels until the middle of the century. The very low and low GHG emissions scenarios (SSP1-1.9 and SSP1-2.6) have CO2 emissions declining to net-zero around 2050 and 2070, respectively, followed by varying levels of net-negative CO2 emissions.”
In contrast, the WG3 report assessed “a large number of global modelled emissions pathways…of which 1,202 pathways were categorised based on their projected global warming over the 21st century, with categories ranging from pathways that limit warming to 1.5C with more than 50% likelihood with no or limited overshoot (C1) to pathways that exceed 4C (C8)”.
The table below, taken from the synthesis report, shows how these pathways relate to the SSPs and their predecessors, the Representative Concentration Pathways (RCPs).
Description and relationship of scenarios and modelled pathways considered across AR6 working group reports. Source: IPCC (2023) Box SPM.1, Table 1
The synthesis report is the final product of the IPCC’s sixth assessment cycle. Its delay from the planned publication in September last year for “management reasons” – and the lack of transparency surrounding these issues – resulted in “unusually blunt statements of discontent from governments” about the IPCC’s impact and credibility, the Earth Negotiations Bulletin reported at the time.
Nonetheless, governments agreed at a September meeting that the IPCC’s seventh assessment cycle (AR7) will begin in July this year and will have a length of between five and seven years. The end of AR6 and the start of AR7 will see the election of a new IPCC leadership team – including chair, vice-chairs and working group co-chairs. The first full assessment reports of AR7 would likely not be expected until 2027 or 2028.
The SPM says with high confidence that human activities have “unequivocally caused global warming”.
2. How is the Earth’s climate changing?
This statement – first made in the IPCC’s WG1 report – is the strongest wording to date about the role of human activities on observed warming from any IPCC assessment cycle.
Overall, the report says that global surface temperature in 2011-20 averaged at 1.09C above 1850-1900 levels – with a 1.59C rise seen over land and a 0.88C rise over the ocean. It adds, with high confidence, that “global surface temperature has increased faster since 1970 than in any other 50-year period over at least the last 2000 years”.
According to the Earth Negotiations Bulletin, delegates “disagreed on how much information to include” in the SPM sub-paragraph on global surface temperature increases. The bulletin outlines the lengthy discussion needed to finalise this section of the text – including decisions on whether to use the “more precise” 1.09C or the rounded 1.1C figure and warnings that the addition of extra sentences “overloaded the sub-paragraph with numbers and diluted the message”.
The SPM also discusses the observed changes and impacts of climate change to date. It makes the following statement with high confidence:
“Widespread and rapid changes in the atmosphere, ocean, cryosphere and biosphere have occurred. Human-caused climate change is already affecting many weather and climate extremes in every region across the globe. This has led to widespread adverse impacts and related losses and damages to nature and people.”
It says that global average sea levels increased by 0.2 metres between 1901 and 2018. Sea level rise accelerated over this time, from a rate of 1.3mm per year over 1901-71 to 2.7mm per year over 2006-18, it adds.
The SPM for the AR6 synthesis report is longer than its AR5 counterpart (pdf) and contains more numbers in its section on observed changes in the climate system.
For example, the AR5 report does not quantify the rate of acceleration of sea level rise, instead saying that “the rate of sea level rise since the mid-19th century has been larger than the mean rate during the previous two millennia (high confidence)”.
Meanwhile, the SPM says human influence has likely increased the chance of “compound” extreme events since the 1950s, including increases in the frequency of concurrent heatwaves and droughts.
The SPM has very high confidence that “increases in extreme heat events have resulted in human mortality and morbidity” in all regions. It adds that extreme temperatures also cause mental health challenges, trauma and the loss of livelihoods and culture. The report also has high confidence that climate change is “contributing to humanitarian crises where climate hazards interact with high vulnerability”.
India in 2022 faced a prolonged heatwave, with temperatures exceeding 42°C in numerous cities across the country. This came just weeks after India recorded its hottest March since the country’s meteorological department began its records over 120 years ago. This image, produced using data from the Copernicus Sentinel-3 mission, shows the land surface temperature across most of the nation. According to the India Meteorological Department, maximum air temperatures reached 43-46°C over most parts of Rajasthan, Vidarbha, Madhya Pradesh and East Uttar Pradesh; in many parts over Gujarat, interior Odisha; and in some parts of Madhya Maharashtra on 28 April. Forecasters warned that heatwave conditions are expected to continue until 2 May. Experts at the Indian Institute of Technology’s Water and Climate Lab stated that, in recent years, the number of Indian states hit by heatwaves has increased, as extreme temperatures become more frequent. Owing to the absence of cloud cover on 29 April (10:30 local time), the Sentinel-3 mission was able to obtain an accurate measurement of the land surface temperature of the ground, which exceeded 60°C in several areas. The data shows that surface temperature in Jaipur and Ahmedabad reached 47°C, while the hottest temperatures recorded are southeast and southwest of Ahmedabad (visible in deep red) with maximum land surface temperatures of around 65°C. The map was generated by using the mission’s Sea and Land Surface Temperature Radiometer instrument. While weather forecasts use predicted air temperatures, this satellite instrument measures the real amount of energy radiating from Earth. Therefore, the map shows the actual temperature of the land’s surface pictured here, which is usually significantly hotter than air temperatures. Sentinel-3 can monitor wildfires, map the way the land is used, provide indices of vegetation state, as well as measure the temperature, colour and height of the sea surface. For more information on the Copernicus Sentinel-3 mission, click here. By Contains modified Copernicus Sentinel data 2022, Attribution, https://commons.wikimedia.org/w/index.php?curid=117497147
Elsewhere, the report has high confidence that animal and human diseases including zoonoses – infections that pass between animals and people – “are emerging in new areas” and very high confidence that “the occurrence of climate-related food-borne and water-borne diseases has increased”.
The SPM warns that climate and weather extremes are “increasingly driving displacement in Africa, Asia, North America (high confidence), and Central and South America (medium confidence), with small island states in the Caribbean and South Pacific being disproportionately affected relative to their small population size(high confidence)”.
The authors write that hot extremes have intensified in cities and that they have high confidence that the observed adverse impacts are “concentrated amongst economically and socially marginalised urban residents”.
The report elaborates, saying it has high confidence that “urban infrastructure including transportation, water, sanitation and energy systems have been compromised by extreme and slow-onset events, with resulting economic losses, disruptions of services and impacts to well-being”.
The table below shows observed changes in the climate and their attribution to human influence. Darker colours indicate a higher confidence in the changes and their human influence. Notably, the table lists “warming of the global climate system since pre-industrial times” as a “fact”.
Observed changes in the climate and their attribution to human influence. Darker colours indicate a higher confidence in the findings. Source: IPCC (2023) Table 2.1
The report has high confidence that climate change has hindered efforts to meet the Sustainable Development Goals by reducing food security, changing rainfall patterns, melting bodies of ice such as glaciers and driving more intense and frequent extreme weather events.
For example, the report says that “increasing weather and climate extreme events have exposed millions of people to acute food insecurity and reduced water security”. (For more on how climate change is affecting extreme weather, see Carbon Brief’s coverage of the IPCC’s WG1 report.)
The report also says that “substantial damages, and increasingly irreversible losses” have already been sustained. For example, it has very high confidence that approximately half of the species assessed globally have shifted polewards or to higher elevations. It has medium confidence that impacts on some ecosystems are “approaching irreversibility” – for example the impacts of hydrological changes resulting from glacial retreat.
The report also has high confidence that “economic impacts attributable to climate change are increasingly affecting peoples’ livelihoods and are causing economic and societal impacts across national boundaries”.
3. How are human-caused emissions driving global warming?
The report states as fact – that is, with no calibrated language – that “human activities, principally through emissions of greenhouse gases, have unequivocally caused global warming”.
In other words, the report states, “human-caused climate change is a consequence of more than a century of net GHG emissions from energy use, land-use and land use change, lifestyle and patterns of consumption, and production”.
Specifically, the report explains that humans have contributed to 1.07C of the observed warming between 1850-1900 and 2010-19, with a likely range of 0.8-1.3C. As the total observed warming over the same period is 1.06C, this means that humans have caused 100% of the long-term global warming to date.
This conclusion is in line with the synthesis report (pdf) of the IPCC’s fifth assessment report (AR5), published in 2014, which said:
“The best estimate of the human-induced contribution to warming is similar to the observed warming over [1951-2010].“
That the influence of human activity is marginally larger than the observed temperature rise reflects the mix of impacts that an industrialised society is having. The warming impact of the GHGs that human activity has produced is likely to be in the range of 1.0-2.0C. But then there is also the cooling influence of other “human drivers (principally aerosols)”, the report notes.
Aerosols include tiny particles – such as soot – that are produced from cars, factories and power stations. They tend to have an overall cooling effect on the Earth’s climate by scattering incoming sunlight and stimulating clouds to form. These human drivers could have contributed to a cooling of 0.0-0.8C, the IPCC says.
The net cooling effect of human-caused aerosols “peaked in the late 20th century”, the report notes with high confidence.
Natural influences on the climate had only a small influence on the long-term trend in global temperature, the reports says, with fluctuations in the sun and volcanic activity causing between -0.1C and 0.1C of temperature change and other natural variability causing between -0.2C and 0.2C.
The increase in concentrations of GHGs in the atmosphere since around 1750 “are unequivocally caused by GHG emissions from human activities over this period”, the IPCC says:
“In 2019, atmospheric CO2 concentrations (410 parts per million) were higher than at any time in at least 2m years (high confidence), and concentrations of methane (1866 parts per billion) and nitrous oxide (332 parts per billion) were higher than at any time in at least 800,000 years (very high confidence).”
The figure below shows “the causal chain from emissions to resulting warming of the climate system”. The bottom panel shows the increase in GHGs over 1850-2019, the middle panel shows the resulting rise in atmospheric greenhouse gas emissions, the top left panel shows the change in global surface temperature since 1850 and the top right panel separates the warming out into its different contributing factors.
The causal chain from emissions to resulting warming of the climate system. Panel (a) shows the increase in GHGs over 1850-2019. Panel (b) shows the resulting rise in atmospheric greenhouse gas emissions. Panel (c) shows the change in global surface temperature since 1850. Panel (d) separates the warming out into its different contributing factors. Source: IPCC (2023) Figure 2.1
The report says with high confidence that “land and ocean sinks have taken up a near-constant proportion (globally about 56% per year) of CO2 emissions from human activities over the past six decades”. However, looking to the future, it adds:
“In scenarios with increasing CO2 emissions, the land and ocean carbon sinks are projected to be less effective at slowing the accumulation of CO2 in the atmosphere (high confidence).
“While natural land and ocean carbon sinks are projected to take up, in absolute terms, a progressively larger amount of CO2 under higher compared to lower CO2 emissions scenarios, they become less effective, that is, the proportion of emissions taken up by land and ocean decreases with increasing cumulative net CO2 emissions (high confidence).”
In 2019, global net emissions of GHGs clocked in at 59bn tonnes of CO2 equivalent (GtCO2e), the report says. This is 12% higher than in 2010 and 54% higher than in 1990, with “the largest share and growth in gross GHG emissions occurring in CO2 from fossil fuels combustion and industrial processes followed by methane”.
The report says, with high confidence, that GHG emissions since 2010 have increased “across all major sectors”. It continues:
“In 2019, approximately 34% (20GtCO2e) of net global GHG emissions came from the energy sector, 24% (14GtCO2e) from industry, 22% (13GtCO2e) from AFOLU, 15% (8.7GtCO2e) from transport and 6% (3.3GtCO2e) from buildings.”
However, although average annual GHG emissions between 2010 and 2019 were “higher than in any previous decade”, the rate of growth during this period (1.3% per year) “was lower than that between 2000 and 2009” (2.1% per year), the report notes. This sentence – which also featured in the WG3 report – was added during the approval session at the request of China, the Earth Negotiations Bulletin reported.
Historical contributions to global GHGs “vary substantially across regions” and “continue to differ widely”, the authors note.
In 2019, around 35% of the global population were in countries emitting more than nine tonnes of CO2e per capita – excluding CO2 emissions from land use, land-use change and forestry (LULUCF), the report says.
In contrast, 41% were in countries emitting less than three tonnes of CO2e. It adds that least developed countries (LDCs) and small island developing states (SIDS), in particular, have much lower per-capita emissions (1.7 and 4.6 tonnes of CO2e, respectively) than the global average (6.9 tonnes), excluding CO2 from LULUCF.
Perhaps most starkly, the authors note with high confidence:
“The 10% of households with the highest per-capita emissions contribute 34-45% of global consumption-based household GHG emissions, while the bottom 50% contribute 13-15%.”
The regional variations in emissions are illustrated by the figure below, which shows historical contributions (top-left), per capita emissions in 2019 (top-right) and global emissions since 1990 broken down by emissions (bottom). (For more on historical responsibility for emissions, see Carbon Brief’s analysis from 2021.)
During the approval session, France – supported by around 15 other countries, including the US and Canada – requested that this figure was elevated into the SPM “to provide a clear and necessary narrative about the causes of warming”, the Earth Negotiations Bulletin reported. However, Saudi Arabia, India and China opposed the move and a subsequent huddle was “unable to reach consensus”.
Regional contribution to global GHG emissions. Panel (a) shows the share of historical cumulative net anthropogenic CO2 emissions per region from 1850 to 2019 in GtCO2. Panel (b) shows the distribution of regional per-capita GHG emissions in tonnes CO2e by region in 2019. Both (a) and (b) are separated out by emissions category. Panel (c) shows global net human-caused GHG emissions by region (in GtCO2e per year) for 1990-2019. Percentage values refer to the contribution of each region to total GHG emissions in each respective time period. (The single-year peak of emissions in 1997 was due to a forest and peat fire event in south-east Asia.) Source: IPCC (2023) Figure 2.2
4. How much hotter will the world get this century?
The world will continue to get hotter “in the near term (2021-40)”, the report says, “in nearly all considered scenarios and pathways” for greenhouse gas emissions.
Crucially, however, there is a choice over how hot it gets by the end of the century. As the synthesis report explains: “Future warming will be driven by future emissions.”
The amount of warming this century largely depends on the amount of greenhouse gases that humans release into the atmosphere in the future “with cumulative net CO2 dominating”.
In order to stop global warming, the report says, CO2 emissions are, therefore, “require[d]” to reach net-zero. (See: What is needed to stop climate change?)
The report looks at a range of plausible futures, known as the shared socioeconomic pathways (SSPs), spanning very low to very high emissions. (See: What is this report?)
If emissions are very low (SSP1-1.9), then warming is expected to temporarily “overshoot” 1.5C by “no more than 0.1C” before returning to 1.4C in 2100, the report says.
If emissions are very high (SSP5-8.5), warming could reach 4.4C in 2100. (See below for more on what it would take for the world to follow these different emissions pathways.)
Notably, there is less uncertainty in these projections than there was in AR5. This is because the IPCC has narrowed the range of “climate sensitivity”, using observations of recorded warming to date and improved understanding of clouds.
The alternative emissions futures are shown in the figure below, which illustrates the 1.1C of warming to date and potential increases to 2100 in the style of the famous “climate stripes”.
The figure also illustrates the warming that would take place during the lifetimes of three representative generations born in 1950, 1980 and 2020.
Observed (1900-2020) and projected (2021-2100) warming relative to pre-industrial temperatures (1850-1900). Projections relate to very low emissions (SSP1-1.9), low emissions (SSP1-2.6), intermediate emissions (SSP2-4.5), high emissions (SSP3-7.0) and very high emissions (SSP5-8.5). Temperatures are colour-coded from the pre-industrial average (blue-grey) through to current warming of 1.1C (orange) and potentially more than 4C by 2100 (purple). Source: IPCC (2023) Figure SPM.1
While limiting warming in line with global targets would require “deep and rapid, and, in most cases, immediate greenhouse gas emissions reductions in all sectors this decade”, these efforts would not be felt for some time. The SPM explains with high confidence:
“Continued greenhouse gas emissions will lead to increasing warming…Deep, rapid and sustained reductions in greenhouse gas emissions would lead to a discernible slowdown in global warming within around two decades.”
This delay means that global temperatures are more likely than not to reach 1.5C during 2021-40, the report says, even if emissions are very low.
The report does not give specific “exceedance” years that breach 1.5C for each emissions pathway. (The 1.5C limit of the Paris Agreement relates to long-term averages, rather than warming in a single year.)
The SPM explains that for very low, low, intermediate and high emissions, “the midpoint of the first 20-year running average period during which [warming] reaches 1.5C lies in the first half of the 2030s”. If emissions are very high, it would be in “the late 2020s”.
Similarly, the report says warming will exceed 2C this century “unless deep reductions in CO2 and other GHG emissions occur in the coming decades”.
At the other end of the spectrum, it has “become less likely” that the world will match the very high emissions scenario (SSP5-8.5), where warming exceeds 4C this century.
The report says, with medium confidence, that emissions could only reach such high levels if there is “a reversal of current technology and/or mitigation policy trends”.
However, it says 4C of warming is possible with lower emissions, if carbon cycle feedbacks or climate sensitivity are larger than thought. It explains in a footnote to the SPM:
“Very high emissions scenarios have become less likely, but cannot be ruled out. Warming levels >4C may result from very high emissions scenarios, but can also occur from lower emission scenarios if climate sensitivity or carbon cycle feedbacks are higher than the best estimate.”
In addition to the path of greenhouse gas emissions, changing emissions of “short-lived climate forcers” (SLCFs) can also add to near- and long-term warming, the report says with high confidence. SLCFs include methane, aerosols and ozone precursors, it explains.
There have been concerns that efforts to cut greenhouse gas emissions could also reduce output of cooling aerosols, “unmasking” additional warming. The report plays down this risk:
“Simultaneous stringent climate change mitigation and air pollution control policies limit this additional warming and lead to strong benefits for air quality (high confidence).”
5. What are the potential impacts at different warming levels?
With every extra bit of global warming, extremes facing the world will become larger, the report says.
The Water Cycle. Credit: USGS
For example, it says with high confidence that continued climate change will further intensify the global water cycle, driving changes to monsoons and to very wet and very dry weather.
As temperatures rise, natural land and ocean carbon sinks will be less able to absorb emissions – worsening warming further, the report says with high confidence.
Other changes to expect include further reductions in “almost all” the world’s ice systems, from glaciers to sea ice (high confidence), further global sea level rise (virtually certain), and increasing acidity and decreasing oxygen availability in the oceans (virtually certain).
Every world region will experience more climate impacts with every bit of further warming, the report says.
Compound heatwave and drought extremes are expected to become more frequent in many regions, the report says with high confidence.
Nuisance flooding.
Extreme sea level events that currently occur once in every 100 years are expected to take place at least annually in more than half all measurable locations by 2100, under any future emissions scenario, it says with high confidence. (Extreme sea level events include storm surges and flooding.)
Other projected changes include the intensification of tropical storms (medium confidence) and increases in fire weather (high confidence), according to the report.
It says that the natural variability of the Earth’s climate will continue to act alongside climate change, sometimes worsening and sometimes masking its effects.
The graphic below, from the report’s SPM, illustrates some of the regional impacts of climate change at 1.5C, 2C, 3C and 4C of global warming. (Current policies from governments have the world on track for around 2.7C of warming.)
A selection of regional climate impacts at 1.5C, 2C, 3C and 4C of global warming. [The world is currently on track for 2.7C]. Source: IPCC (2023) Figure SPM.2
In the near term, every world region is expected to face further increases in climate hazards – with rising risk for humans and ecosystems (very high confidence), the report says.
Risks expected to increase in the near-term include heat-related deaths (high confidence), food-, water- and vector-borne diseases (high confidence), poor mental health (very high confidence), flooding in coastal and low-lying cities (high confidence) and a decrease in food production in some regions (high confidence).
At 1.5C, risks will increase for “health, livelihoods, food security, water supply, human security and economic growth”, the report says. At this level of global warming, many low-elevation and small glaciers around the world would lose most of their mass or disappear, the report says with high confidence. Coral reefs are expected to decline by a further 70–90%, it adds with high confidence.
At 2C, risks associated with extreme weather events will transition to “very high”, the report says with medium confidence. At this level of warming, changes in food availability and diet quality could increase nutrition-related diseases and undernourishment for up to “hundreds of millions of people”, particularly among low-income households in sub-Saharan Africa, south Asia and central America, the report says with high confidence.
At 3C, “risks in many sectors and regions reach high or very high levels, implying widespread systemic impacts”, the report says. The number of endemic species in biodiversity hotspots at a very high risk of extinction is expected to be 10 times higher than at 1.5C, it says with medium confidence.
At 4C and above, around half of tropical marine species could face local extinction, the report says with medium confidence. Around four billion people could face water scarcity, it says with medium confidence. It adds that the global area burned by wildfires could increase by 50-70% (medium confidence).
The graphic below, from the report’s SPM, illustrates the risks facing Earth’s species (a) and human health risk from extreme heat-humidity (b) under different levels of global warming.
It shows that, at temperatures above 2C, some regions will see all of their wildlife exposed to dangerous temperatures, assuming the species do not relocate to somewhere else.
It also shows that, above 2C, some people will live in regions where temperature and humidity conditions are deadly every day of the year.
Risks to species and humans at various levels of global warming. Source: IPCC (2023) SPM.3a and b
The risks identified in this report are larger at lower levels at warming, when compared to the IPCC’s last assessment in 2014.
This is because of new evidence from climate extremes already recorded, improved scientific understanding, new knowledge on how some humans and species are more vulnerable than others and a better grasp of the limits to adaptation, the report says with high confidence.
Because of “unavoidable” sea level rise, risks for coastal ecosystems, people and infrastructure will continue to increase beyond 2100, it adds with high confidence.
As climate change worsens, risks “will become increasingly complex and more difficult to manage”, the report says.
Climate change is likely to compound other societal issues, it says. For example, food shortages driven by warming are projected to interact with other factors, such as conflicts, pandemics and competition over land, the report says with high confidence.
Most pathways for how the world can meet its ambitious 1.5C temperature involve a period of “overshoot” where temperatures exceed this level of warming temporarily before dropping back down.
During this period of overshoot, the world would see “adverse impacts” that may worsen climate change, such as increased wildfires, mass mortality of ecosystems and permafrost thawing, the report says with medium confidence.
The report adds that solar geoengineering – methods for reflecting away sunlight to reduce temperature rise – has the “potential to offset warming within one or two decades and ameliorate some climate hazards”, but could also “introduce a widespread range of new risks to people and ecosystems” and “would not restore climate to a previous state”.
6. What are the risks of abrupt and irreversible change?
The report warns that continued emissions of GHGs will “further affect all major climate system components and many changes will be irreversible on centennial to millennial timescales”.
While “many changes in the climate system” will become larger “in direct relation to increasing global warming”, the likelihood of “abrupt and/or irreversible outcomes increases with higher global warming levels”, the report says with high confidence. For example, it says:
“As warming levels increase, so do the risks of species extinction or irreversible loss of biodiversity in ecosystems such as forests (medium confidence), coral reefs (very high confidence) and in Arctic regions (high confidence).”
The impacts of warming on some ecosystems are already “approaching irreversibility”, the report says, “such as the impacts of hydrological changes resulting from the retreat of glaciers, or the changes in some mountain (medium confidence) and Arctic ecosystems driven by permafrost thaw (high confidence)”.
Abrupt and irreversible changes can include those “triggered when tipping points are reached”, the report says:
“Risks associated with large-scale singular events or tipping points, such as ice sheet instability or ecosystem loss from tropical forests, transition to high risk between 1.5C-2.5C (medium confidence) and to very high risk between 2.5C-4C (low confidence).”
(See Carbon Brief’s explainer for more on tipping points.)
The report has high confidence that “the probability of low-likelihood outcomes associated with potentially very large impacts increases with higher global warming levels”. The impact of these abrupt changes would be dramatic.
Citing an example of the Atlantic Meridional Overturning Circulation (AMOC), a major system of currents in the Atlantic Ocean that brings warm water up to Europe from the tropics and beyond, the report says:
“[AMOC] is very likely to weaken over the 21st century for all considered scenarios (high confidence), however an abrupt collapse is not expected before 2100 (medium confidence). If such a low probability event were to occur, it would very likely cause abrupt shifts in regional weather patterns and water cycle, such as a southward shift in the tropical rain belt, and large impacts on ecosystems and human activities.”
For comparison, the AR5 synthesis report also concluded that a weakening of AMOC was very likely, but said that an abrupt transition or collapse in the 21st century was very unlikely.
The report notes that “low-likelihood, high-impact outcomes could occur at regional scales even for global warming within the very likely assessed range for a given GHG emissions scenario”.
The report has a particularly stark assessment on the projected impacts of global warming on the ocean. The authors warn, with high confidence, that sea level rise is “unavoidable for centuries to millennia due to continuing deep ocean warming and ice sheet melt”. And levels will “remain elevated for thousands of years”.
While the authors are virtually certain that sea level rise will continue through this century, “the magnitude, the rate, the timing of threshold exceedances, and the long-term commitment of sea level rise depend on emissions, with higher emissions leading to greater and faster rates of sea level rise”.
Over the next 2,000 years, global average sea level “will rise by about 2-3 metres if warming is limited to 1.5C and 2-6 m if limited to 2C”, the report says, with low confidence.
Warming beyond 2C could put the Earth’s massive ice sheets at risk, the report says:
“At sustained warming levels between 2C and 3C, the Greenland and West Antarctic ice sheets will be lost almost completely and irreversibly over multiple millennia (limited evidence).”
These projections of sea level rise across thousands of years are “consistent with reconstructed levels during past warm climate periods”, the report notes.
For example, it says with medium confidence, “global mean sea level was very likely 5-25 metres higher than today roughly 3m years ago, when global temperatures were 2.5-4C higher than 1850-1900”.
In addition to rising sea levels, the authors say it is virtually certain that ocean acidification – where seawater becomes less alkaline – will continue throughout this century. And they have high confidence that deoxygenation – the decline in oxygen levels in the ocean – will too.
The report also cautions that the amount of warming – and the impact it would have – could be more severe than projected.
For example, it says, “warming substantially above the assessed very likely range for a given scenario cannot be ruled out, and there is high confidence this would lead to regional changes greater than assessed in many aspects of the climate system”.
On sea levels, the authors add:
“Global mean sea level rise above the likely range – approaching two metres by 2100 and in excess of 15 metres by 2300 under a very high GHG emissions scenario (SSP5-8.5) (low confidence) – cannot be ruled out due to deep uncertainty in ice-sheet processes and would have severe impacts on populations in low elevation coastal zones.”
7. What does the report say on loss and damage?
For the first time ever, the term “loss and damage” is mentioned in an IPCC synthesis report. This reflects its prominence in the 1.5C special report and WG2 report during the sixth assessment cycle.
It acknowledges that there has been an “improved understanding” of what constitutes economic and non-economic losses and damages. In turn, this has served to inform climate policy as well as highlight governance, financial and institutional gaps in how it is being addressed.
The AR6 synthesis report mentions the formal recognition of “loss and damage”. Source: IPCC (2023) Full report p18
After this single mention, the report discusses “losses and damages” more broadly. These, it defines in a footnote in the SPM, are the “adverse observed impacts and/or projected risks and can be economic and/or non-economic”.
Including loss and damage in the IPCC’s assessments has been a fraught process. The use of two separate terms separates the scientific “losses and damages” from the political debate of “loss and damage” under the UNFCCC, even as impacted countries hope to connect the two.
In the plenary discussions, Grenada – supported by Senegal, Antigua and Barbuda, Timor Leste, Kenya and Tanzania – wanted vulnerable countries to be referenced and the differences between the two terms explicitly clarified, given that “the distinction is often confusing to people outside of the IPCC”. The US, meanwhile, supported putting a definition in the footnote.
On the impacts of climate change, the report recognises and reviews “strengthened” evidence of heatwaves, extreme rainfall, droughts and tropical cyclones, plus their attribution to human influence, since the last synthesis report.
In all regions, extreme heat events have resulted in human mortality and morbidity, it says with very high confidence, while climate-related food-borne and water-borne diseases have increased. Climate change is also contributing to humanitarian crises “where climate hazards interact with high vulnerability”, the report states with high confidence.
Climate change has caused “substantial damages, and increasingly irreversible losses” in land-based, freshwater, coastal, ocean and open ecosystems, as well as in glaciers and continental ice sheets, the report’s summary says with high confidence.
The A2 headline statement from the SPM that authors “spent hours crafting” to reflect vulnerability and impacts on human and natural systems. IPCC (2023) SPM p5
The widespread “losses and damages to nature and people” are unequally distributed across systems, regions and sectors”, says the report’s summary, pointing to both economic and non-economic losses.
Sectors such as agriculture, forestry, fishery, energy, and tourism that are “climate exposed” have experienced economic damages from climate change, the report states with high confidence.
Across the world, non-economic loss and damage impacts, such as mental health challenges, were associated with trauma from extreme weather events and loss of livelihoods and culture. (According to the Earth Negotiations Bulletin, India requested that mental health not be included in these impacts, which Finland opposed.)
The report says with high confidence that “vulnerable communities who have historically contributed the least to current climate change are disproportionately affected”.
For example, fatalities from floods, droughts and storms were 15 times higher in highly vulnerable regions between 2010 to 2020, compared to regions with very low vulnerability, it states with high confidence.
In urban areas, losses and damages are “concentrated” in communities of economically and socially marginalised residents, the report notes.
The figure below shows observed impacts on human systems and ecosystems attributed to climate change at global and regional levels, along with confidence in their attribution to climate change.
Observed and widespread impacts and related losses and damages attributed to climate change. Mental health and displacement impacts are limited to only regions assessed. Confidence levels reflect attribution studies so far. Source: IPCC (2023), Figure SPM1a
The report states with very high confidence that “losses and damages escalate with every increment of global warming”.
These will be higher at 1.5C and even higher at 2C, the report’s summary states. Compared to AR5, “global aggregated risk levels” will be high to very high even at lower warming levels, owing to an improved understanding of exposure, vulnerability and recent evidence, including “limits to adaptation”. Climatic and non-climatic risks will increasingly interact, leading to “compound and cascading risks” that are difficult to manage.
However, near-term climate actions that rein in global warming to “close to 1.5C” could “substantially reduce” losses and damages to humans and ecosystems. Still, even these actions “cannot eliminate them all”, the report notes.
Overall, the magnitude and rate of future losses and damages “depend strongly” on near-term mitigation and adaptation actions, the report says with very high confidence.
Delaying mitigation will only increase warming, which could derail the effectiveness of adaptation options, it says with high confidence, leading to more climate risks and related losses and damages.
However, the report and its summary warn with high confidence that “adaptation does not prevent all losses and damages”. The authors point out with high confidence that some ecosystems, sectors and regions have already hit limits to how much they can adapt to climate impacts. In some cases, adaptive actions are unfeasible – that is, they have “hard limits” – for certain natural systems or are simply not an option because of socioeconomic or technological barriers – known as “soft limits” – leading to unavoidable loss and damage impacts.
“One of the new messages in this report is that it effectively busts the myth of endless adaptation,” said report author Dr Aditi Mukherji, director at the Consultative Group on International Agricultural Research (CGIAR), speaking at a press conference.
8. Why is climate action currently ‘falling short’?
Current pledges for how countries will cut emissions by 2030 make it likely that global warming will exceed 1.5C this century and will make it harder to limit temperatures to 2C, according to one of the headline findings of the report.
The establishment of the Paris Agreement – the landmark climate deal reached in 2015 – has led to more target-setting and “enhanced transparency” for climate action, the report says with medium confidence.
At the same time, there has been “rising public awareness” about climate change and an “increasing diversity” of people taking action. These efforts “have overall helped accelerate political commitment and global efforts to address climate change”, the report says, adding:
“In some instances, public discourses of media and organised counter movements have impeded climate action, exacerbating helplessness and disinformation and fuelling polarisation, with negative implications for climate action (medium confidence).”
It says with high confidence that many rules and economic tools for tackling emissions have been “deployed successfully” – leading to enhanced energy efficiency, less deforestation and more low-carbon technologies in many countries. This has in some cases lowered emissions.
By 2020, laws for reducing emissions were in place in 56 countries – covering 53% of global emissions, the report says.
At least 18 countries have seen their production and consumption emissions fall for at least 10 years, it adds. But these reductions have “only partly offset” global emissions increases.
The report adds that there are several options for tackling climate change that are “technically viable”, “increasingly cost effective” and are “generally supported by the public”.
It adds that, over 2010-19, there have been large decreases in the unit costs of solar power (85%), wind (55%) and lithium ion batteries (85%). In many regions, electricity from solar and wind is now cheaper than that derived from fossil fuels, the report says.
Solar installation in the San Luis Valley. Photo credit: Western Resource Advocates
(According to the Earth Negotiations Bulletin, a group of countries including Germany, Denmark and Norway strongly argued for the report to highlight that renewables are now cheaper than fossil fuels in many regions. Finland suggested adding that fossil fuels are the “root cause” of climate change, but this was strongly opposed by Saudi Arabia.)
At the same time, there have been “large increases in their deployment”, including a global average of 10 times for solar and 100 times for electric cars, the report says.
Falling costs and increased deployment have been boosted by public research and funding and demand-side policies such as subsidies, it says, adding:
“Maintaining emission-intensive systems may, in some regions and sectors, be more expensive than transitioning to low-emission systems (high confidence).”
(According to the Earth Negotiations Bulletin, India, supported by Brazil, said the sentence “favoured developed countries as it did not reference feasibility and challenges”.)
Despite this, a “substantial emissions gap” remains between what global GHG emissions are projected to be in 2030 and what they must be if the world is to limit global warming to 1.5C or 2C, the report says with high confidence. (The 2030 projections are derived from country climate pledges made prior to COP26 in 2021.)
This gap would “make it likely that warming will exceed 1.5C during the 21st century”, the report says with high confidence.
Pathways for how the world can limit global warming to 1.5C or 2C depend on deep global emissions cuts this decade, it adds with high confidence.
The report says with medium confidence that country climate plans ahead of COP26 would lead to around 2.8C of warming (range from 2.1-3.4C) by 2100.
However, it adds with high confidence that policies put in place by countries by the end of 2020 would not be sufficient to achieve these climate plans. This represents an “implementation gap”.
When just policies put in place by the end of 2020 are considered, around 3.2C of warming (range 2.2-3.5C) is projected by 2100, the report says with medium confidence.
The chart below, from the SPM, illustrates the warming expected in 2100 from policies implemented by 2020 (red), as well as what emissions cuts would need to look like to reach 1.5C (blue) or 2C (green).
Expected warming in 2100 from policies implemented by the end of 2020 (red), compared with emissions cuts needed to limit warming to 1.5C (blue) or 2C (green). Source: IPCC (2023) SPM.5
“Additional implemented policies since the cut-off date would lead to those curves drawing down a little bit, compared to where they are. But everything that has happened since the IPCC cut-off – which is outside the scope of this synthesis report – would suggest that we’re still some way off.”
(A November 2022 assessment from the independent research group Climate Action Tracker found that country climate plans for 2030 in place by that time would cause 2.4C (range 1.9-2.9C) of warming. Policies in place by that time would cause 2.7C (range 2.2-3.4C), it added.)
The report also notes that many countries have signalled intentions to achieve net-zero greenhouse gas or CO2 emissions by 2050. However, it says such pledges differ “in terms of scope and specificity, and limited policies are to date in place to deliver on them”.
In most developing countries, the rollout of low-carbon technologies is lagging behind, the report adds. This is due in part to a lack of finance and technology transfer from developed countries, it says with medium confidence.
The leveraging of climate finance for developing countries has slowed since 2018, the report says with high confidence. It adds:
“Public and private finance flows for fossil fuels are still greater than those for climate adaptation and mitigation (high confidence).”
9. What is needed to stop climate change?
“There is a brief and rapidly closing window of opportunity to secure a liveable and sustainable future for all,” the report says with high confidence.
The synthesis delivers a blunt message on what will be needed to stop climate change, saying “limiting human-caused warming requires net-zero CO2 emissions”.
(The Earth Negotiations Bulletin says there was debate over this opening sentence in section B5 of the SPM. It reports: “The authors said that a fundamental insight of AR6 is that, to hold warming at any level, net-zero [CO2] emissions are required at some point.)
The report goes on to say, with high confidence, that reaching net-zero greenhouse gas emissions would imply net-negative CO2 – and would “result in a gradual decline in surface temperatures”.
Reaching net-zero emissions requires “rapid and deep and, in most cases, immediate greenhouse gas emissions reductions in all sectors this decade”, according to the report.
Repeating language from the underlying WG3 report, it adds that global GHG emissions must peak “between 2020 and at the latest before 2025” to keep warming below 1.5C or 2C.
In contrast with the direct wording on net-zero, the report barely mentions coal, oil and gas.
A coal train moves in front of the Black Thunder mine outside Wright in October, 2016. (Andrew Graham/WyoFile)
However, it does say net-zero would mean a “substantial reduction in overall fossil fuel use”.
Staying below 1.5C or 2C depends on cumulative carbon emissions at the time of reaching net-zero CO2 and the level of greenhouse gas emissions cuts this decade, the report says.
Specifically, net-zero CO2 needs to be reached “in the early 2050s” to stay below 1.5C:
“Pathways that limit warming to 1.5C (>50%) with no or limited overshoot reach net-zero CO2 in the early 2050s, followed by net-negative CO2 emissions. Those pathways that reach net-zero GHG emissions do so around the 2070s. Pathways that limit warming to 2C (>67%) reach net-zero CO2 emissions in the early 2070s.”
(There was some confusion on this point after a speech by UN secretary-general António Guterres launching the IPCC report. Guterres called for global net-zero emissions by 2050, with developed countries going faster, but did not say if he was referring to CO2 or GHGs.)
There is a direct link between cumulative carbon emissions and warming, with the report saying that every 1,000GtCO2 raises temperatures by 0.45C. The report says with high confidence:
“From a physical science perspective, limiting human-caused global warming to a specific level requires limiting cumulative CO2 emissions, reaching at least net-zero CO2 emissions, along with strong reductions in other greenhouse gas emissions.”
This results in “carbon budgets” that must not be exceeded if the world is to limit warming to a given level. As of the start of 2020, the remaining budget to give a 50% chance of staying below 1.5C is 500GtCO2, rising to 1,150GtCO2 for a 67% chance of staying below 2C.
(Stronger reductions of non-CO2 emissions would mean a larger carbon budget for a given temperature limit, the report notes, and vice versa.)
Some four-fifths of the total budget for 1.5C has already been used up during 1850-2019 and the last fifth would be “almost exhaust[ed]” by 2030, if emissions remained at 2019 levels.
In order to stay within the budget for 1.5C, global greenhouse gas emissions would need to fall to 43% below 2019 levels by 2030 and to 60% below by 2035, falling 84% by 2050.
Even faster reductions are required for CO2 emissions, which would fall to 48% below 2019 levels by 2030, 65% by 2035 and 99% by 2050, when they would effectively hit net-zero.
The synthesis report lists these numbers in a new table, below. While the information is not new, it had not previously been presented in an accessible format. It was added during the week-long approval process and is labelled “Table XX”.
Central (median) CO2 and GHG reductions in 2030, 2035, 2040 and 2050, relative to 2019 levels, in 97 “C1” scenarios that have a greater than 50% chance of limiting warming to 1.5C with no or limited overshoot, and in 311 “C3” scenarios that have a 67% chance of limiting warming to 2C. Numbers in square brackets indicate 5th to 95th percentile ranges across the scenarios. Note that most of these scenarios are designed to cut emissions globally at “least-cost”, meaning they “do not make explicit assumptions about global equity, environmental justice or intraregional income distribution”. Source: IPCC (2023) Table XX.
At a briefing for journalists held by the UK Science Media Centre, Dr Chris Jones, synthesis report author and research fellow at the UK’s Met Office, said: “We hope, obviously, this information is useful for the stocktake process.”
(This refers to the “global stocktake” of progress to date and the efforts needed to meet international climate goals, which is taking place this year as part of the UN climate process.)
The report outlines how the world could reach net-zero CO2 emissions via a “substantial reduction in overall fossil fuel use, minimal use of unabated fossil fuels, and use of carbon capture and storage (CCS) in the remaining fossil fuel systems”.
(The phrase “unabated fossil fuels” is defined in a footnote to the report, by comparison with “abatement”, which it says would mean “capturing 90% or more CO2 from power plants, or 50–80% of fugitive methane emissions from energy supply”.)
While the world needs to make “deep and rapid” cuts in gross emissions, the use of CO2 removal (CDR) is also “unavoidable” to reach net-zero, the report says with high confidence.
The report explains:
“[P]athways reaching net-zero CO2 and GHG emissions include transitioning from fossil fuels without carbon capture and storage (CCS) to very low- or zero-carbon energy sources, such as renewables or fossil fuels with CCS, demand-side measures and improving efficiency, reducing non-CO2 GHG emissions, and CDR.”
CDR will be needed to “counterbalance” hard-to-abate residual emissions in some sectors, for example “some emissions from agriculture, aviation, shipping and industrial processes”.
Emphasising the challenge of limiting warming, the report says the fossil fuel infrastructure that has already been built would be enough to breach the 1.5C carbon budget, if operated in line with historical patterns and in the absence of extra abatement.
This is shown in the figure below. The top panel shows historical emissions and the remaining budgets for 1.5C or 2C, as well as emissions this decade if they remain at 2019 levels and the emissions of existing and planned fossil fuel infrastructure.
The lower panel shows historical warming and potential increases by 2050, in relation to the carbon budgets and the range of possible emissions over the same period.
Cumulative past, projected and “committed” CO2 emissions from existing and planned fossil fuel infrastructure, GtCO2, and associated global warming. Source: IPCC (2023) Figure 3.5.
Delaying emissions cuts risks “lock-in [of] high-emissions infrastructure”, the report states, adding with high confidence that this would “raise risks of stranded assets and cost-escalation, reduce feasibility, and increase losses and damages”.
The report notes that only “a small number of the most ambitious global modelled pathways” avoid temporary overshoot of the 1.5C target. However, warming “could gradually be reduced again by achieving and sustaining net-negative global CO2 emissions”.
On the other hand, the IPCC warns of “additional risks” as a result of overshoot, defined as exceeding a warming level and returning below it later. It states with high confidence:
“Overshoot entails adverse impacts, some irreversible, and additional risks for human and natural systems, all growing with the magnitude and duration of overshoot.”
The report adds that some of these impacts could make it harder to return warming to lower levels, stating with medium confidence:
“Adverse impacts that occur during this period of overshoot and cause additional warming via feedback mechanisms, such as increased wildfires, mass mortality of trees, drying of peatlands, and permafrost thawing, weakening natural land carbon sinks and increasing releases of GHGs would make the return more challenging.”
It says the risks around overshoot, as well as the “feasibility and sustainability concerns” for CDR, can be minimised by faster action to cut emissions. Similarly, development pathways that use resources more efficiently also minimise dependence on CDR.
10. How can individual sectors scale up climate action?
In order to limit warming to 2C or below by the end of the century, all sectors must undergo “rapid and deep, and in most cases, immediate greenhouse gas emissions reductions”, the report says.
Limiting warming to 1.5C with “no or limited overshoot” requires achieving net-zero CO2 emissions in the early 2050s. To keep warming to 2C, net-zero CO2 must be achieved “around the early 2070s”.
It continues, with medium confidence:
Source: IPCC (2023) Full report, p68
Reducing emissions from the energy sector requires a combination of actions, the report says: a “substantial reduction” in the use of fossil fuels; increased deployment of energy sources with zero or low emissions, “such as renewables or fossil fuels with CO2 capture and storage” (CCS); improving energy efficiency and conservation; and “switching to alternative energy carriers”.
For sectors that are harder to decarbonise, such as shipping, aviation, industrial processes and some agriculture-related emissions, the report notes that using carbon dioxide removal (CDR) technologies to counterbalance these residual emissions “is unavoidable”.
Graphic credit: The Nature Conservancy
The language around CCS and CDR was some of the most contentious during the approval session. According to the Earth Negotiations Bulletin, Germany “suggested including a brief overview of the feasibility and current deployment of different CDR methods”, with France adding that policymakers must be made aware of the associated challenges.
But Saudi Arabia countered that if these barriers were made explicit in this section, it “would require similar balancing language on the feasibility of solar and renewables elsewhere in the report”.
Similar discussions were had around CCS, with the authors ultimately agreeing to add a sub-paragraph in a footnote that details both the limits and benefits of CCS, at the urging of Germany and Saudi Arabia, respectively.
The report discusses several technologies across a range of maturity, removal and storage potential and costs. It finds that “all assessed modelled pathways that limit warming to 2C (>67%) or lower by 2100” rely, at least in part, on mitigation from agriculture, forestry and other land use (AFOLU). Such approaches are currently “the only widely practised CDR methods”, the report notes.
However, it details trade-offs and barriers to large-scale implementation of AFOLU-based mitigation, including climate change impacts, competing demands for land use, endangering food security and violation of Indigenous rights.
The report also discusses sector-specific actions that can be taken in order to limit emissions and climate impacts. These transformations, it says, are “required for high levels of human health and well-being, economic and social resilience, ecosystem health and planetary health”.
The chart below shows near-term feasibility of adaptation (left) and mitigation (right) options, divided across six sectors (top left to bottom right): energy supply; land, water and food; settlements and infrastructure; health; society, livelihood and economy; and industry and waste.
For adaptation options, the figure shows the potential for synergies with mitigation strategies and the feasibility of these options up to 1.5C of warming, from low (light purple) to high (dark blue). The dots in each box represent the confidence level, from low (one dot) to high (three dots).
On the right, mitigation options are presented with their potential contribution to emissions reductions by 2030, in GtCO2e per year. The colours indicate the cost of each option, from low (yellow) to high (red), with blue indicating options that are cheaper than fossil fuels. Some of the mitigation options with the highest potential for cost-saving are solar and wind power, efficient vehicles, lighting and other equipment, and public transit and cycling.
Feasibility of climate adaptation options and their synergies with mitigation actions (left) and potential contributions of mitigation options to emissions reductions by the end of the decade (right). Source: IPCC (2023) Figure 4.4a
Some of these mitigation options relate to changes in energy demand, rather than supply. This includes “changes in infrastructure use, end-use technology adoption and socio-cultural and behavioural change”, the report says, noting that such changes can reduce emissions in end-use sectors by 40-70% by mid-century.
The chart below shows the mid-century mitigation potential of demand-side changes across a range of sectors: food (including diet and waste), land transport, buildings, industry and electricity. The green arrows represent the mitigation potential in GtCO2 per year.
The mitigation potential, in GtCO2e per year, of five demand-side sectors (top to bottom): food, land transport, buildings, industry and electricity. The grey bar shows the additional emissions that continued electrification will add. Source: IPCC (2023) Figure 4.4b
Section 4.5 of the report goes into detail about near-term mitigation and adaptation, in subsections covering energy systems; industry; cities, settlements and infrastructure; land, ocean, food and water; health and nutrition; and society, livelihoods and economies. At the urging of India (supported by Saudi Arabia and China) in the approval session, the report notes that the availability and feasibility of these options differs “across systems and regions”.
On energy systems, the report says with high confidence that “major energy system transitions” are required and with very high confidence that adaptation “can help reduce climate-related risks to the energy system”, including extreme events that can damage or otherwise affect energy infrastructure.
It notes that many of the options for large-scale emissions reductions are “technically viable and supported by the public”. It adds:
“Maintaining emission-intensive systems may, in some regions and sectors, be more expensive than transitioning to low emission systems.”
However, adaptation measures for certain types of power generation, such as hydropower, have “decreasing effectiveness at higher levels of warming” beyond 1.5C or 2C, the report notes. Reducing vulnerabilities in the energy sector requires diversification and changes on the demand side, including improving energy efficiency.
The strategies to reduce industrial emissions “differ by type of industry”, the report says. Light manufacturing can be “largely decarbonised” through available technologies and electrification, while decarbonising others will require the use of carbon capture and storage and the development of new technologies. The report adds that extreme events will cause “supply and operational disruptions” across many industries.
“Effective mitigation” strategies can be implemented at every step of building design, construction and use, the report says. It notes that demand-side measures can help reduce transportation-related emissions, as can re-allocating street space for pedestrians and cyclists and enabling telework.
With high confidence, it says:
“Key infrastructure systems including sanitation, water, health, transport, communications and energy will be increasingly vulnerable if design standards do not account for changing climate conditions.”
The report also says that “green” and “blue” infrastructure have myriad benefits: climate change mitigation, reducing extreme weather risk and improving human health and livelihoods.
AFOLU, as well as the ocean, offer “substantial mitigation and adaptation potential…that could be upscaled in the near term across most regions”, the report finds. It notes that conservation and restoration of ecosystems provide “the largest share” of this potential. It reads:
Source: IPCC (2023) Full report, p73
Such actions must be taken with the cooperation and involvement of local communities and Indigenous peoples, the report adds.
With very high confidence, the report states that “mainstream[ing]” health considerations into policies will benefit human health. There is also high confidence in the existing availability of “effective adaptation options” in the health sector, such as improving access to drinking water and vaccine development. The report states with high confidence:
“A key pathway to climate resilience in the health sector is universal access to healthcare.”
The report calls for improving climate education, writing with high confidence:
“Climate literacy and information provided through climate services and community approaches, including those that are informed by Indigenous knowledge and local knowledge, can accelerate behavioural changes and planning.”
It says that many types of adaptation options “have broad applicability across sectors and provide greater risk reduction benefits when combined”. It also calls for “accelerating commitment and follow-through” from private sector actors.
11. What does the report say about adaptation?
The world is not adapting fast enough to climate change – and limits to adaptation have already been reached in some regions and ecosystems, the report says.
It says with very high confidence that there has been progress with adaptation planning and roll-out in all sectors and regions – and that accelerated adaptation will bring benefits for human wellbeing.
Adaptation to water-related risks make up more than 60% of all documented adaptation practices, the report says with high confidence.
Examples of effective adaptation have occurred in food production, such as through planting trees on cropland, diversification in agriculture and water management and storages, the report says with high confidence.
“Ecosystem-based approaches”, such as urban greening and restoring wetlands and forests, have been effective in “reducing flood risks and urban heat”, it adds with high confidence.
In addition, combinations of “non-structural measures”, such as early warning systems, and structural measures such as levees have reduced deaths from flooding, the report says with medium confidence.
But, despite progress, most adaptation is “fragmented, incremental, sector-specific and unequally-distributed across regions”, the report says, adding:
“Adaptation gaps exist across sectors and regions, and will continue to grow under current levels of implementation, with the largest adaptation gaps among lower income groups.”
Key barriers to adaptation include a lack of financial resources, political commitment and a “low sense of urgency”, the report says.
The total amount spent on adaptation has increased since 2014. However, there is currently a widening gap between the costs of adaptation and the amount of money set aside for adaptation, according to the report.
It says with very high confidence that the “overwhelming majority” of climate finance goes towards mitigation rather than adaptation. (See: Why is finance an ‘enabler’ and ‘barrier’ for climate action?)
It adds with medium confidence that financial losses caused by climate change can reduce funds available for adaptation – hence, leaving countries more vulnerable to future impacts. This is particularly true for developing and least-developed countries.
The report says with medium confidence that some people are already experiencing “soft limits” to adaptation. “Soft limits” are those where there is currently no way to adapt to the change, but there may be a way in the future. This includes small-scale farmers and households living in low-lying coastal areas.
Some areas have reached “hard limits” to adaptation, where no further adaptation to climate change is possible, the report says with high confidence. This includes some rainforests, tropical coral reefs, coastal wetlands, and polar and mountain ecosystems.
In the future, “adaptation options that are feasible and effective today will become constrained and less effective with increasing global warming”, the report says. It adds:
“With increasing global warming, losses and damages will increase and additional human and natural systems will reach adaptation limits.”
For example, the effectiveness of reducing climate risks by switching crop varieties or planting patterns – commonplace on farms today – is projected to decrease above 1.5C of warming, the report says with high confidence. The effectiveness of on-farm irrigation is projected to decline above 3C, it adds.
Above 1.5C of warming, small island populations and regions dependent on glaciers for freshwater could face hard adaptation limits, the report says with medium confidence.
At this level of warming, ecosystems such as coral reefs, rainforests and polar and mountain ecosystems will have surpassed hard adaptation limits – meaning some ecosystem-based approaches will become ineffective, the report says with high confidence.
By 2C, soft limits are projected for multiple staple crops, particularly in tropical regions, it says with high confidence. By 3C, hard limits are projected for water management in parts of Europe, it says with medium confidence.
Even before limits to adaptation are reached, adaptation cannot prevent all loss and damage from climate change, the report says with high confidence. (See: What does the report say on loss and damage?)
(According to the Earth Negotiations Bulletin, China requested removing a reference to “adaptation limits” from one of the headline statements of the SPM. It was opposed by countries including the UK, Denmark, Germany, Saint Kitts and Nevis, the Netherlands, Switzerland, Mexico and Belize.)
The report says with high confidence that sea level rise poses a “distinct and severe adaptation challenge”. This is because it requires dealing with both slow onset changes and increases in extreme sea level events such as storm surges and flooding.
The graphic below illustrates some of the adaptation responses to sea level rise, including the time it takes for implementation and their typical intended lifetimes.
“Ecosystem-based” approaches include enhancing coastal wetlands. Such approaches come with co-benefits for biodiversity and reducing emissions, but start to become ineffective above 1.5C of warming, the report says with medium confidence.
“Sediment-based” approaches include seawalls. These can be ineffective “as they effectively reduce impacts in the short-term but can also result in lock-ins and increase exposure to climate risks in the long-term”, the report says.
Planned relocation methods can be more effective if they are aligned with sociocultural values and involve local communities, the report says.
The report warns with high confidence that there is now more evidence of “maladaptation” – actions intended to adapt to climate change that create more risk and vulnerability.
Examples of maladaptation include new urban buildings that cannot easily be adjusted for climate risks or high-cost irrigation systems for agriculture in areas where droughts are projected to intensify, the report says.
Maladaptation “especially affects” marginalised and vulnerable groups, including Indigenous peoples, ethnic minorities, low-income households and people living in informal settlements. This can “reinforce and entrench” existing inequalities.
12. What are the benefits of near-term climate action?
The report is clear that fast action to mitigate emissions and adapt to climate impacts has a range of benefits – but acknowledges that it will likely be disruptive and have high up-front costs.
The rate of climate change and the associated risks “depend strongly” on near-term climate action, the report says. The SPM notes with high confidence:
“The choices and actions implemented in this decade will have impacts now and for thousands of years.”
The overarching benefit of near-term mitigation action is less global warming over time and thereby fewer negative impacts, such as extreme weather events.
Accelerated mitigation measures would also reduce future adaptation costs alongside other benefits, such as reducing the risk of irreversible climate changes, the synthesis report says.
A quick reduction in methane emissions, in particular, can limit near-term warming, the report says with high confidence. Methane has a much shorter lifespan in the atmosphere than CO2.
Delaying actions to prevent further warming will lead to a larger temperature rise, which will, in turn, make adaptation measures less effective, it says.
Adaptation actions can take a long time to be put in place. The report stresses that long-term planning and faster implementation, especially in this decade, “is important to close adaptation gaps”.
Adaptation measures, the report adds, can improve agricultural productivity, innovation, health and wellbeing, food security, livelihood and biodiversity conservation.
Text on mitigation co-benefits for sustainable development Source: IPCC (2023) Full report, p59
There are other co-benefits to cutting emissions and taking faster action on adaptation. The SPM says that “deep, rapid and sustained” action in this decade would lower air pollution, spark more walking and cycling and prompt more sustainable, healthy diets.
The money saved from a health perspective as a result of improved air quality “can be of the same order of magnitude as mitigation costs, and potentially even larger”, the report adds.
There are further economic benefits to near-term climate action, but the SPM says the cost-benefit analysis “remains limited” in assessing all avoided damages.
Outside of the benefits of avoiding possible damages, the economic and social benefits of limiting global warming to 2C exceeds mitigation costs in most literature, the SPM says with medium confidence.
The SPM says that faster mitigation with emissions peaking earlier increases the co-benefits of action and reduces risks and costs in the long-term.
It further says, with high confidence, that near-term actions require “high up-front investments and potentially disruptive changes”.
Barriers to deploy mitigation and adaptation actions need to be removed or reduced to utilise these options at scale, the report says.
To scale up these actions, the report says that both low- and high-cost options, such as using more renewables, making buildings more efficient and using electric vehicles, are required to avoid future lock-ins, advance innovation and start transformational changes.
Leaf charging at the Lionshead parking facility in Vail September 30, 2021.
The impacts of these changes can be “moderated” by reforms and policies in order to accelerate climate action such as improving access to finance for low-emissions infrastructure and technologies, especially in developing countries.
Delaying action comes with multiple challenges, the report says, such as cost escalation risks, lock-in of infrastructure and stranded assets.
In other words, continuing to install unabated fossil fuel infrastructure will “lock-in” emissions into the future. And taking action on fossil-fuel burning sooner rather than later would limit the size of stranded assets – such as fossil-fuel infrastructure – that will be worth a lot less money in future in a world more reliant on low-carbon energy.
Delaying action on this would increase policy risks and may endanger efforts to limit global warming, the report says with high confidence.
Climate action is enabled by good climate governance providing an overall direction, the report says.
This involves setting targets, including climate action in different policy areas, prioritising equitable decision-making and enhancing access to finance. The report adds that climate action benefits from drawing on a diverse range of knowledge.
13. Why is finance an ‘enabler’ and ‘barrier’ for climate action?
Finance is one of the “critical enablers” to speed up climate action, the synthesis report outlines, and lack of funding is a barrier to progress.
Difficulty accessing climate finance slows down both mitigation and adaptation action, particularly in developing countries, the report warns. Improving access to funds will help to accelerate climate action, the report says with very high confidence.
It adds that funding for mitigation and adaptation needs to increase “many-fold” to achieve climate goals, address risks and speed up investment in emissions reductions.
Global climate finance flows have increased and financing channels have broadened over the past decade, but the report notes that average growth has slowed since 2018. The report adds with high confidence:
“Public and private finance flows for fossil fuels are still greater than those for climate adaptation and mitigation.”
It assesses that climate funding is “uneven” and has “developed heterogeneously across regions and sectors”, adding that the money falls short of what is needed to slash emissions and adapt to climate impacts.
There is enough global capital to close investment gaps, the report says, but “barriers” are preventing this funding being used instead for climate action.
Closing gaps and improving access to finance, alongside other actions, can “act as a catalyst for accelerating” climate action, the SPM says. The report builds on this, saying:
“Accelerated support from developed countries and multilateral institutions is a critical enabler to enhance mitigation and adaptation action and can address inequities in finance, including its costs, terms and conditions, and economic vulnerability to climate change.”
Many developing countries do not have enough financial resources for adaptation to help reduce associated economic and non-economic losses and damages, the report says.
The SPM outlines with high confidence that increasing access to finance can help tackle “soft”, avoidable adaptation limits and avert some of the rising risks of climate change. (See: What does the report say about adaptation?)
The “overwhelming majority” of climate finance is geared towards mitigation. But this still falls short, the SPM says, adding with medium confidence:
“Average annual modelled mitigation investment requirements for 2020 to 2030 in scenarios that limit warming to 2C or 1.5C are a factor of three to six greater than current levels, and total mitigation investments (public, private, domestic and international) would need to increase across all sectors and regions.”
Limited access to funding is listed as one of the key barriers to a number of actions including the adoption of low-emissions technology in developing countries.
Harmful impacts of climate change can further reduce a nation’s climate financial resources by causing losses and damages and also impeding economic growth. This adds to the financial constraints for adaptation, especially in developing and least developed countries.
The largest climate finance gaps and opportunities exist in developing countries, the report says, adding that more support is needed from developed nations and multilateral institutions to address inequities.
This could come in the form of larger public grants for climate funding “for vulnerable regions, e.g., in sub-Saharan Africa,” the report says. It adds that these would be cost-effective and have high social returns in terms of access to basic energy.
Reducing the barriers standing in the way of committing more money to climate action would require “clear signalling and support by governments” through actions such as decreasing the perceived risks of climate investments and increasing the returns, the SPM says.
Central banks, investors and other financial actors can change the “systemic underpricing of climate-related risks” and also reduce the “widening disparities” between the money available and the amount required, the SPM adds, noting:
“Public finance is an important enabler of adaptation and mitigation, and can also leverage private finance.”
Developed countries pledged to provide $100bn in climate funding each year by 2020 to help developing countries deal with climate change. The SPM notes that, as of 2018, finance levels were below this goal. (In 2021, Carbon Brief analysed why climate finance flows are falling short.)
According to the Earth Negotiations Bulletin, India, supported by Saudi Arabia and Brazil, requested a reference to this goal in a section on the adoption of low-emission technologies to highlight the finance gap for developing countries.
Tejal Kanitkar, India. Credit: IISD
The final report does reference the missed pledge elsewhere, but the text of low-emission technologies instead refers more broadly to the constraints of “limited finance”.
The SPM says that climate-resilient development – prioritising climate in all aspects of decision-making and policies – is aided by more international cooperation to improve access to finance and better align climate finance flows with the money required.
The report says faster global financial cooperation is key to aiding low-emission and just transitions. (A just transition is one in which workers and their communities are supported in the shift to a low-carbon economy, which is central to the idea of climate justice.) It can also address inequities in access to finance.
In order to scale-up financial flows, the report says there must be lower regulatory market barriers, a stronger alignment of public finance and more public funding in an effort to reduce the perceived risks of low-emission investments.
14. What are the co-benefits for the Sustainable Development Goals?
Comprising 17 goals, this “shared blueprint” for people and the planet recognises that ending poverty “and other deprivations” must accompany strategies that improve health, education, reduce inequality while combating climate change and protecting oceans and forests.
The synthesis report lays out how climate adaptation and mitigation actions can translate into co-benefits that aid countries’ efforts to meet their SDGs.
According to the report, both sets of actions have more potential synergies than potential trade-offs with the SDGs. This, however, depends on the scale and context of how mitigation and adaptation measures are implemented, the interactions between and within different sectors involved, cooperation between countries, governance, policy design and how these options are timed, sequenced and stringently deployed.
Ending “extreme poverty, energy poverty and providing decent living standards to all, consistent with sustainable development objectives…can be achieved without significant global emissions growth”, the report states with high confidence.
The report’s summary recognises that countries are at different levels of development, seeking to improve the well-being of people. With high confidence, it states:
“Development priorities among countries also reflect different starting points and contexts, and enabling conditions for shifting development pathways towards increased sustainability will therefore differ, giving rise to different needs.”
Nonetheless, many mitigation and adaptation systems can help countries meet their near-term development goals in energy, urban and land systems, the report says with high confidence.
Comanche Generating Station. Photo credit: Allen Best/Big Pivots
For instance, better air quality and improved health are some of the many co-benefits of deploying low-carbon energy systems, while urban mass transit powered by these systems can contribute to health, employment, energy security and “deliver equity”.
Conserving, protecting and restoring ecosystems, while managing them to help communities adapt to climate impacts, can help regions attain their food security and biodiversity conservation goals, the report says with high confidence.
In countries and regions that are highly dependent on fossil fuels – not just for energy, but revenues and jobs – mitigating risk calls for “just transition principles, processes and practices” and policies that promote economic and energy diversification, the SPM says with high confidence.
Mitigation actions that are embedded within a wider development context can, therefore, make for faster, deeper and wider emissions reductions, it states with medium confidence.
But to design “context-relevant” actions and plan for their implementation “requires considering people’s needs, biodiversity, and other sustainable development dimensions”, the report states with very high confidence.
Importantly, the report calls “effective governance” to limit potential trade-offs of some mitigation choices – such as the risks posed by large-scale afforestation and bioenergy projects to food systems, biodiversity, ecosystems and livelihoods, it says with high confidence.
Crucially, this requires “adequate institutional capacity at all levels” to safeguard against trade-offs.
Mitigation and adaptation actions taken together – accounting for trade-offs – can benefit not just human well-being, but deliver better ecosystem and planetary health, the report states with high confidence. Social safety nets and land restoration are examples that serve both adaptation and mitigation goals, with co-benefits for poverty reduction and food security.
However, there will be trade-offs, the report cautions. But these can be “evaluated and minimised” by giving weight to “capacity building, finance, technology transfer, governance, development, gender and social equity considerations with meaningful participation of local communities, Indigenous peoples and vulnerable populations”, it states with high confidence.
15. What does the report say about equity and inclusion?
“Equity remains a central element in the UN climate regime,” the SPM says. The report has a section dedicated to “equity and inclusion in climate change action”, which discusses how to ensure that those most vulnerable to the impacts of climate change can contribute to and benefit from climate mitigation and adaptation efforts.
The SPM says that “ambitious mitigation pathways imply large and sometimes disruptive changes in economic structure”. This can include a “shifting of income and employment” during the transition to low-emissions activities.
But the report has high confidence that “social safety nets” and “redistributive policies” that “shield the poor and vulnerable” can resolve trade-offs for a range of sustainable development goals, such as education, hunger, poverty, gender and energy access.
For example, it has high confidence that “while some jobs may be lost, low-emissions development can also open up opportunities to enhance skills and create jobs”. The report emphasises the importance of “broadening equitable access” to the relevant finance, technologies and governance.
It adds:
“Equity, inclusion, just transitions, broad and meaningful participation of all relevant actors in decision making at all scales enable deeper societal ambitions for accelerated mitigation, and climate action more broadly, and build social trust, support transformative changes and an equitable sharing of benefits and burdens”.
The report says that between 3.3 and 3.6 billion people are living in “contexts that are highly vulnerable to climate change”, where vulnerability is highest in “locations with poverty, governance challenges and limited access to basic services and resources, violent conflict and high levels of climate-sensitive livelihoods”.
It says that adaptation can be used to moderate the risks of climate change and the authors have high confidence that “adaptation progress is unevenly distributed with observed adaptation gaps”. The report adds:
“Present development challenges causing high vulnerability are influenced by historical and ongoing patterns of inequity such as colonialism, especially for many Indigenous Peoples and local communities.”
To effectively address adaptation gaps and avoid maladaptation, the report says that “meaningful participation and inclusive planning, informed by cultural values, Indigenous knowledge, local knowledge, and scientific knowledge can help”.
The report also notes that different countries have their own priorities for development, which give rise to differing needs.
For example, it says that “in several countries just transition commissions, task forces and national policies have been established”, while in others, the principles of a just transition need to be integrated into policies through “collective and participatory decision-making processes”.
This section of the report also discusses behavioural interventions. It has high confidence that “individuals with high socioeconomic status contribute disproportionately to emissions, and have the highest potential for emissions reductions”. It says there are many options for reducing emissions from this group, which can be supported by policies, infrastructure, and technology.
Meanwhile, it has high confidence that, for lower-income groups, “eradicating extreme poverty, energy poverty, and providing decent living standards to all in these regions in the context of achieving sustainable development objectives, in the near-term, can be achieved without significant global emissions growth”.
Fatemeh Asadi Zeidabadi, a PhD student in the UBC department of chemical and biological engineering and a student in Dr. Madjid Mohseni’s group. Photo credit: Mohseni lab
Engineers at the University of British Columbia have developed a new water treatment that removes “forever chemicals” from drinking water safely, efficiently – and for good.
“Think Brita filter, but a thousand times better,” says UBC chemical and biological engineering professor Dr. Madjid Mohseni, who developed the technology.
Dr. Madjid Mohseni
Forever chemicals, formally known as PFAS (per-and polyfluoroalkyl substances) are a large group of substances that make certain products non-stick or stain-resistant. There are more than 4,700 PFAS in use, mostly in raingear, non-stick cookware, stain repellents and firefighting foam. Research links these chemicals to a wide range of health problems including hormonal disruption, cardiovascular disease, developmental delays and cancer.
To remove PFAS from drinking water, Dr. Mohseni and his team devised a unique adsorbing material that is capable of trapping and holding all the PFAS present in the water supply.
The PFAS are then destroyed using special electrochemical and photochemical techniques, also developed at the Mohseni lab and described in part in a paper published recently in Chemosphere.
While there are treatments currently on the market, like activated carbon and ion-exchange systems which are widely used in homes and industry, they do not effectively capture all the different PFAS, or they require longer treatment time, Dr. Mohseni explained.
“Our adsorbing media captures up to 99 per cent of PFAS particles and can also be regenerated and potentially reused. This means that when we scrub off the PFAS from these materials, we do not end up with more highly toxic solid waste that will be another major environmental challenge.”
He explained that while PFAS are no longer manufactured in Canada, they are still incorporated in many consumer products and can then leach into the environment. For example, when we apply stain-resistant or repellent sprays/materials, wash PFAS-treated raingear, or use certain foams to put down fires, the chemicals end up in our waterways. Or when we use PFAS-containing cosmetics and sunscreens, the chemicals could find their way into the body.
For most people, exposure is through food and consumer products, but they can also be exposed from drinking water – particularly if they live in areas with contaminated water sources.
Dr. Mohseni, whose research group also focuses on developing water solutions for rural, remote and Indigenous communities, noted: “Our adsorbing media are particularly beneficial for people living in smaller communities who lack resources to implement the most advanced and expensive solutions that could capture PFAS. These can also be used in the form of decentralized and in-home water treatments.”
The UBC team is preparing to pilot the new technology at a number of locations in B.C. starting this month.
“The results we obtain from these real-world field studies will allow us to further optimize the technology and have it ready as products that municipalities, industry and individuals can use to eliminate PFAS in their water,” said Dr. Mohseni.
Decision-making about the parlous Colorado River situation is currently somewhat hung up in a surly debate about the absolute ‘rule of law’ versus the kind of equity and fairness most laws are created to further. Six of the seven Colorado River states are willing to take proportional shares of the pain for some major cuts in water usage that must happen for the river system to remain functional. But the seventh state, California, insists that the pain be administered strictly according to the foundational law of the river basin, the appropriation law, whereby junior water users bear all the pain before any falls on more senior users.
Thus we Westerners – all Americans actually – are edging ever closer to the time when we will have to confront the continuing viability of laws based on appropriation from the commons, once a commons has been entirely appropriated.
Appropriation law gives individual members of a society permission to convert portions of the land and resources they inhabit in common into private property, through the act of applying their individual labor to the development of that part of the land and its resources. This concept of privatization through individual appropriation from the commons led in America to the fundamental doctrines driving the expansion of Anglo-European civilization into its ‘New World’: the homesteading laws, the laws for appropriating water in water-scarce regions, and the 1872 Mining Law among them. These all came into being down on the ground as common law worked out by settlers and ‘unsettlers’ of European origin – often aggressively and violently – rather than executed as a top-down public policy governing development from the start. The formal laws were only executed after the basic practices of ‘first come first served’ appropriation had been established down on the ground.
There was, of course, a tendency to think of this ‘first come first served’ doctrine as ‘natural law,’ human nature, just the way the species does things. But anthropologists who have studied primary cultures – the remaining hunter-gatherer groups like we all descended from – tell us a different story. For hunter-gatherer bands, the idea that the land and its essential resources could be appropriated by individual members and privatized (No trespassing!) was literally inconceivable. The fruits of the land, the ‘goods and services’ naturally produced from the local ecosystems, were everyone’s for the taking, so long as you only took what you could use. But the land and its production systems themselves belonged to all and none.
They probably intuitively understood the concept of territory– the amount of land their group needed for their subsistence living – and chased off encroaching members of other bands, like wolves peeing on their boundaries. But within the territory, within the band, the idea that an individual member might appropriate for himself, say, the land surrounding the spring where the deer drank, or the big berry patch… simply inconceivable.
So how did we get from there – the aboriginal communal economy in which all equitably got what they needed from the commons without ‘owning’ any of it – to the current situation where most of the former commons (land, water and other resources) has been surveyed off into ‘properties’ privately owned by individuals, with subsequent generations having to work for the propertied class in order to get the wherewithal to buy or trade for what they need of those appropriated resources?
That is a question that has been slowly coming to a boil for the past six or eight thousand years, and the anthropologists, archaeologists and social scientists have not put together a really definitive answer. But there was one period in Anglo-European history when serious, if naive, attempts were made to apply reason to that question; and those attempts in that period, for better or worse, laid the philosophical foundation for the political and economic infrastructure of the American Experiment – including the concept of converting the commons into private property through appropriation.
This period was ‘The Enlightenment’ in the 17th and 18th centuries C.E., which followed fast on the heels of the Scientific Revolution in which such luminaries as Francis Bacon and Isaac Newton had put the disciplined, evidence-based search for knowledge on at least an equal footing with the revelations of religion. The Enlightenment philosophes took the scientific quest for evidence-based knowledge into the more ambiguous realm of explaining the social, economic and political infrastructure of society – or maybe more accurately: justifying the infrastructure of their own society, hardly a model of equity and fairness to all.
The philosophes tried, with no anthropological guidance beyond the Bible’s Old Testament stories, to go back to the ‘natural’ origins of human society, where they assumed that the basic social unit was what it had become by their time: the individual. To keep an agglutination of rugged individualists from what the English philosopher Thomas Hobbes had imagined as ‘the war of each against all,’ leading to a ‘solitary, poor, brutish, and short’ life for everyone except the last man standing, the philosophes conceived of the ‘social contract’ whereby each individual agreed to respect the life, liberty and property of every other participant in a ‘contract society,’ if all the others would do the same.
Had the philosophes seriously followed Bacon’s new scientific method, a more objective look at the native populations of the ‘New World’ would have taught them that the original social unit that close to nature was the group, not the individual. Individuals in a native band could become known within their society by their work, but the idea of a making an individual contract with their society was again inconceivable; they were born into their society, grew up taking it for granted; they were their society, and without it they were nothing; they took their identity from their society. It was a significant distinction: in the aboriginal communal society, the individual was nothing without the society; whereas, for the philosophes’ contract society, the society was nothing without the consent and participation of its individuals.
A clear-eyed look at any modern society shows a generally confusing mix of both residual ‘communities’ (evangelical and Catholic churches, fraternal unions, teams, many small villages, and other organizations whose members would willingly die with or for each other), and the dominant ‘contract societies’ (participants in economic exchanges for goods and services, schools, many Protestant churches, most suburbs, and other groups in which the participant remains an individual with a purposeful but limited investment of oneself). A tendency in most of us to develop ‘favorites’ in our economic dealings – going back to the same stores, restaurants, bars et cetera because we like the people there, even though another establishment down the street tries to lure us in with lower prices – suggests that the ‘community’ is a more ‘natural’ and desired state for humans than the ‘contract society’ – which in turn suggests (as Yuval Harari argues in Sapiens) that the road from hunter-gatherer peoples to civilizations is not necessarily an ‘ascent,’ at least in terms of human satisfaction.
Real anthropology, however, was not really the purpose of John Locke, Jean-Jacues Rousseau, Voltaire and the other philosophes;they had the larger mission of justifying a world increasingly driven by individuals operating on their own and hauling the society along with them – the early industrialists and global merchants tugging the decayed, overgrown and overcrowded feudal agricultural societies into the urbanizing mass society reorganized as a contract society, with the contracting workers organized in industrial systems managed by educated elites. Many of the early industrial workers were driven off the land they had farmed for generations as vassals under contracts with the lords of their places, who suddenly found it more profitable to ‘enclose’ their land to graze sheep for wool for the mills springing up in the new more ‘civilized’ economy.
That kind of privatization of land, displacing thousands of people, required some explanation and justification. John Locke attempted this in his ‘Second Treatise on Government,’ subtitled ‘An Essay Concerning the True Original, Extent and End of Civil Government.’ After established the need for the ‘social contract’ in the first chapters, he ventured into a longish chapter titled ‘Of Property,’ where he poses the problem: God having given the earth to ‘the children of men’ in common, how should any one ever come to have a property in any thing?
He goes into a long and somewhat convoluted argument, ‘proving’ to at least his own satisfaction that when a man had added his labor to any thing from the commons given to all, that thing became his property. Apples or nuts he harvested become his – so long as he takes only what he can use; if he takes anything that rots or otherwise wastes away because he was unable to use it, then he has taken property from his neighbors.
That might have gotten a dubious nod from a hunter-gatherer band, or at least a shrug. They’d been doing that forever, although not calling it ‘property’ – whatever fills your basket. But putting the appropriation in the context of individuals getting it for themselves (with an undertone of competition among neighbors) was really quite different from the community context of everyone hunting and gathering for the band’s common pots. Rituals existed around the giving-away of choice meats when the hunts were successful.
Locke then took a giant leap in going from ‘property’ created by just picking up apples and nuts, or dipping a pitcher of water – harvesting the existing fruits of nature – to appropriating property in land. ‘The same measures governed the appropriation of land too: whatsoever he tilled and reaped, laid up and made use of, that was his peculiar right; whatsoever he enclosed, and could feed, and make use of, the cattle and product was also his.’ So long as nothing he grew or raised spoiled before he could use it.
The problem thwarting the accumulation of real wealth in property by individuals was spoilage, waste. But what if there were something that didn’t rot or waste away? Like shells, or shiny bits of metal…. One could trade one’s excess apples or nuts for those durable shiny bits of metal, which could then be traded whenever to others for their excessive appropriations that would otherwise rot or waste away…. Thus did money enter the system, and it enabled virtually unlimited appropriation and accumulation of ‘property,’ so long as markets existed for exchanging those shiny bits for more perishable goods and services.
That, in a nutshell, is Locke’s theory of labor in the creation of property, something that anyone could do, rich or poor, so long as he had the energy and will to put his labor to work appropriating the property from the commons – and so long as there was a commons from which to appropriate.
Native land loss 1776 to 1930. Credit: Alvin Chang/Ranjani Chakraborty
By Locke’s time, of course, the Anglo-European peoples had succeeded so well as a dominant species in their lands that no land or traditional resources were left to appropriate. By the 15th century C.E. they were approaching a serious energy crisis – wood for burning and hay for horses being their principal energy resources – and were on the cusp of having too many people for the food supply. This precipitated the early stage of reorganizing as a ‘civilization,’ to do what civilizations do: they began to expand, through occupation of new lands where possible, conquest when necessary. Ships of explorers going out with guns, germs and steel – hit a bonanza; they ‘discovered’ America.
Locke acknowledged that the absence of commons remaining in England and Europe was problematic for new generations wanting to create their own property – but there was a whole New World across the ocean! ‘In the beginning all the world was America,’ he observed, and America was apparently huge and perhaps infinite in its resources (still a fairly common belief, or hope)….
The Enlightenment thinkers had a significant influence on the development of American social, political and economic society; the concept of the social contract and the contract society figured largely in both the American break from English governance and in the civil government set up following the American Revolution – which was as much a civil war as it was a war between nations, with early American industrialists fighting for freedom from British mercantilism, and agrarian farmers fighting for freedom from both the British mercantilists and the American industrialists who controlled the flow of those durable shiny bits of metal. Shay’s Rebellion and the Whiskey Rebellion in the years following the end of the revolt against Great Britain might be considered part of the American Revolution.
Explorer John Wesley Powell and Paiute Chief Tau-Gu looking over the Virgin River in 1873. Photo credit: NPS
The American system of appropriating land from the commons tried to merge with the Enlightenment idea of the individual (Jefferson’s ‘yeoman’) as the basic societal unit, and this did not work out all that well. Two out every three homesteads appropriated from the commons failed, and most of the ones that succeeded were done by groups of settlers, often religious groups, settling an area together, especially in the arid West – as Major John Wesley Powell had recommended in his 1877 ‘Report on the Lands of the Arid Region.’
Powell in turn had based his recommendations on the Hispanic-Mexican system of settlement, which permitted no wide-open individual appropriation from the commons; land grants were only issued to groups of settlers committed to working together to develop an area with some ecological sensibility. But Powell’s recommendations were, as usual, ignored. From the perspective of the leaders of industrial society, appropriation from the commons by individuals was preferable to appropriation for community settlements because of the failure rate: homesteaders who failed became a source of workers for western industries, and those managing industrial operations preferred employees who thought of themselves as independent individuals contracting for themselves, as opposed to the ‘socialists’ trying to organize the workers.
George Washington addresses the Continental Congress via Son of the South
While the 17th century Scientific Revolution and the ensuing Enlightenment gave much to the modern society, it also produced quite a lot of questionable ideas that were clearly the product of cloistered thinkers from favored economic classes who operated from questionable assumptions about what was really ‘human nature’ – and this included America’s ‘founding brothers’ on the west side of the ocean, an equally favored class for the most part. ‘Individualism’ may be an ephemeral luxury that only the wealthier classes in a wealthy society can really afford.
John Locke’s naive ideas about individualistic appropriation from the commons were given – as he acknowledged – new life by the occupation and parceling out of a vast new continental commons (originally appropriated from its aboriginal inhabitants), but now that continent and its waters and other resources are almost entirely appropriated – and the next time the Republicans are in charge they will try to finish off the privatization of the remaining public lands and their resources.
Now we find ourselves facing the question that all unsustainable processes eventually face: what next? A question of some urgency in the Colorado River region, where fairness decrees that Lockean appropriation law can neither be just abandoned nor enforced to the letter of the law. More on this as it unravels further….
This week, heavy precipitation fell in parts of the West, especially in California, while drier weather generally occurred in the Great Plains east of the Rocky Mountains. Heavier precipitation also fell along parts of the Rio Grande in Texas, leading to some improvements of drought conditions there. Widespread precipitation amounts at or above a half inch fell in east Texas eastward into the Southeast, and from near Interstate 44 in Oklahoma eastward into Arkansas and southern Missouri. New York and southern New England also saw near a half inch of precipitation this week, with localized higher amounts. Dry weather continued in parts of the Florida Peninsula, where severe drought coverage increased in several areas. In response to rainfall in central Puerto Rico but continued dry conditions in the northwest, abnormal dryness coverage shifted a bit there. Recent dry weeks in Hawaii led to decreased streamflows and the introduction of abnormal dryness on all islands except Kauai and Niihau. For more detailed information for each region, please refer to the paragraphs below…
Temperatures in the High Plains region were mostly below normal for the week. The most significant departures occurred in the Dakotas, where temperatures mainly ranged from 15 to 25 degrees colder than normal outside of southwest South Dakota. Precipitation fell in some of the high elevation areas of Colorado and Wyoming this week; otherwise, the weather was mostly dry in the High Plains region. Moderate and severe drought expanded slightly in southeast Kansas; please see the Midwest paragraph for more details on this. Due to recent snowfall and lessening precipitation deficits, portions of northwest North Dakota saw reductions in moderate and severe long-term drought coverage. Otherwise, ongoing long-term drought was unchanged east of the Rocky Mountains. In north-central South Dakota, stock pond levels and river levels remained low, despite some recent snowmelt, indicative of long-term dryness there. Parts of the Sangre de Cristo Mountains and far eastern San Luis Valley saw some improvements due to increased snowpack. Increased recent precipitation in southwest Wyoming allowed for the removal of severe drought…
Colorado Drought Monitor one week change map ending March 21, 2023.
Most of the West saw temperatures near or below normal for the week, with a few areas of temperatures between 10 and 15 degrees below normal occurring in the Intermountain West, especially in Utah, Idaho, Nevada and Oregon. Widespread precipitation in the form of rain and snow, with localized very heavy amounts, occurred in parts of the region, especially in the San Bernardino and Sierra Nevada Mountains in California. A few spots in the northern Sierra Nevada saw improvements where snowpack increased further. Lush vegetation was reported in San Bernardino County, California, indicative of the very wet recent weather. The effects of recent wet weather will continue to be analyzed in the coming weeks over this area, and slight improvements to lingering abnormal dryness were made in southwest California this week. Large areas of severe and extreme drought in northern Nevada, northern Utah, Oregon, southern Idaho and northern Montana saw improvements due to recent precipitation and lessening precipitation deficits. Due to increased soil moisture and lessened precipitation deficits, improvements to ongoing long-term drought and abnormal dryness were also made in southeast Arizona and southwest New Mexico, and in portions of south-central and northwest New Mexico…
Widespread precipitation amounts of at least a half inch fell across the eastern two-thirds of the region, with localized spots in far east Texas, Louisiana, southwest Mississippi and central Arkansas reaching 2 inches. Oklahoma northwest of Interstate 44 and much of central and west Texas had mostly dry weather this week. Exceptions to this occurred in many areas along the Rio Grande from the Big Bend east in southern Texas, which received localized heavier precipitation amounts from 0.5 to 2 inches. Temperatures across the South region this week were generally 5 to 15 degrees cooler than normal. Continued dry conditions in the Oklahoma and Texas panhandles led to expansions of severe and exceptional drought where soil moisture and groundwater levels continued to drop. In the northern Texas Panhandle, the winter wheat crop is in danger of total failure, which is indicative of the soil moisture and precipitation deficit problems in the area. In areas that mostly missed out on heavier rains in central Texas, streamflow continued to drop amid growing precipitation deficits, leading to expansion of drought and abnormal dryness in some locations. Farther south, in the Big Bend region and in south-central Texas, localized improvements were made due to benefits from recent heavier rainfall. Ongoing short- and long-term drought and abnormal dryness remained unchanged in southern Louisiana and Mississippi, and the rest of the region remained free of drought or abnormal dryness…
Looking Ahead
Through the afternoon of Monday, March 27, the National Weather Service Weather Prediction Center is forecasting mainly dry weather in the northern Great Plains, Minnesota and northwest Wisconsin. Mostly dry weather is also forecast in most of the Florida Peninsula, where short-term moderate and severe drought has intensified recently. Aside from some of the higher elevation areas, mostly drier weather is forecast in southern Nevada, southeast California, Utah and New Mexico. Heavier precipitation amounts are forecast for parts of western Oregon and Washington and far northwest California. Heavy rainfall, locally up to or exceeding 3 inches, is forecast along and south of the Interstates 44 and 70 corridors from far northeast Oklahoma into Ohio. Widespread rain amounts of at least 1.5 inches are likely in the northern halves of Georgia, Alabama and Mississippi, and in the southwest half of Tennessee. Widespread precipitation amounts of 0.5-0.75 inches are likely in much of the Northeast, with localized higher amounts.
For the period from March 28-April 1, the National Weather Service Climate Prediction Center’s forecast strongly favors above-normal precipitation in most of the West, especially central and southern California. Above-normal precipitation is also likely in Tennessee and portions of the surrounding states. Most of the Great Plains, except for the area stretching from southeast New Mexico to western Kansas, is slightly favored to receive above-normal precipitation, as is the Upper Midwest and most of the Northeast. Below-normal precipitation is weakly favored in the southern half of the Florida Panhandle. Above-normal precipitation is likely in most of Alaska, except for far southeast Alaska, where below-normal precipitation is favored. The temperature outlook strongly favors colder-than-normal weather across most of the West, especially California and Nevada, with most of the northern contiguous U.S. also leaning toward colder-than-normal temperatures. The entire Gulf Coast region is more likely to have warmer-than-normal temperatures, with the highest probabilities for above-normal temperatures existing in the Florida Panhandle. Warmer-than-normal temperatures are favored in northeast Alaska, while colder-than-normal weather is more likely in southeast Alaska.
US Drought Monitor one week change map ending March 21, 2023.
The Colorado River from Navajo Bridge below Lee’s Ferry and Glen Canyon Dam. The proposed Marble Canyon Dam would have been just downstream from here. Jonathan P. Thompson photo.
Click the link to go to the ABC News website (Devin Dwyer). Here’s an excerpt:
The U.S. Supreme Court on Monday (March 20. 2023) appeared narrowly divided over whether to allow the Navajo Nation to sue the federal government for help expanding their reservation’s access to water at a time when the precious resource has been in tight supply across the drying American West. After oral arguments that stretched almost two hours, there appeared to be at least five justices supportive of allowing the tribe to purse a claim, but there was no clear consensus from the bench on the scope of the government’s duty to provide water the Navajo seek…
At issue is an 1868 treaty in which the U.S. agreed to provide the Navajo, who had been forced off native lands, with a new “permanent home.” The tribe claims the agreement implicitly requires the government to assess the Navajo’s water needs and develop a plan to meet them for farming and living; the government disputes that it ever agreed to explicitly provide the reservation with a certain amount of water…
A federal district court sided with the government, denying the Navajo Nation’s claim, saying it had failed to identify a “specific, applicable, trust-creating statute or regulation that the government violated.” A federal appeals court reversed, reasoning that the reservation could not exist without adequate water and therefore an obligation to supply it was implied. Justices Neil Gorsuch, Ketanji Brown Jackson, Elena Kagan and Sonia Sotomayor all seemed sympathetic to the tribe’s case.
“Clearly, there is a duty to provide some water to this tribe under the treaty, right?” Gorsuch asked Biden administration Assistant to the U.S. Solicitor General Frederick Liu. “Could I bring a good breach-of-contract claim for someone who promised me a permanent home, the right to conduct agriculture and raise animals if it turns out it’s the Sahara Desert?”
“I don’t think you would be able to bring a breach of contract claim,” Liu replied. Gorsuch reacted with disbelief…
Attorney Shay Dvoretzky, representing the tribe, insisted the government has an “affirmative duty to ensure access to water” and that it had broken that promise for generations…An attorney for three states in the case – Arizona, Colorado and Nevada – argued the Navajo Nation should never have been able to bring the claim in the first place, since the Supreme Court has asserted exclusive jurisdiction over disputes involving the Colorado River in a series of decisions and decrees over decades…
They also argue that allowing the tribe to claim expanded water rights over the Colorado would upset pre-existing agreements and ultimately mean less water available to those communities that have come to rely on it. Justice Samuel Alito appeared most concerned about the potential “real-world impacts” of the case on preexisting water allocation agreements.
Navajo Nation. Image via Cronkite News.
Click the link to read “The Supreme Court wrestles with questions over the Navajo Nation’s water rights” on the National Public Radio website (Becky Sullivan). Here’s an excerpt:
…the Navajo Nation says it has not been able to fully represent its own interests in disputes over water. Instead, they say they’ve been blocked in court by the U.S. federal government, which says it represents tribal interests in water disputes. The tribe’s claim stems from federal policies that forcibly relocated tribes and their citizens westward and onto reservations, including the Navajo Treaty of 1868, said Heather Tanana, a law professor at the University of Utah.
“When they established these reservations, that came with the promise that those lands would be permanent homelands for the tribe and their people,” said Tanana, who is a citizen of Navajo Nation. “And I think everyone would agree you can’t have a homeland of any kind without water.”
[…]
The U.S. has argued that a broad ruling in favor of the Navajo Nation could force the federal government to conduct an assessment of the tribe’s water needs and build water supply infrastructure. Those responsibilities belong to the tribe, the government says.
“Just as the 1868 treaty didn’t impose on the United States a duty to build roads or bridges, or to harvest timber, or to mine coal, the 1868 treaty didn’t impose on the United States a duty to construct pipelines, pumps or wells to deliver water,” said Frederick Liu, an assistant to the solicitor general, addressing the court.
Several of the court’s conservatives, including Justices Samuel Alito and Brett Kavanaugh, appeared sensitive to that concern during Monday’s hearing, which prompted assurances from Shay Dvoretzky, the attorney arguing on behalf of the Navajo Nation.
“The government hypothesizes a parade of horribles where the government would have to be building pipelines across miles and miles and miles of territory,” [Shay] Dvoretzky said. “We’re not talking about anything like that.”
Click the link to read the release on the IPCC website (Lance Ignon):
INTERLAKEN, Switzerland, March 20, 2023 — There are multiple, feasible and effective options to reduce greenhouse gas emissions and adapt to human-caused climate change, and they are available now, said scientists in the latest Intergovernmental Panel on Climate Change (IPCC) report released today.
“Mainstreaming effective and equitable climate action will not only reduce losses and damages for nature and people, it will also provide wider benefits,” said IPCC Chair Hoesung Lee. “This Synthesis Report underscores the urgency of taking more ambitious action and shows that, if we act now, we can still secure a liveable sustainable future for all.”
In 2018, IPCC highlighted the unprecedented scale of the challenge required to keep warming to 1.5°C. Five years later, that challenge has become even greater due to a continued increase in greenhouse gas emissions. The pace and scale of what has been done so far, and current plans, are insufficient to tackle climate change.
More than a century of burning fossil fuels as well as unequal and unsustainable energy and land use has led to global warming of 1.1°C above pre-industrial levels. This has resulted in more frequent and more intense extreme weather events that have caused increasingly dangerous impacts on nature and people in every region of the world.
Every increment of warming results in rapidly escalating hazards. More intense heatwaves, heavier rainfall and other weather extremes further increase risks for human health and ecosystems. In every region, people are dying from extreme heat. Climate-driven food and water insecurity is expected to increase with increased warming. When the risks combine with other adverse events, such as pandemics or conflicts, they become even more difficult to manage.
Losses and damages in sharp focus
The report, approved during a week-long session in Interlaken, brings in to sharp focus the losses and damages we are already experiencing and will continue into the future, hitting the most vulnerable people and ecosystems especially hard. Taking the right action now could result in the transformational change essential for a sustainable, equitable world.
“Climate justice is crucial because those who have contributed least to climate change are being disproportionately affected,” said Aditi Mukherji, one of the 93 authors of this Synthesis Report, the closing chapter of the Panel’s sixth assessment.
“Almost half of the world’s population lives in regions that are highly vulnerable to climate change. In the last decade, deaths from floods, droughts and storms were 15 times higher in highly vulnerable regions,“ she added.
In this decade, accelerated action to adapt to climate change is essential to close the gap between existing adaptation and what is needed. Meanwhile, keeping warming to 1.5°C above pre-industrial levels requires deep, rapid and sustained greenhouse gas emissions reductions in all sectors. Emissions should be decreasing by now and will need to be cut by almost half by 2030, if warming is to be limited to 1.5°C.
Clear way ahead
The solution lies in climate resilient development. This involves integrating measures to adapt to climate change with actions to reduce or avoid greenhouse gas emissions in ways that provide wider benefits.
For example: access to clean energy and technologies improves health, especially for women and children; low-carbon electrification, walking, cycling and public transport enhance air quality, improve health, employment opportunities and deliver equity. The economic benefits for people’s health from air quality improvements alone would be roughly the same, or possibly even larger than the costs of reducing or avoiding emissions.
Climate resilient development becomes progressively more challenging with every increment of warming. This is why the choices made in the next few years will play a critical role in deciding our future and that of generations to come.
To be effective, these choices need to be rooted in our diverse values, worldviews and knowledges, including scientific knowledge, Indigenous Knowledge and local knowledge. This approach will facilitate climate resilient development and allow locally appropriate, socially acceptable solutions.
“The greatest gains in wellbeing could come from prioritizing climate risk reduction for low-income and marginalised communities, including people living in informal settlements,” said Christopher Trisos, one of the report’s authors. “Accelerated climate action will only come about if there is a many-fold increase in finance. Insufficient and misaligned finance is holding back progress.”
Enabling sustainable development
There is sufficient global capital to rapidly reduce greenhouse gas emissions if existing barriers are reduced. Increasing finance to climate investments is important to achieve global climate goals. Governments, through public funding and clear signals to investors, are key in reducing these barriers. Investors, central banks and financial regulators can also play their part.
There are tried and tested policy measures that can work to achieve deep emissions reductions and climate resilience if they are scaled up and applied more widely. Political commitment, coordinated policies, international cooperation, ecosystem stewardship and inclusive governance are all important for effective and equitable climate action.
If technology, know-how and suitable policy measures are shared, and adequate finance is made available now, every community can reduce or avoid carbon-intensive consumption. At the same time, with significant investment in adaptation, we can avert rising risks, especially for vulnerable groups and regions.
Climate, ecosystems and society are interconnected. Effective and equitable conservation of approximately 30-50% of the Earth’s land, freshwater and ocean will help ensure a healthy planet. Urban areas offer a global scale opportunity for ambitious climate action that contributes to sustainable development.
Changes in the food sector, electricity, transport, industry, buildings and land-use can reduce greenhouse gas emissions. At the same time, they can make it easier for people to lead low-carbon lifestyles, which will also improve health and wellbeing. A better understanding of the consequences of overconsumption can help people make more informed choices.
“Transformational changes are more likely to succeed where there is trust, where everyone works together to prioritise risk reduction, and where benefits and burdens are shared equitably,” Lee said. “We live in a diverse world in which everyone has different responsibilities and different opportunities to bring about change. Some can do a lot while others will need support to help them manage the change.”
Here are the big takeaways from the @IPCC_CH Synthesis Report released today.
First, climate change has already caused widespread and substantial losses to almost every aspect of human life on this planet, and the impacts on future generations depend on the choices we make NOW. pic.twitter.com/Bgfl9nna8a
Reading the latest international climate report can feel overwhelming. It describes how rising temperatures caused by increasing greenhouse gas emissions from human activities are having rapid, widespread effects on the weather, climate and ecosystems in every region of the planet, and it says the risks are escalating faster than scientists expected.
Global temperatures are now 1.1 degree Celsius (2 degrees Fahrenheit) warmer than at the start of the industrial era. Heat waves, storms, fires and floods are harming humans and ecosystems. Hundreds of species have disappeared from regions as temperatures rise, and climate change is causing irreversible changes to sea ice, oceans and glaciers. In some areas, it’s becoming harder to adapt to the changes.
Still, there are reasons for optimism – falling renewable energy costs are starting to transform the power sector, for example, and the use of electric vehicles is expanding. But change aren’t happening fast enough, and the window for a smooth transition is closing fast, the Intergovernmental Panel on Climate Change report warns. To keep global warming below 1.5 C (2.7 F), it says global greenhouse gas emissions will have to drop 60% by 2035 compared with 2019 levels.
That’s 12 years from now.
The extent to which current and future generations will experience a hotter world depends on choices made now and in the coming years. The scenarios show expected differences in temperature depending on how high emissions are going forward. IPCC sixth assessment report
Here are four essential reads by co-authors of some of those reports, each providing a different snapshot of the changes underway and discussing solutions.
1. More intense storms and flooding
A volunteer fire company assists with evacuation efforts following a flash flood in Helmetta, New Jersey, in August 2021. Tom Brenner / AFP via Getty Images
Many of the most shocking natural disasters of the past few years have involved intense rainfall and flooding.
In Europe, a storm in 2021 set off landslides and sent rivers rushing through villages that had stood for centuries. In 2022, about a third of Pakistan was underwater, and several U.S. communities were hit with extreme flash flooding.
The IPCC warns in the sixth assessment report that the water cycle will continue to intensify as the planet warms. That includes extreme monsoon rainfall, but also increasing drought, greater melting of mountain glaciers, decreasing snow cover and earlier snowmelt, wrote UMass-Lowell climate scientist Mathew Barlow, a co-author of the assessment report examining physical changes.
Annual average precipitation is projected to increase in many areas as the planet warms, particularly in the higher latitudes. IPCC sixth assessment report
“An intensifying water cycle means that both wet and dry extremes and the general variability of the water cycle will increase, although not uniformly around the globe,” Barlow wrote.
“Understanding this and other changes in the water cycle is important for more than preparing for disasters. Water is an essential resource for all ecosystems and human societies.”
2. The longer the delay, the higher the cost
Extreme rainfall filled streets in Dhaka, Bangladesh, in July 2020. Flooding has become common in many South Asia cities. Munir Uz zaman / AFP via Getty Images
The IPCC stressed in its reports that human activities are unequivocally warming the planet and causing rapid changes in the atmosphere, oceans and icy regions of the world.
“Countries can either plan their transformations, or they can face the destructive, often chaotic transformations that will be imposed by the changing climate,” wrote Edward Carr, a Clark University scholar and co-author of the IPCC report focused on adaptation.
The longer countries wait to respond, the greater the damage and cost to contain it. One estimate from Columbia University put the cost of adaptation needed just for urban areas at between US$64 billion and $80 billion a year – and the cost of doing nothing at 10 times that level by mid-century.
“The IPCC assessment offers a stark choice,” Carr wrote. “Does humanity accept this disastrous status quo and the uncertain, unpleasant future it is leading toward, or does it grab the reins and choose a better future?”
3. Transportation is a good place to start
Electric vehicle sales have been accelerating, and new tax incentives and state zero-emissions requirements are expected to boost sales even more. Michael Fousert/Unsplash, CC BY
One crucial sector for reducing greenhouse gas emissions is transportation.
Cutting greenhouse gas emissions to net-zero by mid-century, a target considered necessary to keep global warming below 1.5 C, will require “a major, rapid rethinking of how people get around globally,” wrote Alan Jenn, a transportation scholar at the University of California Davis and co-author on the IPCC report dealing with mitigation.
There are positive signs. Battery costs for electric vehicles have fallen, making them increasingly affordable. In the U.S., the 2022 Inflation Reduction Act offers tax incentives that lower the costs for EV buyers and encourage companies to ramp up production. And several states are considering following California’s requirement that all new cars and light trucks be zero-emissions by 2035.
Costs have fallen for key forms of renewable energy and EV batteries, and adoption of these technologies is rising. IPCC sixth assessment report
“Behavioral and other systemic changes will also be needed to cut greenhouse gas emissions dramatically from this sector,” Jenn wrote.
For example, many countries saw their transportation emissions drop during COVID-19 as more people were allowed to work from home. Bike sharing in urban areas, public transit-friendly cities and avoiding urban sprawl can help cut emissions even further. Aviation and shipping are more challenging to decarbonize, but efforts are underway.
He adds, however, that it’s important to remember that the effectiveness of electrifying transportation ultimately depends on cleaning up the electricity grid.
The IPCC reports discuss several other important steps to reduce greenhouse gas emissions, including shifting energy from fossil fuels to renewable sources, making buildings more energy efficient and improving food production, as well as ways to adapt to changes that can no longer be avoided.
“For example, renewable energy is now generally less expensive than fossil fuels, so a shift to clean energy can often save money,” they wrote. Electric vehicle costs are falling. Communities and infrastructure can be redesigned to better manage natural hazards such as wildfires and storms. Corporate climate risk disclosures can help investors better recognize the hazards and push those companies to build resilience and reduce their climate impact.
“The problem is that these solutions aren’t being deployed fast enough,” Lempert and Gilmore wrote. “In addition to pushback from industries, people’s fear of change has helped maintain the status quo.” Meeting the challenge, they said, starts with embracing innovation and change.
Editor’s note: This story is a roundup of articles from The Conversation’s archives.
Sunrise Denver skyline from Sloan’s Lake September 2, 2022.
Click the link to read the article on The Denver Post website (Conrad Swanson). Here’s an excerpt:
“We’ve known the answers for decades, it’s just a matter of political will for implementing them,” Jill Locantore, executive director of Denver Streets Partnership, said.
Perhaps the biggest piece of Denver’s air-quality problem would be solved by expanding the city’s public transit options, Jill Locantore, executive director of Denver Streets Partnership, said. Each piece overlaps with the others, Locantore, whose nonprofit works to reduce the city’s dependence on cars, said.
“The key is land use and transportation. Reduce vehicle miles traveled. Reduce land consumption. Reduce water consumption,” Locantore said. “We’ve known the answers for decades, it’s just a matter of political will for implementing them.”
[…]
Denver’s mayor could buy additional, dedicated service from RTD, like Boulder does, Danny Katz, executive director of the nonprofit Colorado Public Interest Research Group. Building new train lines would be expensive, time-consuming and would consume land that’s already occupied or needed for other things, Katz said. Better to increase service on existing train lines to start…
As for cars that can’t be eliminated from the city’s streets, like the thousands of vehicles that Denver owns, Katz said the next mayor could work to phase out gas-powered vehicles in favor of electric ones. Not only would that shift reduce emissions from thousands of vehicles but it also means the city would likely have to install charging stations around Denver, which could be used by residents also switching to electric vehicles…
Increasing the city’s density would mean more people live within walking distance of public transit and other amenities, Locantore said. The City Council holds sway over zoning and building codes and it could change the codes to encourage higher-density, multi-use projects and turn away others that don’t meet the criteria. The City Council is already working to cut emissions from Denver’s large commercial and multi-family buildings. New building codes approved in January will phase out gas furnaces and water heaters in new construction…The last step of that process, outgoing City Councilman Jolon Clark said, would likely be replacing gas furnaces and water heaters in existing buildings, particularly homes…
Other things the next mayor and City Council members could do to cut emissions, Katz added, would be to continue offering rebates for residents looking to buy electric bicycles. They could also work to limit or phase out the use of gas-powered leaf blowers and lawnmowers…
On a day in late May [2022] when wildfire smoke obscured the throat of an ancient volcano called Shiprock in the distance, I visited the Ute Mountain Ute farming and ranching operation in the southwestern corner of Colorado. Photo credit: Allen Best/Big Pivots
More than 150 years ago, the U.S. government and the tribe signed treaties that promised the tribe a “permanent home” — a promise the Navajo Nation says includes a sufficient supply of water. The tribe says the government broke its promise to ensure the tribe has enough water and that people are suffering as a result. The federal government disputes that claim. And states, such as Arizona, California and Nevada, argue that more water for the Navajo Nation would cut into already scarce supplies for cities, agriculture and business growth…
The high court will hold oral arguments Monday in a case with critical implications for how water from the drought-stricken Colorado River is shared and the extent of the U.S. government’s obligations to Native American tribes. A win for the Navajo Nation won’t directly result in more water for the roughly 175,000 people who live on the largest reservation in the U.S. But it’s a piece of what has been a multi-faceted approach over decades to obtain a basic need…
DigDeep, which filed a legal brief in support of the Navajo Nation’s case, has worked to help tribal members gain access to water as larger water-rights claims are pressed…
Installing pipe along the Navajo-Gallup Water Supply Project. Photo credit: USBR
Extending water lines to the sparsely populated sections of the 27,000 square-mile (69,000 square-kilometer) reservation that spans three states is difficult and costly. But tribal officials say additional water supplies would help ease the burden and create equity.
“You drive to Flagstaff, you drive to Albuquerque, you drive to Phoenix, there is water everywhere, everything is green, everything is watered up,” said Rex Kontz, deputy general manager of the Navajo Tribal Utility Authority. “You don’t see that on Navajo.”
[…]
For decades, the Navajo Nation has fought for access to surface water, including the Colorado River and its tributaries, that it can pipe to more remote locations for homes, businesses and government offices.
Many Indian reservations are located in or near contentious river basins where demand for water outstrips supply. Map courtesy of the Bureau of Reclamation.
Another round of powerful atmospheric rivers is hitting California, following storms in January and February 2023 that dumped record amounts of snow. This time, the storms are warmer, and they are triggering flood warnings as they bring rain higher into the mountains – on top of the snowpack.
Professor Keith Musselman, who studies water and climate change at the University of Colorado’s Institute of Arctic and Alpine Research, explained the complex risks rain on snow creates and how they might change in a warming climate.
What happens when rain falls on snowpack?
For much of the United States, storms with heavy rainfall can coincide with seasonal snow cover. When that happens, the resulting runoff of water can be much greater than what is produced from rain or snowmelt alone. The combination has resulted in some of the nation’s most destructive and costly floods, including the 1996 Midwest floods and the 2017 flood that damaged California’s Oroville Dam.
Contrary to common belief, rainfall itself has limited energy to melt snow. Rather, it is the warm temperatures, strong winds and high humidity, which can transport substantial energy in the form of latent and sensible heat, that predominantly drive snowmelt during rain-on-snow events.
Snowpack has air spaces that water can move through. As the rain falls, the water can travel relatively rapidly through the snowpack’s layers to reach the underlying soil. How streams respond to that runoff depends on how much water is already flowing and how saturated the soil is.
When the soil isn’t yet saturated, it can dampen or delay a flood response by soaking up rain and melting snow. But when the ground is saturated, snowmelt combined with rain can lead to fast and devastating flooding.
One of the challenges for dealing with these rain-on-snow events is that the flood risk is hard to forecast.
To predict whether a flood will occur requires knowledge of weather and hydrological conditions. It requires knowing the soil moisture and snowpack conditions before the storm, the elevation at which rain transitions to snow, the rainfall rate, the wind speed, air temperature and humidity, and estimates of how those factors contribute to snowmelt. Additionally, each factor varies in time during a storm and varies in complex ways, especially across a mountainous landscape.
This is why rain-on-snow floods are characterized as compound extreme events. Despite the extensive damage they can cause, it may be surprising how little is known about how they vary in time, spatial extent and intensity.
California is getting another atmospheric river, with more rain on snow expected. How does the rain-on-snow effect differ by elevation in the mountains there?
In the California mountains right now, it’s the middle elevations that people need to pay attention to.
The lower elevations have primarily seen rainfall rather than snow, so there is less snowpack to melt. And in the highest elevations, colder temperatures promote the continued accumulation of deep snowpack and rainfall is less likely.
In the middle transition zone – where either substantial rainfall or snowfall can occur – rain-on-snow events are most common, causing both melting and risk of roof collapses.
If all storms were created equal, there would be well-defined rain zones and snow zones, and the rain-on-snow flood risk would be low. But that isn’t what happens. Instead, not only does the snow zone elevation vary during an event, but it also varies substantially from one storm to the next.
The most destructive rain-on-snow events occur when rivers are already running high and soils are saturated, which can occur in response to a series of warm atmospheric rivers interacting with a deep snowpack – like California’s mountains have right now. The order in which these storms occur – or the storm sequencing – is especially important for assessing flood risk because these events are, in part, caused by rapid shifts between cold periods of snow accumulation followed by warm rainfall events.
What does research show about the future risk of rain-on-snow events in a warming climate?
Even less is known about how rain-on-snow flood risk may respond as the planet warms.
In a warmer climate, there will be less risk of rain falling on snow in the lower elevations as the snowpack declines, particularly in warmer regions such as the Pacific Northwest.
But at higher elevations, more frequent rain-on-snow events are expected. While warmer temperatures are expected to increase rainfall intensity, research shows that’s not the most important driver of this risk. Much of the expected increase in rain-on-snow flood risk is a result of the rain-snow transition zone expanding higher in elevation to include alpine areas that historically received predominantly snowfall.
Flood control and reservoir management systems in these mountainous regions will have to consider these future changes in rain-on-snow events – in addition to changes in rainfall intensity and storm sequencing – to fully understand and prepare for the local flood risk as the planet warms.
So, will projected increases in precipitation extremes and winter rainfall increase rain-on-snow occurrence and the associated flood risk? Or will less snow cover and larger soil moisture deficits reduce rain-on-snow flood risk in a warmer climate?
In a future climate, the response of rain-on-snow flood risk is expected to change in complex and often contradictory ways. The projected changes are likely to vary by region, season, climate model, emissions scenario and future time horizon. It’s a costly risk that requires more research.
A flight from NASA’s Airborne Snow Observatory in 2019 gathers data about the snowpack above Dillon Reservoir on a flight. Information gathered from the flight helped Denver Water manage reservoir operations. Photo courtesy of Quantum Spatial
An important tool for the management of water in Colorado has received a funding boost from Northern Water.
On Feb. 9, the Northern Water Board authorized spending $150,000 on the Airborne Snow Observatories program for flights over the watersheds that feed the Colorado-Big Thompson Project. Statewide, flights are planned across 11 river basins.
The program involves the use of a specialized airplane that flies over high-altitude watersheds and uses radar to measure the depth and density of snow across wide areas. The data acquired during flights in April and May will help water managers predict runoff and streamflow through the next few months.
This effort improves on the single-point snow observations that are part of the SNOTEL network and other data points that can have a larger amount of uncertainty based on localized conditions.
Agency partners for the work in the C-BT Project watersheds include the St. Vrain and Left Hand Water Conservancy District, Denver Water, Colorado Water Conservation Board and the Colorado River Water Conservation District. Other agencies are also looking to create a sustainable statewide program in future years.
Colorado Capitol Dome from the south. Photo credit: Allen Best/Big Pivots
Click the link to read the article on the Big Pivots website (Allen Best):
On the first Friday in January, three days before she was sworn in as a new state representative from Denver’s south metro area, Ruby Dickson was part of a tour of relatively new businesses in the Boulder area.
This was not your typical chamber of commerce tour, though. It had been organized by then State Rep. Tracey Bernett, who had taken an extraordinary interest in climate change legislation during her first two years in the General Assembly.
The four businesses had in common the goal of drawing carbon dioxide from the air, in the case of one business through the technique of biochar, or creating new processes that eliminated need for emissions such as exist now with virgin steel-making.
If ebullient during the tour, Bernett was under a storm cloud, accused by the district attorney in Boulder County of falsely claiming residency in Louisville, a part of her old district but apart from her home near Longmont that had been put into a new district. Two days later, she resigned.
In leaving, she handed off an idea for legislation to the incoming representative Dickson.
That bill, HB23-1210, “Carbon Management,” easily passed its first legislative test on March 9, getting approval from the House Energy and Environment Committee in an 8-3 vote.
Biochar projects such as this one near Berthoud would be eligible for state funding under the proposed legislation. Photo/Allen Best
If it becomes law, the legislation will crack the door open in Colorado for new technologies and practices that many climate change activists insist will be necessary for the state to meet its mid-century decarbonization goals. But many activists who worry just as intensely about the risks of climate change are convinced it’s a misstep.
The bill has two components. One would make “carbon management projects” eligible for grants under the state Clean Air Program that was established by legislators in 2022 with funding of $25 million. Potential applications among the 11 defined in the bill include bioenergy with carbon capture and storage, durable geological carbon sequestration, and direct air capture and storage.
Enhanced oil recovery—a practice that has provoked hurricane-strength opposition in other places—is expressly excluded from potential grant application.
The program requires cash matches to the grants before the program expires in 2028. The first round of grants will become available in spring 2023.
The second major component of the bill directs the Colorado Energy Office to work with a contractor to create a carbon management roadmap in consultation with stakeholders. It is to be delivered to legislators by February 2025.
This proposed roadmap would be an extension of and complementary to the legislative recommendations issued in late February by the Colorado Oil and Gas Conservation Commission. That 67-page document, “Creating Colorado’s Carbon Sequestration Framework,” goes into great detail regarding the questions that Colorado must resolve if it is to find ways to sequester carbon emission from hard-to-decarbonize sectors in decades ahead.
That new report was triggered specifically by Colorado’s landmark legislation in 2019 that adopted sweeping economy-wise carbon reduction goals for 2025, 2030, and 2050.
An economist, Dickson has a master’s degree from Oxford and, according to her LinkedIn profile, seems to speak Chinese. The thesis for her undergraduate degree was an analysis of Chinese citizens’ investment habits.
She’s a researcher for Rethink Priorities, a consultancy that tries to help organizations identify what resources would be most effective in addressing animal welfare, climate change, and other causes.
Ruby Dickson.
“A lot of the things I’ve worked on involve climate change,” she said in an interview with Big Pivots several days prior to the committee hearing. “I have worked on carbon management technology from that perspective. That is why I was so eager to work on this when I went into the Legislature this year.”
Told that Sen. Chris Hansen had been engaged in something similar, she went to him to solicit interest in a co-sponsorship.
“It was a pretty easy conversation,” she reported.
Dickson in the interview stressed the stopping of further emissions and then actually removing emissions from the air. “There are a lot of potential solutions here, and we shouldn’t leave any stone unturned,” she said.
When this reporter suggested she expect an 8-3 vote along party lines, the three Republicans on the committee all in opposition, she said she reserved hope. One of her bills, regarding work force transition, had gained unanimous Republican support in its committee hearing, she noted.
In this case, though, she was wrong—although Rep. Ty Winter, a rancher from the natural-gas rich Las Animas County whose district extends from Trinidad to the Kansas border, did tell her that he appreciated her efforts to consider the needs of his rural constituents.
“Respectfully no, but I appreciate you thinking about this stuff,” he said in explaining his vote.
Dickson had said that many of the people who would most benefit from and take advantage of the new technologies would be rural people “and people whose jobs are being affected by the transition away from fossil fuels.”
In her opening pitch to the committee, Dickson emphasized both the emergency and the opportunity.
“We really need to set our sights on a net-zero goal very soon,” she said. Colorado, she went on, has an abundance of resources to achieve this, both solar and wind, but potential geologic reservoirs, underground geological formations where carbon emissions can be stowed with some confidence that they will not find their way to the surface. The Canon City Embayment is the most prominent such geological formation in Colorado, but there are others.
Dickson also talked about Colorado’s highly-educated demographics but also the workers being disrupted by the new energy economy. This bill, she said, recognizes the need for guardrails to consider environmental justice. She talked about extensive conversations with environmental and labor groups, and the potential to create well-paying jobs.
This will not pose a cost to Colorado. “I also think there is something to be said for doing our part for the climate crisis and because it’s the right thing to do.”
Where this will go, she acknowledged, is unclear.
“We don’t know what it will look like over the next couple of decades. It could end up being a serious positive for our economy here. We have so many advantages.”
And her takeaways:
“This is the first step in making Colorado the national and even global leader in carbon management,” she said.
“We need to push down the cost curve by learning by doing,” she said, anticipating one counterargument.
The Carbon Management bill specifically excludes enhanced oil recovery from eligibility for grants under Colorado’s Clean Air Program. Photo credit: Allen Best/Big Pivots
Dickson’s bill did get pushback, primarily from the hardest-core environmental activists who, in an unusual way, found common ground with the Legislature’s most ardent climate change denier.
Rep. Ken DeGraaf, who is from Colorado Springs, used the occasion to again suggest that carbon dioxide is not a problem to human health until it gets to be something like 12,000 parts per million. And, he suggested when quizzing witnesses, wasn’t this an extravagant cost for Colorado to attempt to trim emissions when it would make very little difference anyway on a global scale?
Morey Wolfson, who has been in Colorado’s environmental trenches for about 50 years, had testified that carbon removal is extravagantly expensive.
“Here’s the math,” he said. To reduce atmospheric carbon dioxide concentrations, now at 420 parts per million, by just one part, will require removal of 8 billion tons at a cost of $100 per ton. That, he said, will cost $800 billion. “Your state budget is $42 billion.”
“There are so many inexpensive ways to not put carbon into the atmosphere in the first place,” he said.
Jan Rose, from the Colorado Coalition for a Livable Climate, warned that the bill lacked the guardrails needed when moving carbon dioxide around in a gaseous form. She also suggested room for missteps. “I see red flashing signs that say Solyndra,” she said,
referring to California solar company that filed for bankruptcy in 2011, defaulting on $535 million in federal loans.
Leslie Glustrom, testifying on behalf of Clean Energy Action, urged amendments to recognize risks. “If your pipeline breaks, your local concentrations are high enough to kill you,” she warned.
“Prioritize public health and safety first” before enabling companies to chase the Q4 tax credits delivered by the Inflation Reduction Act, she said. The IRA provides tax credits designed to encourage innovation of carbon-removal technologies.
Glustrom also warned against “group think behavior”—a statement again seized upon by DeGraaf, who reporting seeing a “large degree of group think” in play.
Wolfson, too, warned of the “bandwagon effect.”
“Those who support carbon dioxide removal and carbon capture and sequestration, 99% have not done the math that I am talking about,” he said. “I have read thousands of articles, and only 1% of the articles ever tell you that removing 1 ppm will cost you $800 billion.”
Several other witnesses pushed back. Christopher Neidl, who describes himself as a carbon removal evangelist from Austin, Texas, downplayed the the threat from leaks from pipelines.
“They’re not exactly an enormous health threat,” he said. He urged approval of the bill so that “Colorado is in the front of the line instead of being a taker of the technology when it comes.”
Individuals from a new organization called the Signal Tech Coalition also testified. “We are not going to meet our climate goals without carbon removal technologies,” said Quinn Antus, the co-founder and executive director.
The Polis administration has also endorsed the bill’s contents. Keith Hay, the senior director of policy at the Colorado Energy Office, called it an “important first step” to reduction of emissions from economic sectors of Colorado’s economy that will be particularly difficult to decarbonize.
“It sends a signal to the marketplace that Colorado is serious about creating a marketplace for the technologies and that jobs that come with it,” he said. He also noted a “number of Fortune 500 companies that are looking to move into a state with carbon capture technologies.”
Representatives from the Blue-Green Alliance; Healthy Air Water Colorado; Boulder County; Colorado Communities for Climate Action; and Xcel Energy also testified in support. The Xcel rep said that this was among the technologies that it is monitoring and evaluating.
Dickson wrapped up her case by citing a study by Lazard, the consultancy, that found solar prices had dropped 99.5% between 1975 and 2019. ($115/watt to 27 cents/watt). On-shore wind dropped 70% from 2009 to 2021.
The cost of this large-scale drawdown, she said can’t be known now. “But I would guess—and I think a lot of the data show—that the more we try, the cheaper it is going to be.”
This is from Big Pivots 70. Please consider subscribing.
As the votes were taken, there was one interesting additional interplay.
McGraaf dismissed the value of such work. He also said he was “just not a fan of government interference in the market, as was brought up with the Solyndra example that was cited. I am not a fan of government picking winners or losers.”
Rep. Mike Weissman had a lengthy response. He addressed the roadmap and the “very broad spectrum of potential technologies,” and suggested there will be “downstream policy choices and investment choices that we could make.”
Then he addressed the idea of markets free of policy choices. “Frankly, we never have had a free market for energy policy in this country in a couple of key perspectives. We have never adequately internalized the cost of pollution with anything we do, and that’s why we are here today. We have also made policy choices, from the very earliest phase of our country in terms of subsidizing different things.”
Weissman then went on to describe various policies from the opening of federal lands for coal extraction beginning in 1840 to the Energy Act of 2005 that all, in some way, subsidized fossil fuel extraction and use.
“And on and on and on and on,” he continued.
“The question is not whether policy has something to say what about how the market works and energy, but what we say.”
This hayfield near Rifle is irrigated with water from a tributary of the Colorado River. West Slope water managers say they are being left out of the process to review and approve applications of a water conservation program. CREDIT: HEATHER SACKETT/ASPEN JOURNALISM
West Slope water managers say they are being cut out of the process to review and approve applications for a federally funded conservation program, even though a state official had previously promised they could participate.
Colorado Water Conservation Board (CWCB) Executive Director and Colorado commissioner to the Upper Colorado River Commission (UCRC) Becky Mitchell had assured the Glenwood Springs-based Colorado River Water Conservation District and the Durango-based Southwestern Water Conservation District that they would have a say in reviewing and approving projects for the rebooted System Conservation Program within their boundaries. But it now appears that the districts’ role will be limited to providing input to the UCRC on the applications, for which limited public information has been released.
The Colorado River Water Conservation District spans 15 Western Slope counties. Voters across the district are considering a mill-levy increase that would raise the River District’s budget by $5 million, funding a variety of water-related projects.
Colorado River District/Courtesy image
A Dec. 6, 2022 email from Mitchell to Southwestern’s General Manager Steve Wolff and River District General Manager Andy Mueller said that in the event a “prospective applicant’s SCPP project is located within the boundaries of the district, enrollment in the SCPP will be subject to approval of the application by both the CWCB and the District.”
Mitchell had also said publicly at meetings and conferences that the conservation districts would have a say on projects within their boundaries, and a Jan. 23 CWCB memo says that “Commissioner Mitchell and staff will work closely with the conservation and conservancy districts within which projects are located in the project approval process.”
In anticipation of reviewing project applications, the River District developed its own set of criteria on which to evaluate them. Those criteria go further than the UCRC’s in specifying who would benefit from the SCP program payments and preventing too much participation in a single basin. The River District works to protect and develop water within its 15 Western Slope counties.
But in a March 10 letter to both conservation districts, Mitchell walked back her promise of their significant involvement. She said only the UCRC’s criteria — not the criteria developed by the River District — can be used in considering project approval.
“I recognize the attention that the Colorado River District staff and the Southwestern Water Conservation District staff have given to these issues,” the letter reads. “However, to ensure compliance with reauthorizing federal legislation, the only criteria that may be applied are contained in the Funding Agreement and Request for Proposals. Further, it is the UCRC that is required to determine whether a project meets those criteria.”
The River District discussed the issue at a board meeting Thursday.
“I think that was disturbing to us because it was a reversal of a commitment that had been made in early December by the commissioner,” Mueller said. “There is a complete lack of process within our state reviewing this program or the potential impacts to other water users. … There is no analysis done whatsoever to protect communities.”
Paying water users to irrigate less has long been controversial on the Western Slope, with fears that these temporary and voluntary programs could lead to a permanent “buy and dry” situation that would negatively impact rural farming and ranching communities.
River District staff said they have still not seen any completed SCP applications for projects within their boundaries.
The River District board on Thursday voted that if and when the project applications become publicly available, the River District will review them and provide feedback that the UCRC criteria does not go far enough to consider the impacts within the state of Colorado. The board also voted to provide a response to Mitchell’s March 10 letter.
Wolff replied to Mitchell’s letter asking her to reconsider her position and reaffirm her commitment to the districts that they would have a meaningful role in the approval process.
“(We) have not found anything to support the position described in your letter,” Wolff’s response reads. “To the contrary, the UCRC Facilitation Agreement and related documents appear to provide a robust role for each state for evaluating projects within its boundaries…”
Water levels in Lake Powell, seen here in May 2022, have fallen to historic lows. A water conservation program run by the Upper Colorado River Commission is aimed at boosting reservoir levels. May 2022 photo/Allen Best
CWCB approval
The Colorado Water Conservation Board voted unanimously on Wednesday to designate projects that are participating in the rebooted SCP as falling under the umbrella of a “state-approved water conservation program.” That means that water users who choose to get paid to cut back won’t see their water right affected for participating. Under Colorado’s abandonment or “use it or lose it” principle, water rights holders must continue to put their water to beneficial use if they want to keep their water right.
The System Conservation Program was restarted as part of the UCRC’s 5-Point Plan, which is aimed at protecting critical elevations in the nation’s two largest and depleted reservoirs, lakes Powell and Mead. The program will be paid for with $125 million in federal funding from the Inflation Reduction Act and will pay water users in the upper basin states — Colorado, Utah, New Mexico and Wyoming — to cut back.
The UCRC is a Salt Lake City-based interstate water administrative agency established by the 1948 Upper Colorado River Basin Compact. Its role is to ensure the appropriate allocation of water from the Colorado River to the upper basin states and compliance with the 1922 Colorado River Compact.
The UCRC unveiled its 5-Point Plan in July in response to calls for conservation from the federal government to address the crisis on the Colorado River and plummeting reservoir levels that threaten the ability to make hydroelectric power. The Bureau of Reclamation designated the UCRC as the administrator of the rebooted conservation program and it began accepting applications in December.
The scope of what CWCB approved this week was narrow; they did not approve the individual applications for the SCP. That responsibility for final approval, as Mitchell’s March 10 letter notes, lies solely with the UCRC.
Mitchell said at Wednesday’s CWCB meeting that although the conservation districts would not be approving projects, she would still take input from them. Her March 10 letter invites the districts to participate in the approval process under the same narrow scope as CWCB by designating the SCP as a “state-approved water conservation program,” which protects against abandonment.
Mitchell added that she has requested that the meeting where the UCRC makes the decisions about which projects to approve be open to the public and that the applications be made publicly available, with personal information of applicants redacted. The status of that request was unclear as of Friday afternoon.
“If we were to do this again… I would ask that the applications be transparent from the beginning with the personal information redacted,” Mitchell said. “That is not the way we did it this time.”
At Wednesday’s CWCB meeting, River District General Counsel Peter Fleming asked the board to postpone the approval that protects water users from abandonment by two weeks. He added that there were “heated controversies” about system conservation in western Colorado and that the tight timeline has put everyone in a pressure cooker.
He said the criteria the UCRC is using to evaluate applications is focused on getting water downstream, not on preventing issues within Colorado like potential injury to other water users.
“Our view is that both the water conservation board and the districts have a higher level of input and activity than simply the determination as to whether the proposed system conservation projects fall within the (definition of a state-approved conservation program),” he said. “The delay would give us a little time to work that through in cooperation with the CWCB for the benefit of the entire state and our shared constituents.”
Beth Van Vurst, counsel for Southwestern Water Conservation District, said the district needs additional information on the project proposals.
“We haven’t seen the applications, we haven’t seen any operating plans, we haven’t seen any details,” she said. “Without that information, I don’t know how the Southwest board could determine whether or not these projects warrant protection under state law.”
Raymond Langstaff irrigates his fields outside of Rifle in May 2022. A water conservation program that pays irrigators to use less water from the Colorado River will have little oversight from West Slope water managers.
CREDIT: HEATHER SACKETT/ASPEN JOURNALISM
Crop switching proposals
The CWCB released some details related to the 36 Colorado project applications that are currently being reviewed by the UCRC. Those which have preliminary approval from UCRC could save up to 9,618 acre-feet of water, according to a March 15 memo. Of the 36 proposals, 19 propose to halt irrigating for the entire season and nine propose to stop irrigating for part of the season, according to a CWCB breakdown.
Eight of the proposed projects are in the southwest corner of the state, within the bounds of the Southwestern Water Conservation District, and get their irrigation water from the Dolores Project. These projects are proposing switching crops from thirsty alfalfa to other forage crops like Sudan grass that use less water. Altogether, the eight projects are estimated to save 791 acre-feet of water.
Greg Peterson, executive director of the Colorado Ag-Water Alliance, organized the Dolores projects and helped irrigators submit applications. He said they are asking for $200 per acre-foot of water, which is calculated to represent the cost of switching crops. If the new forage crops end up being as profitable or more profitable than alfalfa, irrigators will probably make the switch permanent, Peterson said.
“If they can go back and look at the costs and revenues associated with it, they don’t need to be paid again to do this,” he said. “They will just do it because it’s profitable for them. We are paying for them to take a risk.”
Some irrigators with the Dolores Project, which delivers water stored in McPhee Reservoir to the Dove Creek area, Montezuma Valley and Ute Mountain Ute Indian Reservation, have experienced water shortages in recent drought years. In 2021, some farmers received only 10% of their water allocation. Switching to less thirsty crops helps them to adapt to an increasingly water-short future under climate change, Peterson said.
“They are in a pretty rough situation,” Peterson said. “Long-term it’s looking like you might not get the water in that system that you’re used to. In the southwest particularly it’s become a really rough climate for alfalfa if you don’t have the water.”
Aspen Journalism covers water and rivers in collaboration with The Aspen Times.
Navajo Mountain March 2023. Jonathan P. Thompson photo.
Click the link to read the article on the Land Desk website (Jonathan P. Thompson):
The rain was relentless, falling steadily and cold from the soggy frogbelly sky all night and all day and all night again. It turned snowy fields into swampy mud bogs and somehow rendered more grisly the decaying elk carcass behind the house — slowly being dismantled by a bobcat, coyotes, neighboring dogs, bacteria and a flock of chattering magpies. In much the same way, the gray-chill drizzle turned a lingering heartache into a throbbing void.
I had to get out. So I did what people do. I got in the Silver Bullet and drove west.
It quickly became clear that the snow line had been only a few hundred feet above Durango, sparing high country folks from some of the rain-induced misery. The La Plata Mountains sparkled under the fresh icing and a post-storm mist softened all the edges as the sun finally burned through low clouds. Skiers lined up to get first tracks at Hesperus. The road was wet with slushy shoulders and it clearly had been a treacherous mess only hours earlier. I shuddered and slowed as I passed the carnage of a previous night’s crash: On one side of the highway a pickup truck’s bed was gnarled beyond recognition while on the other a crumpled semi truck’s cab had lodged itself between two ponderosa pines.
San Juan River Basin. Graphic credit Wikipedia.
The aridification of the last couple decades has hit the La Platas especially hard. Even when the southwest Colorado range gets good snow, it tends to melt out more quickly than in the higher mountains to the north, leaving little more than trickles in the La Plata and Mancos River beds come mid-summer. But this year the range has been a major beneficiary of the abundance: The Columbus Basin SNOTEL station is now recording snow water equivalents far above the median peak, which usually happens in mid-April.
Light fog enveloped Mancos Hill and I worried for a moment that I would never escape its depressive hold. But then, just outside Mancos, blue sky and the snow-covered form of Ute Mountain, veiled with clouds.
Just west of Cortez a warning of sorts to not leave the pavement without assessing the solidity of the road: Not one, but two trucks up to their axles in red, goopy, shoe-stealing mud in someone’s driveway. I later read that those folks were relatively lucky. The night before a giant sinkhole had formed on a county road north of Cortez and a motorist drove into it. Another highway in the county was closed due to flooding.
Grass and McElmo Creek, March 16, 2023. Jonathan P. Thompson photo.
I half-expected the apricot trees to be blooming in McElmo Canyon, but the only sign that spring was imminent was the pinot noir-hue the willows take on this time of year, when the earth thaws and the days grow longer. Soon it will all be carpeted with green contrasting with the pink sandstone.
McElmo Creek raged as it wound its way through beige fields and cottonwood groves, past beat-up single-wides and million-dollar spreads, among willows and the rare un-grazed patch of tall grass. I pulled over tentatively, praying that the graveled pullout wouldn’t turn to liquid under the wheels. It held, but when I tried to walk up a little trail to a Puebloan site, my shoes caked up with wet, sticky clay. I took a picture of the creek, instead, which peaked at 534 cubic feet per second during this storm, higher even than during last summer’s monsoon. San Juan River spring break rafters will get a nice boost from the elevated flows, though rowing through the storm must have been a nightmare.
Comb Ridge and the Abajos under a cloudless blue sky. Jonathan P. Thompson photo.
The landscape looked drier as I progressed westward, but it wasn’t. Every pothole on every stretch of slickrock held a liquid mirror reflecting the cloud-dappled blue sky. I gazed with wonder at a group of cowpokes driving a herd of healthy-looking black cattle through the sagebrush near Butler Wash. How did they keep from sinking up to the horses’ bellies?
Comb Wash was a roiling red river. Any designs I may have had on camping in Valley of the Gods were foiled by a stream crossing the road. Camping anywhere off the asphalt was out of the question, really; I’d have to find a hotel room in Page, instead. The good news is that the moisture kept the blistering winds from lifting up the desert dust and depositing on all that snow.
The Bears Ears were covered in white; the Abajos snowier than I’ve ever seen; Navajo Mountain rose up glistening from the burnished red earth.
Path Dependence. Photo credit: John Fleck/Inkstain
Click the link to read the article on the InkStain website (John Fleck):
Apologies, no tl;dr is possible. To borrow from Blaise Pascal, I would have written a shorter blog post, but I did not have the time.
On a bike ride a week ago I took a favorite “long cut” (the slow ways are mostly better, best to not be in a hurry) through downtown Albuquerque.
Crossing the railroad tracks I saw two trains, sitting, and pulled over waiting to watch them roll past me. I love watching giant trains roll past me when I’m little and on two wheels.
But the trains just sat.
It’s a metaphor for something. Bear with me while I try to work out what.
SPANDRELS AND PATH DEPENDENCE
We put the trains in this particular spot 140-plus years ago, and spread a creation called “New Town” around them, for reasons that were in part grounded in the natural geography of the place, and in part grounded in accidents of history.
The Atchison, Topeka, & Santa Fe Railway blasted through New Mexico in the 1880s on its way to California and wealth creation. It didn’t much care about New Mexico, or Albuquerque, or this particular spot on the landscape where I took the above picture, other than the fact that we were between their “Point A” and “Point B”. That’s the accident of history. In retrospect there were probably better routes, but the AT&SF was in a hurry. But given that they were headed down our way, this particular spot – on slightly higher ground at the edge of the valley floor – made geographic sense. The downtown was built there because it was a swamp and the land was cheap.
To read common histories of Albuquerque is to see some intentionality about the form of our city, not some happenstance, because dadgum we were getting a railroad and it was gonna make this place!
We pretty much never get freight any more on this stretch of the route, but we’ve neatly (and expensively) repurposed the tracks as a regular Albuquerque<->Santa Fe commuter train, ideal for extending the range of Scot and John’s Sunday bike rides as their old guy legs inexorably age. Stephen Jay Gould and Richard Lewontin describe things like this as “spandrels” – things that in retrospect suggest intentionality in their design, but are really happily repurposed accidents. I’ll try to get back to this.
The underlying point here is two-fold: first, that once the tracks are here, they’re here, in this spot. That’s “path dependence”. The second point is that our success or failure going forward depends on our ability to successfully repurpose stuff like this. Like Scot and I catching the train up to Bernalillo on a lovely Sunday morning and then riding back down the valley. One might call this “adaptive capacity”.
“THE LAW IS AN ASS”
Lake Mead, December 2022. It’s not about the bike. Photo credit: John Fleck/Inkstain
Back in December, the Department of Interior asked us all to offer our suggestions for staving off deadpool on the Colorado River.
I wrote mine mostly in a covid haze, a three-day blitz between the end of the Colorado River Water Users Association meeting in Las Vegas and Interior’s deadline, having contracted the disease in the halls of Caesar’s Palace. In other words, my comments were written in an intense fever, lying in bed with Paxlovid and a laptop staring at my crazy spreadsheets and and federal regulatory text and optimization models and feeling like a wonky Hunter S. Thompson, all “Fear and Loathing” but without the fun parts.
There’s moment in that opening passage of “Fear and Loathing in Las Vegas” where our author and guide is heading up Interstate 15 from LA to Las Vegas when the drugs start kicking in.
My “swooping and screeching bats” moment came a day after my traditional leisurely drive toward “CRWUA” – (we say it “crew-uh”). I avoided the problems associated with Thompson’s use of mind-altering chemicals on the drive to Vegas – it is a function of privilege and luck that I happily enjoyed that portion of my life in my youth, while escaping it relatively unscathed. But sans pharmaceuticals, my annual December drive to Las Vegas plays a similar narrative role – leaving one world behind and entering another.
Hunter S. Thompson at Caesars Palace in Las Vegas in 1971; allegedly in the public domain, via Wikimedia
My “swooping and screeching bats” moment came a day after my traditional leisurely drive toward “CRWUA” – (we say it “crew-uh”). I avoided the problems associated with Thompson’s use of mind-altering chemicals on the drive to Vegas – it is a function of privilege and luck that I happily enjoyed that portion of my life in my youth, while escaping it relatively unscathed. But sans pharmaceuticals, my annual December drive to Las Vegas plays a similar narrative role – leaving one world behind and entering another.
I had stayed out in Boulder City, as is my way (note “best not to be in a hurry”) and spent the day before CRWUA on a bike ride along the edge of Lake Mead, counting sunken speed boats emerging from the bed of the reservoir as it plunges toward deadpool. (“sunken speed boats” = “swooping and screeching bats”)
I am not, for a variety of reasons (and largely for the better) the sort of Hunter S. Thompson-esque sort of writer that a young John imagined becoming. But hold in your mind the fever-induced screeching bats in my head as I stared at my crazy spreadsheets and wrote this in my comments to the Department of the Interior:
“We as a community have made mistakes in managing the Colorado River, and we are now at the mercy of those mistakes. We cannot undo them, but we must learn from them. The heart of our mistakes is this: we have obeyed a Law of the River that, year after year, permitted us to remove more water from the Colorado River than nature provided. We now understand, to our great regret and peril, that the law is an ass.”
FRIDAY AFTERNOON AT “THE FLECK-BERRENS LAB”
Friday afternoons have become my favorite bit of the week, as my colleague Bob Berrens and I, along with a handful of students who are helping us, gather in the University of New Mexico Water Resources Program computer lab/lounge to….
Well, it turns out that it’s hard to explain what is happening there. I guess “try to figure stuff out”?
Friday our student “A” (Bob is stuck with his adjacency to my crazy public-facing life, but I’ve not asked my students’ permission to drag them into this) was nimbly pulling up and analyzing maps of domestic wells in greater Albuquerque’s Rio Grande valley as we tried to sort through questions of water allocation rules and “the distribution of green”.
I have an intellectual tendency, which Bob has helpfully pointed out by way of literary reference, to assuming that stuff is the way it is because it’s sort of “for the best”.
Gould and Lewontin and Bob all quote on this Dr. Pangloss of Voltaire’s Candide:
Candide’s hilarious, and Voltaire is mocking, but you can find this teleological tendency in both economics and evolutionary biology, and our wrestling with the questions is converging right now in the final chapter of the new book Bob and I are writing about the relationship between Albuquerque’s century-old water institutions and its modern urban form.
The issue was on full display Friday afternoon as, Pangloss-like, I rose to the defense of a set of rules that allows domestic wells in New Mexico, basically no questions asked.
My argument was to the benefits this has conveyed – the lovely community of Corrales, leafy and easy. We’re trying to get our arms around the “non-market” values conveyed by water, that we avoid the trap of only analyzing the value of water/greenness in narrow terms of crops sales. Look at all that lovely non-market value in Corrales!
It’s a very Panglossian argument, not exactly one I believe. I’ve been fiercely complaining about New Mexico’s domestic well statutes on equity grounds – we find them, and their green space, concentrated in the metro area’s most affluent neighborhoods. But picking sides and pushing through the details of an argument is how we make progress – as a journalist, it was my job to deeply entertain and be able to explain everyone’s arguments, most especially those with which I disagreed.
Understanding the arrows of causality is tricky here, but like noses and spectacles, there’s an intimate connection between domestic wells and the leafy affluence of our metro area’s valley floor.
There, I hung my argument from a peg of “fairness”.
Like the residents of Corrales, California is exploiting old rules written at a different time and for different purposes to enjoy water while pushing the burdens of the impacts of climate change onto others.
That just feels wrong.
INSTITUTIONS AS THE ‘CARRIERS OF HISTORY’
Bob – who is a great teacher, our collaboration feels a bit like a ten-year rolling graduate seminar – recently turned me on to a useful 1994 essay by an economist named Paul David about the role of institutions as “carriers of history”.
David contrasts a “teleological” with a “genealogical” mode of thinking about these things.
By teleological, he’s kinda talking about Dr. Pangloss’s spectacles,
In contrast, the genealogical approach
Thus we have leafy green affluence in Corrales and leafy green alfalfa in the Imperial Valley because institutional path dependence is a “carrier of history”.
WHEN INSTITUTIONS BECOME MALADAPTIVE: THE “TRANSITIONAL GAINS TRAP”
In a classic 2012 paper, the late Elinor Ostrom offered the version I most like of her ever-evolving “design principles” for resource institutions. This is the version I cited in my 2016 book Water is For Fighting Over, the one I have students read and apply. The final bullet seems relevant to the current discussion:
In the case of the leafy neighborhoods of Corrales and the leafy alfalfa fields of Imperial, we have a new “external … constraint” – there’s not enough water!
But our current institutional framework seems to lack a way to change the rules.
My “the law is an ass but we’re following it anyway down to dead pool” point in my Supplemental EIS comment is essentially the result of me doing the same sort of “use Ostrom’s bullets!” technique I assign to my students.
In an email exchange following my Times piece, a friendly and thoughtful critic suggested that for “alfalfa” in my Times piece we might more broadly substitute the word “property”.
In a 1975 paper, Gorden Tullock defined a thing he called “the transitional gains trap” that I think sheds light on what’s going on here.
It involves an institutional arrangement that conveys some benefit to an individual or a group of individuals. They optimize around it, and the benefit becomes locked in:
The value of all that massive federal subsidy in water development has been fully capitalized in the value of a patch of farmland in the Imperial Valley. The value of a permissive domestic well statute has been fully capitalized in the value of a home in Corrales.
The transitional gains trap may help explain why Ostrom’s design principle – the ability of an allocation system to adapt over time – is so hard to achieve in the cases I’m describing. It’s path dependence. People have optimized around the current rules. Both the landowners in Imperial and the homeowners in Corrales seem to have political blocking power (more theory here! the “tragedy of the anticommons”! notable that I have very little theory in my toolkit that has not been gifted to me by my generous friend Bob).
COLLATERAL DAMAGE
My Times piece looked to many like another bog standard California v. Arizona thing, and in many ways it was.
I took a side in that fight based on a moral intuition: that in clinging to path dependence, what Charles Wilkinson called “the lords of yesterday” and Tullock might more prosaically have defined as a “transitional gains gap”, California is pushing the burden of climate change onto others. But the most important victims here are not Arizona, it’s the paragraphs about the collateral damage (I thank two friends for useful conversations that led me there – you know who you are):
The visceral part of my anger at the upraised middle finger that is California’s Colorado River proposal is the way it implicitly says, “If the collision of climate change with our changing societal values requires additional water for things we didn’t contemplate when we wrote the old rules, take it out of your share. This water is ours.”
The thing is that the stuff we’ve built under the rules here – the alfalfa fields of Imperial and the leafy green of Corrales – isn’t really inevitable, it’s a Gould-Lewontin “spandrel” – a thing that looks intentional but is really just happily occupying leftover institutional space. Had we not, for example, subsidized Imperial with federal financing for the big flood control dam they needed, or provided the 50-year, interest-free financing for the All-American Canal, things would be very different. But the arched framework in San Marco Cathedral did leave spandrels behind in the corners, and they are now among the most beautiful demonstrations of the builders’ fealty to the Lord.
MY SYMPATHY FOR DR. PANGLOSS
some of the vast detritus of my newspaper career – the time I interviewed David Cassidy and wrote about “The Partridge Family”. Credit: John Fleck/Inkstain
One possible explanation for my Panglossian habit of mind – this is the best of all possible worlds! – is the descriptive rather than normative nature of my education as a writer, which was spent in newspapers offering up what I imagined was little daily piles of “facts” untainted by “opinion”. It was a ridiculous conceit, and we knew it, but also a helpful discipline.
My starting point was also to assume good faith, and even when I get burned now and then, it’s largely served me well. But faithfully presenting everyone’s argument as reasonable from their point of view and of course that’s why they believe it and they’re basically decent and moral people left me with little purchase for the kind of work I’m trying to do today.
While much of what I wrote in Water is For Fighting Over seven years ago might fairly be criticized as Panglossian, I still stand by its central messages:
that we have made tremendous progress in better sharing the Colorado River’s limited supplies
that a structure of formal and informal collaborative governance is central to that, and that it had (at the point when I wrote the book) been succeeding
One might characterize it, to borrow words from a thoughtful friend, as a combination of informed partners, good faith and compromise, leavened with “scientifically informed change”.
As we dance with deadpool, people frequently remind me, with arched eyebrows, of my book’s happy and optimistic tone, and it’s a fair cop. The book, and the way I wrote and spoke about it after, had a Panglossian air. I believed in the combination of informed partners, good faith and compromise. I believed the science could be taken seriously.
I also was pretty clear, in a closing passage defining the risks, about the risks if we didn’t get our shit together. My mistake, I guess, was an optimistic view of our ability to adapt to our spandrels.
I’m not quite sure where the metaphor that opened this blog post (reminder: rails, with two trains just sitting there and not moving) leaves us.
We seem to be stuck with these train tracks.
The trains seem not to be moving. But sooner or later they’ll have to.
Click the link to read the article on The Buzz website (Floyd Ciruli):
I just spent last week in conversation with a dozen leaders in business, media (retired), campaign consulting (none working the Denver Mayors race), former Denver officeholders, and other sectors (water, culture, nonprofits). Also, I assembled the latest polling and public campaign finance contributions.
I have the following observations:
1) There is a front line — Brough, Johnston, Herod, Calderon, and Hansen — but no front runner. However, Hansen doesn’t seem to have momentum yet from his early media. Councilwoman Ortega appears to be stuck in a second tier.
Brough and Johnston are the two strongest establishment candidates, according to polling and contributions, including dark money. Johnston just received the Denver Post endorsement, which should provide a boost. Advertising quality and quantity will be important since the candidates don’t appear to have generated much grassroots passion. Total contributions: $1.7 million Brough to $1.6 million Johnston. The table shows contributions matched by the Fair Election Fund.
2) Calderon and Herod have strong progressive identities and ethnic constituencies, and have been local candidates. Assuming one progressive makes the runoff, ethnic turnout and money will help. Herod has a money advantage, but Calderon sounds angry and many in the electorate are ready to shake up the system.
3) Crime dominated the race in Chicago and L.A. Although Bass, the progressive, won in L.A., she had to adapt to it. Crime is also big in Denver but complicated. Blending tough love and some new ideas isn’t easy with vigilant advocates, not many ready proven programs, and an ambivalent electorate.
4) For all the effort to control campaign spending and level the playing field with tax payers’ dollars, dark money is flooding into preferred apparent leaders and giving Brough, Johnston and Herod a big final push. Mostly the government money encouraged a record field of candidates (17).
5) Why no breakout? No personality or grassroots upsurge has pushed a candidate into the front. Mostly it appears to be a lack of any dominant idea or look within the campaigns. There is no “Imagine a Great City.”
Two atmospheric river events struck California and portions of neighboring states, with the second arriving as the drought-monitoring period ended. Torrential rain in central California caused a levee break along the Pajaro River, flooding the community of Pajaro in Monterey County. Rain, along with melting of lower-elevation snowpack and dam releases, also led to significant water rises along many waterways in California’s Central Valley. By March 15, the San Joaquin River at Patterson, California, neared a record crest, with the water rising to within less than a foot of the February 2017 high-water mark. The average mid-March water equivalency of the high-elevation Sierra Nevada snowpack topped 55 inches, more than 220% normal for an entire season, according to the California Department of Water Resources. Most other areas of the West received mostly light to moderately heavy precipitation. Farther east, storms delivered light to moderately heavy snow across the northern Plains and upper Midwest, with some of the most significant precipitation falling on March 11. Meanwhile, a band of heavy showers (locally 2 to 4 inches) stretched from northeastern Texas to the southern Appalachians, before shifting into the Deep South. Notably, northern Florida and environs received much-needed rain, following an extended period of record-setting warmth. Farther north, a powerful coastal storm developed as the monitoring period ended, battering parts of the Northeast with heavy, wet snow and high winds. Mostly dry weather covered the remainder of the country, including the central and southern High Plains, the Rio Grande Valley, and southern Florida. Elsewhere, chilly conditions dominated areas from the Pacific Coast to the northern half of the Plains, while record-setting warmth finally ended cross the Deep South. In fact, freezes were reported for several days, starting on March 14, as far south as Alabama, Georgia, and Mississippi…
Some of the nation’s most serious drought conditions persisted across southern sections of the High Plains region, mainly across Kansas and Nebraska. Kansas, like other areas of the central and southern Plains, has an impressive gradient between drought-free conditions (in the east) and extreme to exceptional drought, D3 to D4 (in southern and western sections of the state). On March 12, according to the U.S. Department of Agriculture, topsoil moisture in Kansas was rated 66% very short to short, while more than half (52%) of the winter wheat was rated in very poor to poor condition. Some of the D4 areas in Kansas received record-low annual precipitation totals during 2022 and have not received much, if any, cold-season drought relief. In the hardest-hit areas, drought impacts—besides damaged rangeland/pastures and poor winter wheat conditions—include frequent episodes of blowing dust and limited surface water supplies in streams and ponds. Farther north, snow has been on the ground since November in much of North Dakota and portions of neighboring states, with recent cold weather maintaining impressive snow depths even as snow continues to fall. Bismarck, North Dakota, reported at least a trace of snow on 11 of the first 13 days of March, totaling 22.5 inches.
Colorado Drought Monitor one week change map ending March 14, 2023.
Broad reductions in drought coverage and intensity were noted again this week in California and neighboring areas. By March 13, season-to-date snowfall at the Central Sierra Snow Lab at California’s Donner Pass exceeded 650 inches, compared to a normal full-season total around 360 inches. Meanwhile, Bishop, California (2.06 inches on the 10th), experienced its wettest March day on record, surpassing 1.75 inches on March 4, 1991. Closer to the Pacific Coast, the Pajaro River at Chittenden, California, achieved its highest crest (on March 11) since February 1998. In California’s Salinas River drainage basin, a record crest was set on March 10 along the Nacimiento River below Nacimiento Lake, with the water level edging the February 1969 high-water mark by 1.51 feet. The Salinas River near Spreckels, California, rose 3.89 feet above flood stage on March 13, second only to the March 1995 high-water mark (7.29 feet above flood stage)—and 2.29 feet above the level reached on January 13, 2023. Precipitation spread across southern California after the drought-monitoring period ended and will be reflected on next week’s assessment. Looking more broadly at the western U.S., snow-water equivalency values greater than 200% of normal extend from the Sierra Nevada across much of the Great Basin and into parts of Utah. Similarly impressive snowpack values also cover much of Arizona and western New Mexico. Conversely, snow-water equivalency is closer to normal—and even below normal in some drainage basins—across the northern tier of the West, as well as some areas on the east side of the Continental Divide. Many smaller lakes have rebounded, with California’s 154 primary intrastate reservoirs gaining 9.9 million acre-feet of water between November 30, 2022, and February 28, 2023. California’s storage at the end of February, 23.2 million acre-feet, was 96% of the historical average for this time of year. However, in the Colorado River system, storage on February 28 stood at 15.1 million acre-feet, just 46% of average and 29% of capacity…
The “hot spot” for drought in South remained the southern tier of the region, across northern, central, and western Oklahoma and roughly the western two-thirds of Texas. According to the U.S. Department of Agriculture, 68% of the rangeland and pastures in Texas were rated in very poor to poor condition on March 12, along with 50% of the winter wheat and 47% of the oats. Additionally, statewide topsoil moisture in Texas was rated 69% very short to short, with values ranging from 92 to 100% very short to short across the Northern and South High Plains, Trans-Pecos, Edwards Plateau, Coastal Bend, and the South region. Meanwhile in Oklahoma, statewide topsoil moisture was categorized as 49% very short to short. Rangeland and pastures in Oklahoma were rated 60% in very poor to poor condition on March 12, while 44% of the state’s winter wheat was rated very poor to poor. Notably, an extremely sharp gradient existed across eastern sections of Oklahoma and Texas between drought-free conditions to the east and moderate to exceptional drought (D1 to D4) to the west. Elsewhere, moderate drought (D1) expanded across southern Louisiana, where New Orleans, reported just 5.72 inches of rain (51% of normal) for the year to date through March 14…
Looking Ahead
A storm system that previously hammered California with heavy precipitation and high winds will cross the central Plains on March 16 and reach the Great Lakes States a day later. A band of accumulating snow can be expected on March 16-17 from parts of Nebraska into the upper Great Lakes region. Storm-related rainfall across the South could become locally heavy, with 1 to 3 inches possible. In the storm’s wake, cold weather will return across much of the central and eastern U.S. Late in the weekend and early next week, freezes could again reach deep into the South, including parts of Mississippi, Alabama, and Georgia. Sub-0°F temperatures may occur during the weekend in portions of the north-central U.S. During the next few days, much of the West will get a reprieve from stormy conditions, although rain and snow showers will return during the weekend across the Pacific Coast States and the Southwest. The NWS 6- to 10-day outlook for March 21 – 25 calls for the likelihood of near- or below-normal temperatures and near- or above-normal temperatures across most of the country. Warmer-than-normal weather will be confined to peninsular Florida and portions of the Great Lakes region, while drier-than-normal conditions should be limited to parts of the south-central U.S., mainly in Texas.
US Drought Monitor one week change map ending March 14, 2023.
Following last weekend's storm, snowpack in the Roaring Fork basin is averaging 18.5" of SWE, and now exceeds the basin-wide median seasonal SWE peak of 17.1", which typically occurs in mid-April.https://t.co/papx13glUL
THE NEWS: The Biden administration approved a scaled-back version of ConocoPhillips’ massive Willow oil and gas drilling project in the National Petroleum Reserve-Alaska, drawing condemnation — and a likely lawsuit — from environmentalists, climate hawks, and residents and leaders of Nuiqsut, the Inupiaq community nearest to the proposed drilling site. Meanwhile the fossil fuel pushers’ celebration was sullied by Biden’s announcement he would limit or ban drilling on some 16 million acres in the Arctic Ocean and elsewhere on the petroleum reserve.
THE CONTEXT: Though not unexpected, the news of the approval sent shock waves throughout the environmental community. After all, Biden promised during his campaign to halt all drilling on federal lands. He’s had a tough time living up to the pledge during the last two years, sometimes due to factors out of his control. But green-lighting a 200-well development — along with oodles of associated infrastructure and roads — on federal land blatantly breaks the promise, even though the approved version is 40% smaller than what ConocoPhillips aimed for and the company will relinquish 68,000 acres of leases in the project area as a condition of approval.
Biden did not make the decision to break his promise and risk alienating his progressive base lightly. Nor, in my opinion, did he do it simply to better his chances of re-election. I think he did it because he was under intense pressure from Alaska state lawmakers, Native Alaska leaders and the state’s entire congressional delegation to sign off on the drilling. That included Republican Sen. Lisa Murkowski, one of the few remaining pragmatic leaders in the GOP and someone Biden doesn’t want to alienate. And, more importantly, Democratic Rep. Mary Peltola, the first Alaska Native woman elected to Congress, who fervently supported the Willow project even as she acknowledged its environmental impacts.
Peltola argued that allowing the project to go forward was the best way to ease the energy transition’s impacts on Alaska’s most vulnerable communities. Not only would it generate huge amounts of tax revenue for the fossil fuel-dependent state, she said, but it would also form a “bridge to fill the gap” as the state and nation move away from fossil fuels.
While Peltola’s argument was convincing, obviously, it also reveals the pitfalls of becoming too reliant on fossil fuel extraction and the jobs and revenues it can provide. This dependency forces the communities most affected by extractive industries and climate change to supplicate themselves to the very industries that harm them most in order to survive.
And now for a mini-data dump:
576 million: Barrels of oil expected to be extracted by the Willow project over its 30-year lifetime.
239.4 million: Metric tons of associated indirect carbon dioxide-equivalent emissions expected to result from burning all that oil.
110,000: Barrels of oil the project is expected to extract daily once operational (in 8 to 10 years from now).
12 million: Barrels of oil U.S. fields currently produce daily.
1.8 million: Barrels per day of oil produced in New Mexico, alone.
1,700; 400; 450: Number of workers expected to be employed by the project during the eight-year construction phase; the drilling phase; and operational phase, respectively.
$10 billion: Revenue federal royalties and state and local taxes on the project is expected to generated for Alaska over its lifetime.
Mining Monitor
Sen. John Barrasso, the Wyoming Republican, has introduced a bill that would ban uranium imports from Russia or Russian-owned entities. The bill has support from a broad slate of Western-state Republican lawmakers as well as from Democratic Sen. Martin Heinrich of New Mexico. On its face, the legislation is aimed at defunding Putin’s war machine. But an intended side effect is that it could revive the dying domestic uranium industry.
Chronically low uranium prices caused by an abundance of global supply coupled with flagging demand have reduced the U.S. uranium mining industry to a shadow of its former, heavily subsidized self. U.S. mines produced nearly 44 million pounds of uranium concentrate in 1980; in 2021 they kicked out just 21,000 pounds. More than 95% of the uranium that fuels U.S. reactors is now imported.
While just 14% of those uranium imports come from Russia, another 35% comes from Kazakhstan, where many of the mines are operated by Russia’s Rosatom or its subsidiaries. That means Barrasso’s bill could potentially cut off up to nearly half of the uranium imports into the U.S. That would skew the supply-demand balance, cause prices to shoot up, and give an economic incentive to operators to restart mothballed uranium mines in Utah, Wyoming, Colorado and New Mexico.
It’s not at all clear, however, that Barrasso’s bill will pass. The extremist wing of the Republican party has developed a fondness for Russian President Vladimir Putin so may not support a bill aimed at diminishing the authoritarian’s power. And progressive Democrats might be wary of propping up the domestic uranium industry, given its legacy of harming the land, water, and people of the West.
White Mesa Mill. Photo credit: Energy Fuels
Energy Fuels, which operates the White Mesa uranium mill in southeastern Utah and owns several mines in the West, has long favored uranium import restrictions. Apparently this sentiment doesn’t extend to uranium-bearing radioactive waste.
State inspection reports reveal that the White Mesa mill last year received 660 metric tons of radioactive waste from a facility in, get this, Estonia. Yep, Estonian rare earth elements processor Silmet shipped about 2,000 55-gallon drums of “alternate feed material” over ocean and land to the mill outside Blanding so that Energy Fuels could reprocess it and store the waste onsite. Silmet pays Energy Fuels to essentially serve as its de facto waste dump.
Currently Energy Fuels relies on the alternate feeds branch for nearly all of its uranium production and a good chunk of its income, according to SEC filings. Last year the company received $2.6 million, or about 21% of its total revenues, from the Estonian firm Silmet. That was for both alternate feed payments from and sales of rare earth carbonates to Silmet…
West snowpack basin-filled map March 14, 2023 via the NRCS.
From the Snowed-in Department
From the lowlander’s perspective, the storm that moved into Southwest Colorado late last week might not have seemed like much. Most areas below 7,000 feet or so received only rain or Schneeregen (German for a slushy combination of rain and snow) that didn’t really accumulate. But in the high country it was real snow, if a bit sloppy, wet, and heavy. That heightened the avalanche danger enough for the Colorado Department of Transportation to shut down the highways in and out of Silverton for more than 24 hours.
And at least one slide, the Telescope near the Muleshoe turn on the south side of Red Mountain Pass, ran really big, as the CDOT photos below illustrate.
The outflow at the bottom of Navajo Dam in New Mexico. Photo: Brent Gardner-Smith/Aspen Journalism
From email from Reclamation (Susan Novak Behery):
At 8:00 AM, March 20th, 2023 (Monday), the release at Navajo Dam will be transferred to the 4×4 Auxiliary outlet, where the release will be reduced to the minimum of 250 cfs. The outage at the main outlet works and minimum release will accommodate maintenance work at the City of Farmington’s hydroelectric plant and instream work for the Turley Manzanares Ditch Company Diversion Dam Rehabilitation Project. The release will be transferred back to the power plant and increased back to its current level at 11:00 AM on March 24th, 2023 (Friday). You may expect some silt and discoloration downstream in the river during this time due to the location of the 4×4.
A Pi Day pie from Reilly’s Bakery in Biddeford at Biddeford High School in Biddeford, ME on Friday, March 13, 2015. (Photo by Whitney Hayward/Portland Press Herald via Getty Images)
CELEBRATING cranes starts with understanding them. It’s a sight to see 200 or so people packed into a room to listen to stories about crane conservation. The most fascinating part of the 40th Monte Vista Crane Festival is the effort to educate the public.
On top of the numerous birding tours that were no doubt supported with years of experience, the Crane Fest hosted a series of talks on Saturday. “Habitat Selection and Movement Patterns of Sandhill Cranes;” “Elk on the SLV Refuge Complex: What’s Going on Out there?;” “The Secret Lives of Nesting Sandhill Cranes;” and George Archibald’s keynote talk, “Lessons Learned from 50 years of Crane Conservation.”
A good-sized crowd came out to the Ski Hi Complex on a chilly Saturday night to listen to Archibald speak and to view the premiere of filmmaker Christi Bodi-Skeie’s new film, “Where the Cranes Meet the Mountains.”
The film focused on Valley artist Amanda Charlton and the inspiration she draws from the cranes against the Valley sky. Bode-Skeie’s images of Sandhill cranes, the Valley sky, and Charlton’s art invoke nothing short of the true sense of home in the Valley.
Charlton called the cranes her fellow citizens. “We are not separate from nature,” she said in the film.
“It’s hard to encompass the beauty and the magic,” Bode-Skeie said after the premiere.
She reflected on being able to share Chartlon’s first time seeing the cranes and the collaboration of telling a story that “honored those that live locally and that there’s this beautiful thing in your backyard that we get used to taking so for granted. Also inviting other visitors down that this is something that really makes a place what it is,” she said. “To be able to do that in a place that I have fallen in love with is pretty special to share with you all.”
A Crane keynote
George Archibald, co-founder of the International Crane Foundation and the world’s leading crane advocate, reflected on portions of his 50-year career in crane conservation. He highlighted major successes and failures, lessons learned, and provided insight into how we can continue the work over the next 50 years.
Crane expert George Archibald gives a presentation on Saturday. Photo credit: Alamosa Citizen
He also just told some really cool stories and facts about cranes. Archibald’s passion for cranes is one thing, but his ability to share that passion with an audience is something else. His stories held everyone in captivated wonder.
In 1973, Archibald, along with fellow graduate student Ron Sauey, established the International Crane Foundation in Baraboo, Wisconsin.
Originally from New Glasgow, Nova Scotia, Canada, Archibald has spent his career traveling the globe working to restore populations of cranes. During the presentation he touched on crane conservation efforts in the United States, Japan, China, North and South Korea, Russia, India, Iran, and a plethora of other countries.
When asked how many countries he’d traveled to, he said he wasn’t sure, but that it was “over a dozen.”
His next trip is to Nepal to study the demoiselle cranes. They are the smallest of the cranes, but they can fly at 28,000 feet.
Archibald began his talk on experiments conducted in an effort to restore whooping crane populations. “Experiment 1” was started in 1975 to create a migratory flock of whooping cranes between Grays Lake National Wildlife Refuge in Idaho and the Bosque del Apache National Wildlife Refuge in New Mexico – coming straight through the San Luis Valley.
Researchers brought whooping crane eggs, removed sandhill crane eggs and took them back to Maryland for research, and left one whooping crane egg to substitute for it. A large number were hatched and raised by their “foster parents.” The young birds traveled to the Bosque in New Mexico with their foster parents, but when they saw other whooping cranes, “they ignored one another.”
These adopted cranes “had absolutely no interest in pairing with a whooping crane.”
During the experiment, which ran from 1975-1984, researchers were able to place 289 whooping crane eggs in that many sandhill crane nests. Out of those eggs, 84 were able to fledge, but there were no whooping crane pairings.
“The project stopped and eventually the birds died off,” he said. Archibald went on to say that “we’ve had many disappointments in the saga with the whooping cranes.”
Despite downturns and total redirects, the current estimated population of whooping cranes both in captivity and in the wild is about 836 worldwide.
Sandhill cranes stop and gather in a field near the Monte Vista National Wildlife Refuge during their yearly trek.
ARCHIBALD spoke on more experiments that have been conducted through the years, such as whooping cranes that are nesting in a Louisiana crawfish farm. Archibald says that the farmers and the cranes live happily with one another. As the farmers collect the cages near their nests, Archibald said the birds don’t mind.
What’s more, the Cheorwon Basin, which lies right in the middle of the Korean Demilitarized Zone, is prime wintering and feeding ground for white-naped and red-crowned cranes. After the Soviet Union was dismantled, the supply lines of fertilizer and other items to North Korea stopped. This led to “continued deterioration of the farmland in North Korea.”
These lands are ripe for the picking for these cranes. During the North Korean Famine, it is believed that cranes were likely hunted for food. Archibald said “we don’t know anything about it really.”
As a Canadian, Archibald has been able to travel to North Korea. He’s been working with Korean cranes since 1974. Archibald has advocated with his South Korean colleagues to make the Cheorwon Basin a protected wildlife area.
The global population of white-naped cranes is around 12,000, Archibald said. Of those, 9,000 of them winter in the Demilitarized Zone.
(An interesting fact about the Korean Demilitarized Zone (DMZ): The 38th Parallel, where the DMZ sits, also happens to fall right here in the San Luis Valley.)
Archibald’s job requires working with people on the ground in countries where these cranes reside. One of the crane species Archibald discussed was the Siberian crane. Since the invasion of Ukraine, Archibald said he isn’t able to work with his Russian colleagues.
Archibald talked about a single Siberian crane named Omid. Omid was part of a group that migrated to Iran from Siberia. Heavy hunting along this migration route led to the death of Omid’s pair more than 15 years ago. Omid is the only Siberian crane with the knowledge of the 5,000-kilometer migration path between Uvat, Siberia, and Fereydunkenar, Iran.
Just a few days ago, Archibald said, Omid was paired with a female who was born in captivity, in the hope that Omid will bond with this female and teach her the path.
“If they can pair and survive the migration and come back with a chick we’ll have three birds that know the migration route. And then we can release more birds with them. So keep those birds in your prayers,” Archibald said.
Sunday Morning Dinosaur Viewing
The Monte Vista National Wildlife Refuge bustled Sunday morning with the soft whispers of wonder, rapid-fire camera shutters, and the call of Sandhill cranes.
In a patch of farmland, the birds mingled with Canadian geese, ate, danced, flew around, sang their songs, and bathed in the March sun.
Photographers with tripods and photographers without captured the birds in all their moments, often commenting on the cooperative sun. Most just stood and watched with their bare eyes.
The people were quiet and the birds were loud. We were all there to listen and see. In the back of everyone’s mind was the hope we’d all hear that elusive “whoosh” that happens when a large crowd of sandhill cranes flies away at once. This did not happen for this group of cranes and crane-viewers. After the morning went on, the Canadian geese decided to put on the show instead.


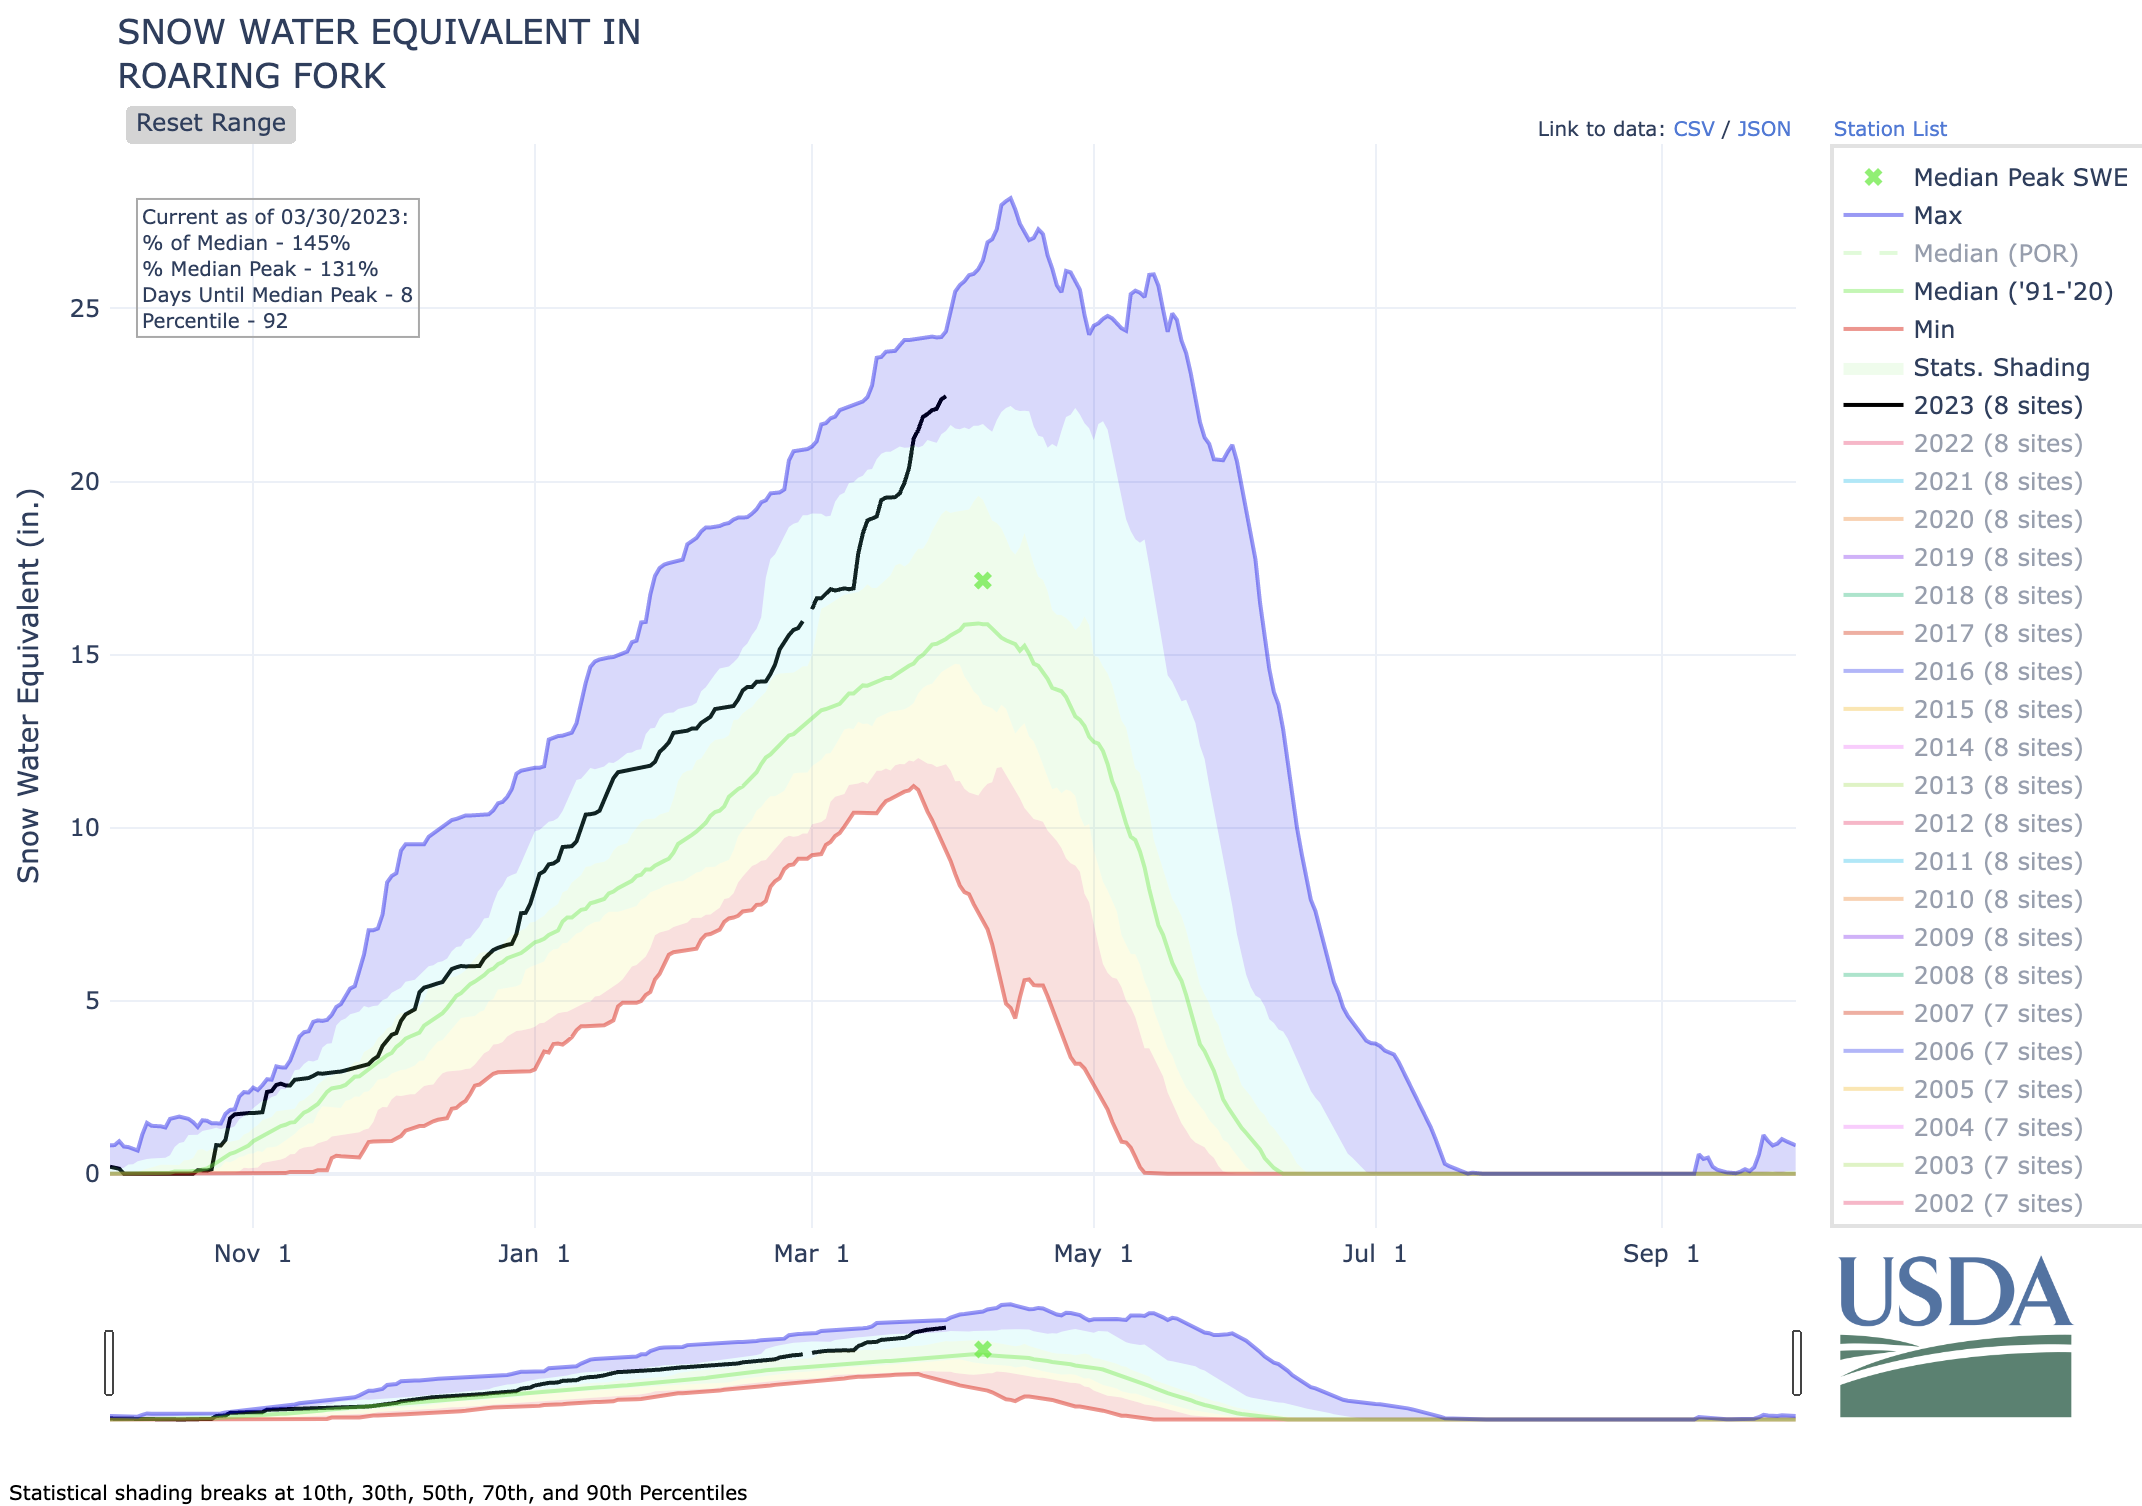


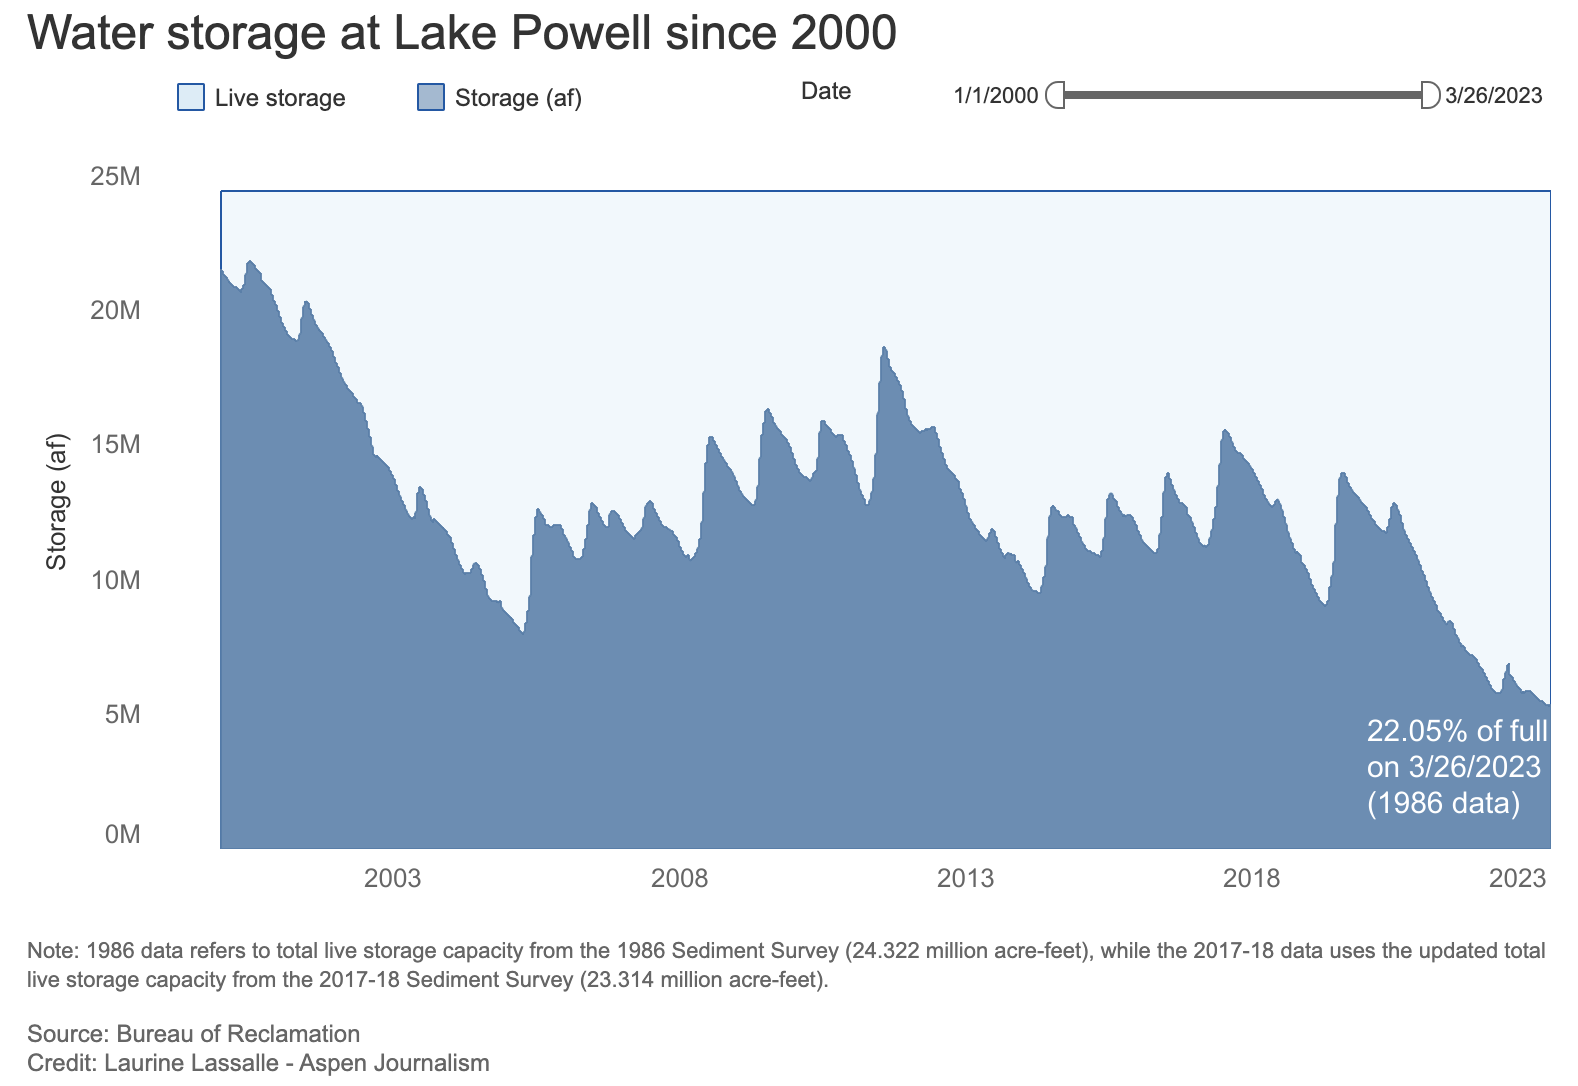

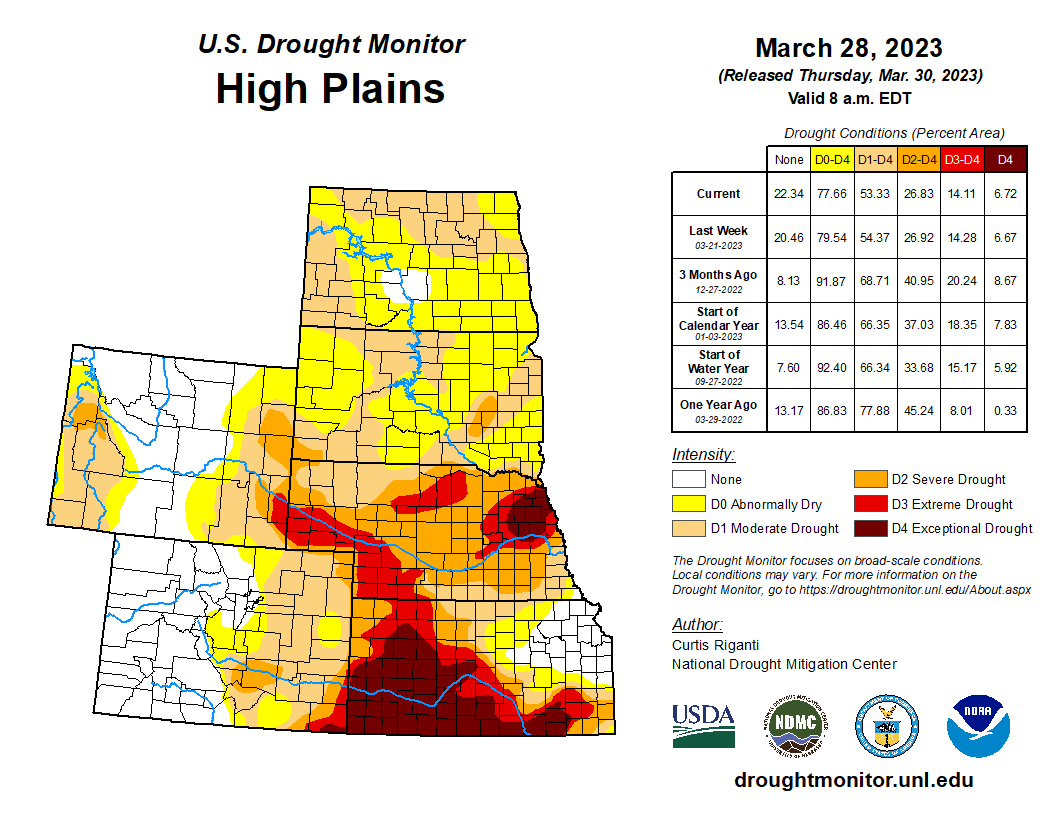
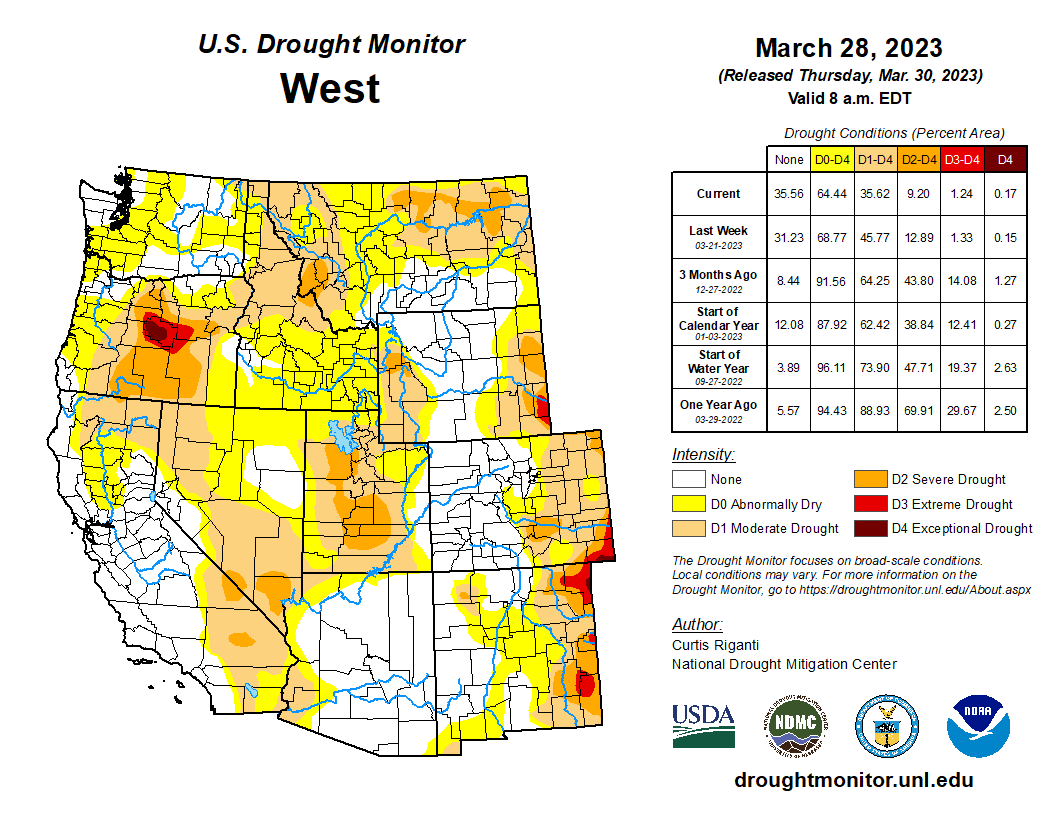
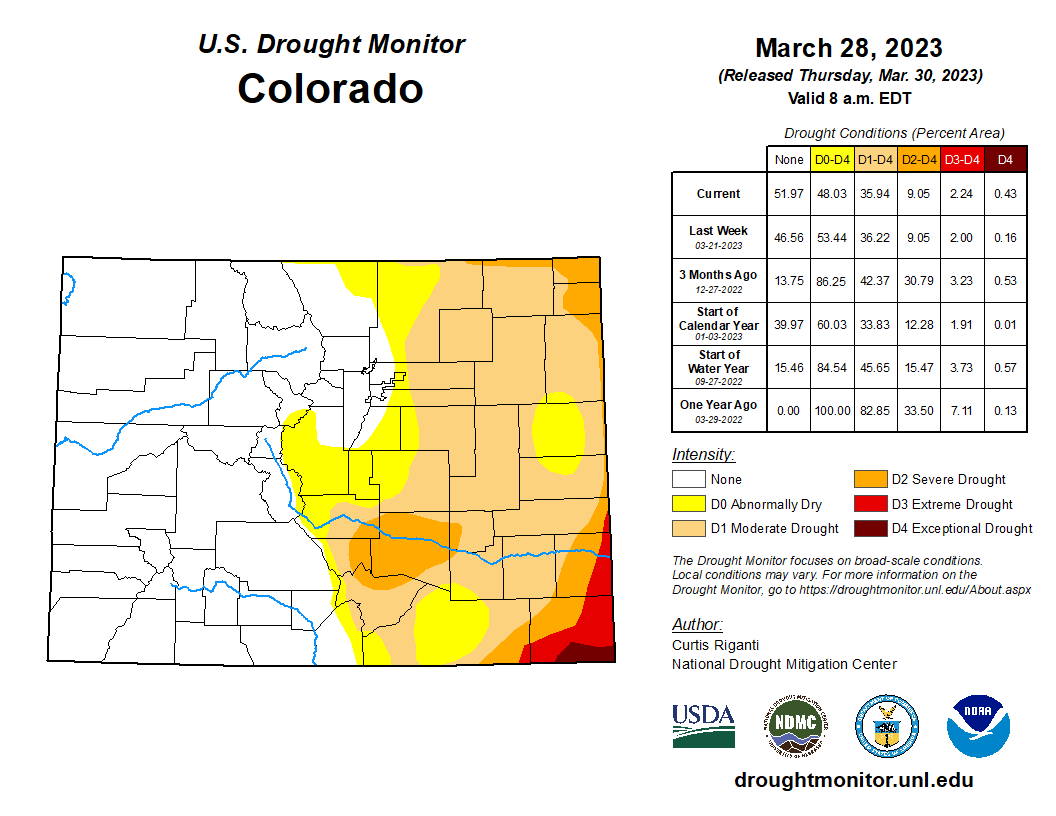
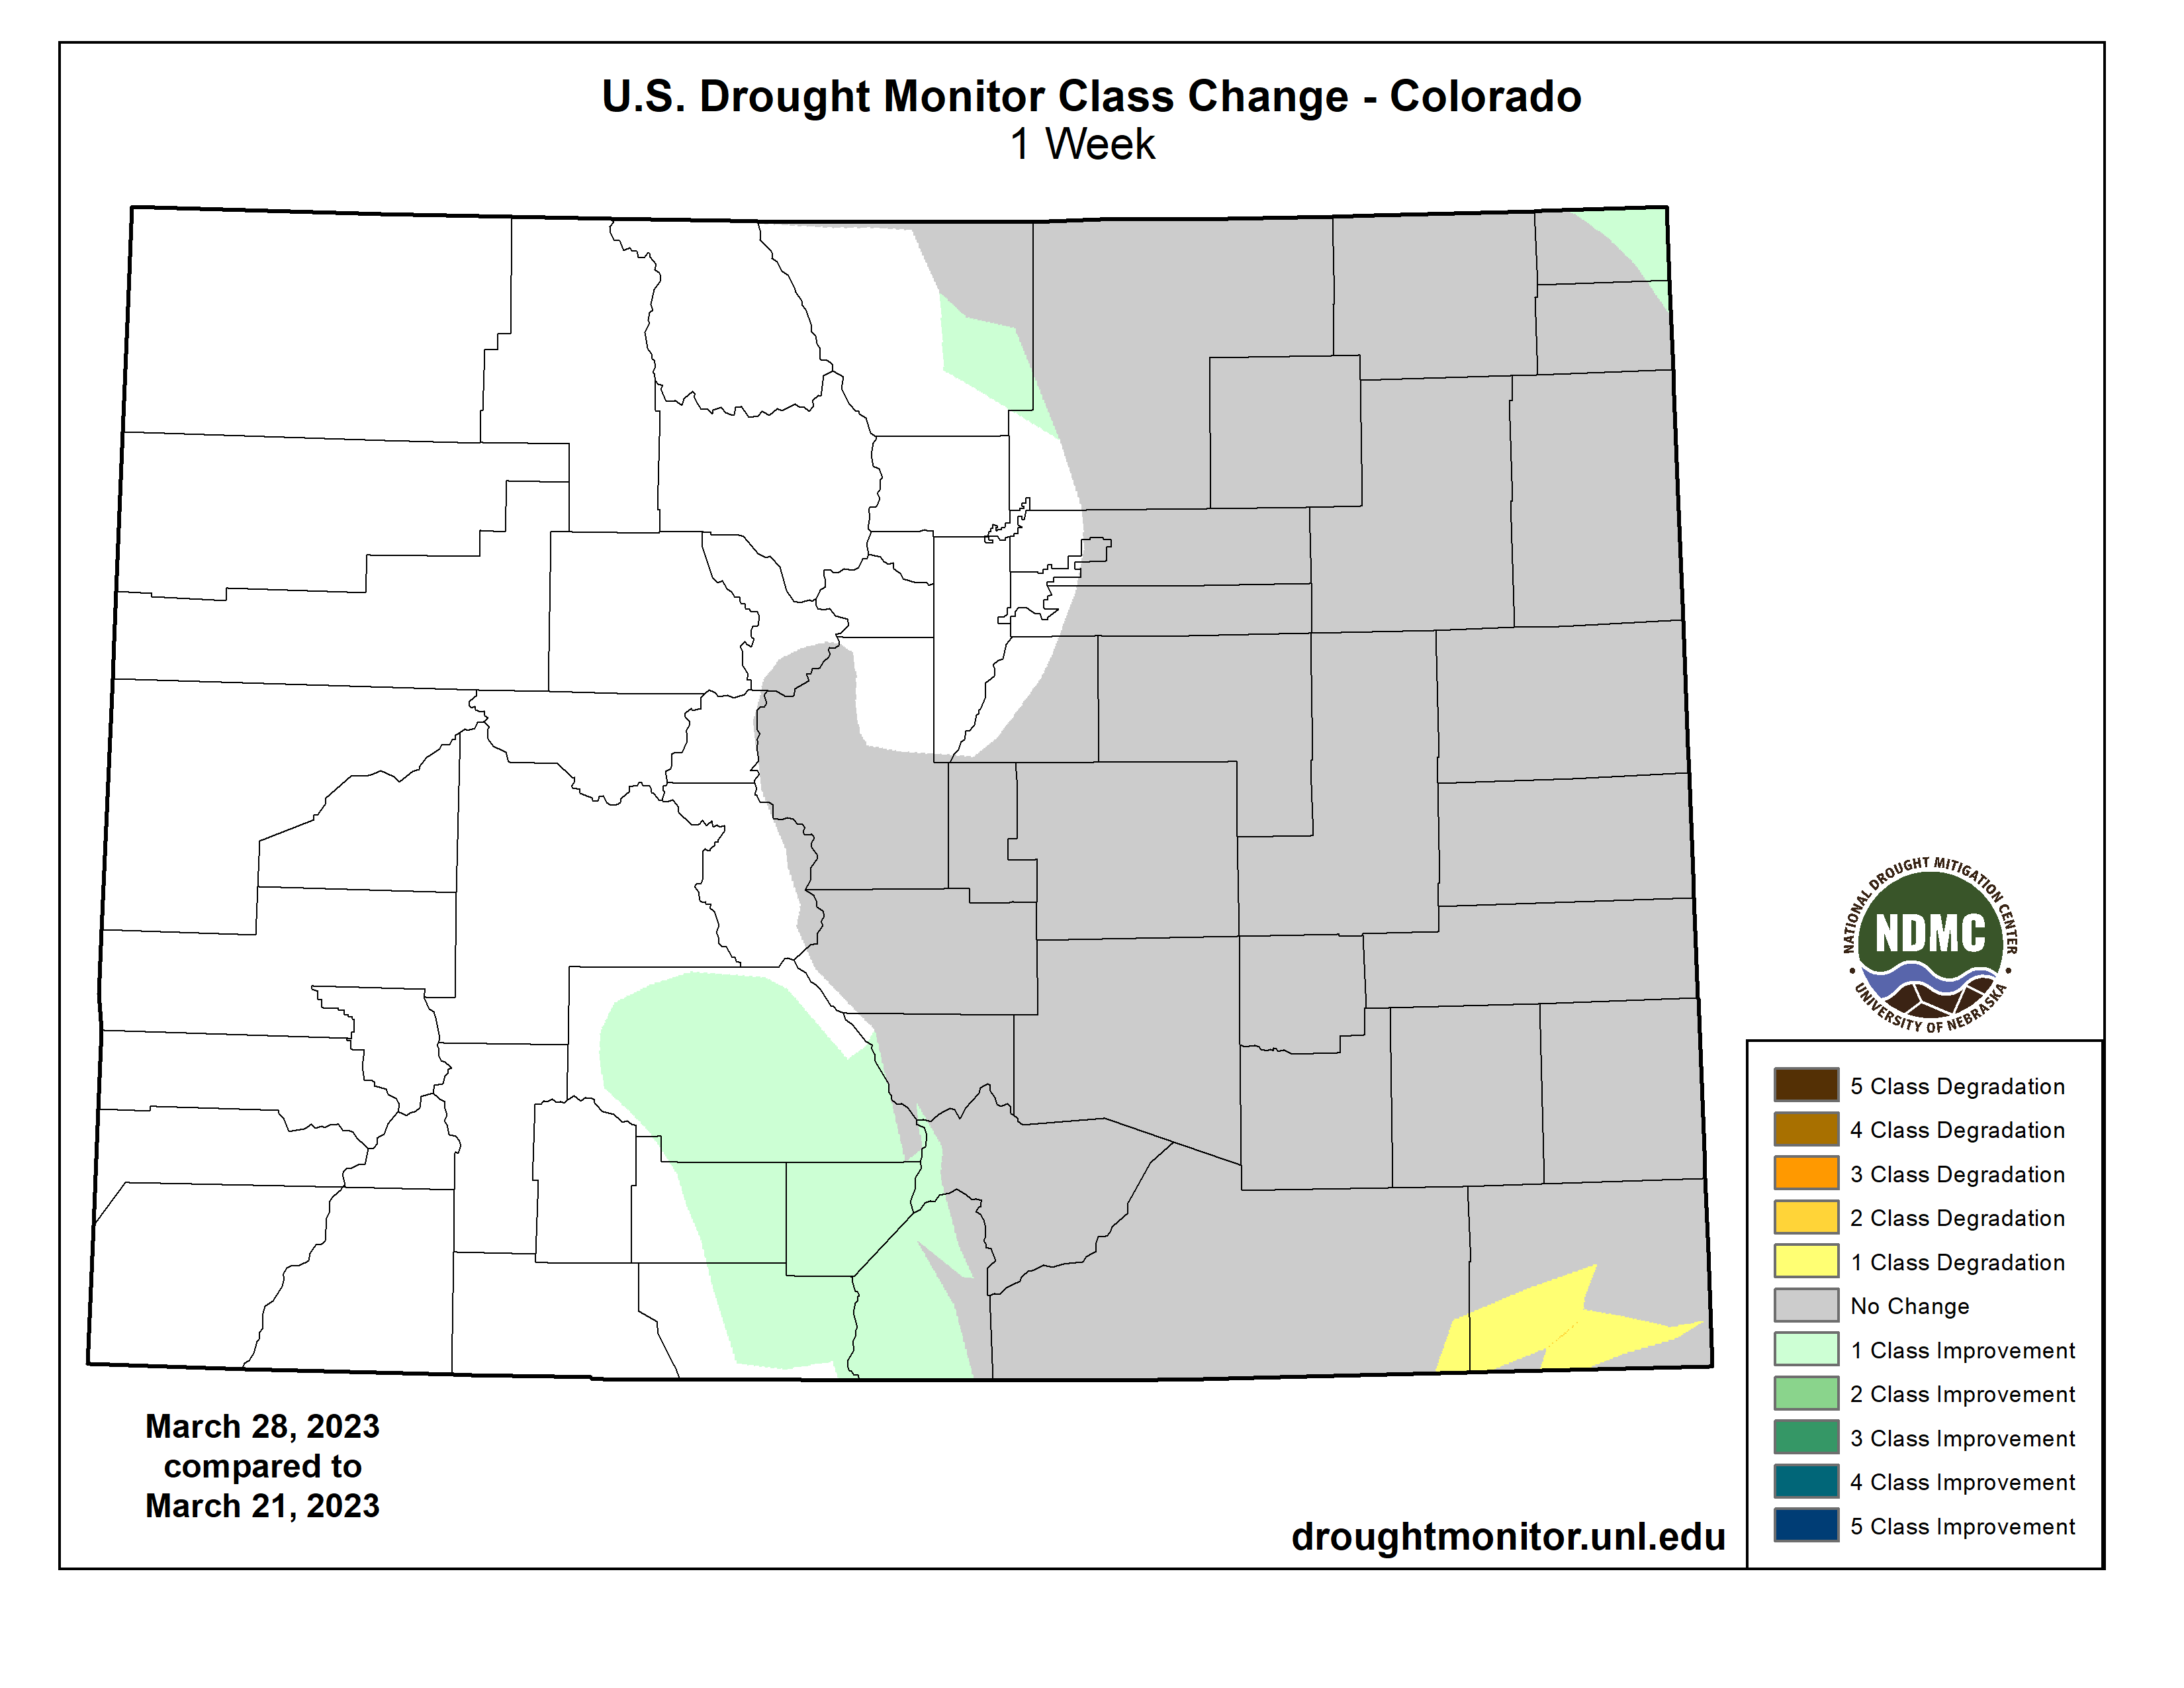
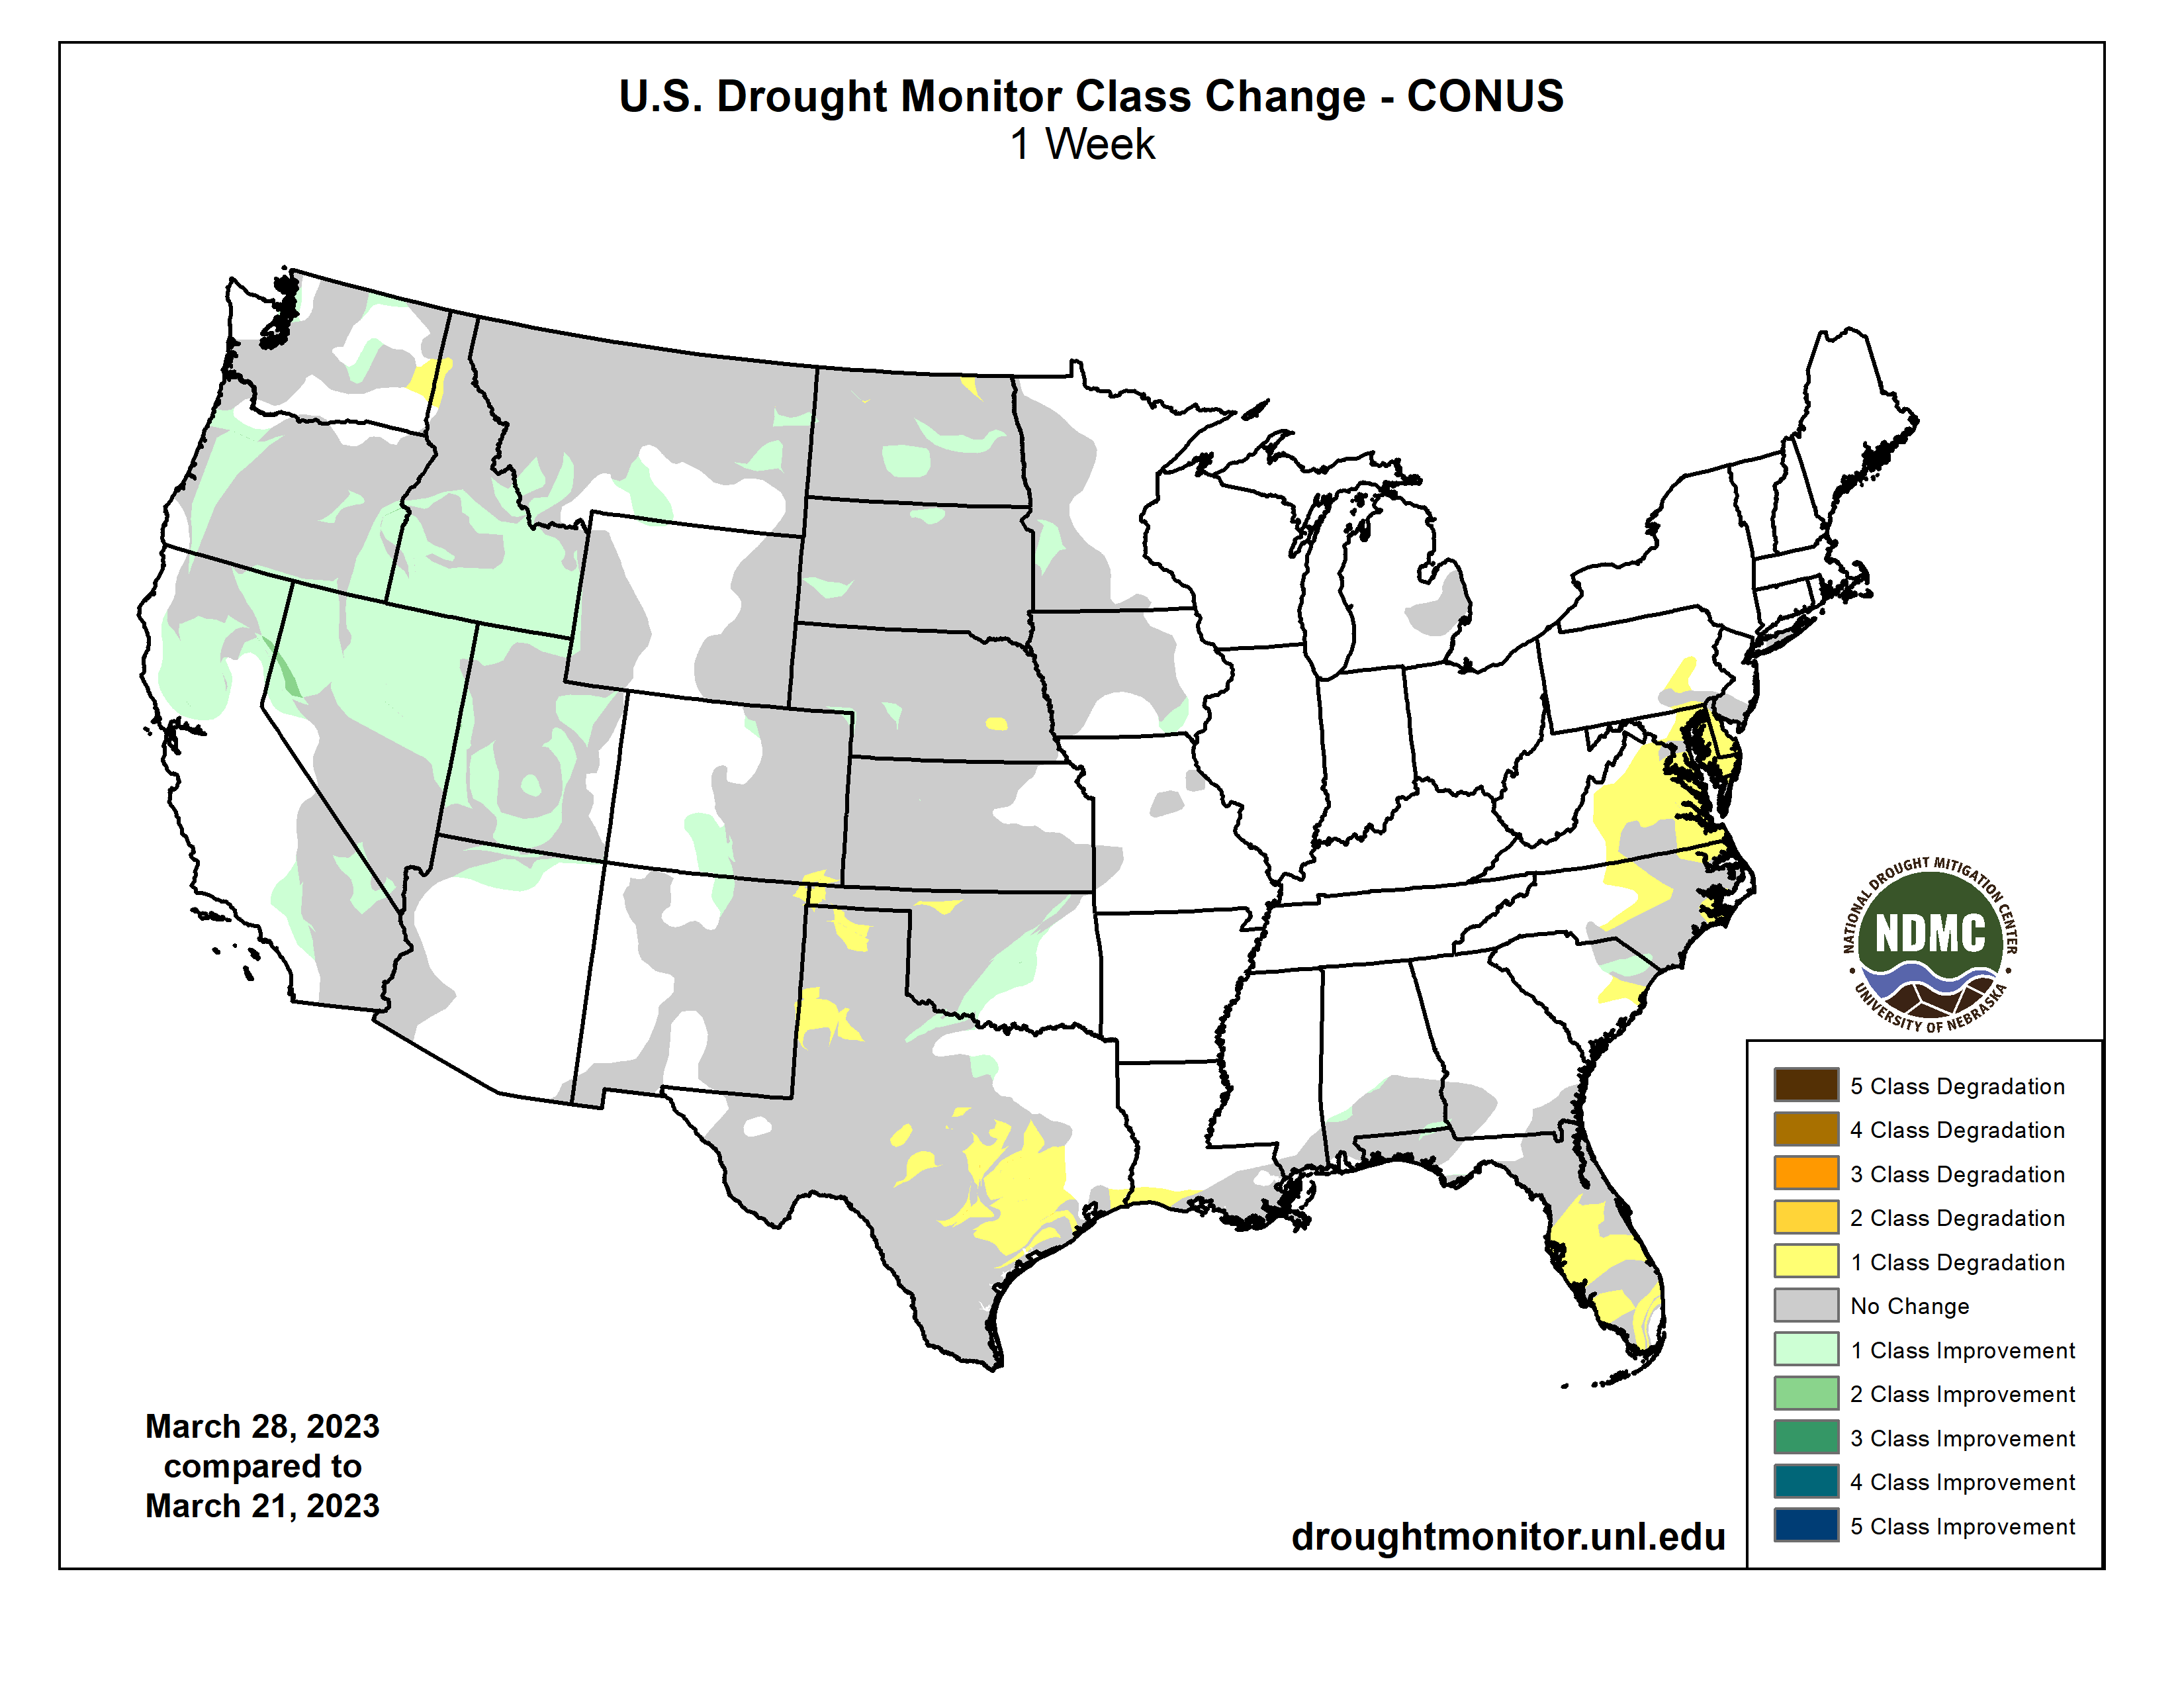

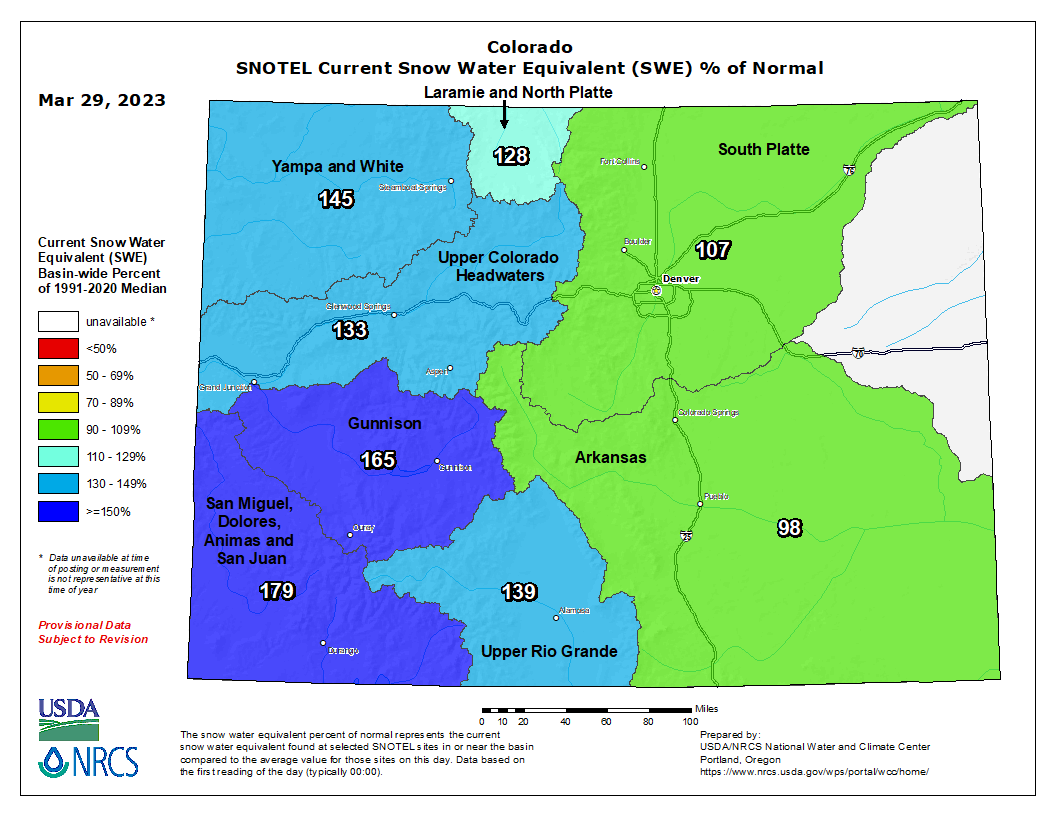

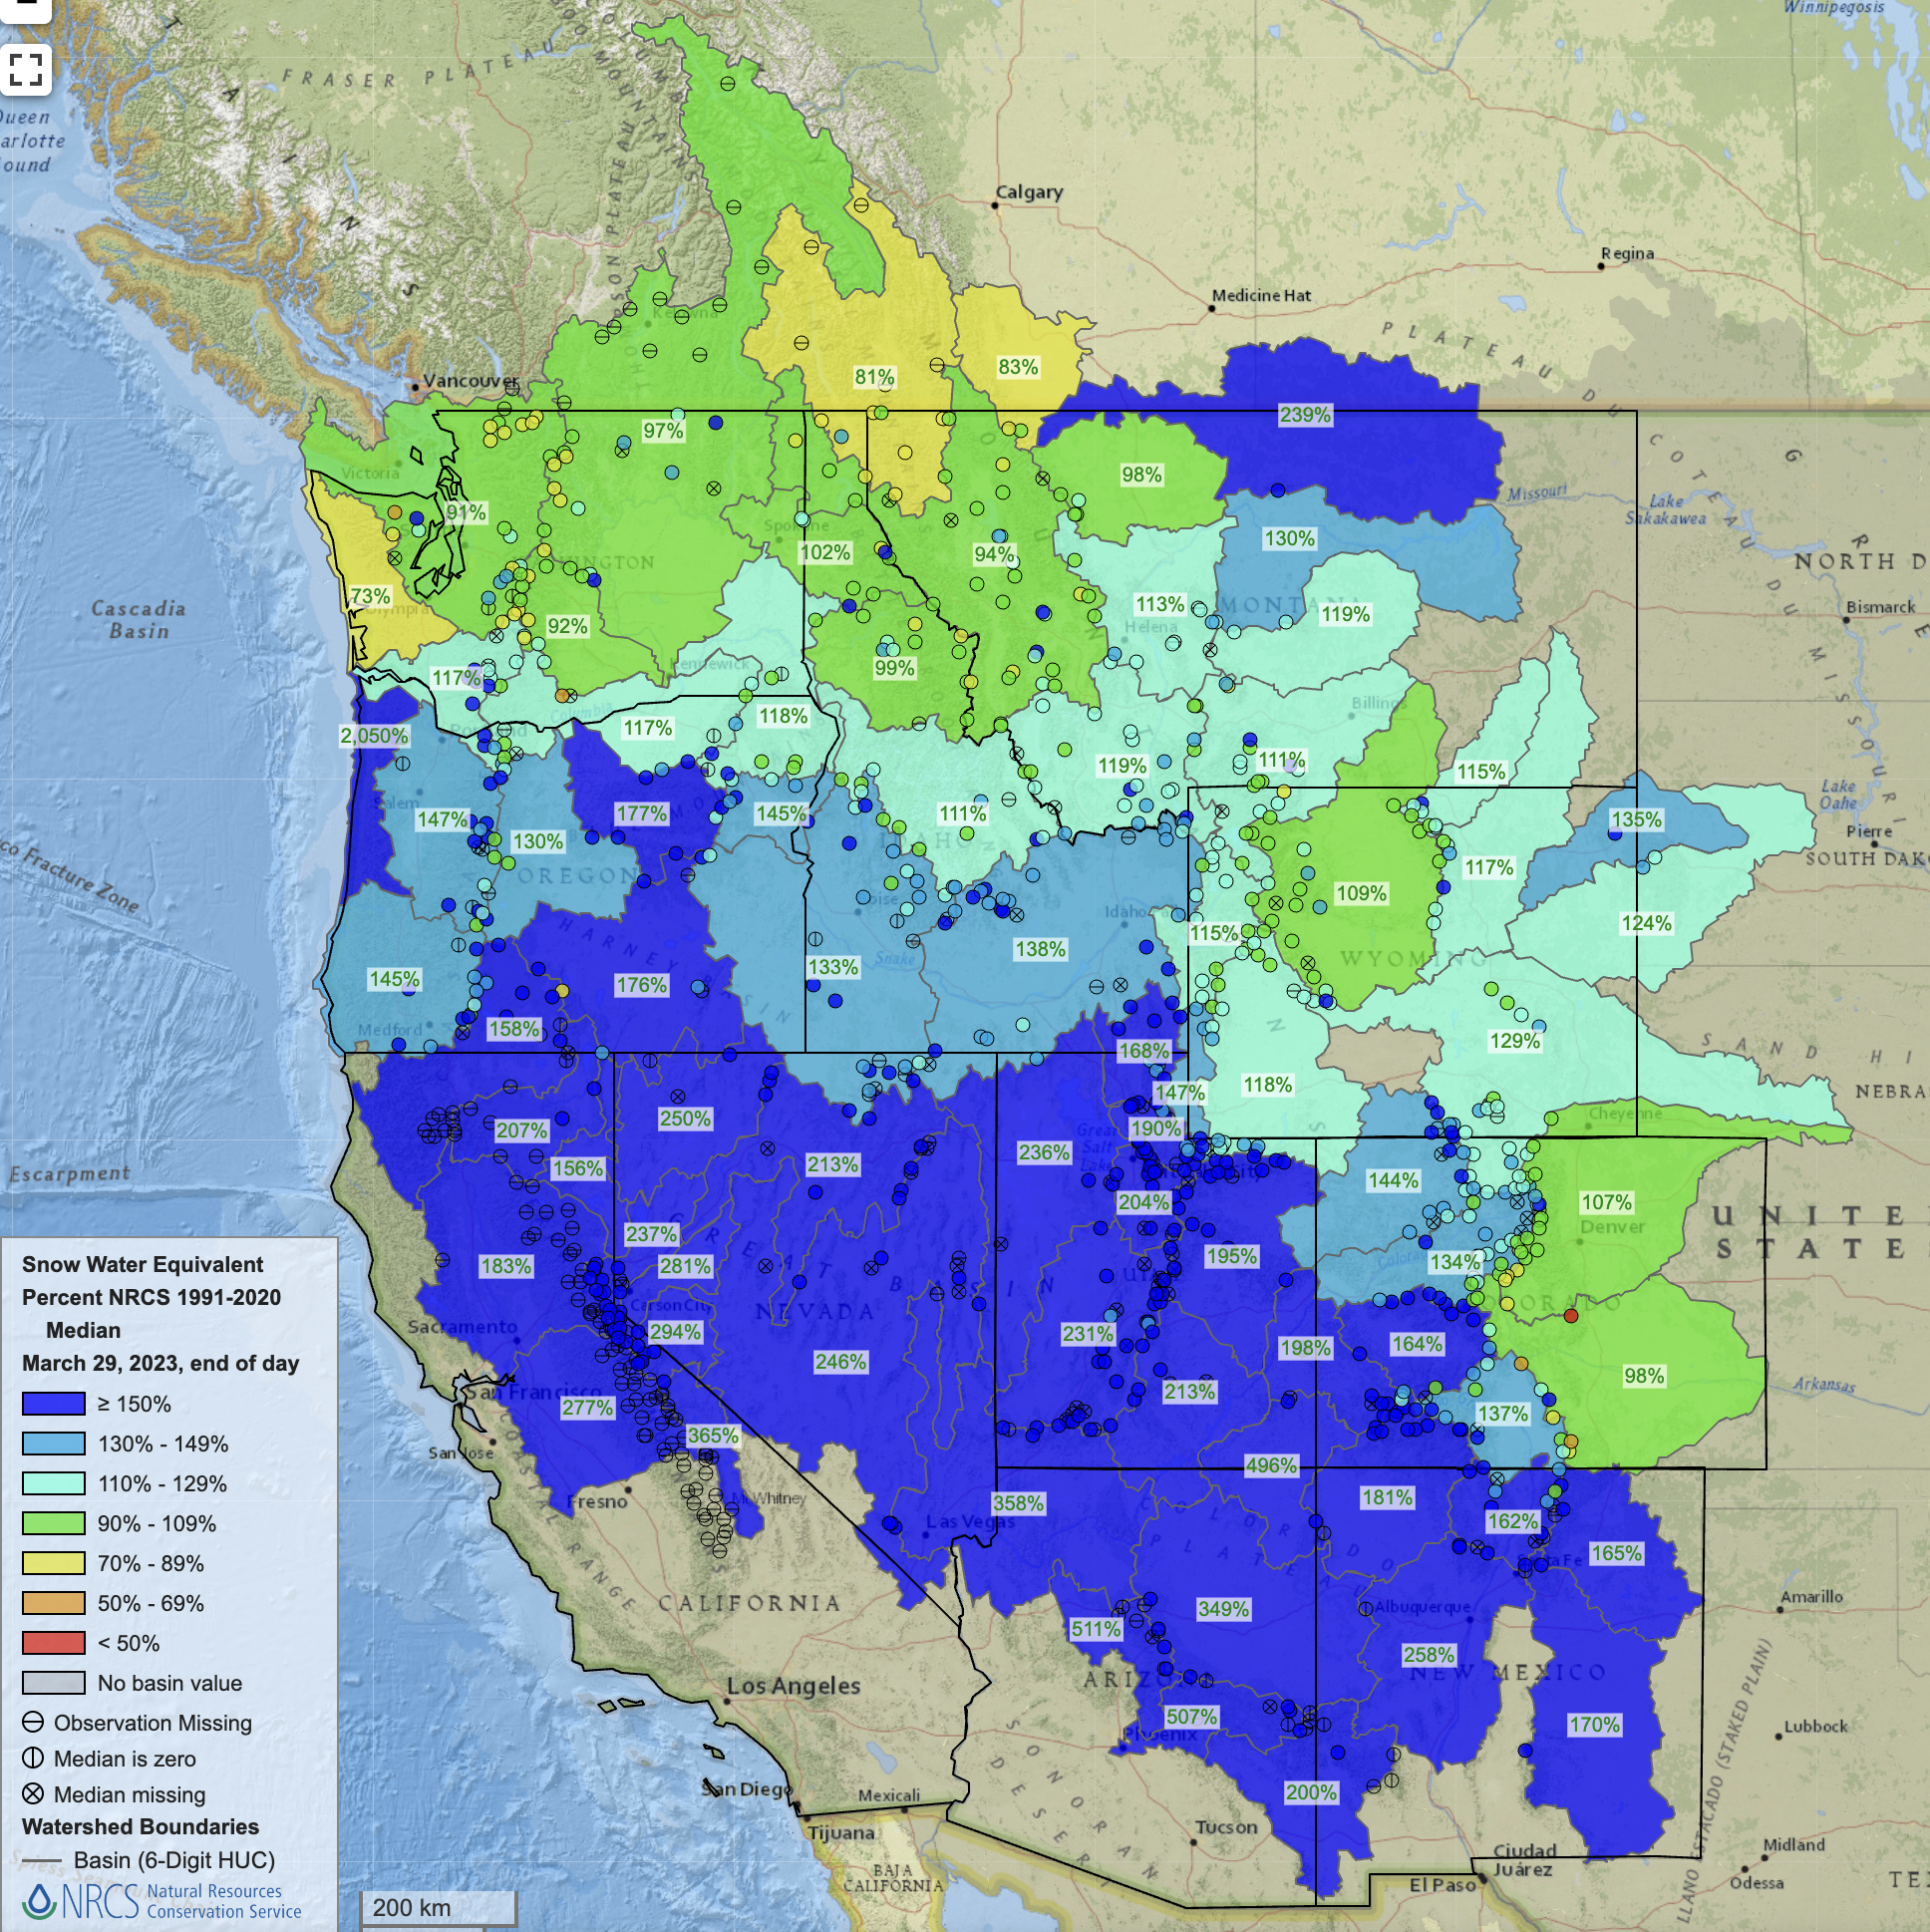


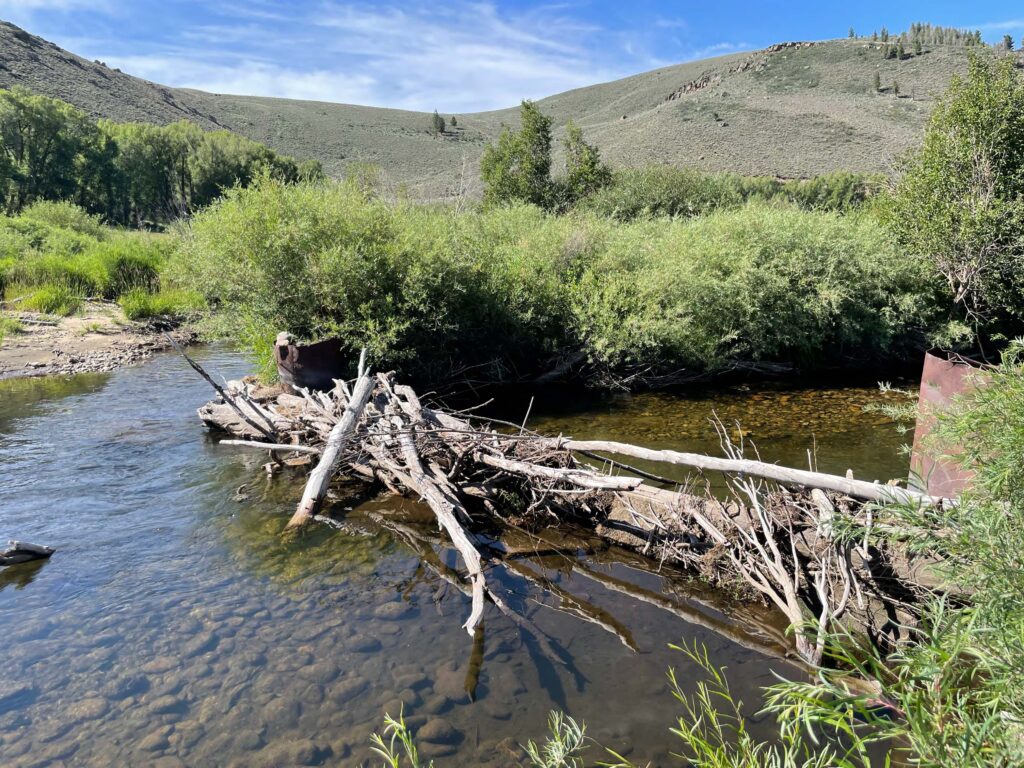
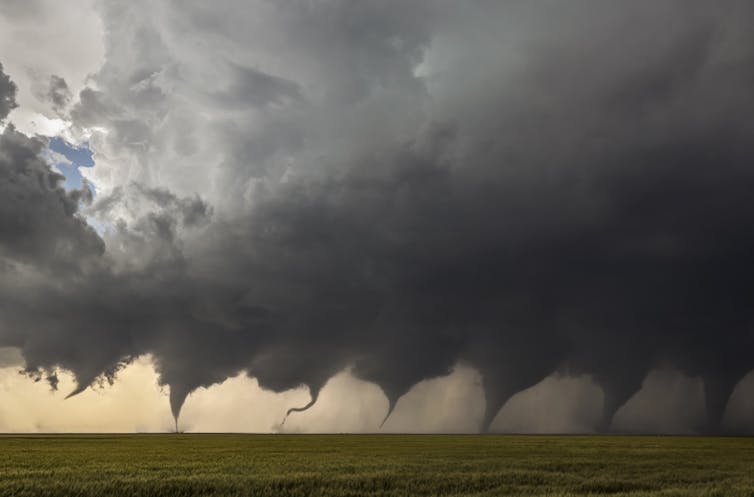
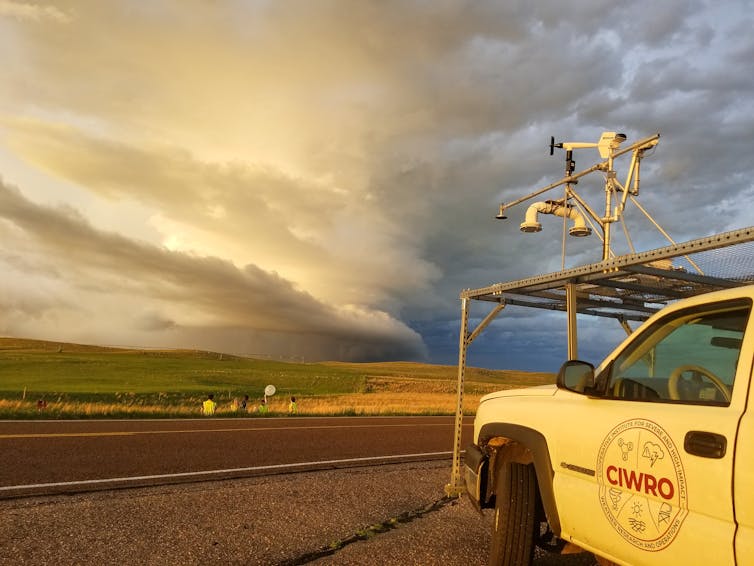

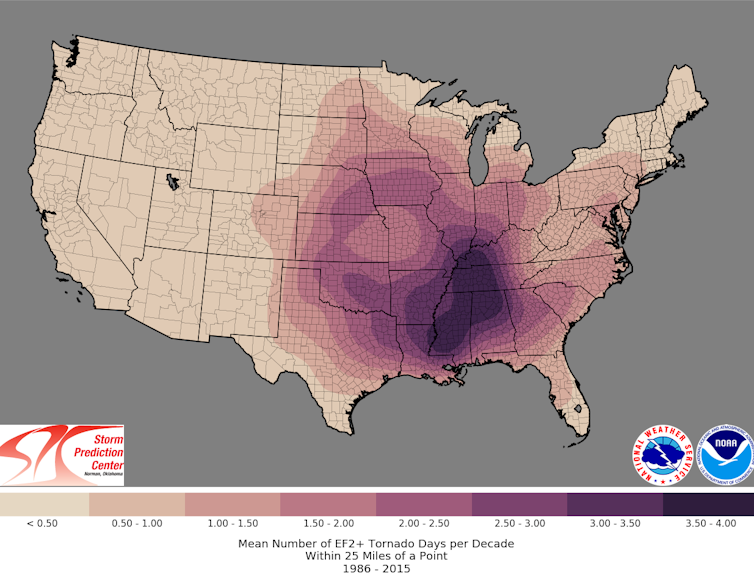


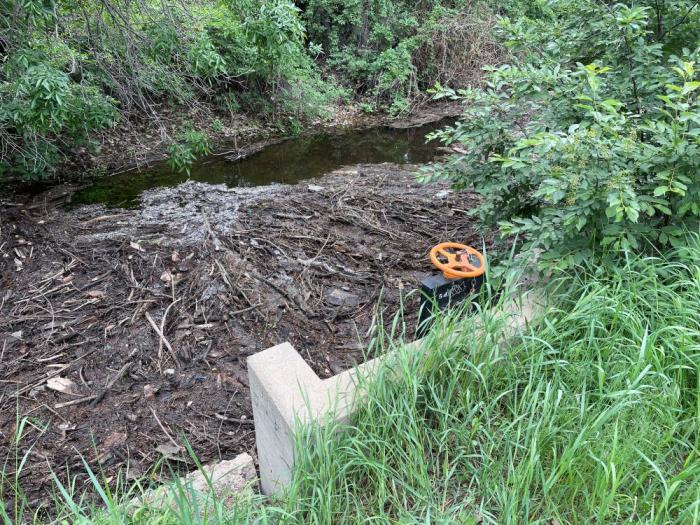
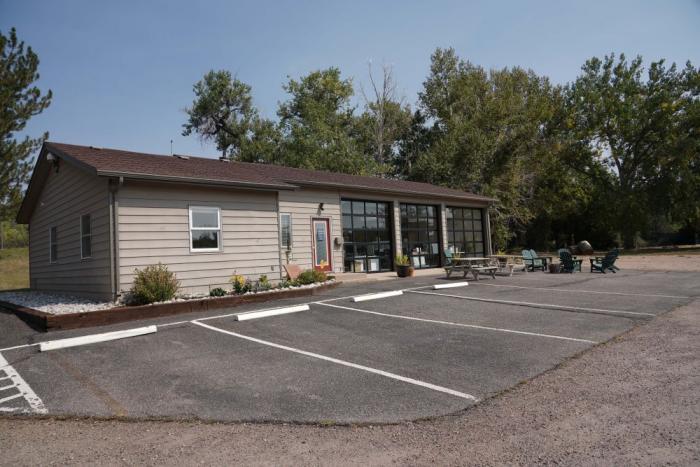
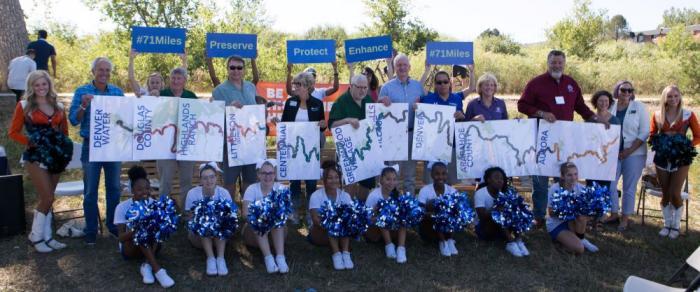
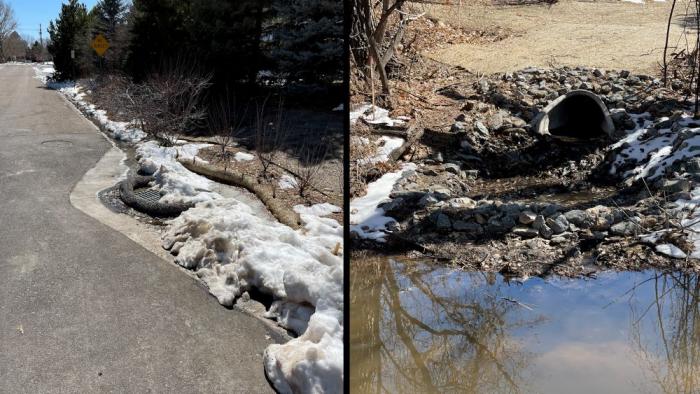
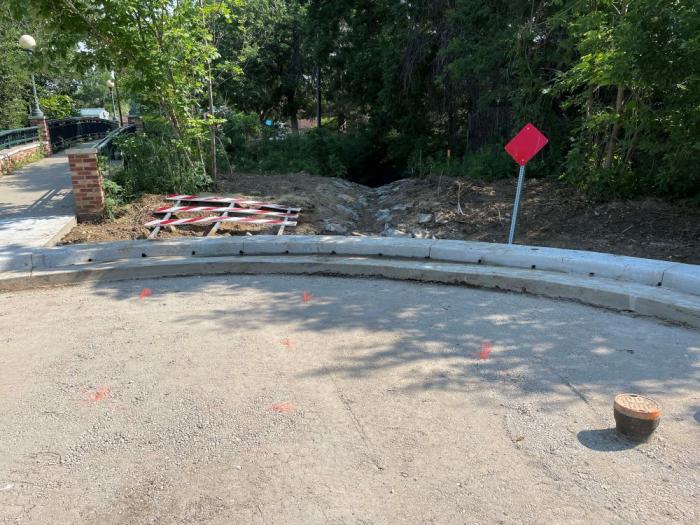
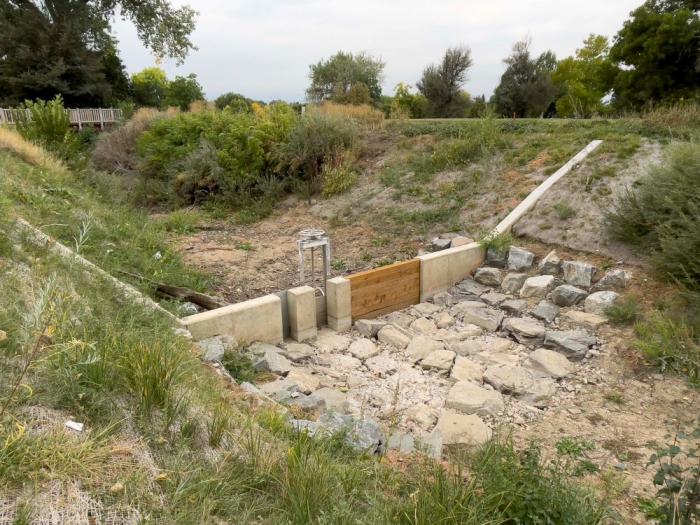
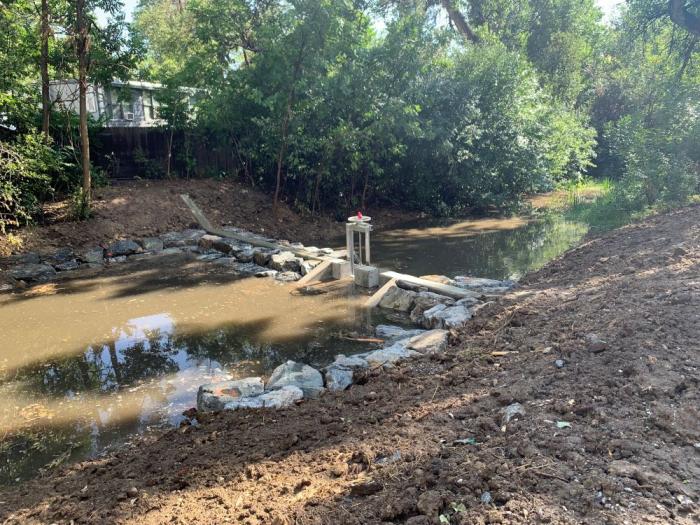
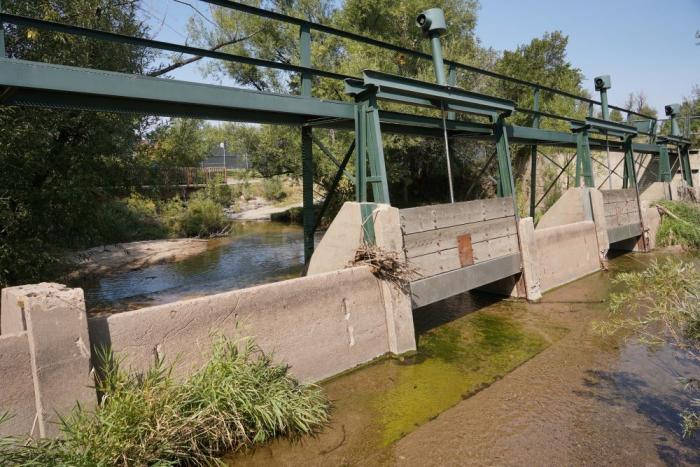
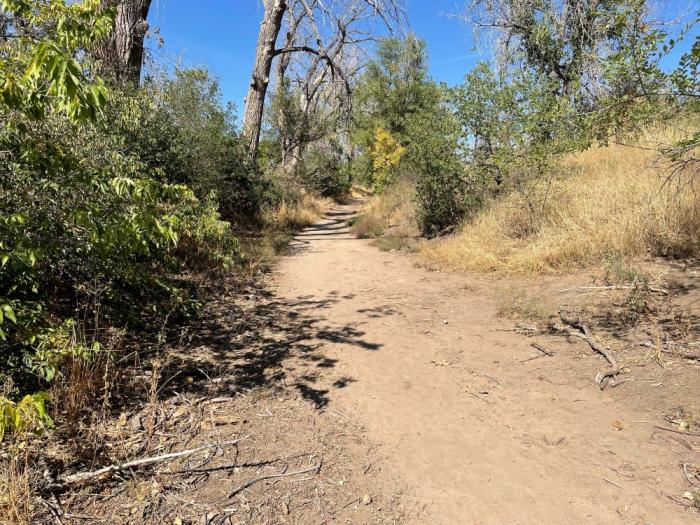
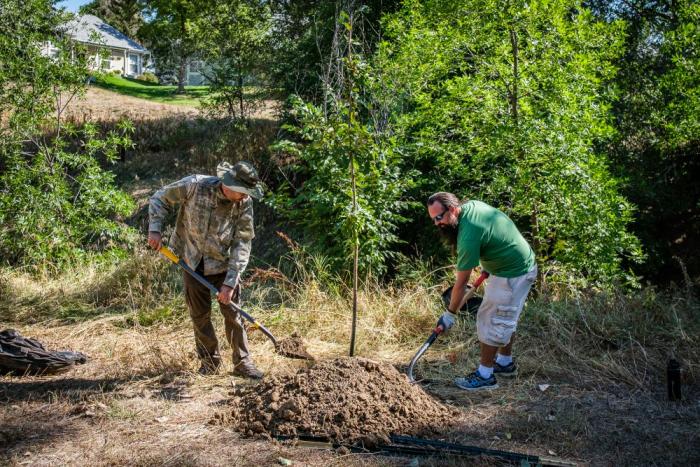
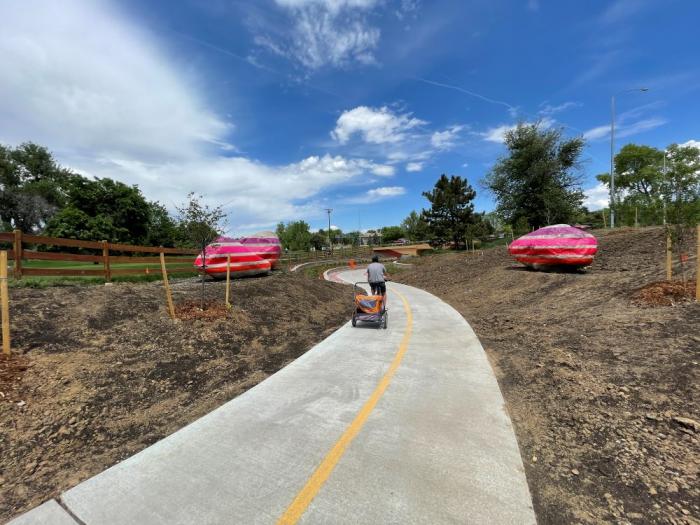
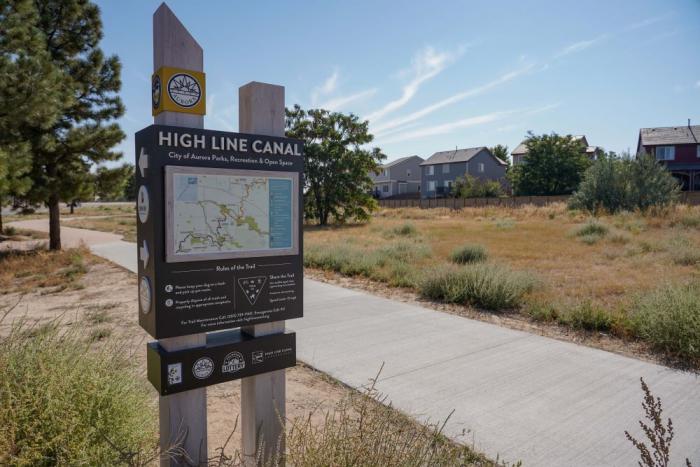
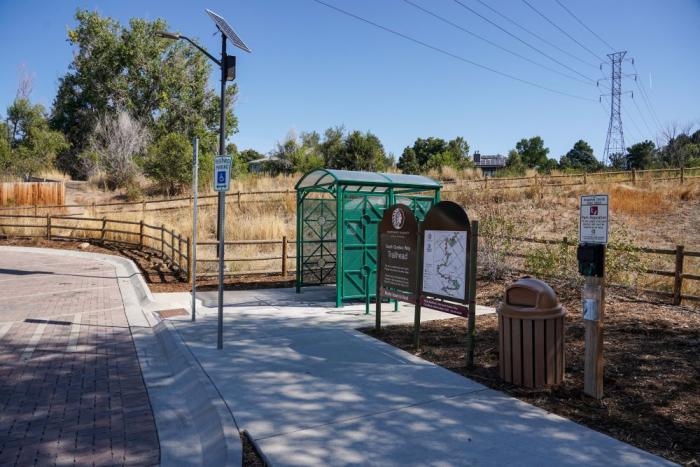
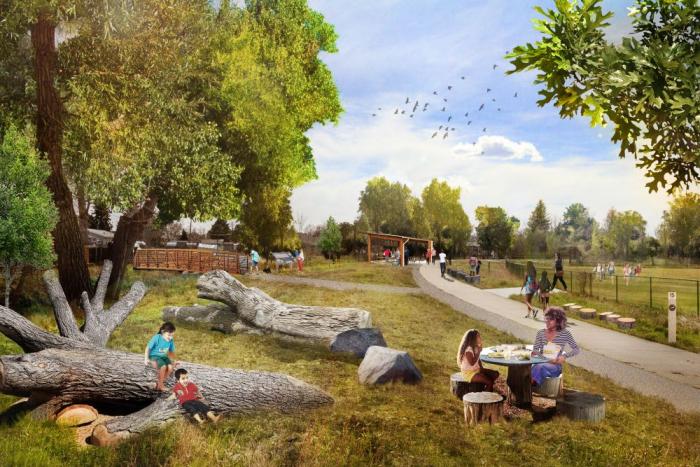

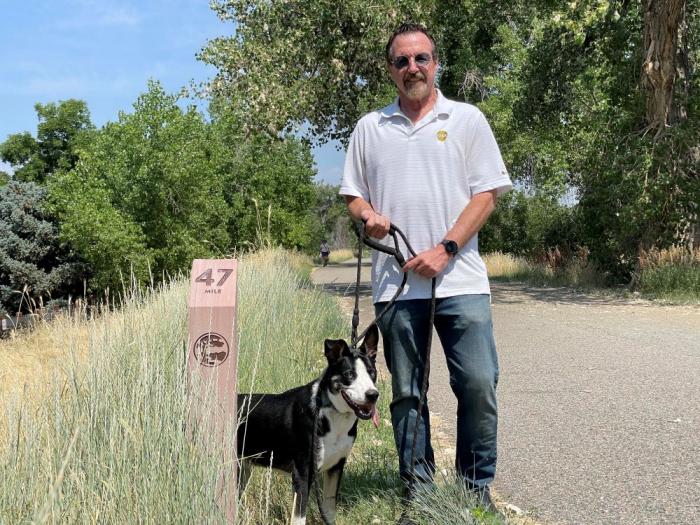
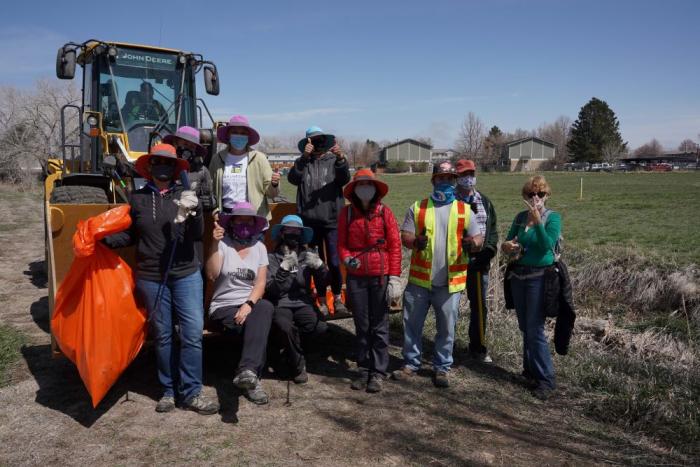

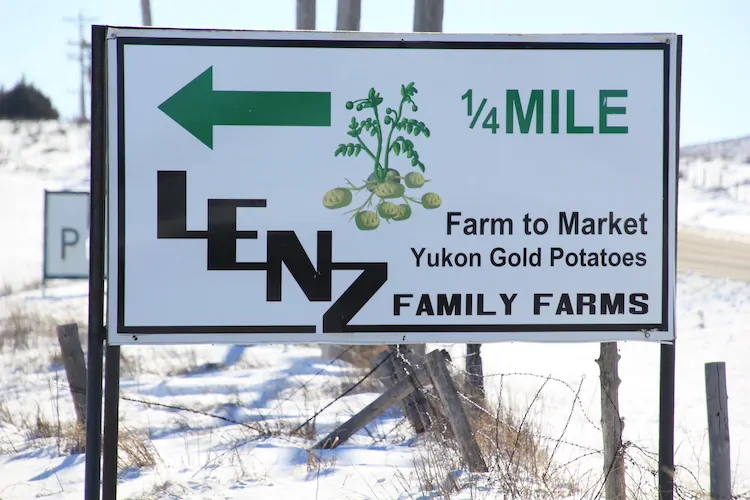

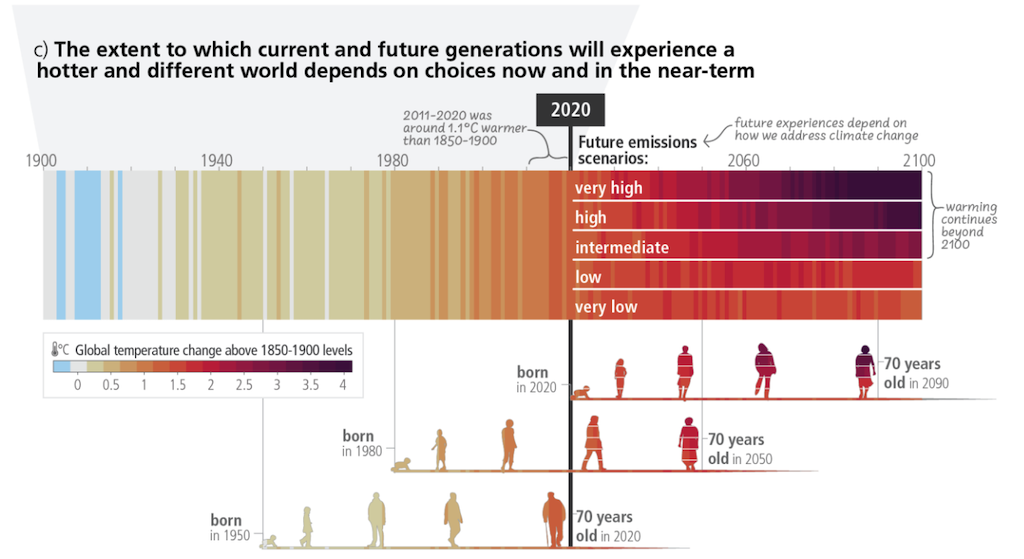
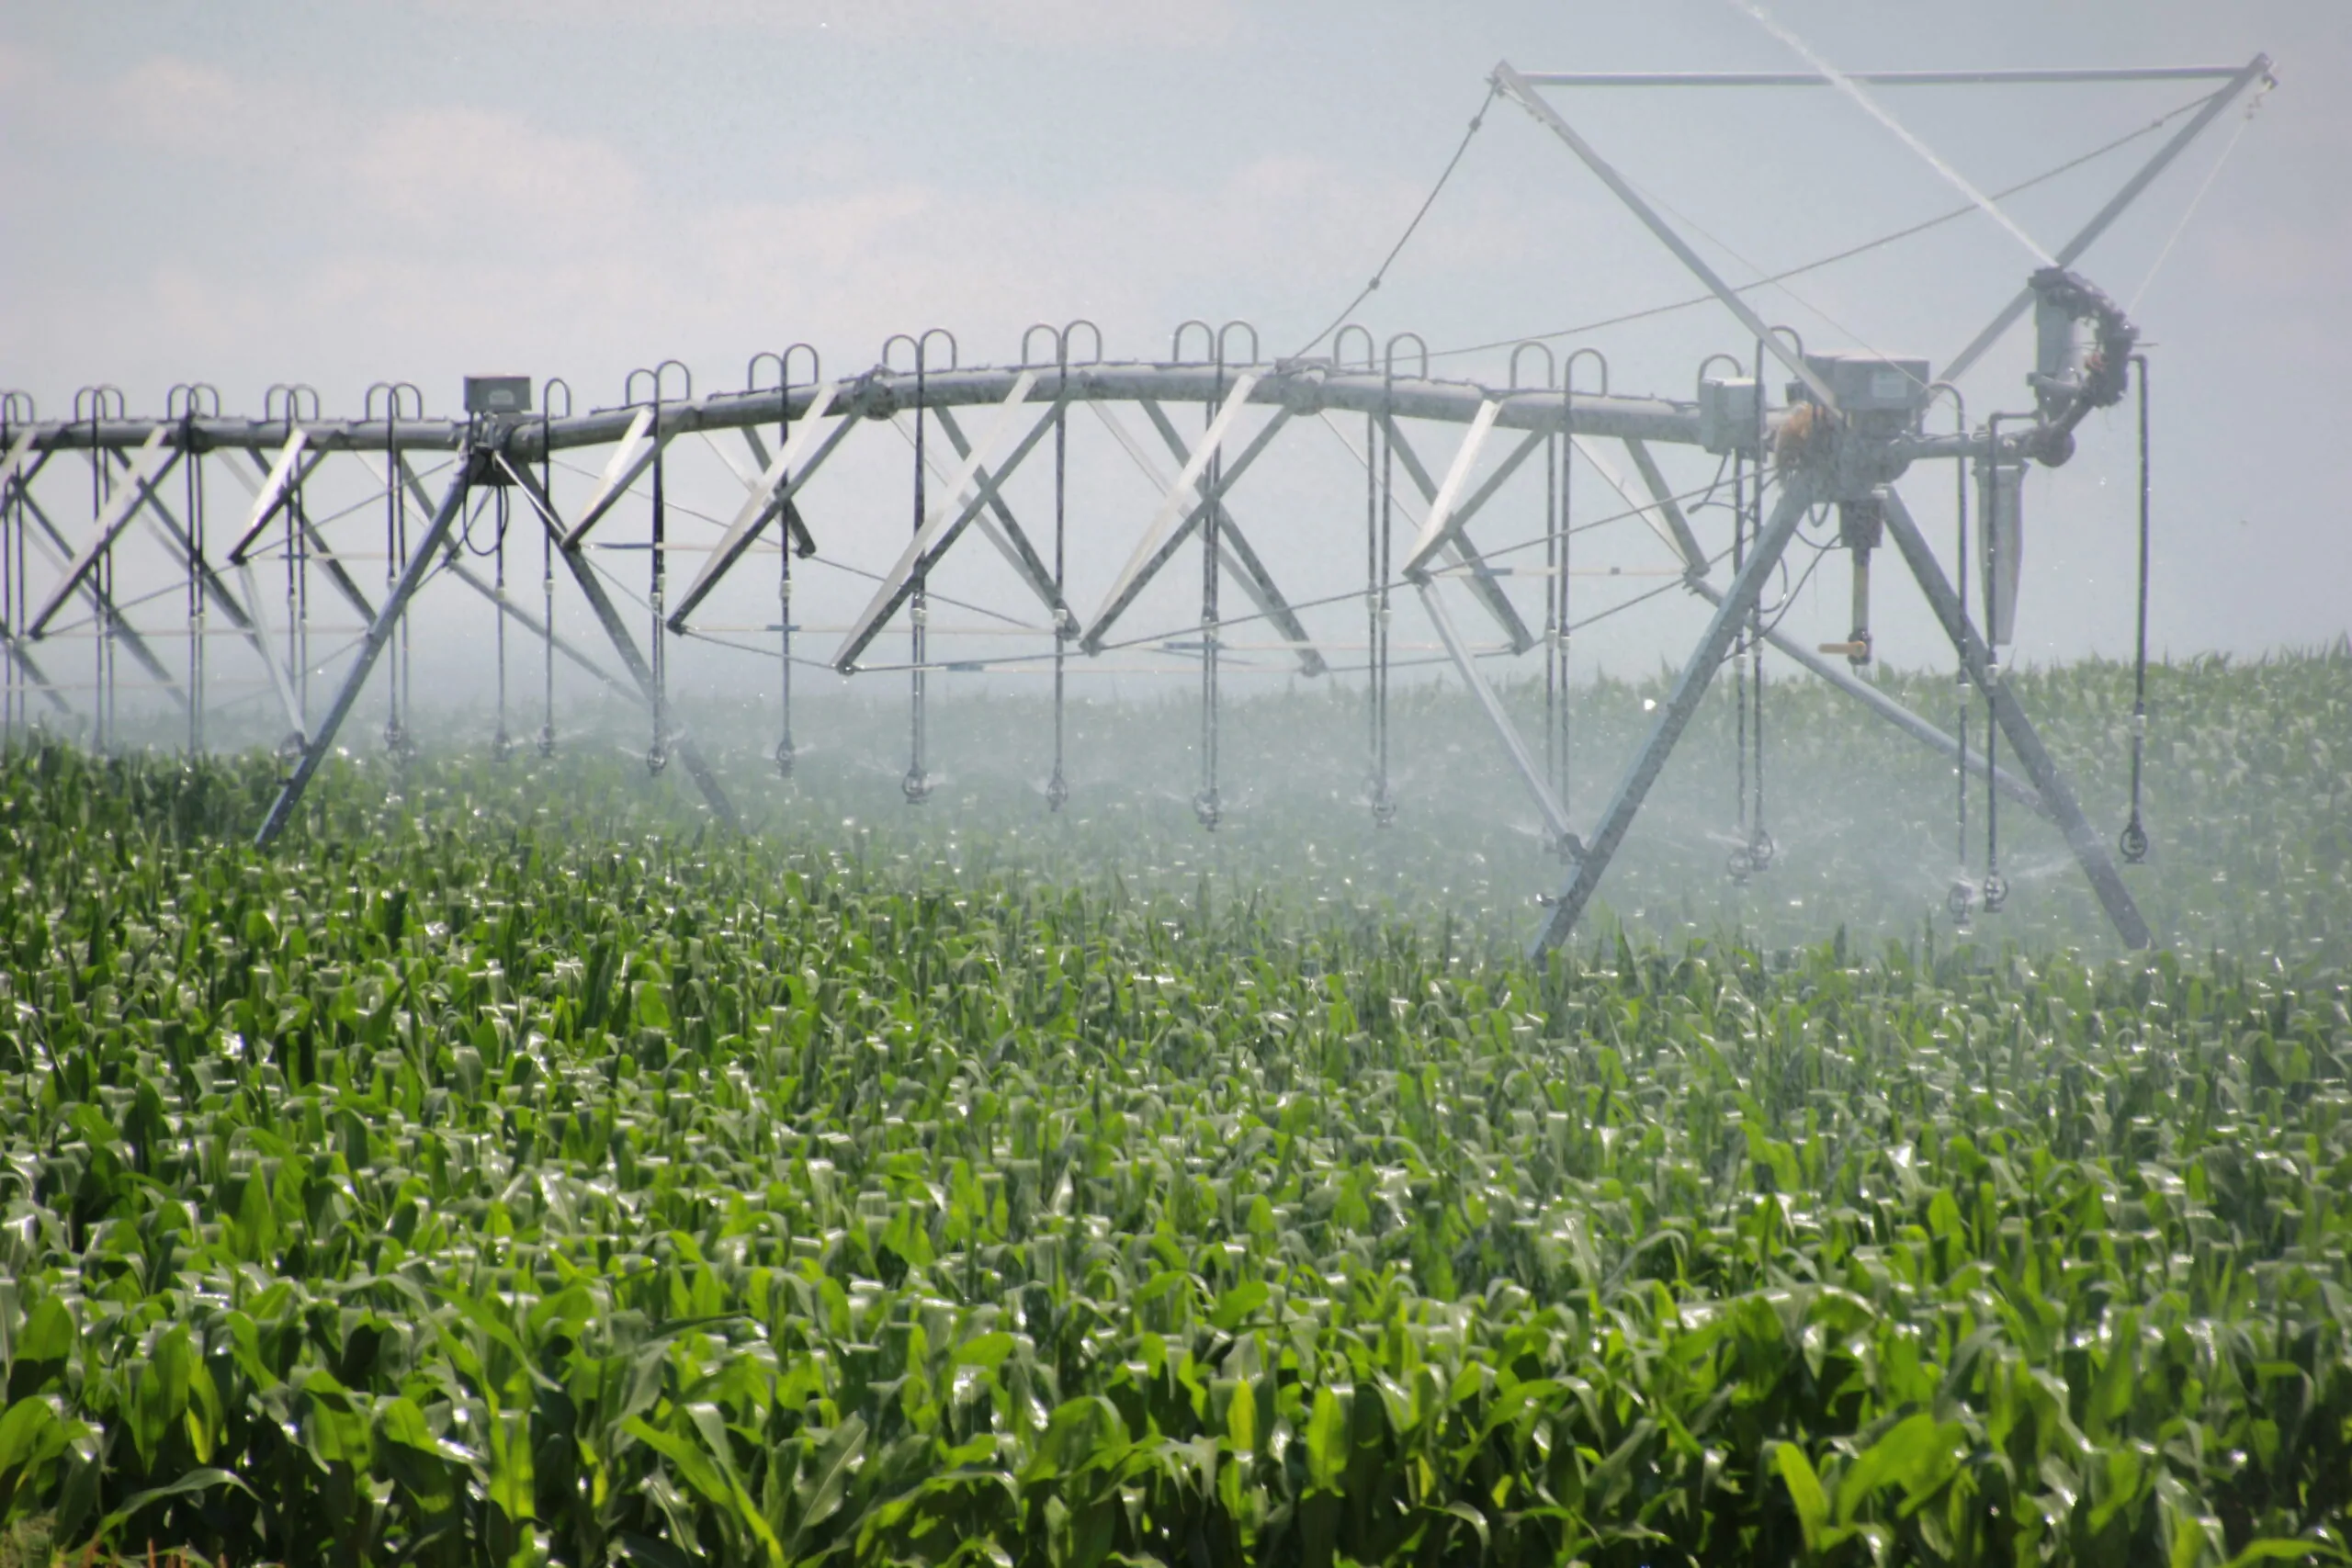


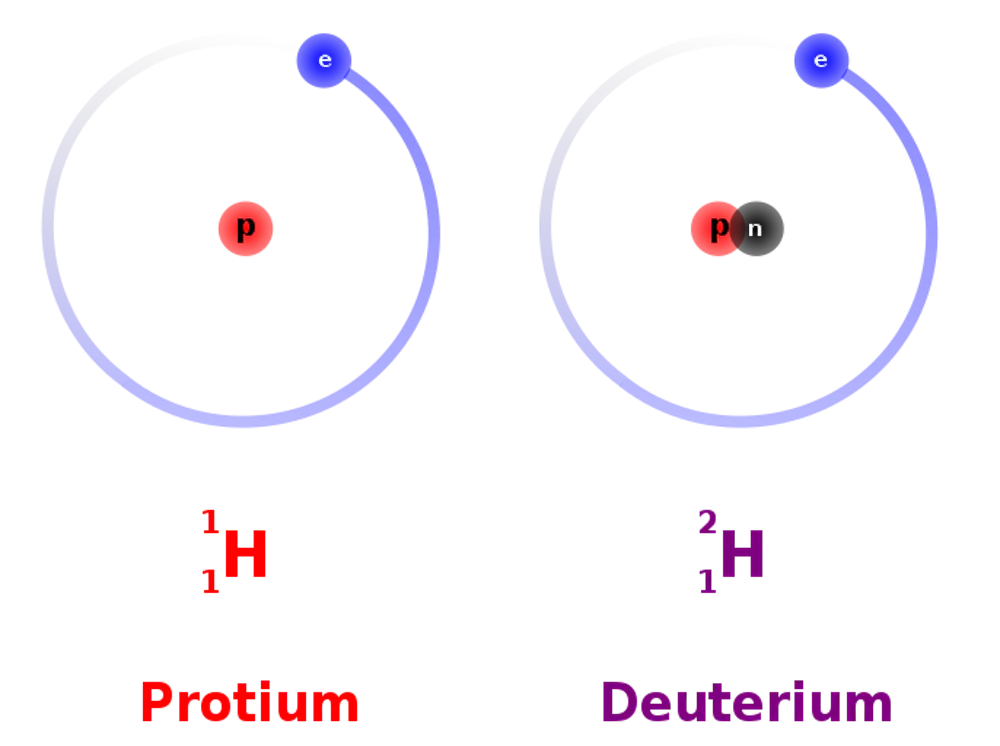


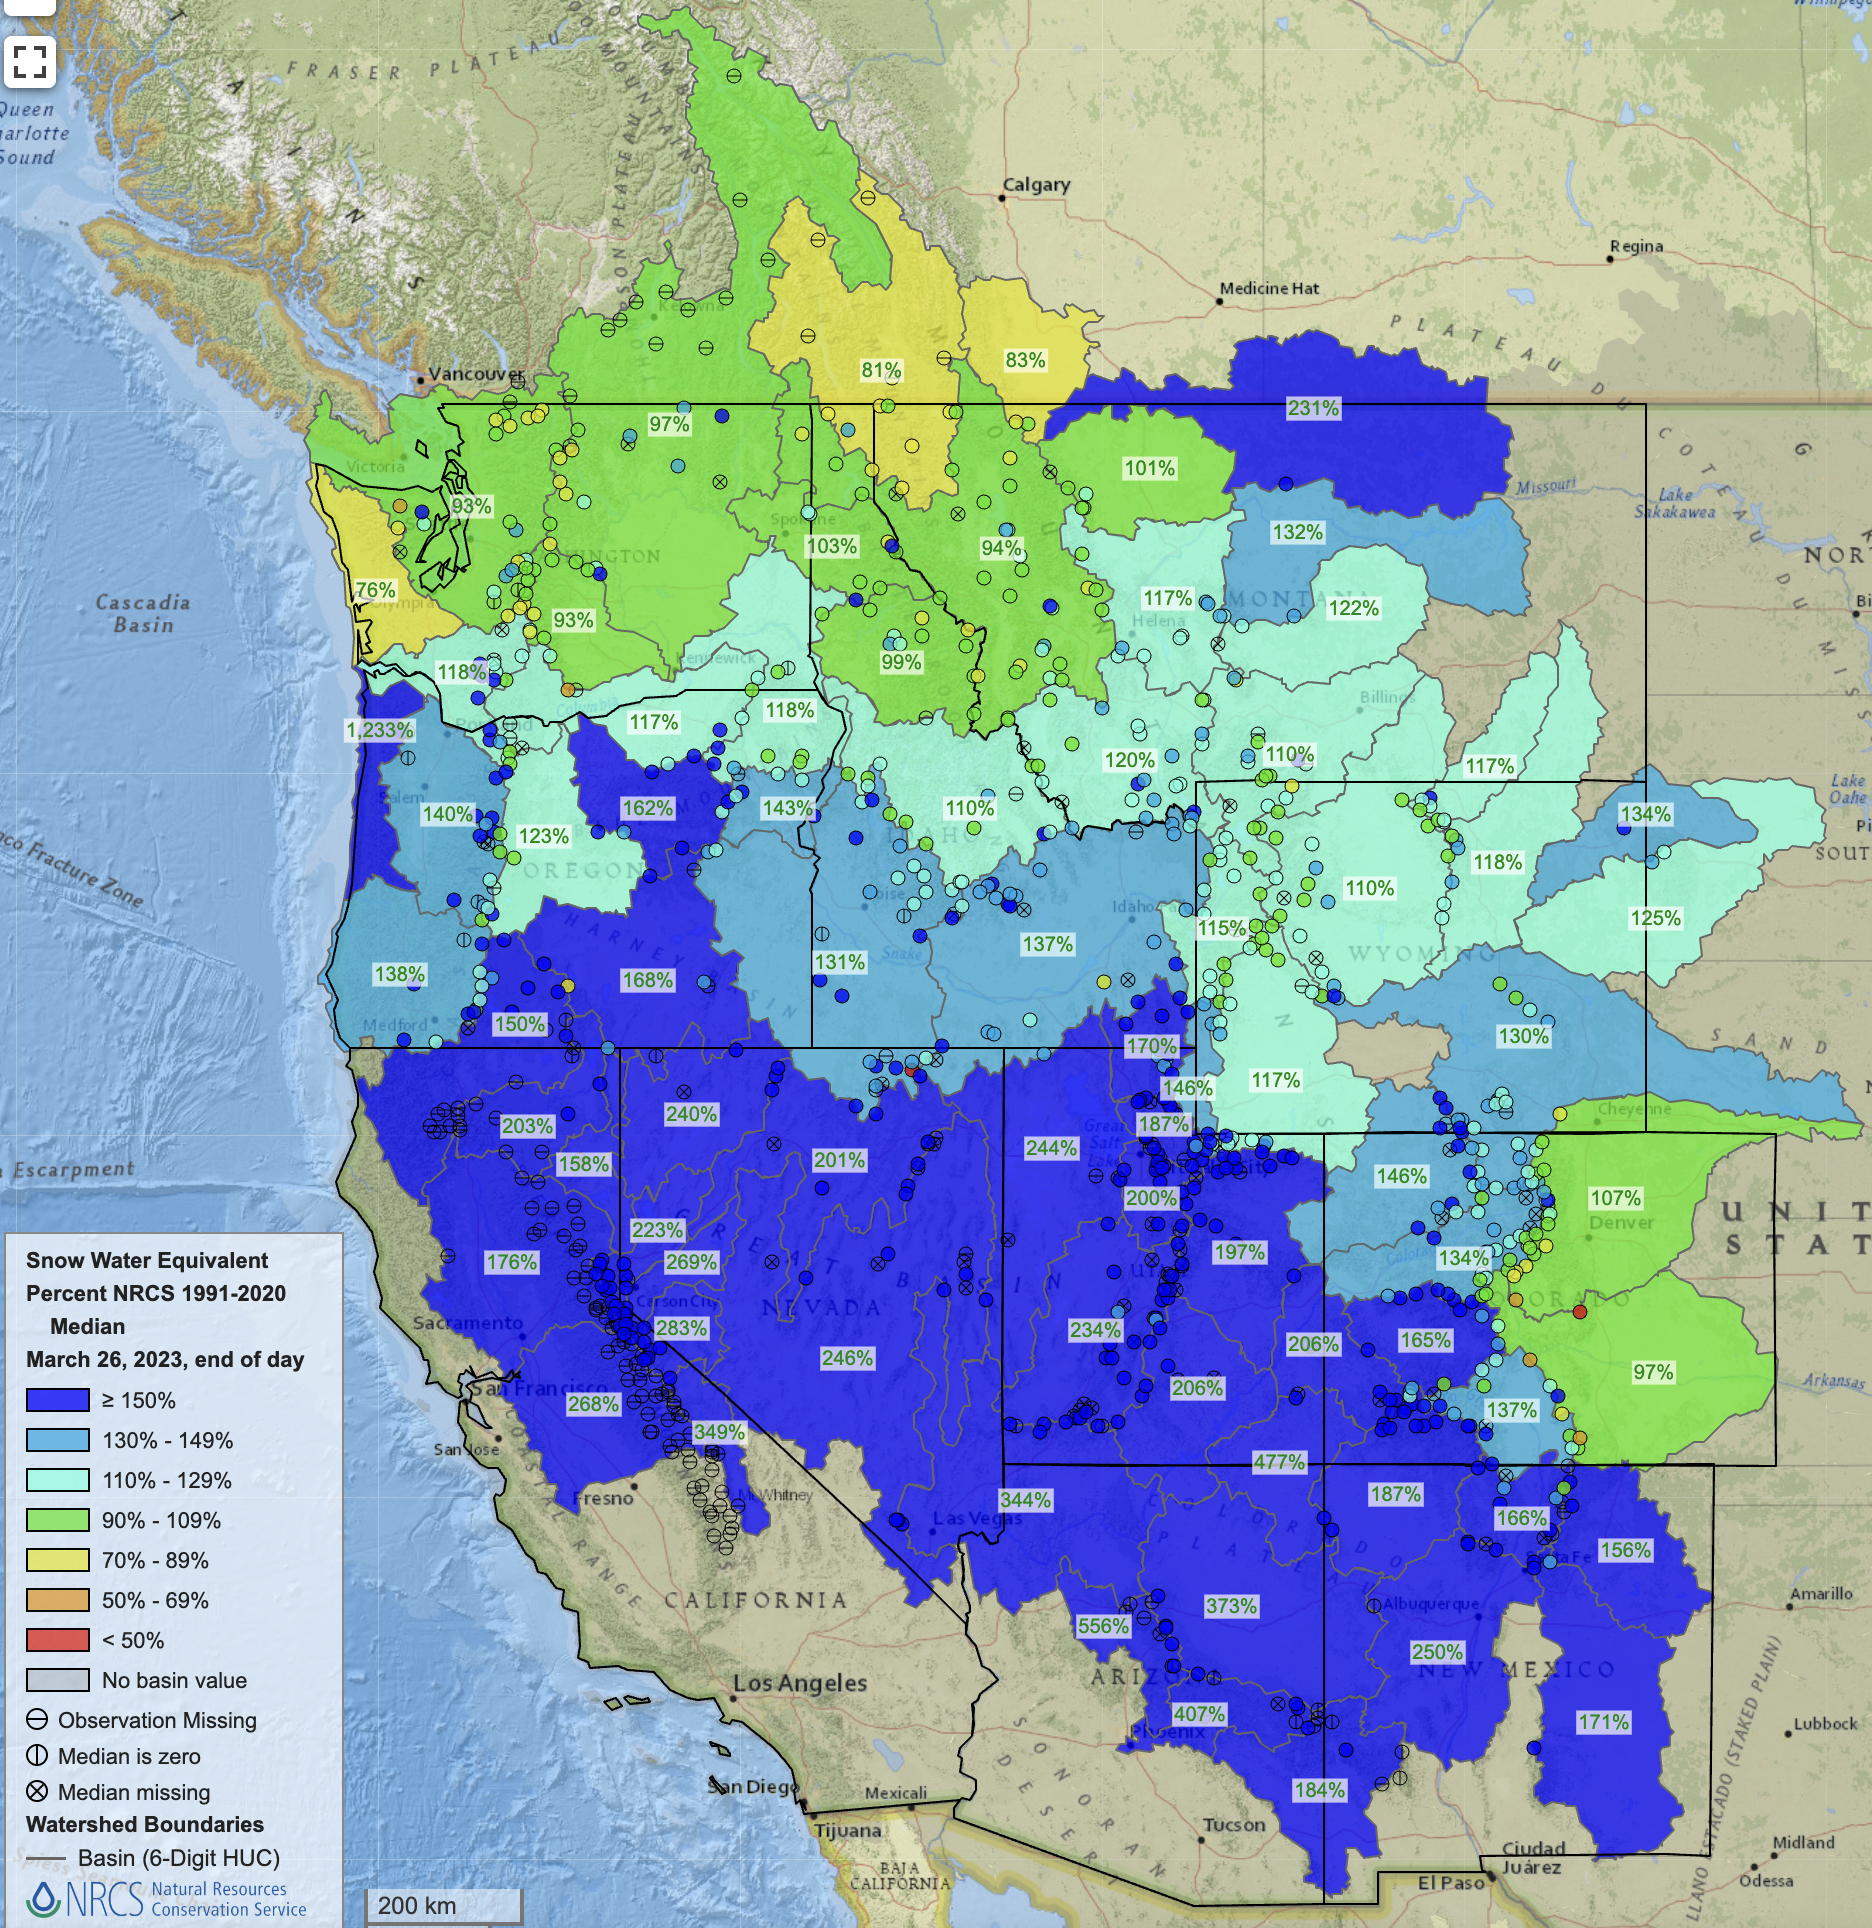
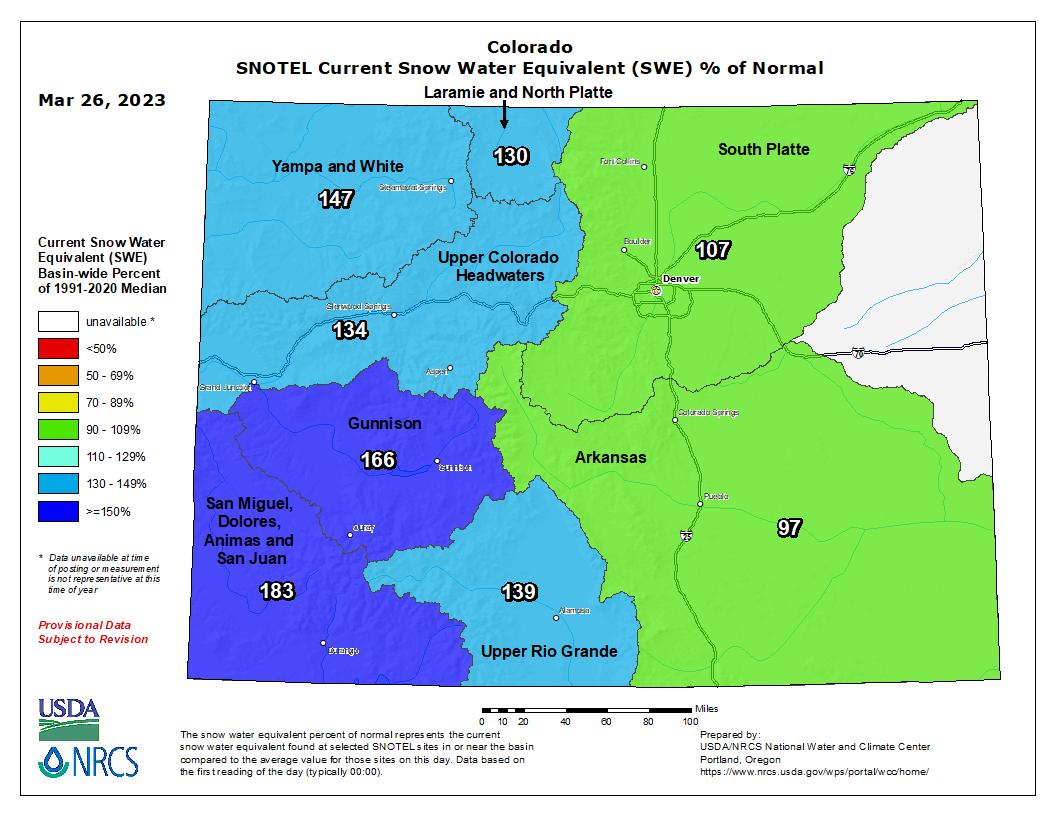
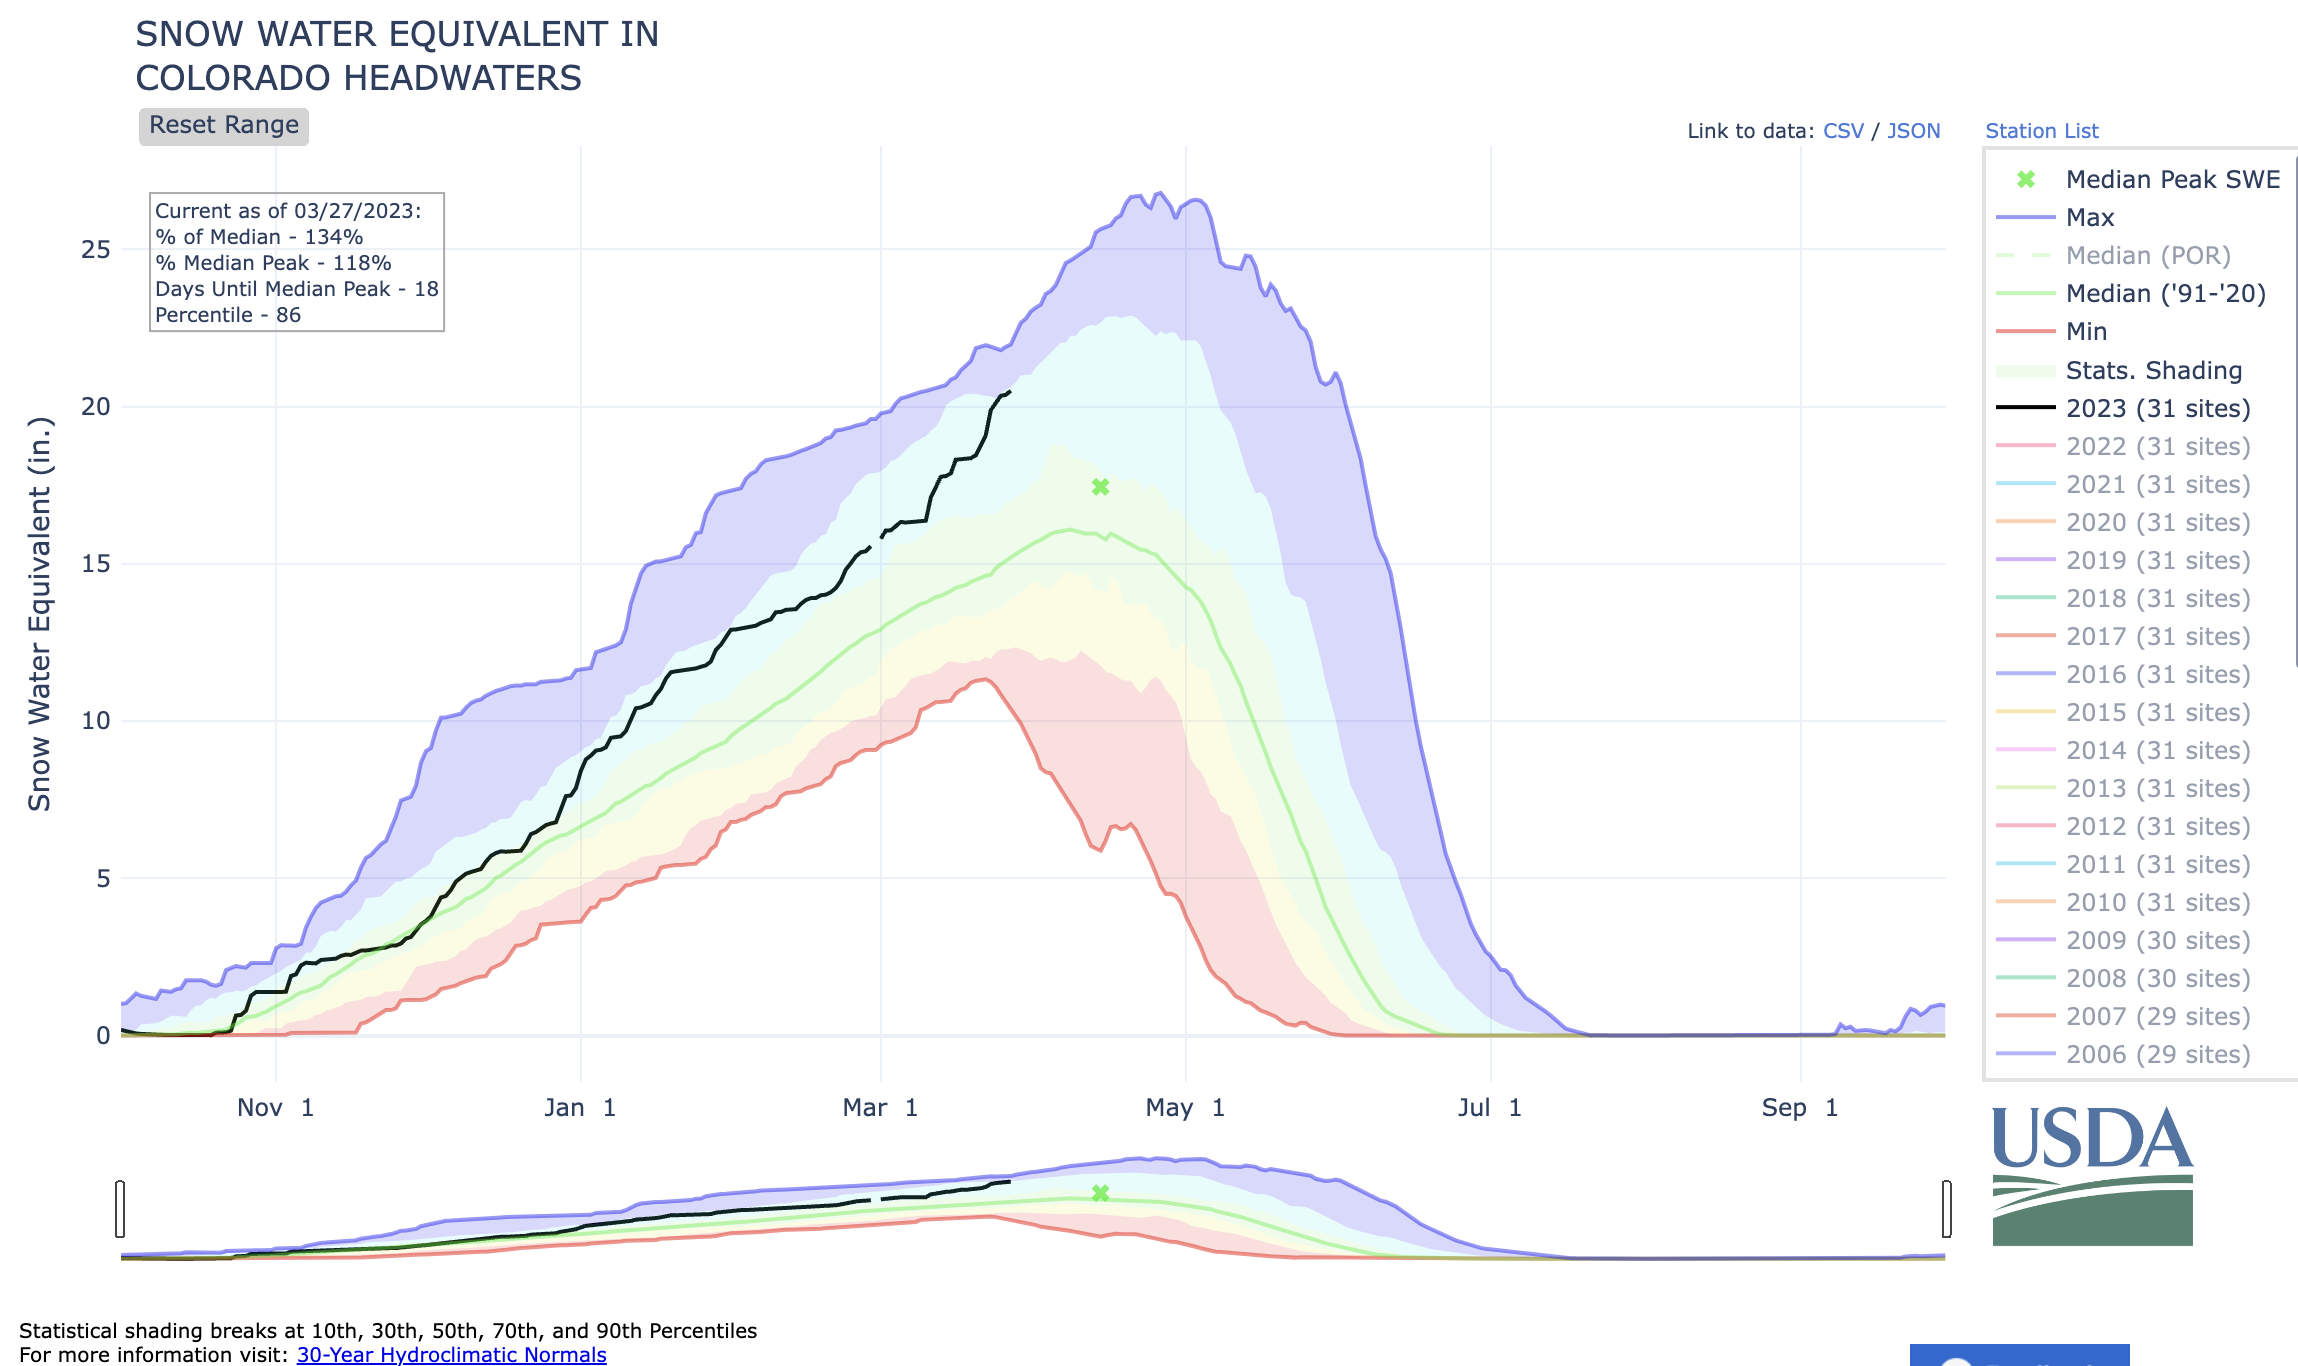
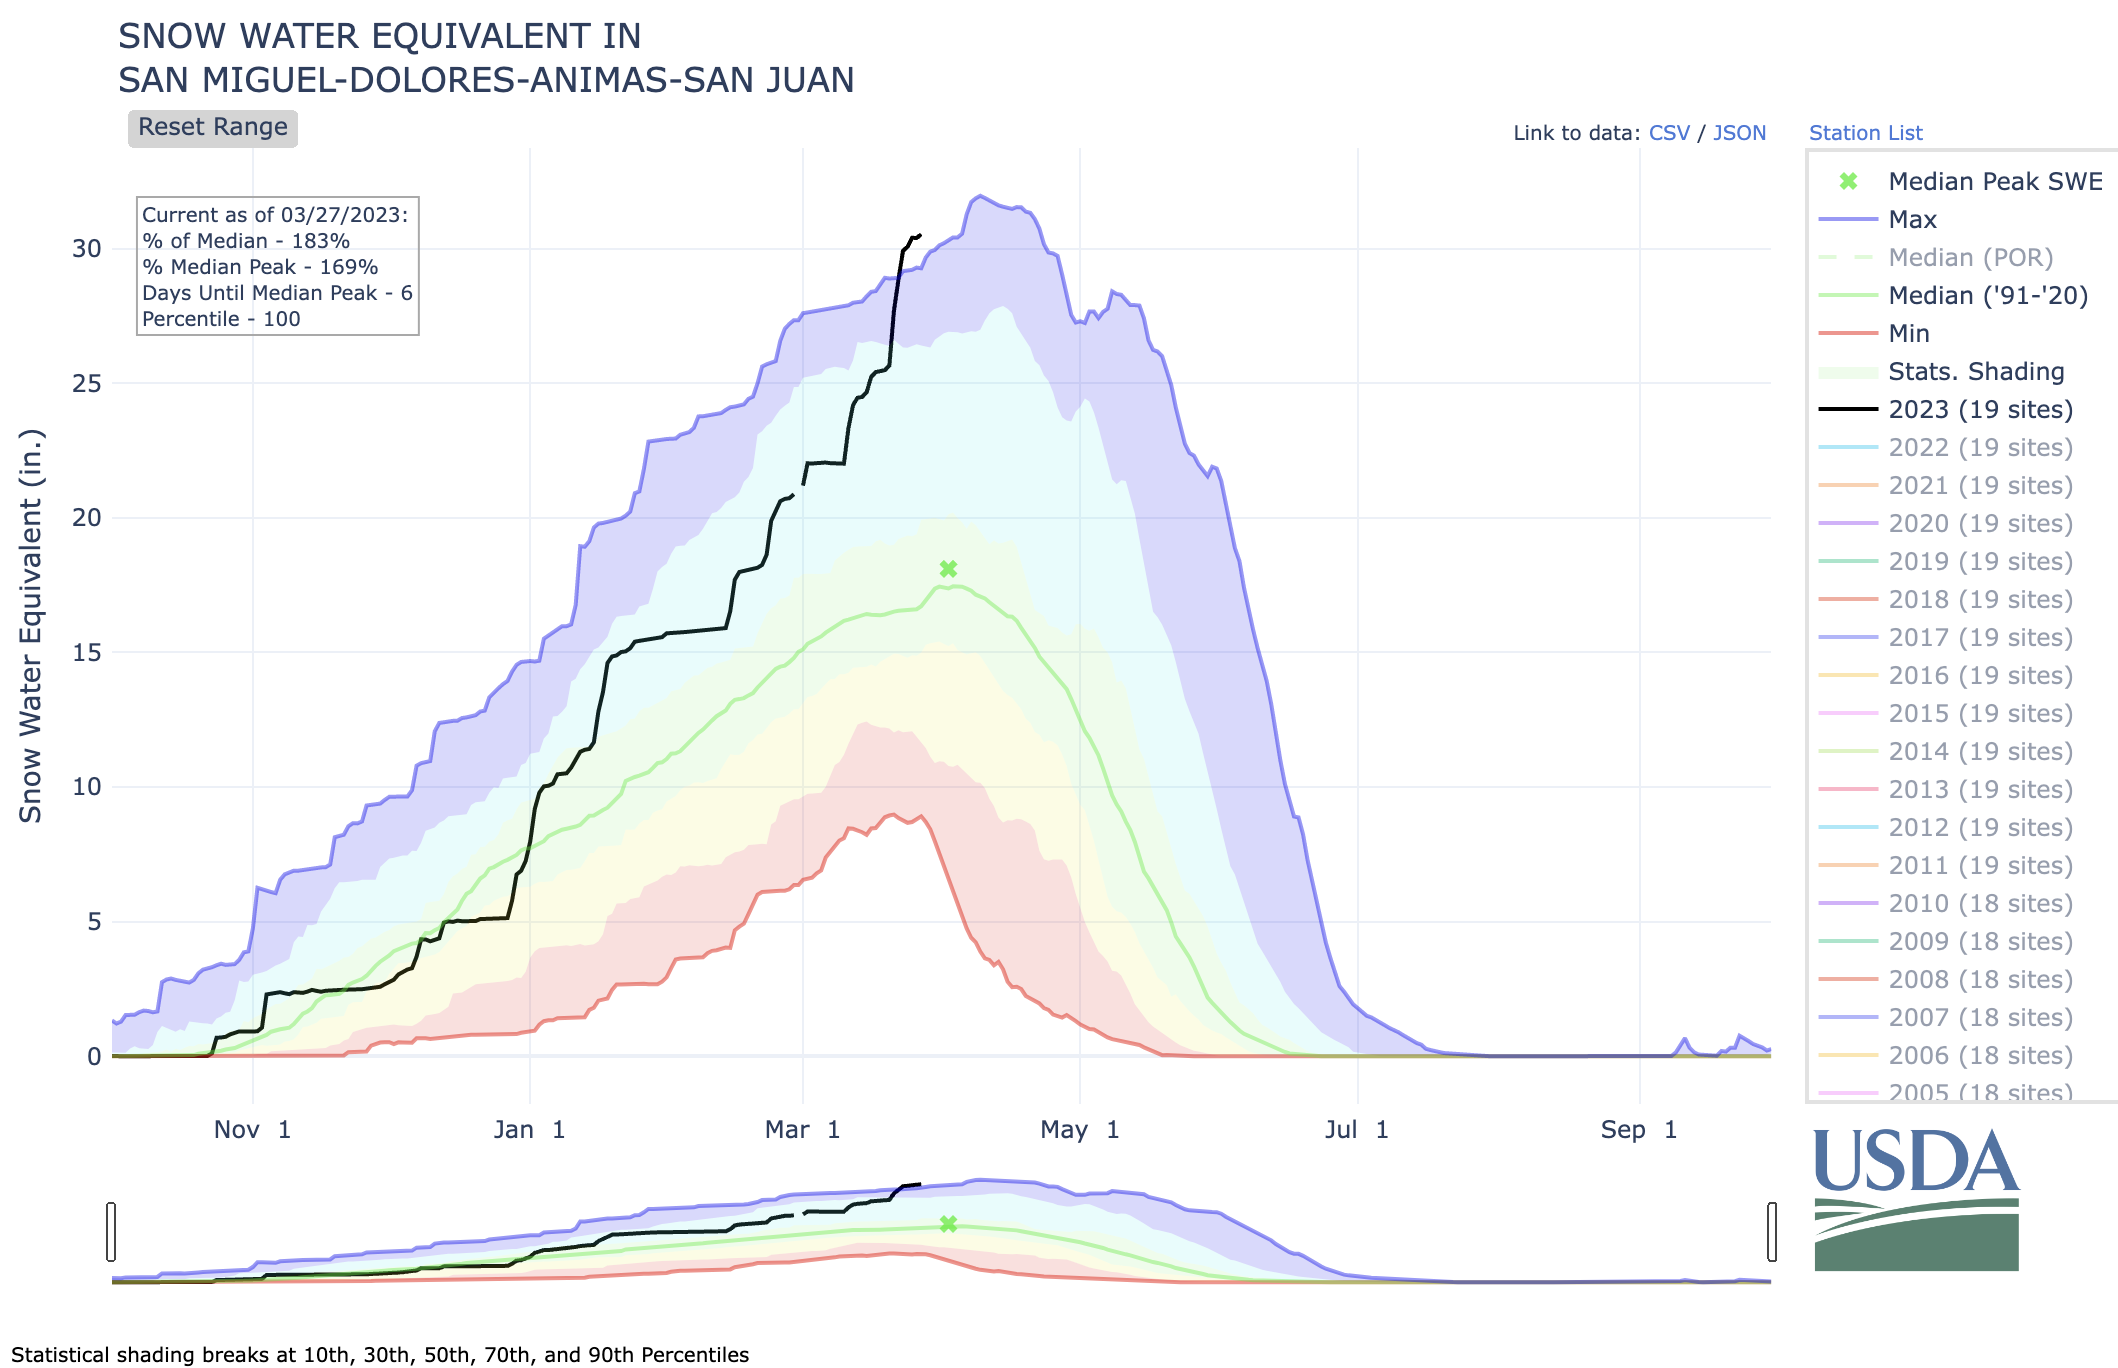
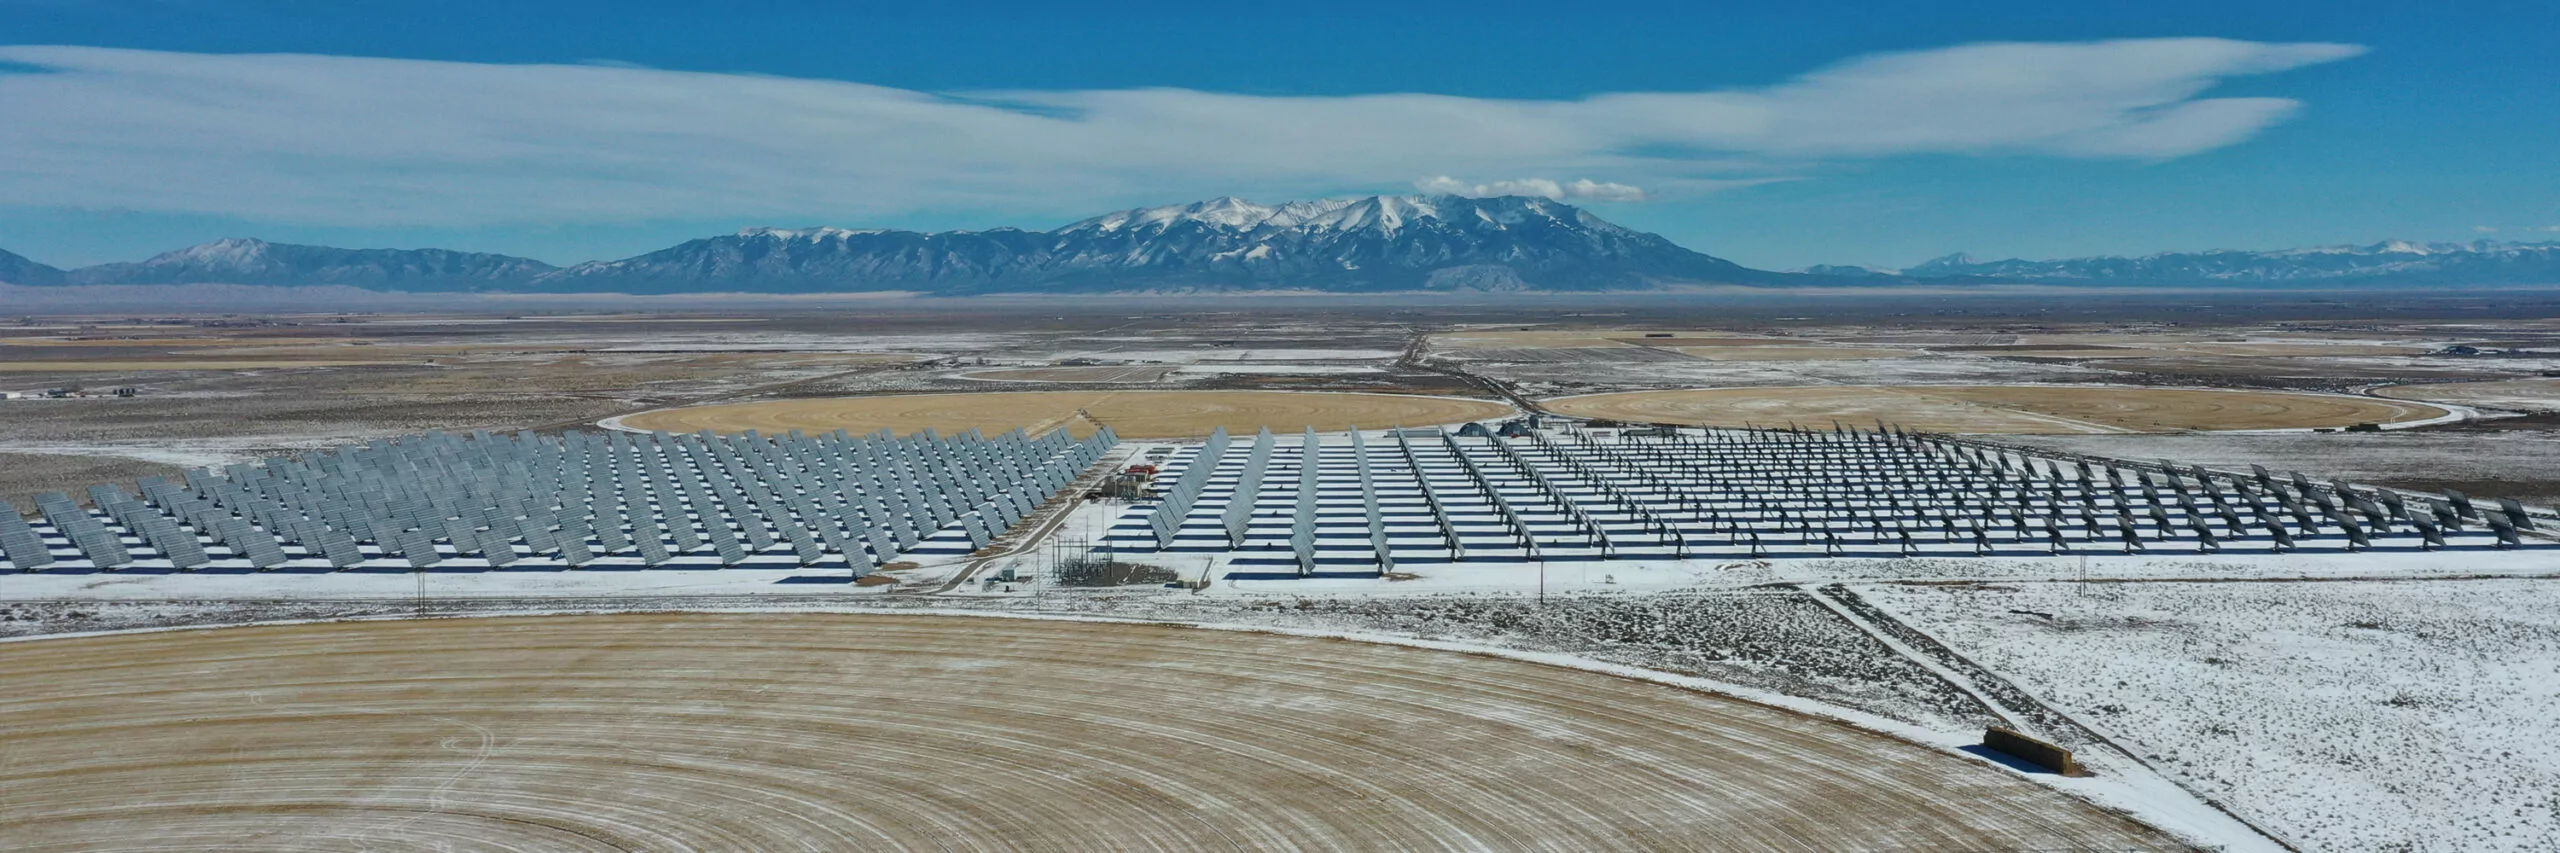
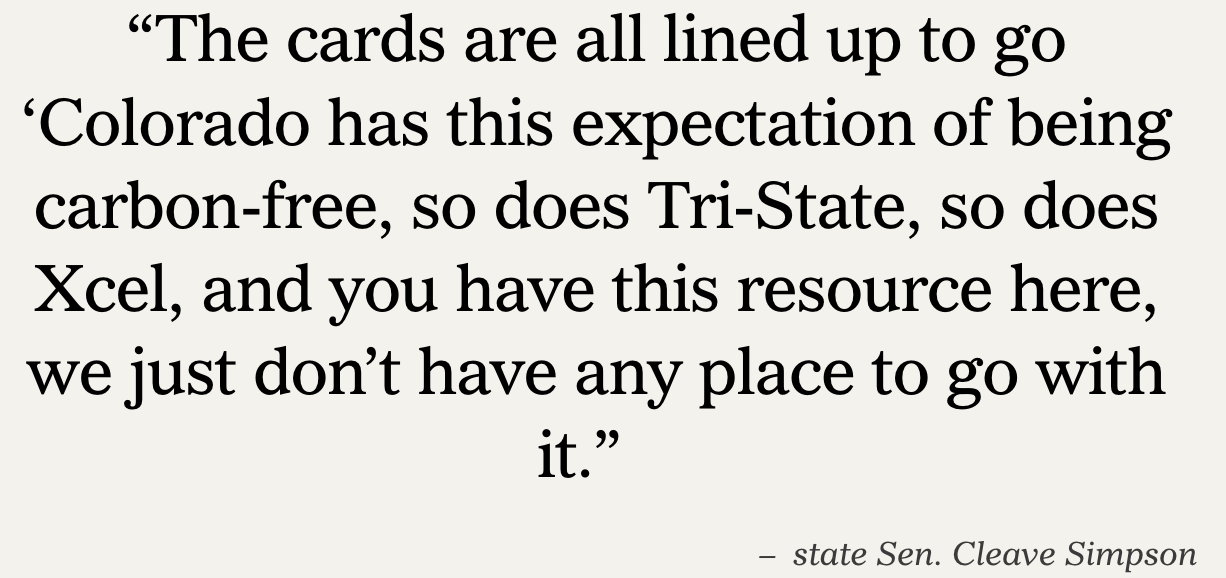
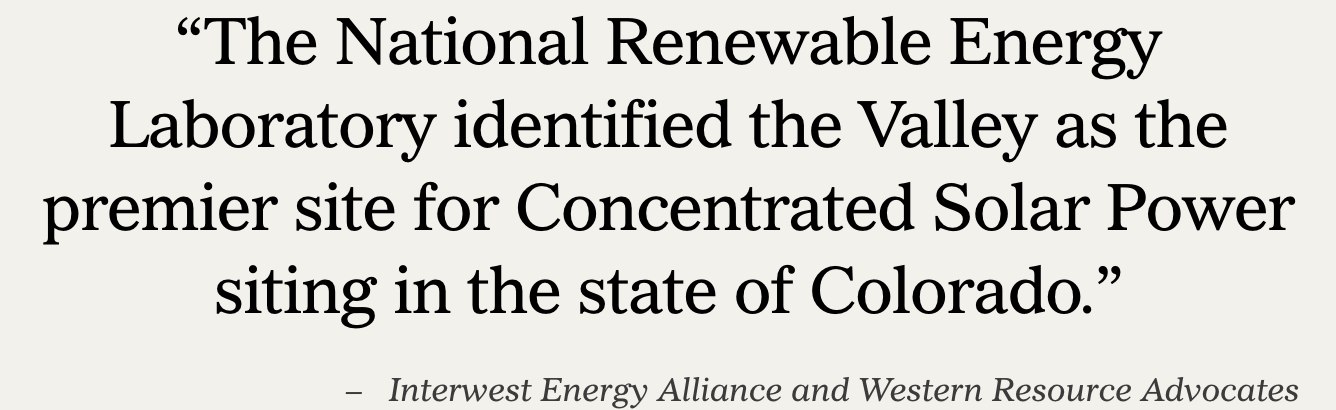


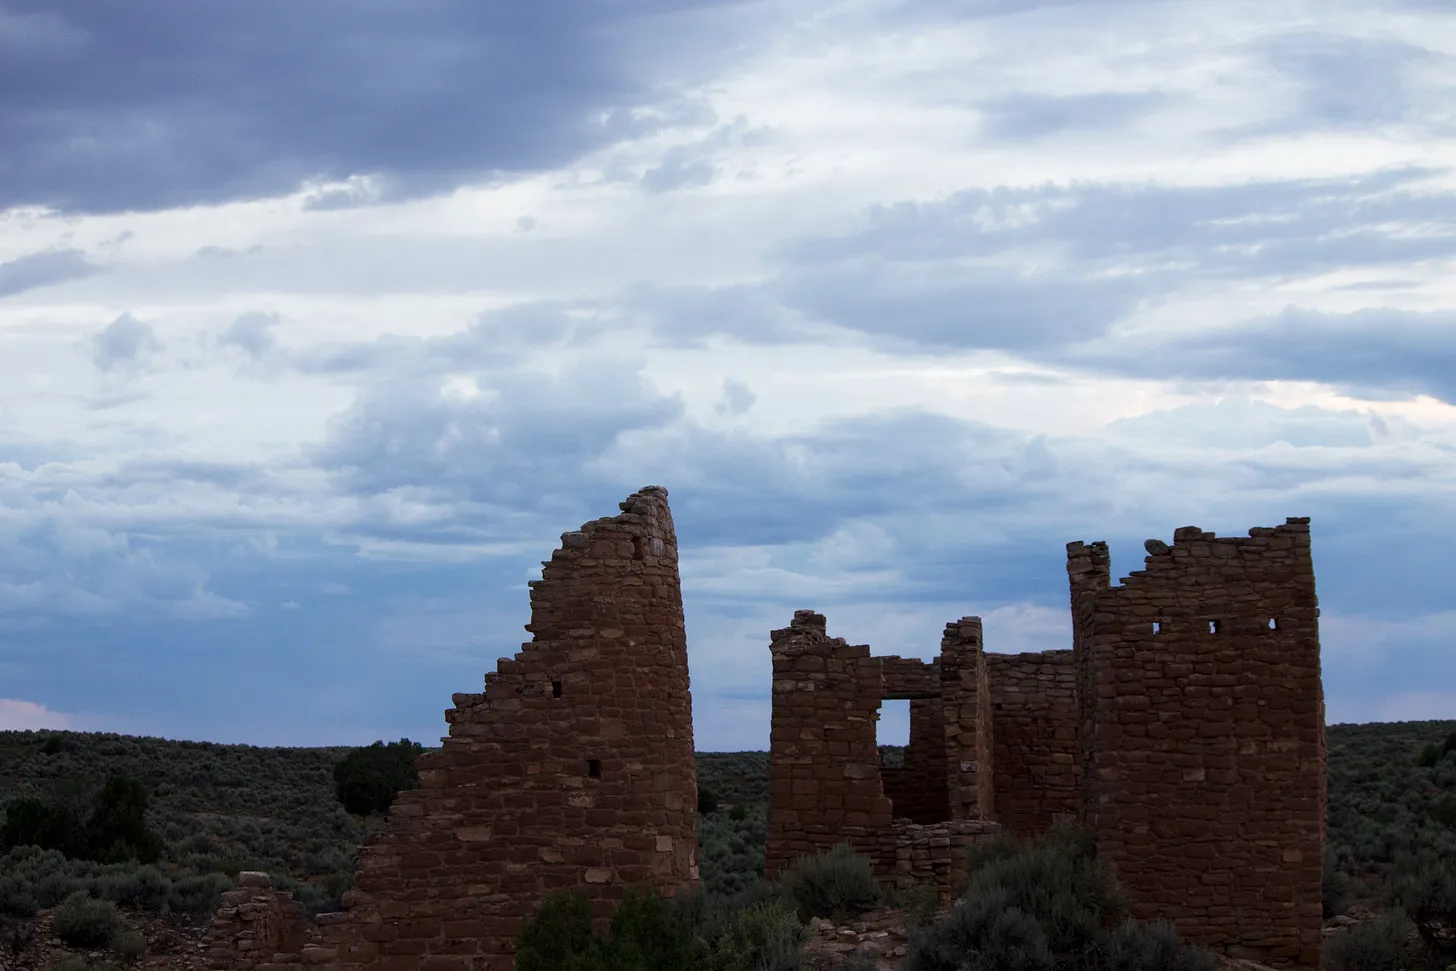
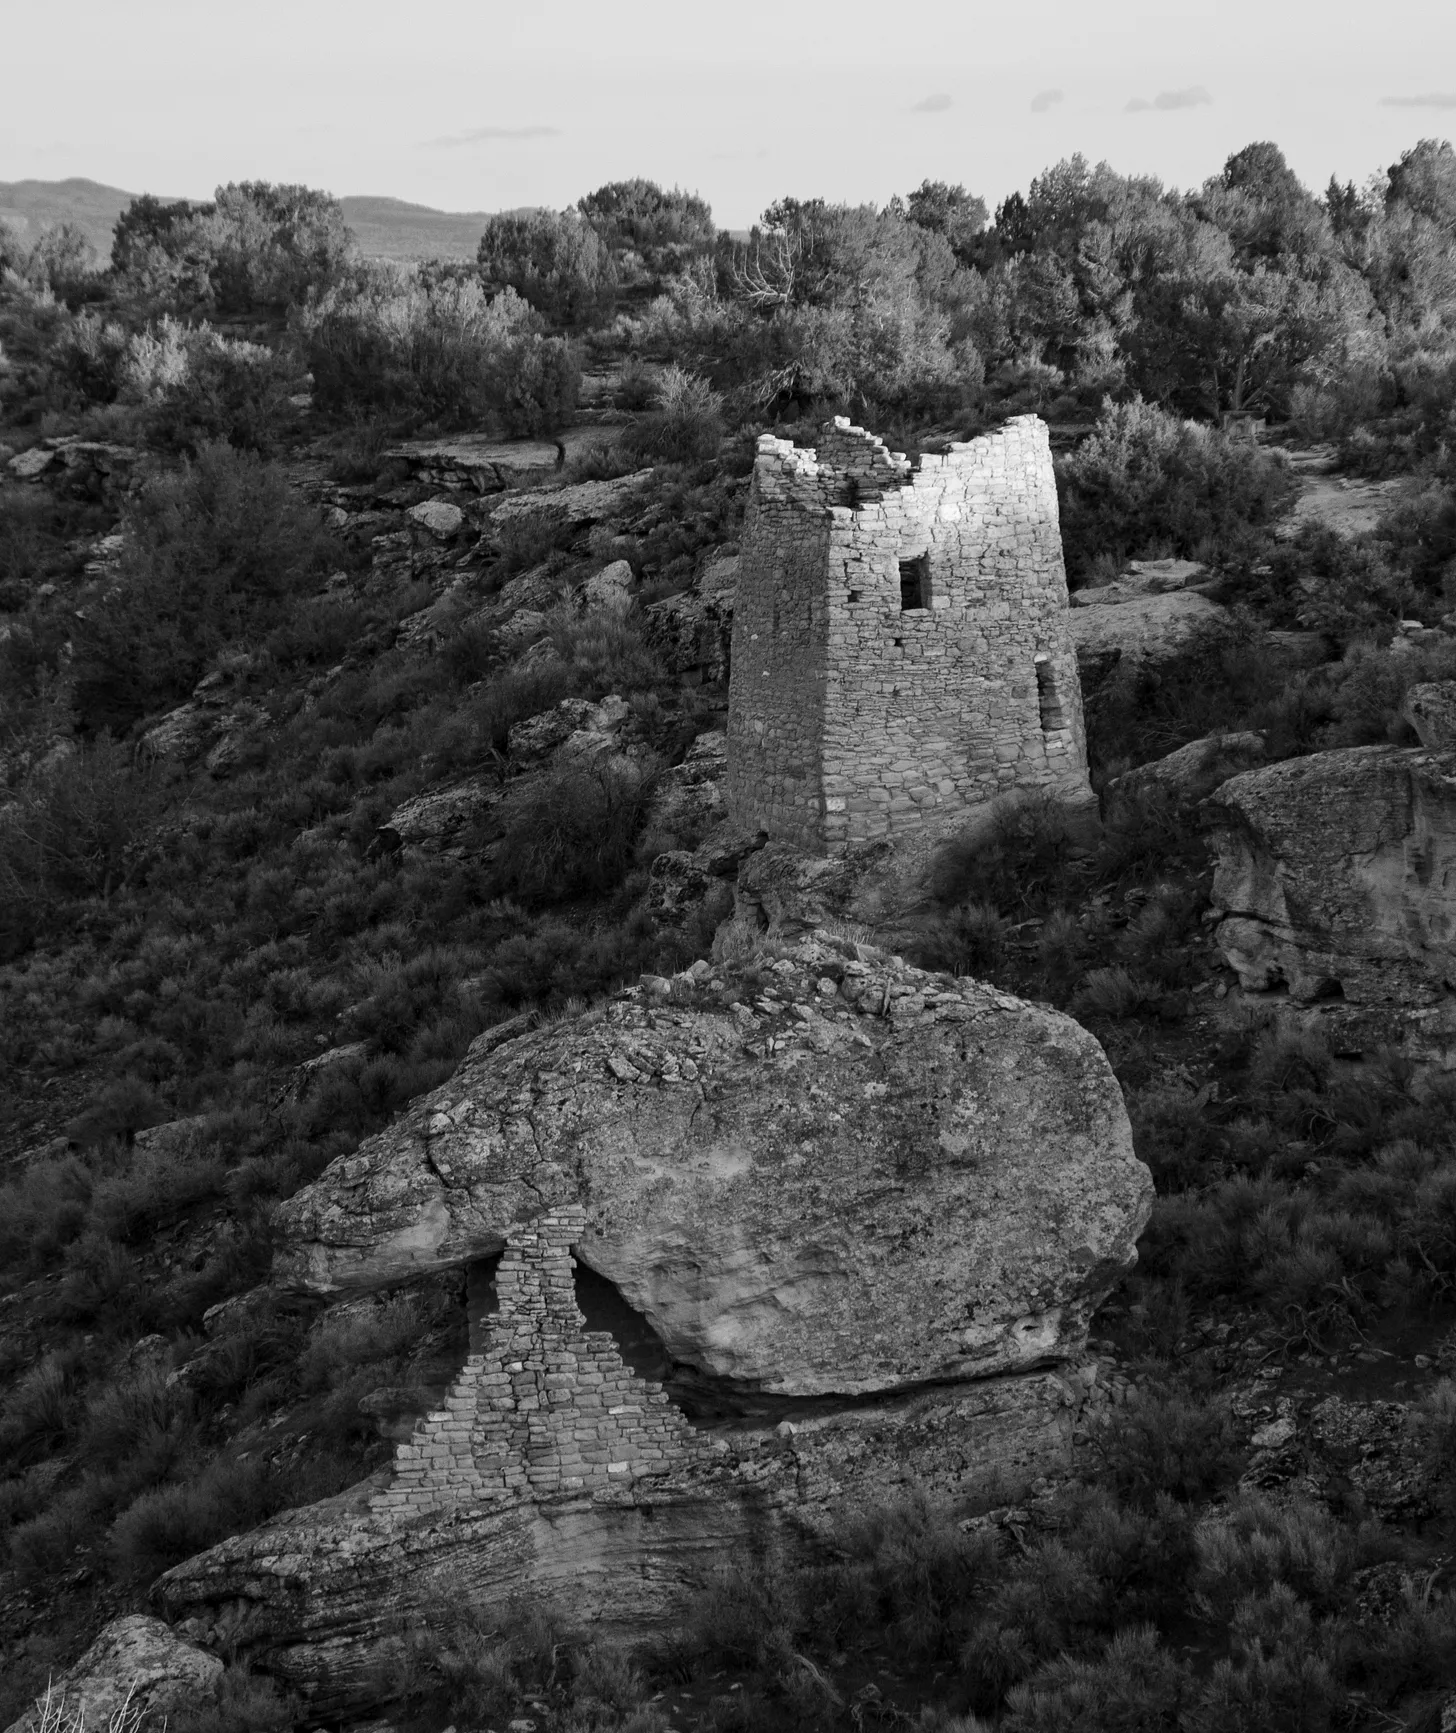
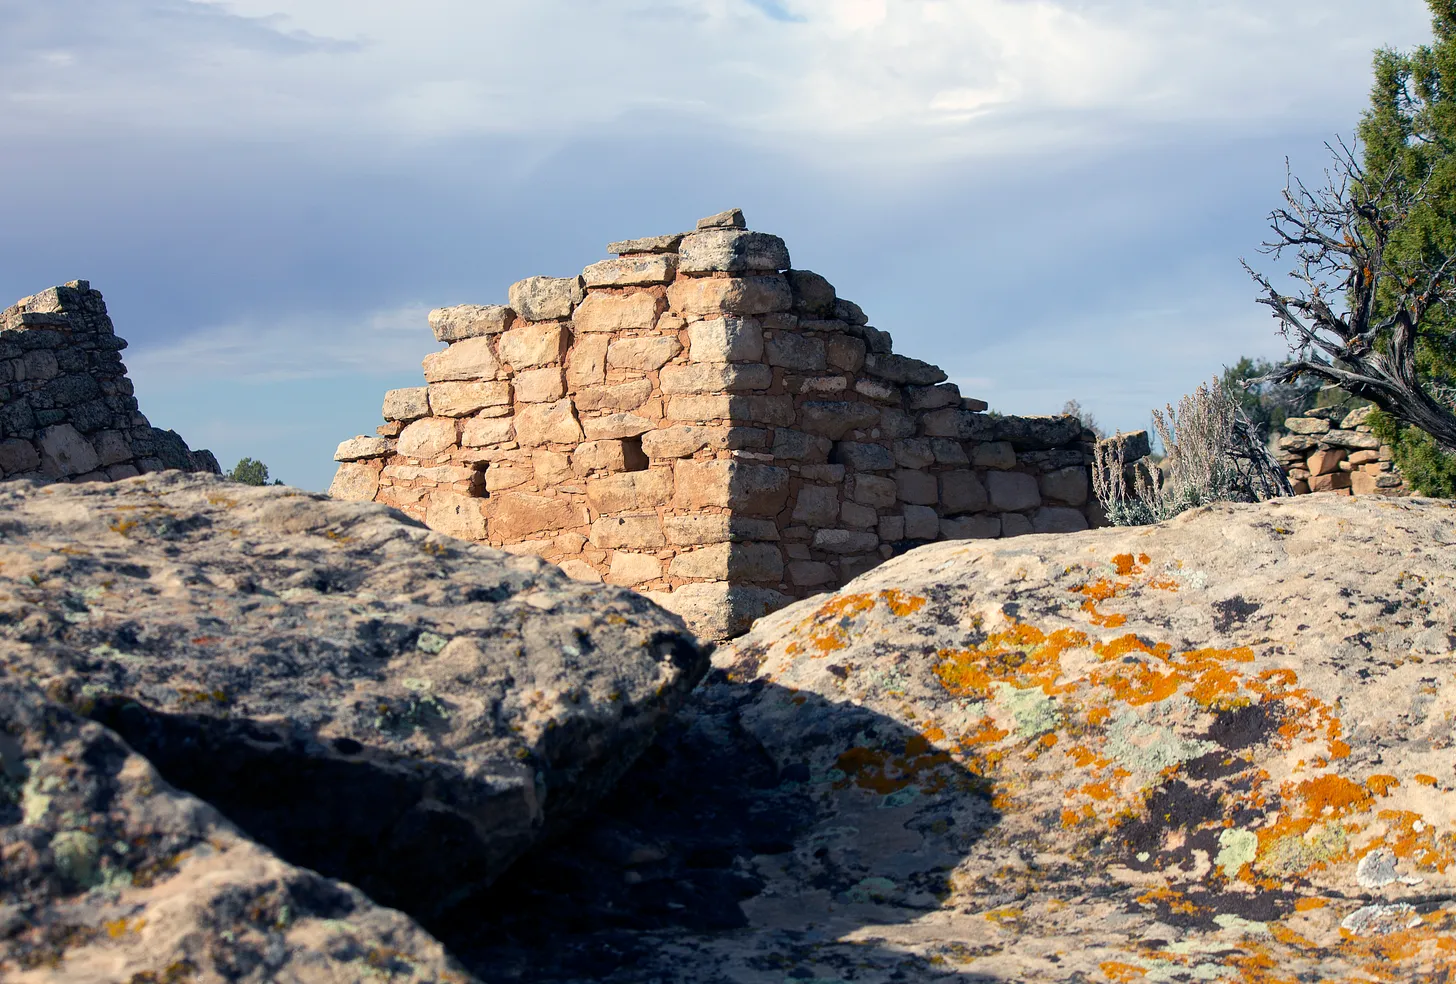
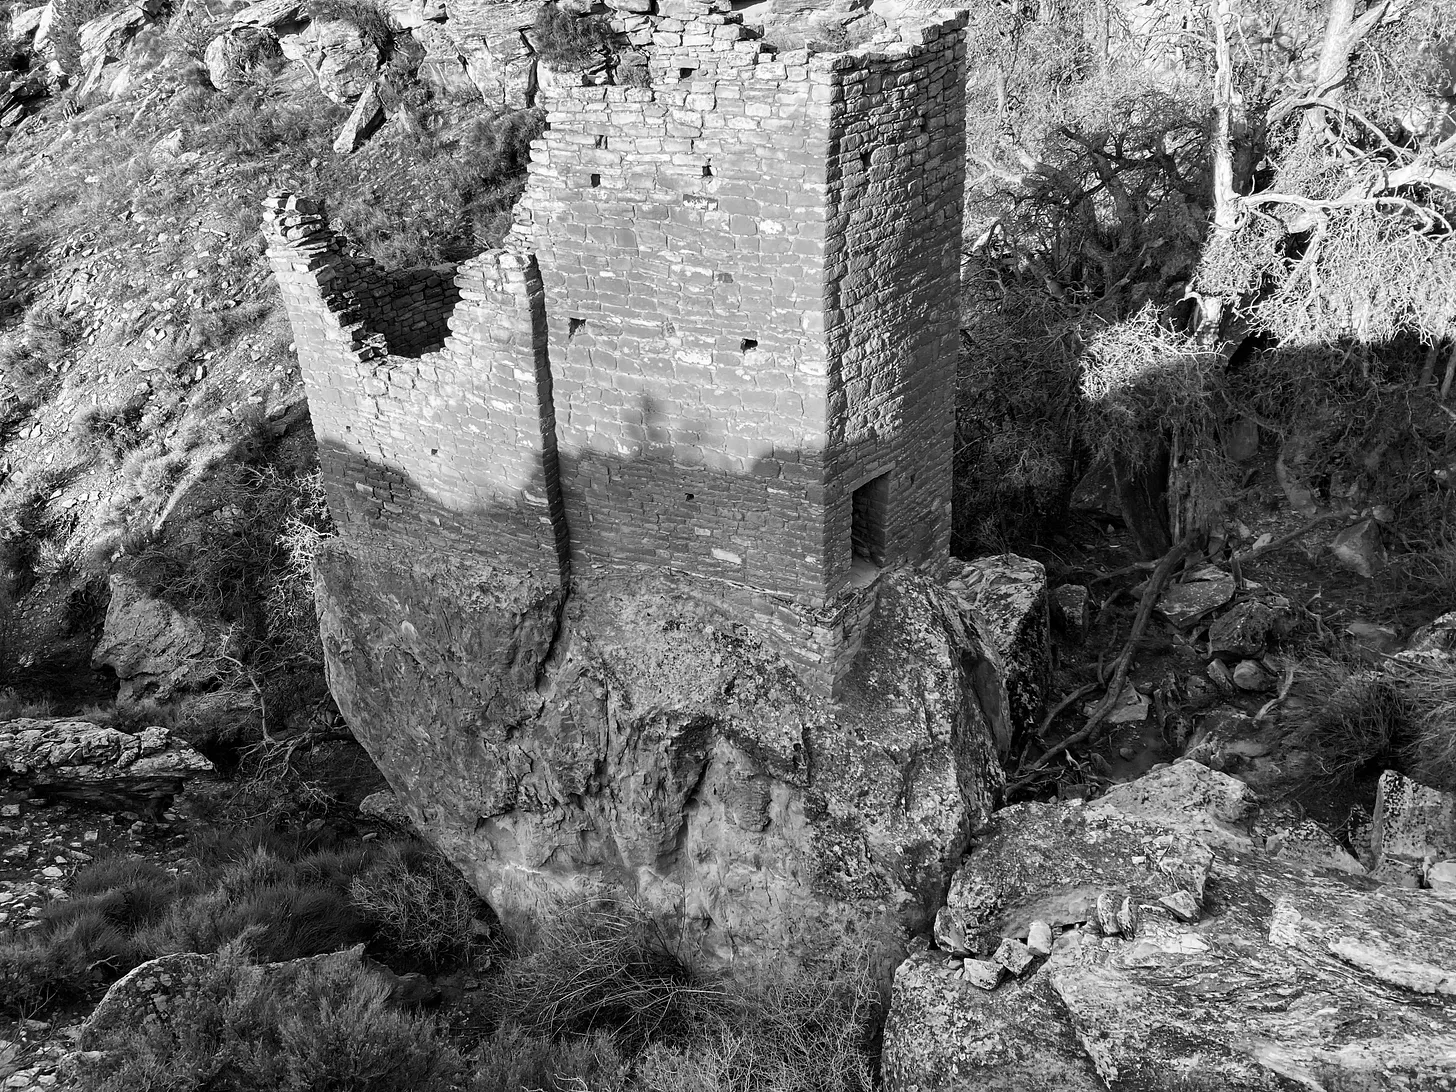
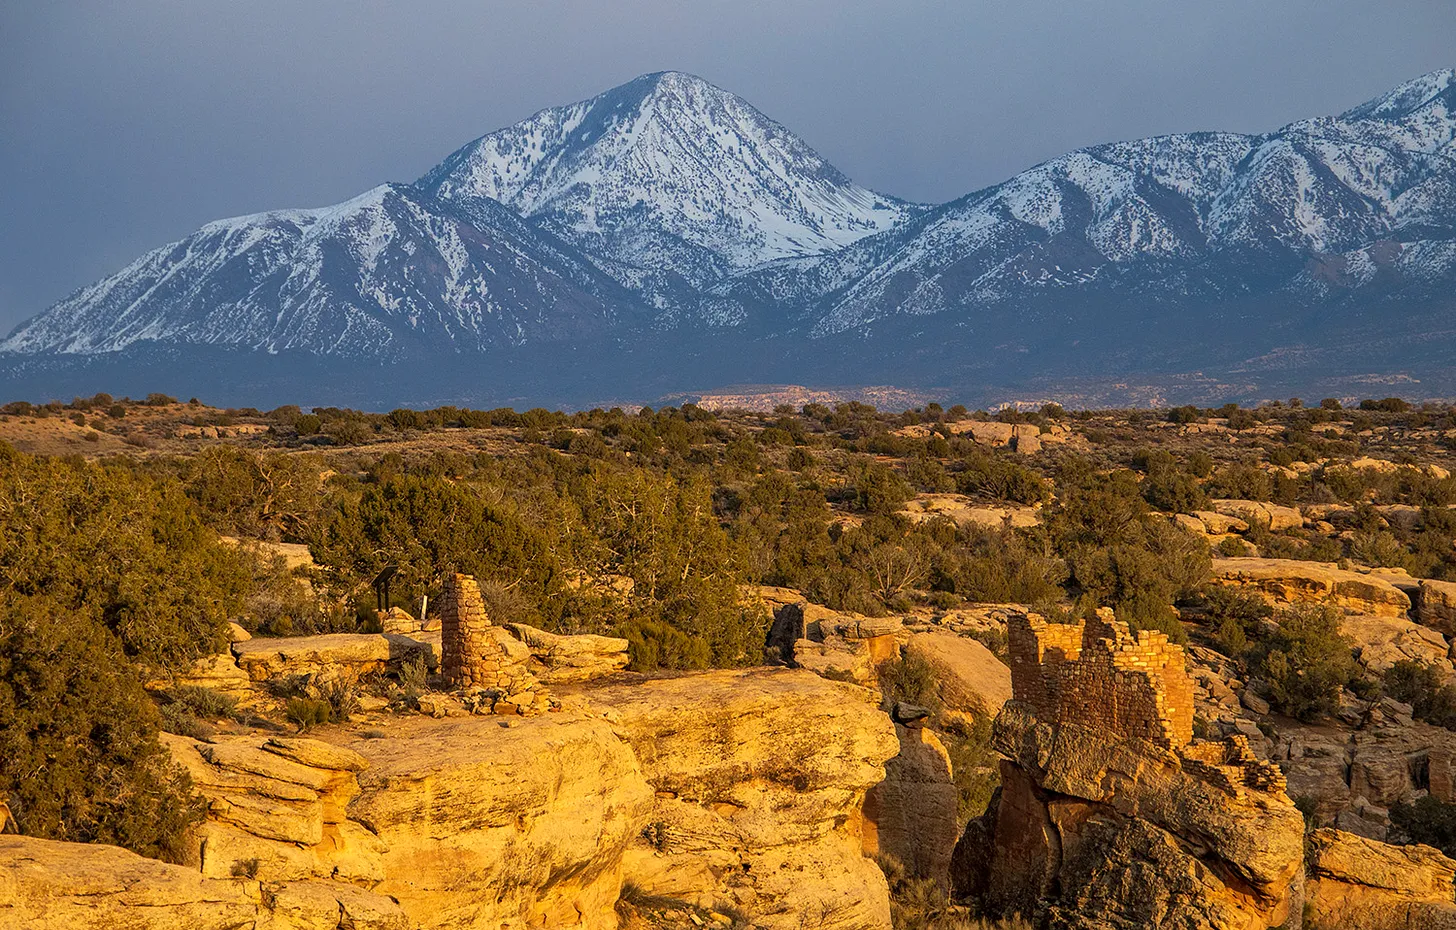
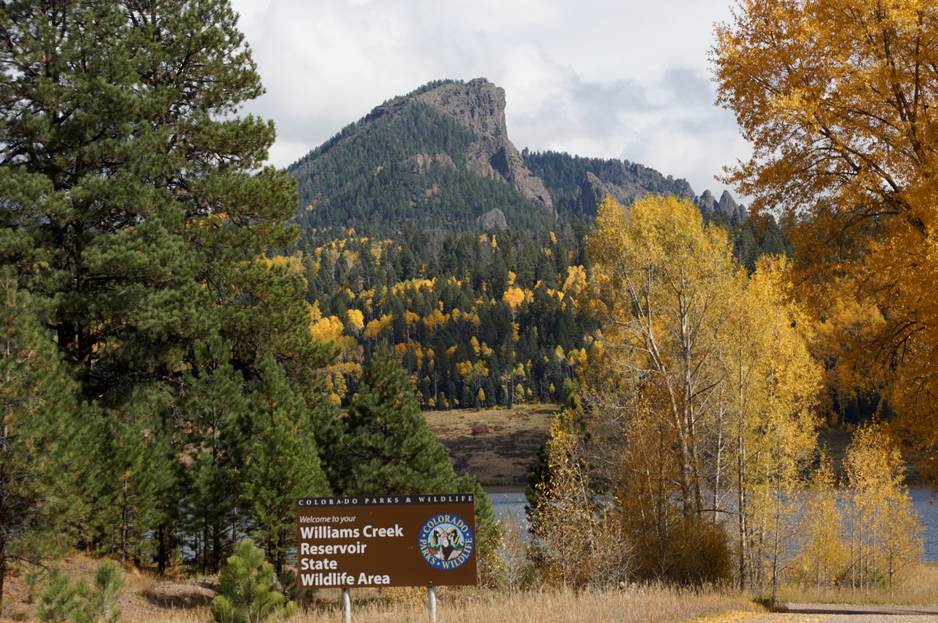


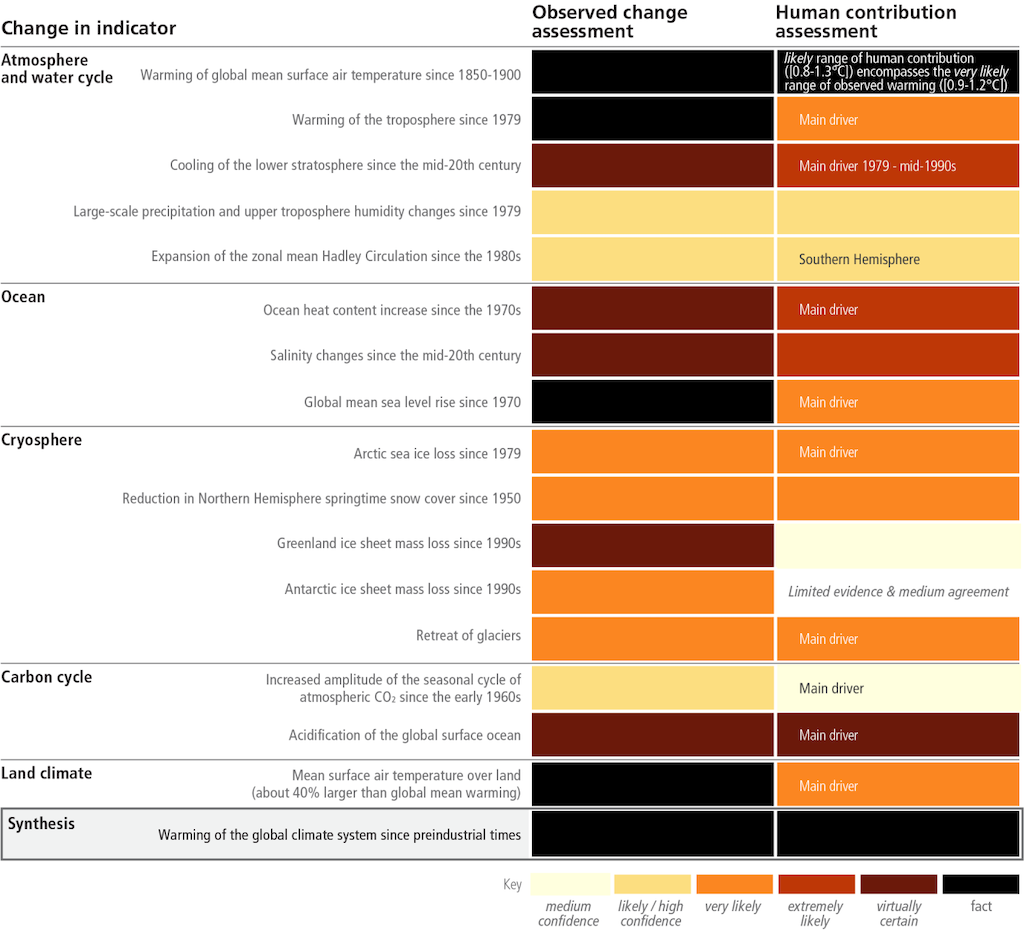
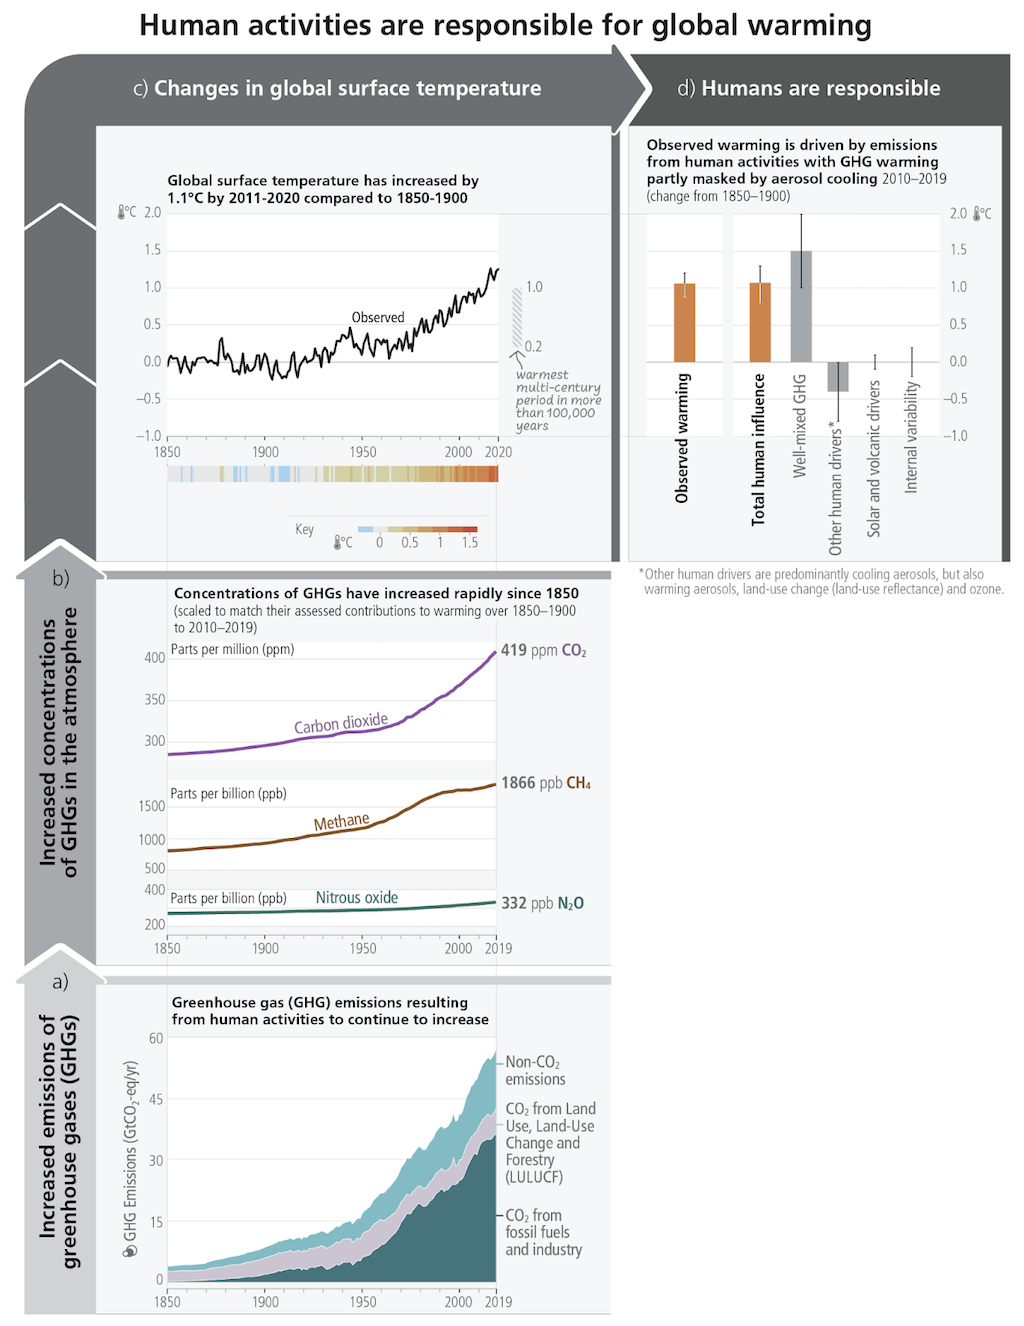
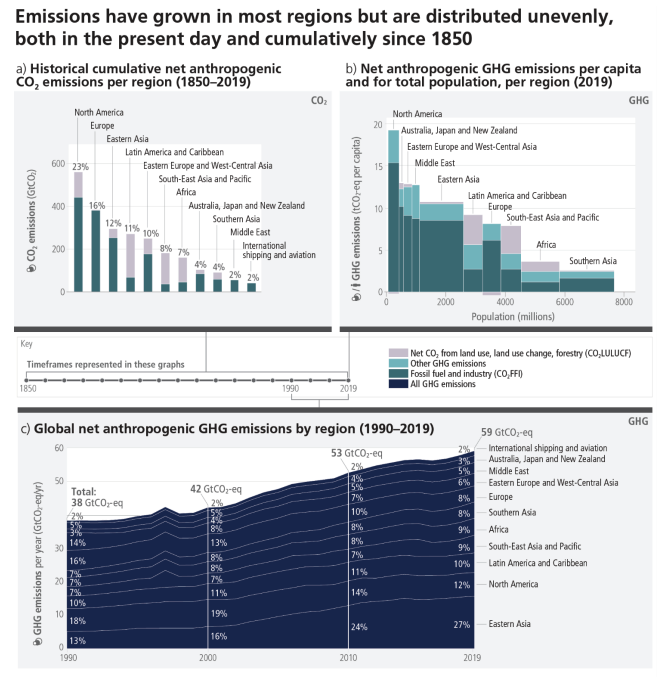
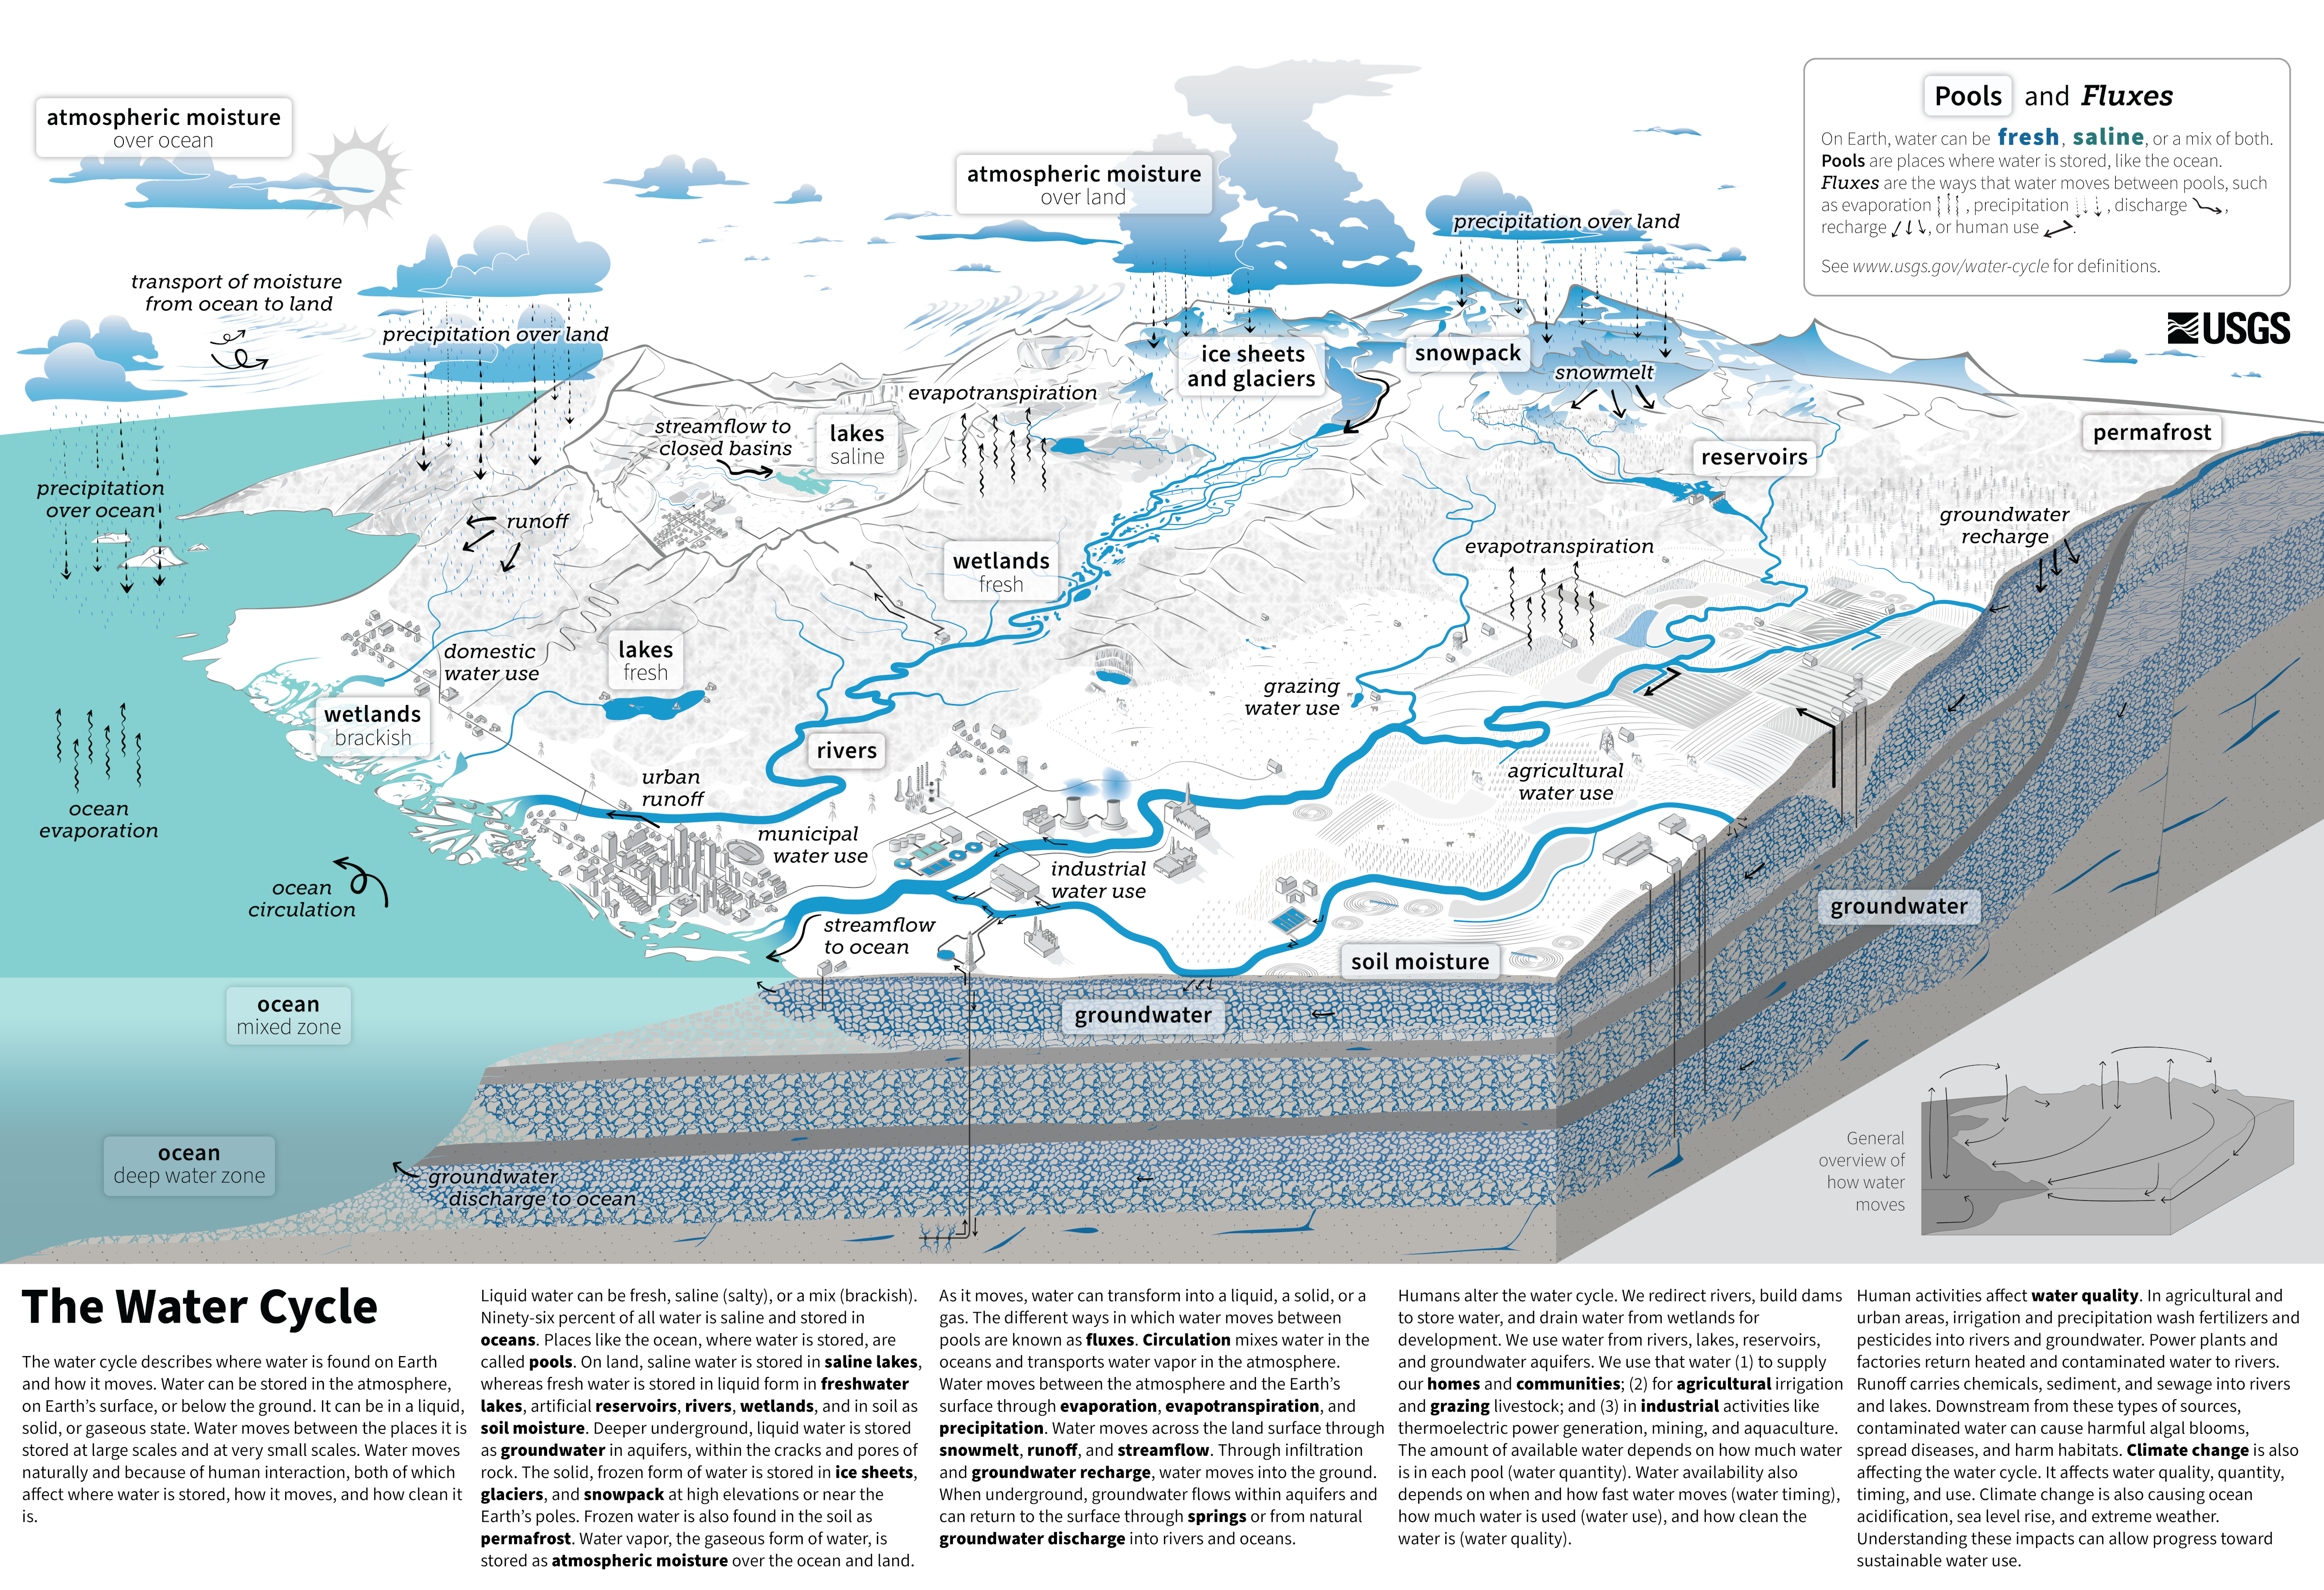
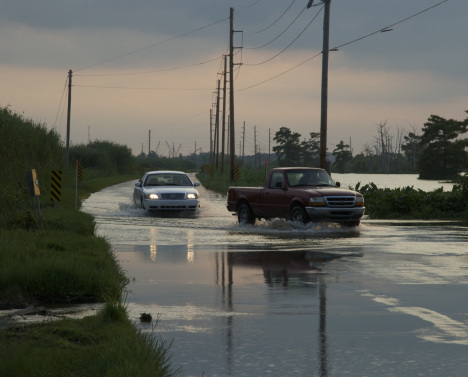
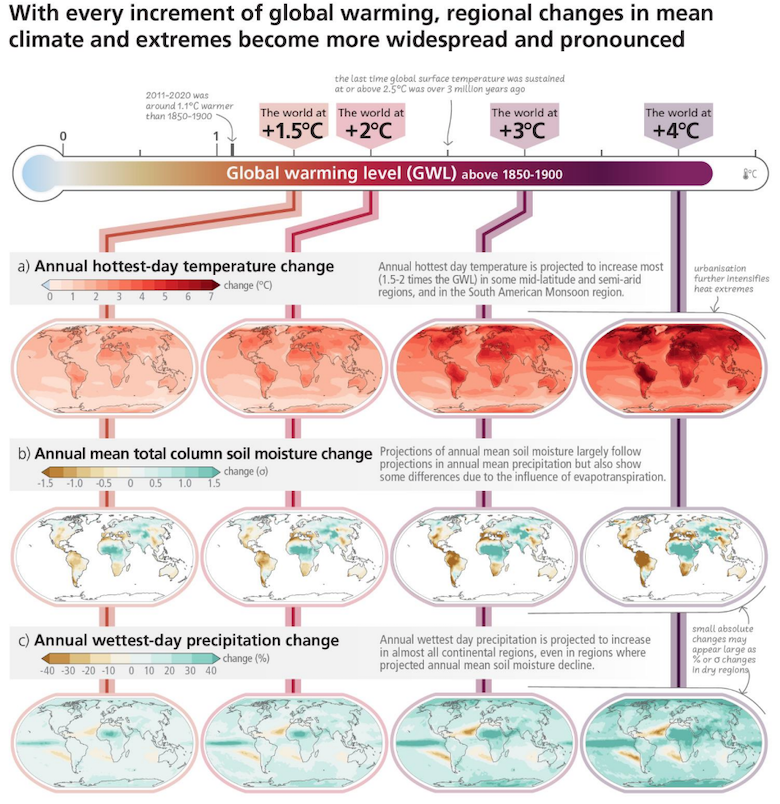


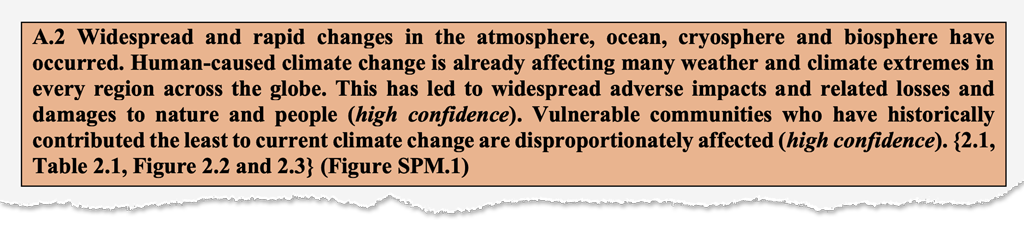
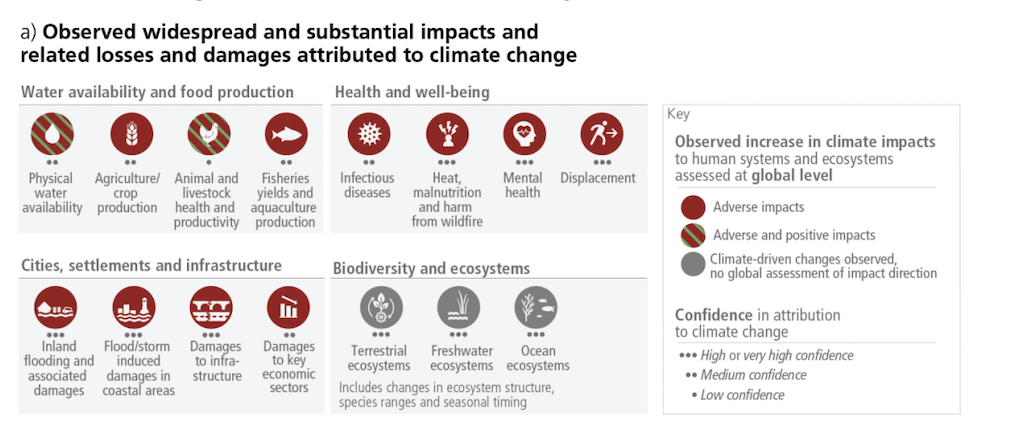


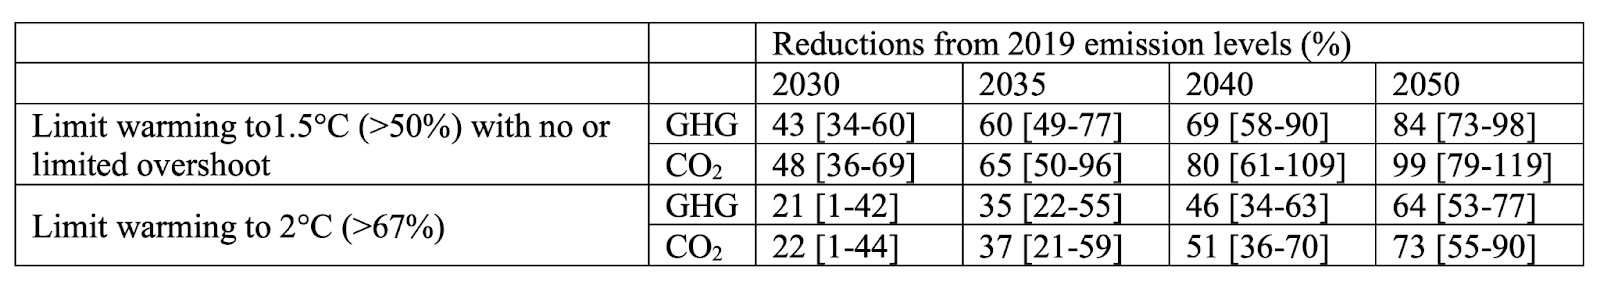


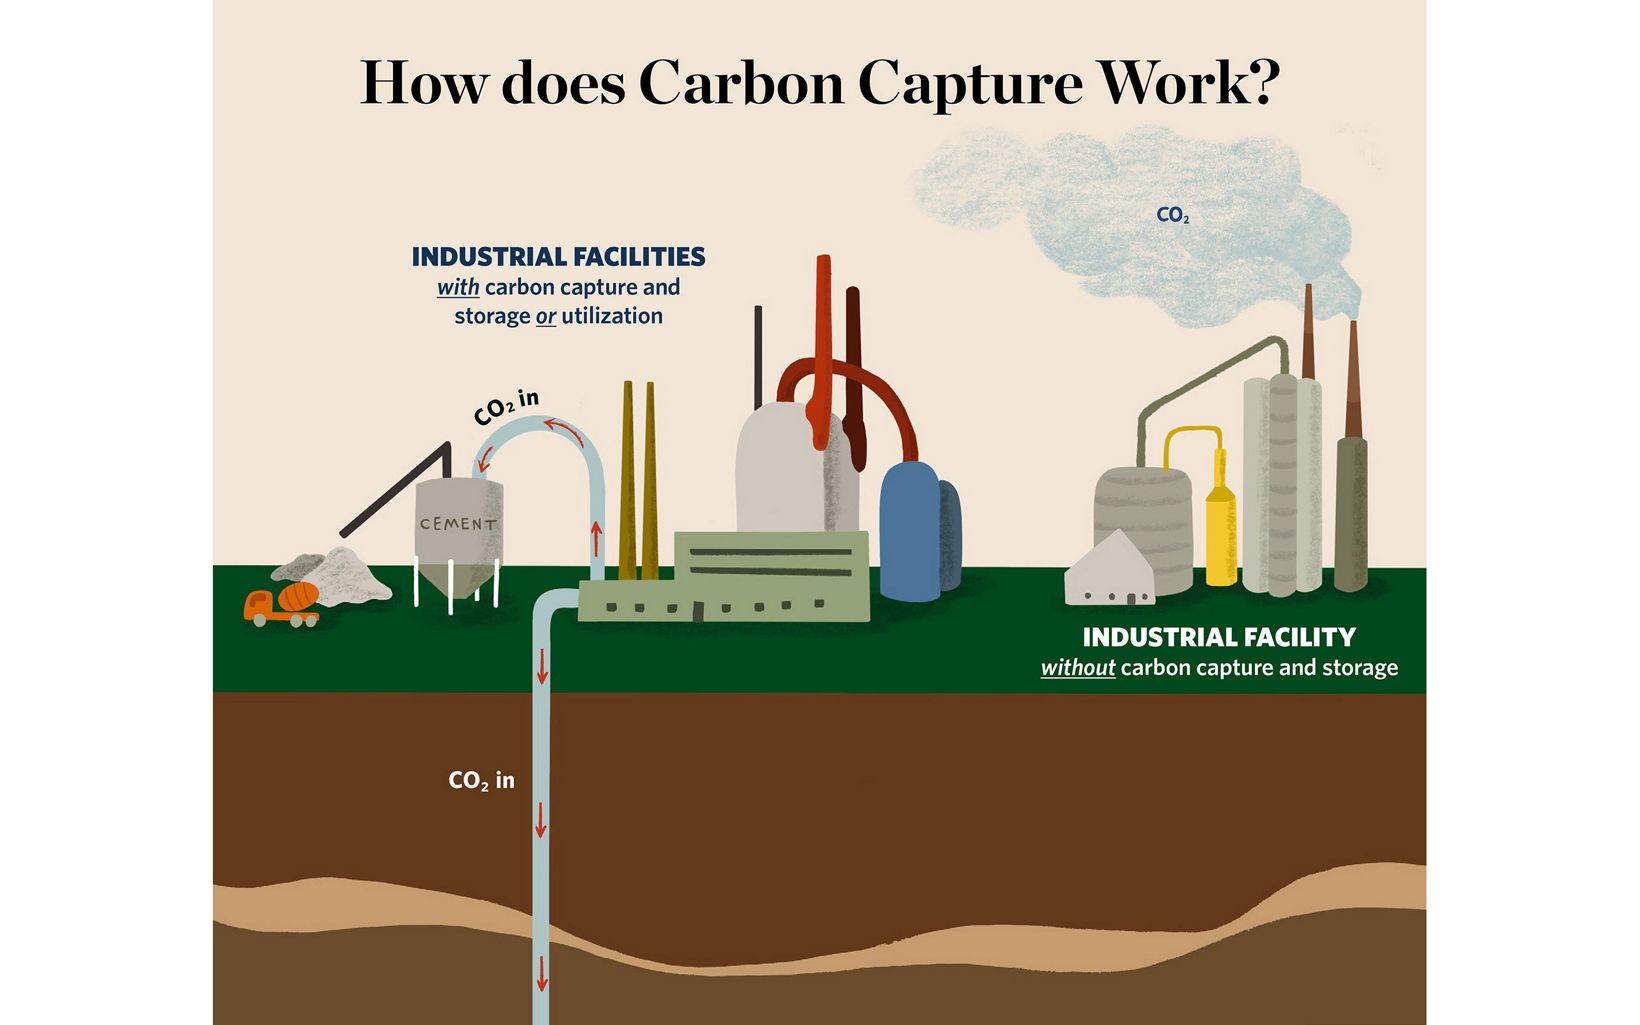
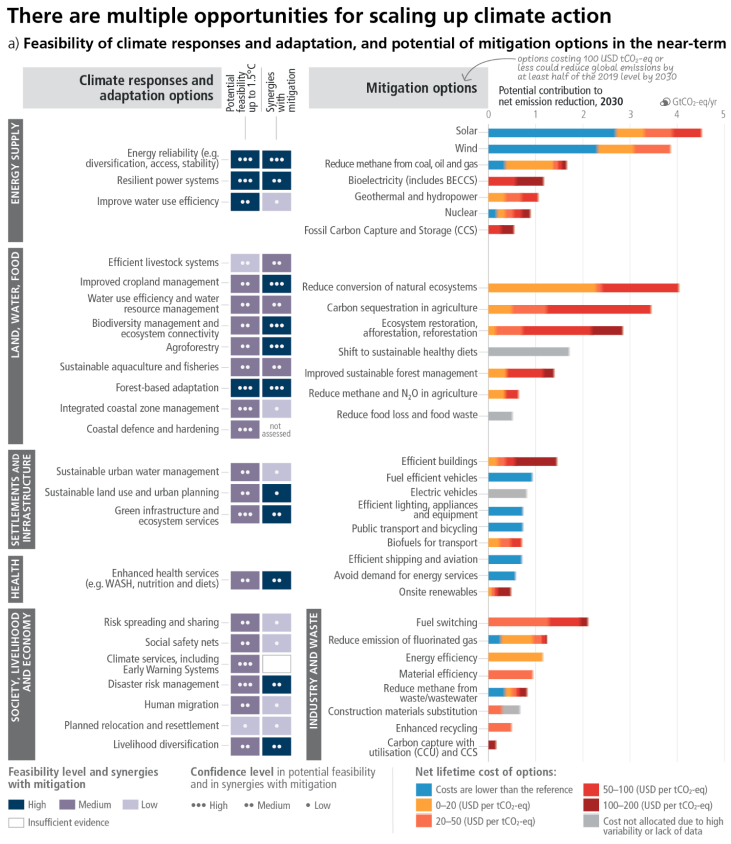
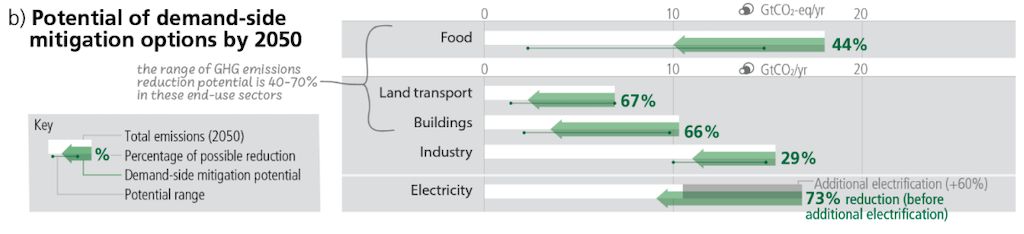


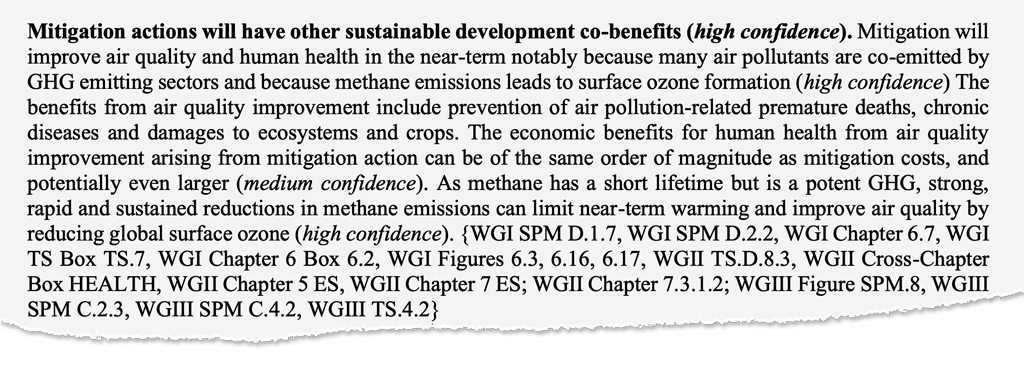
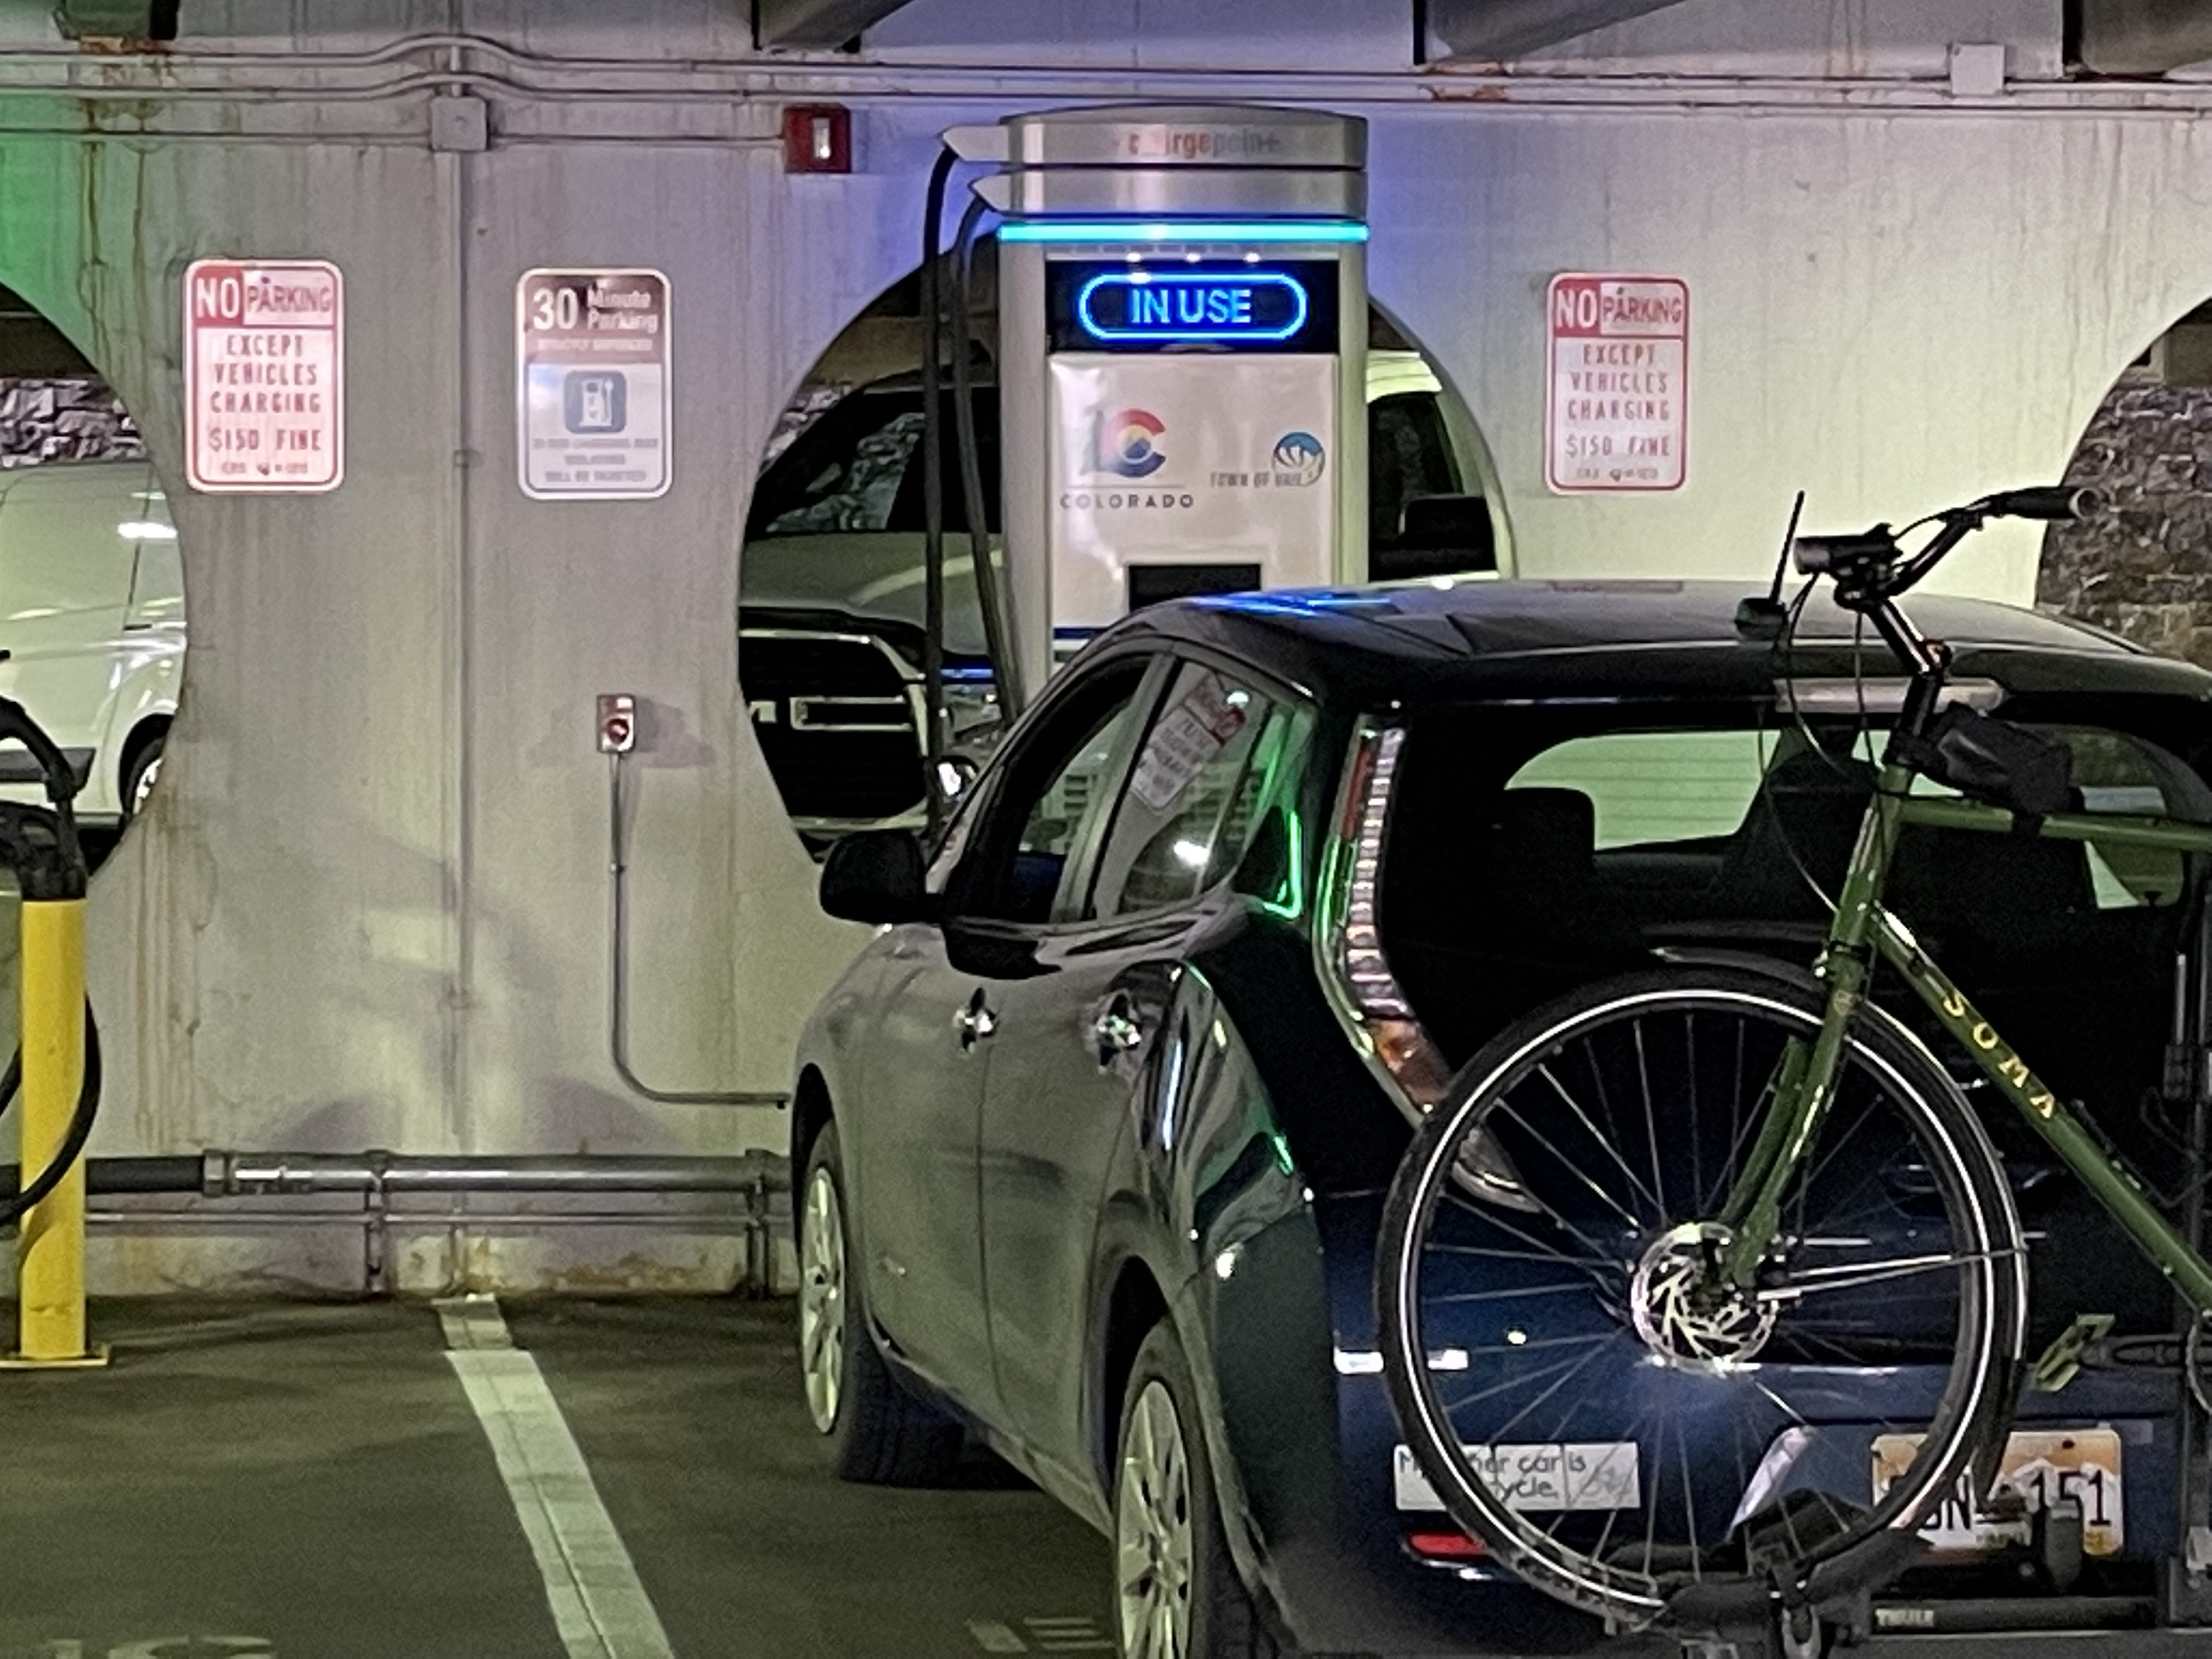


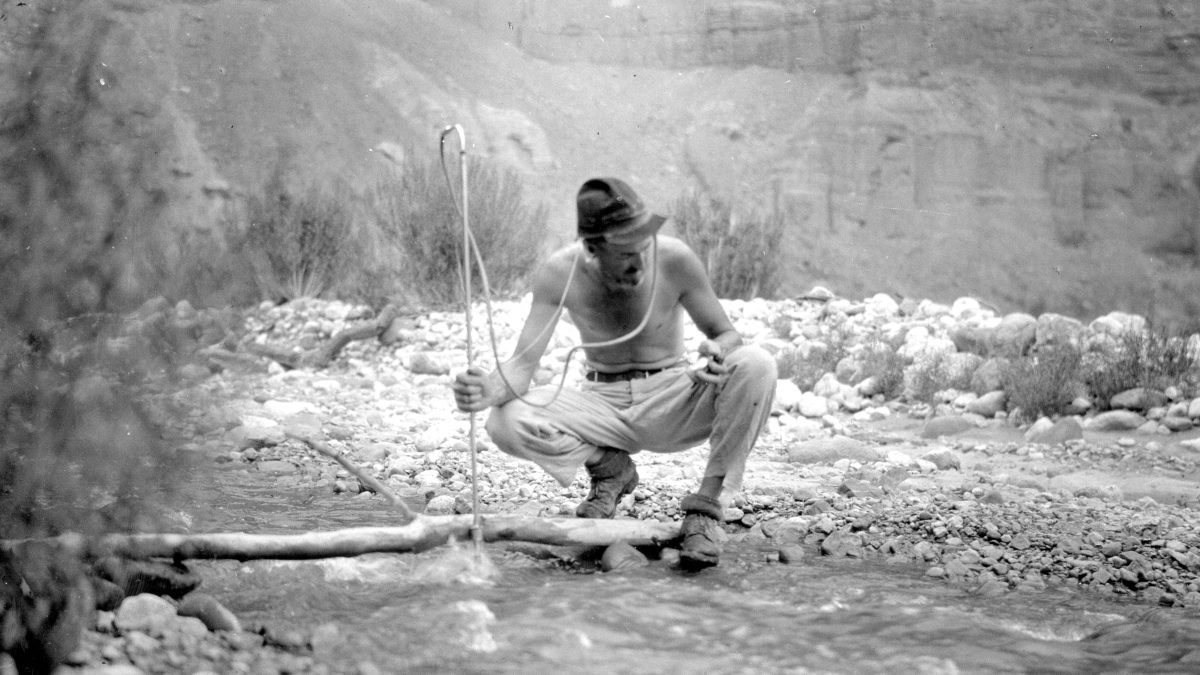


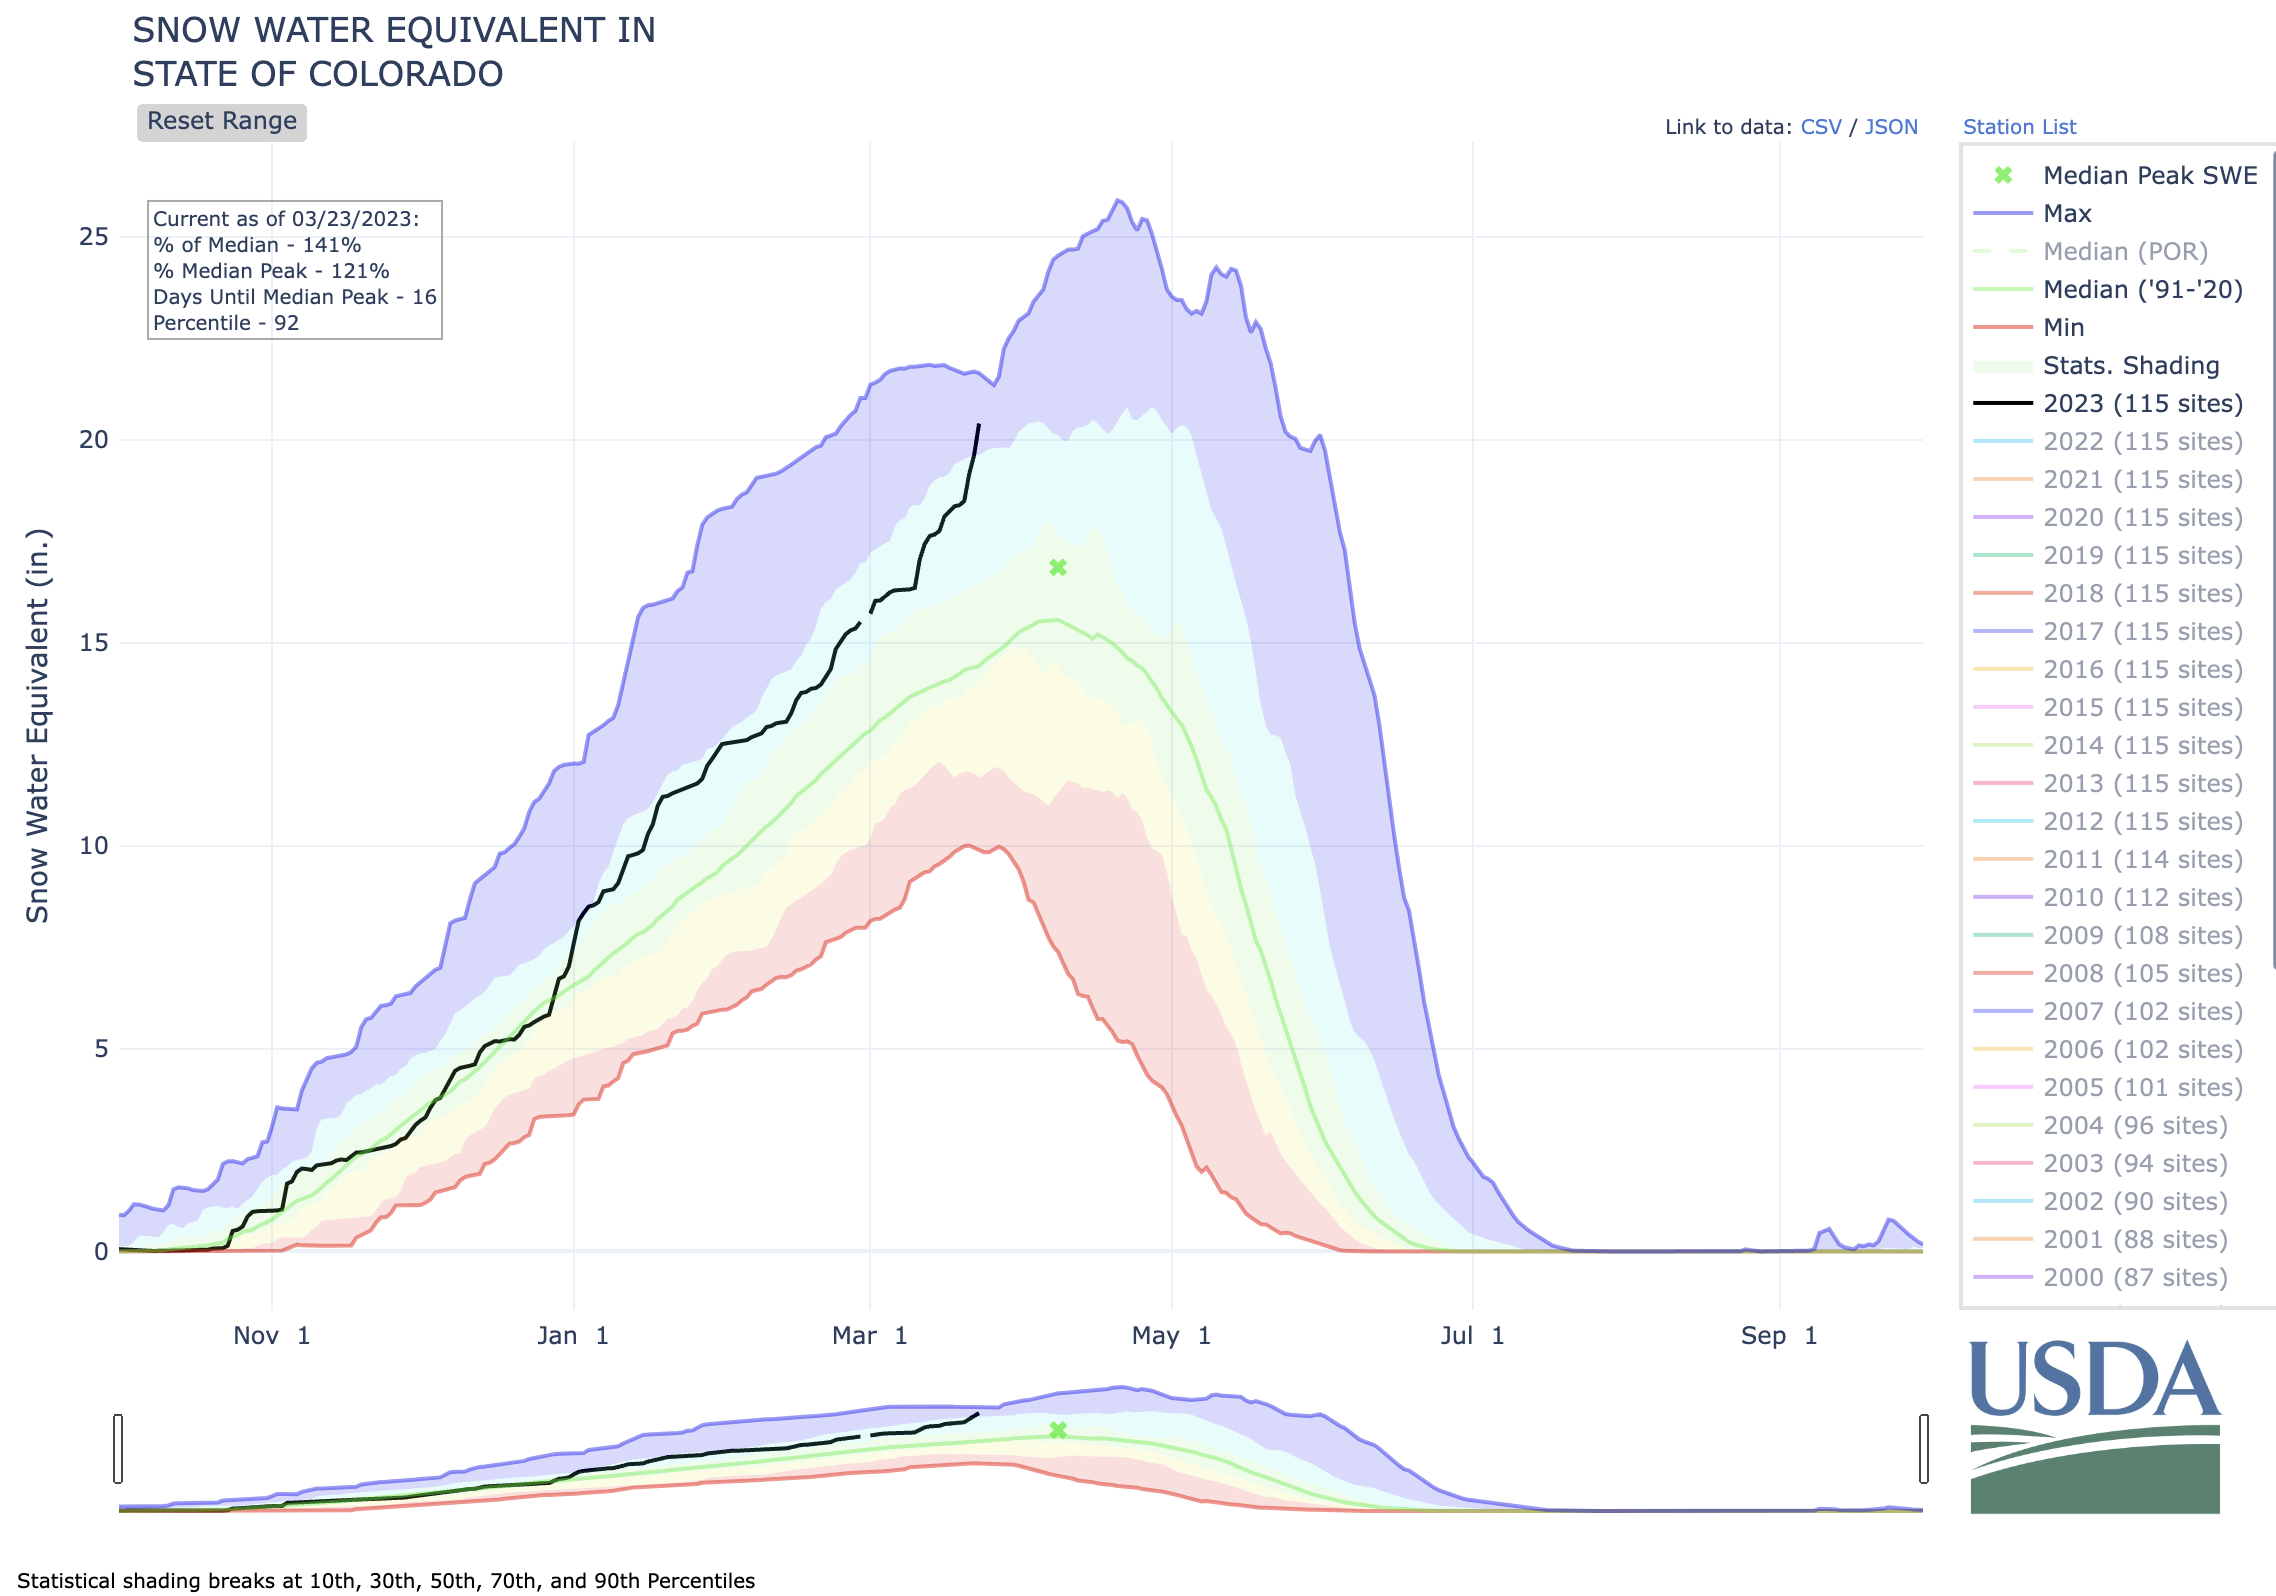
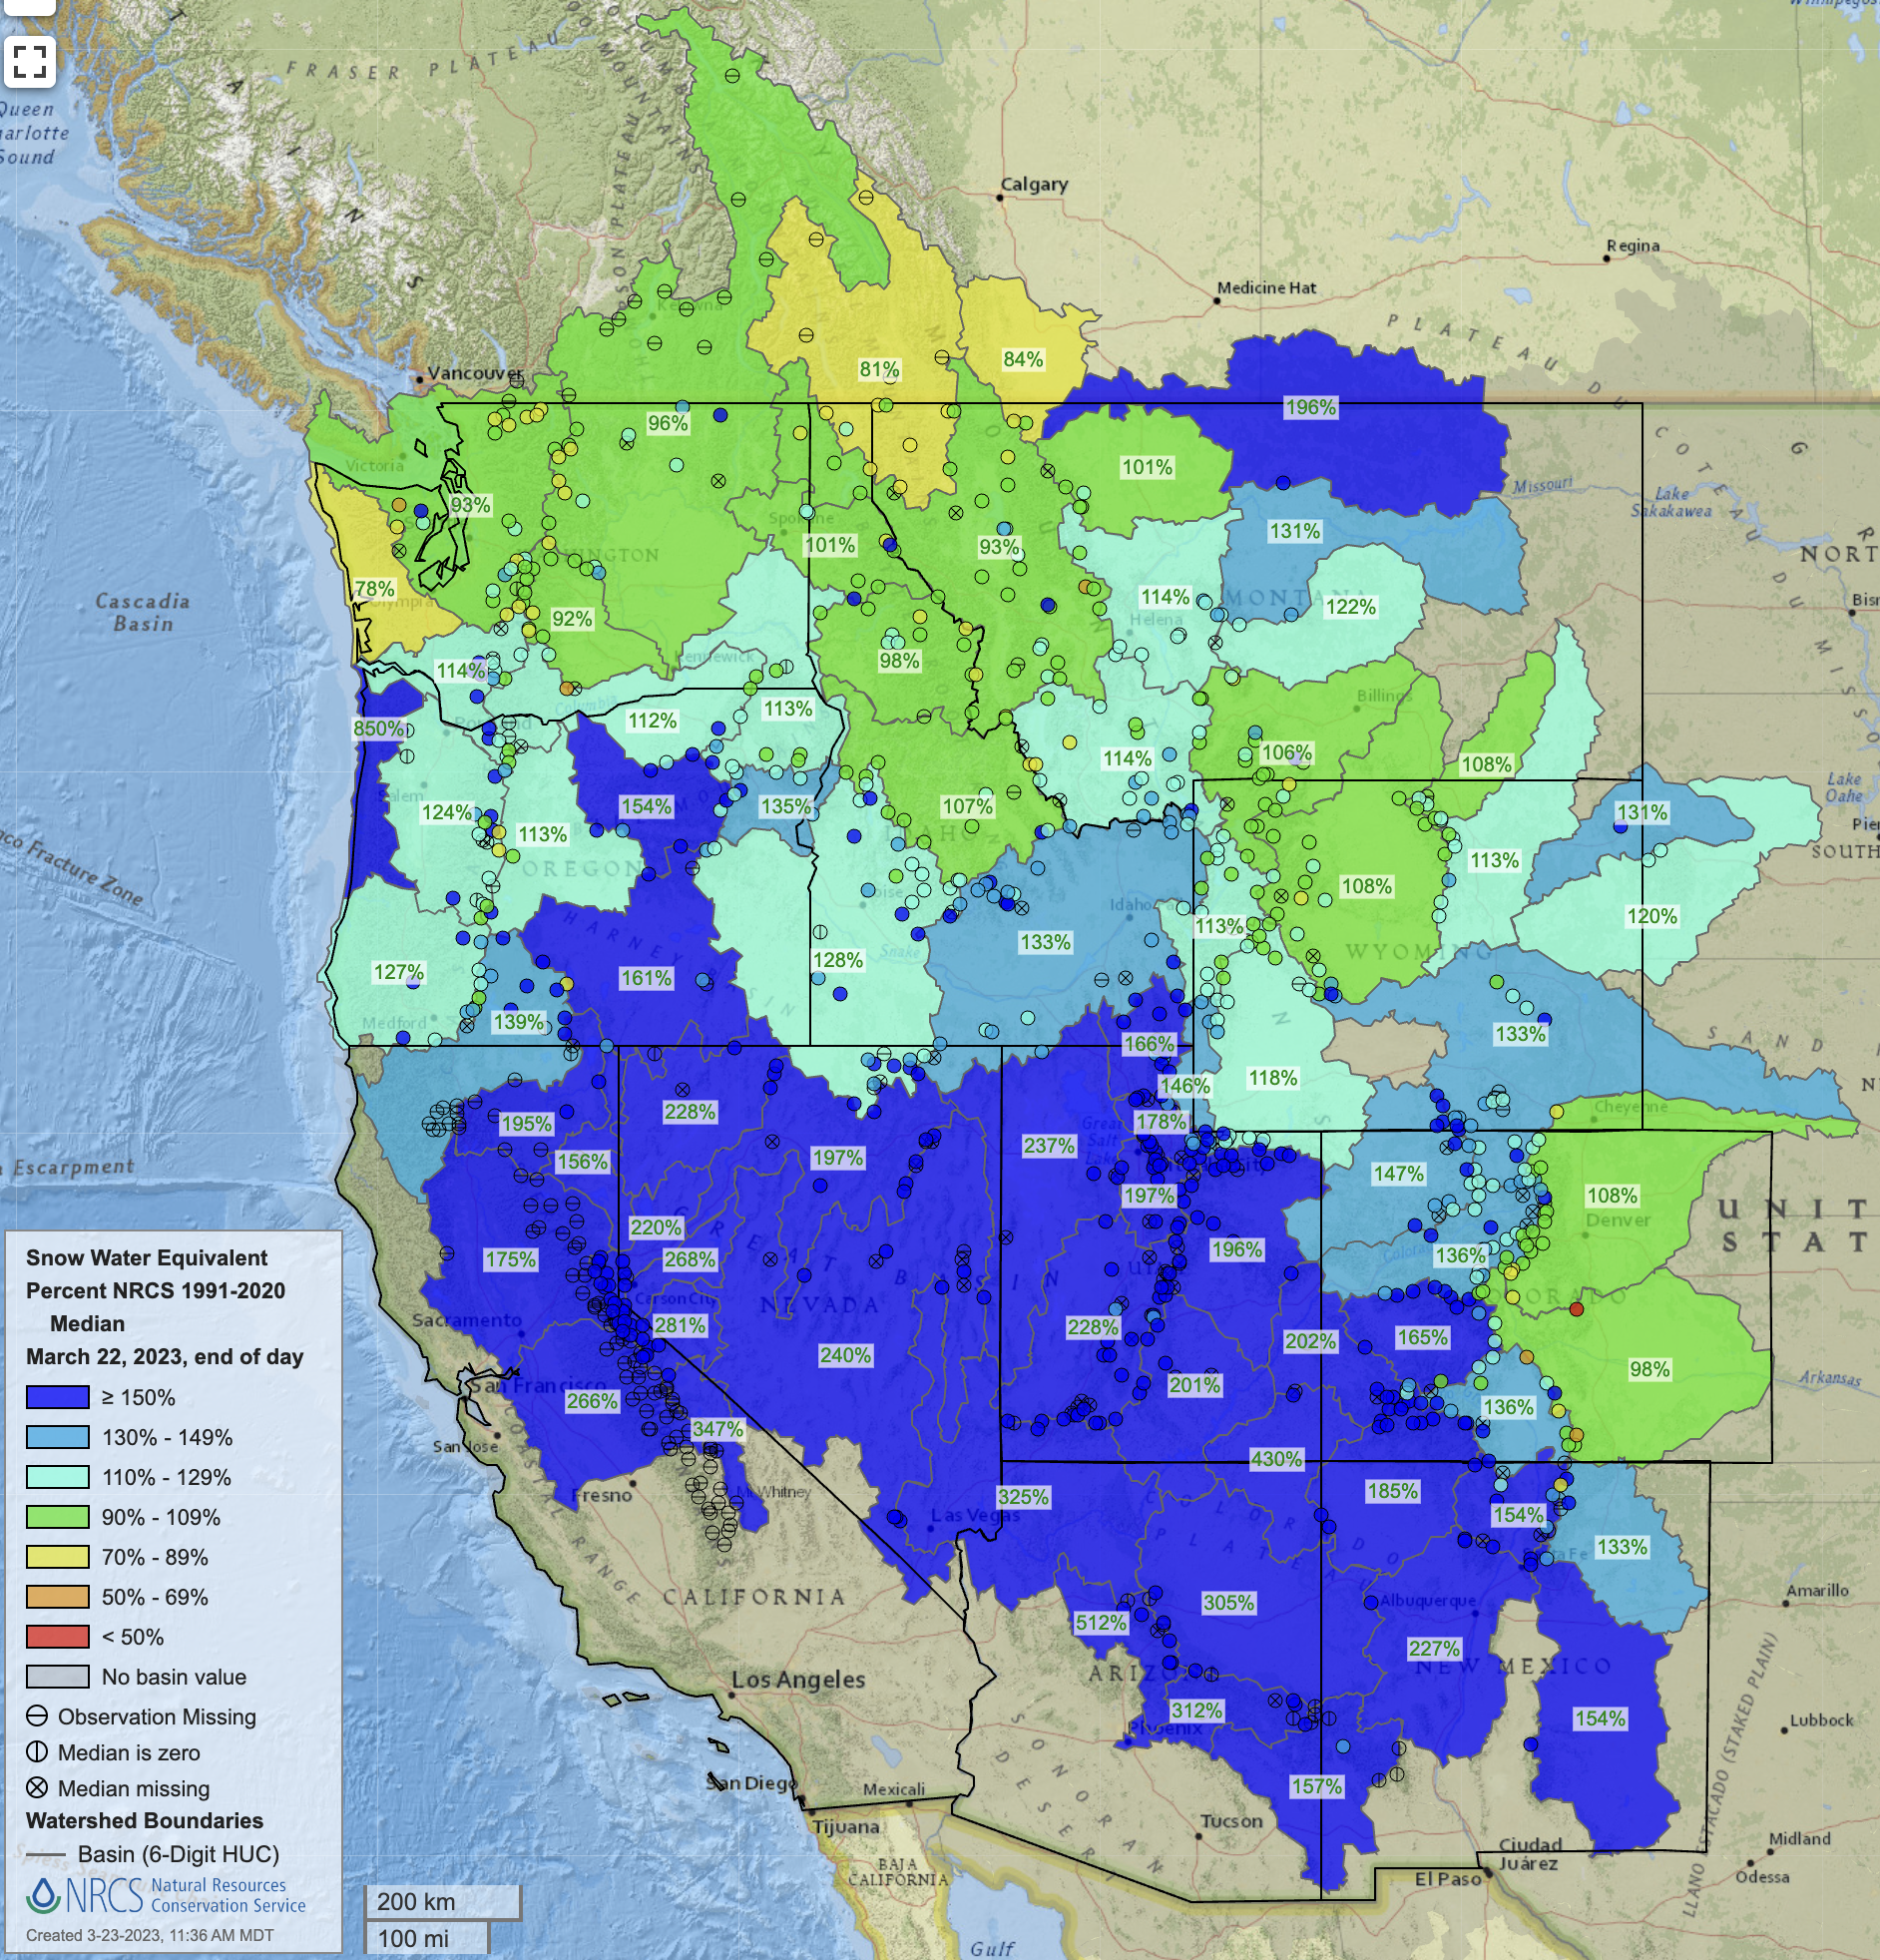


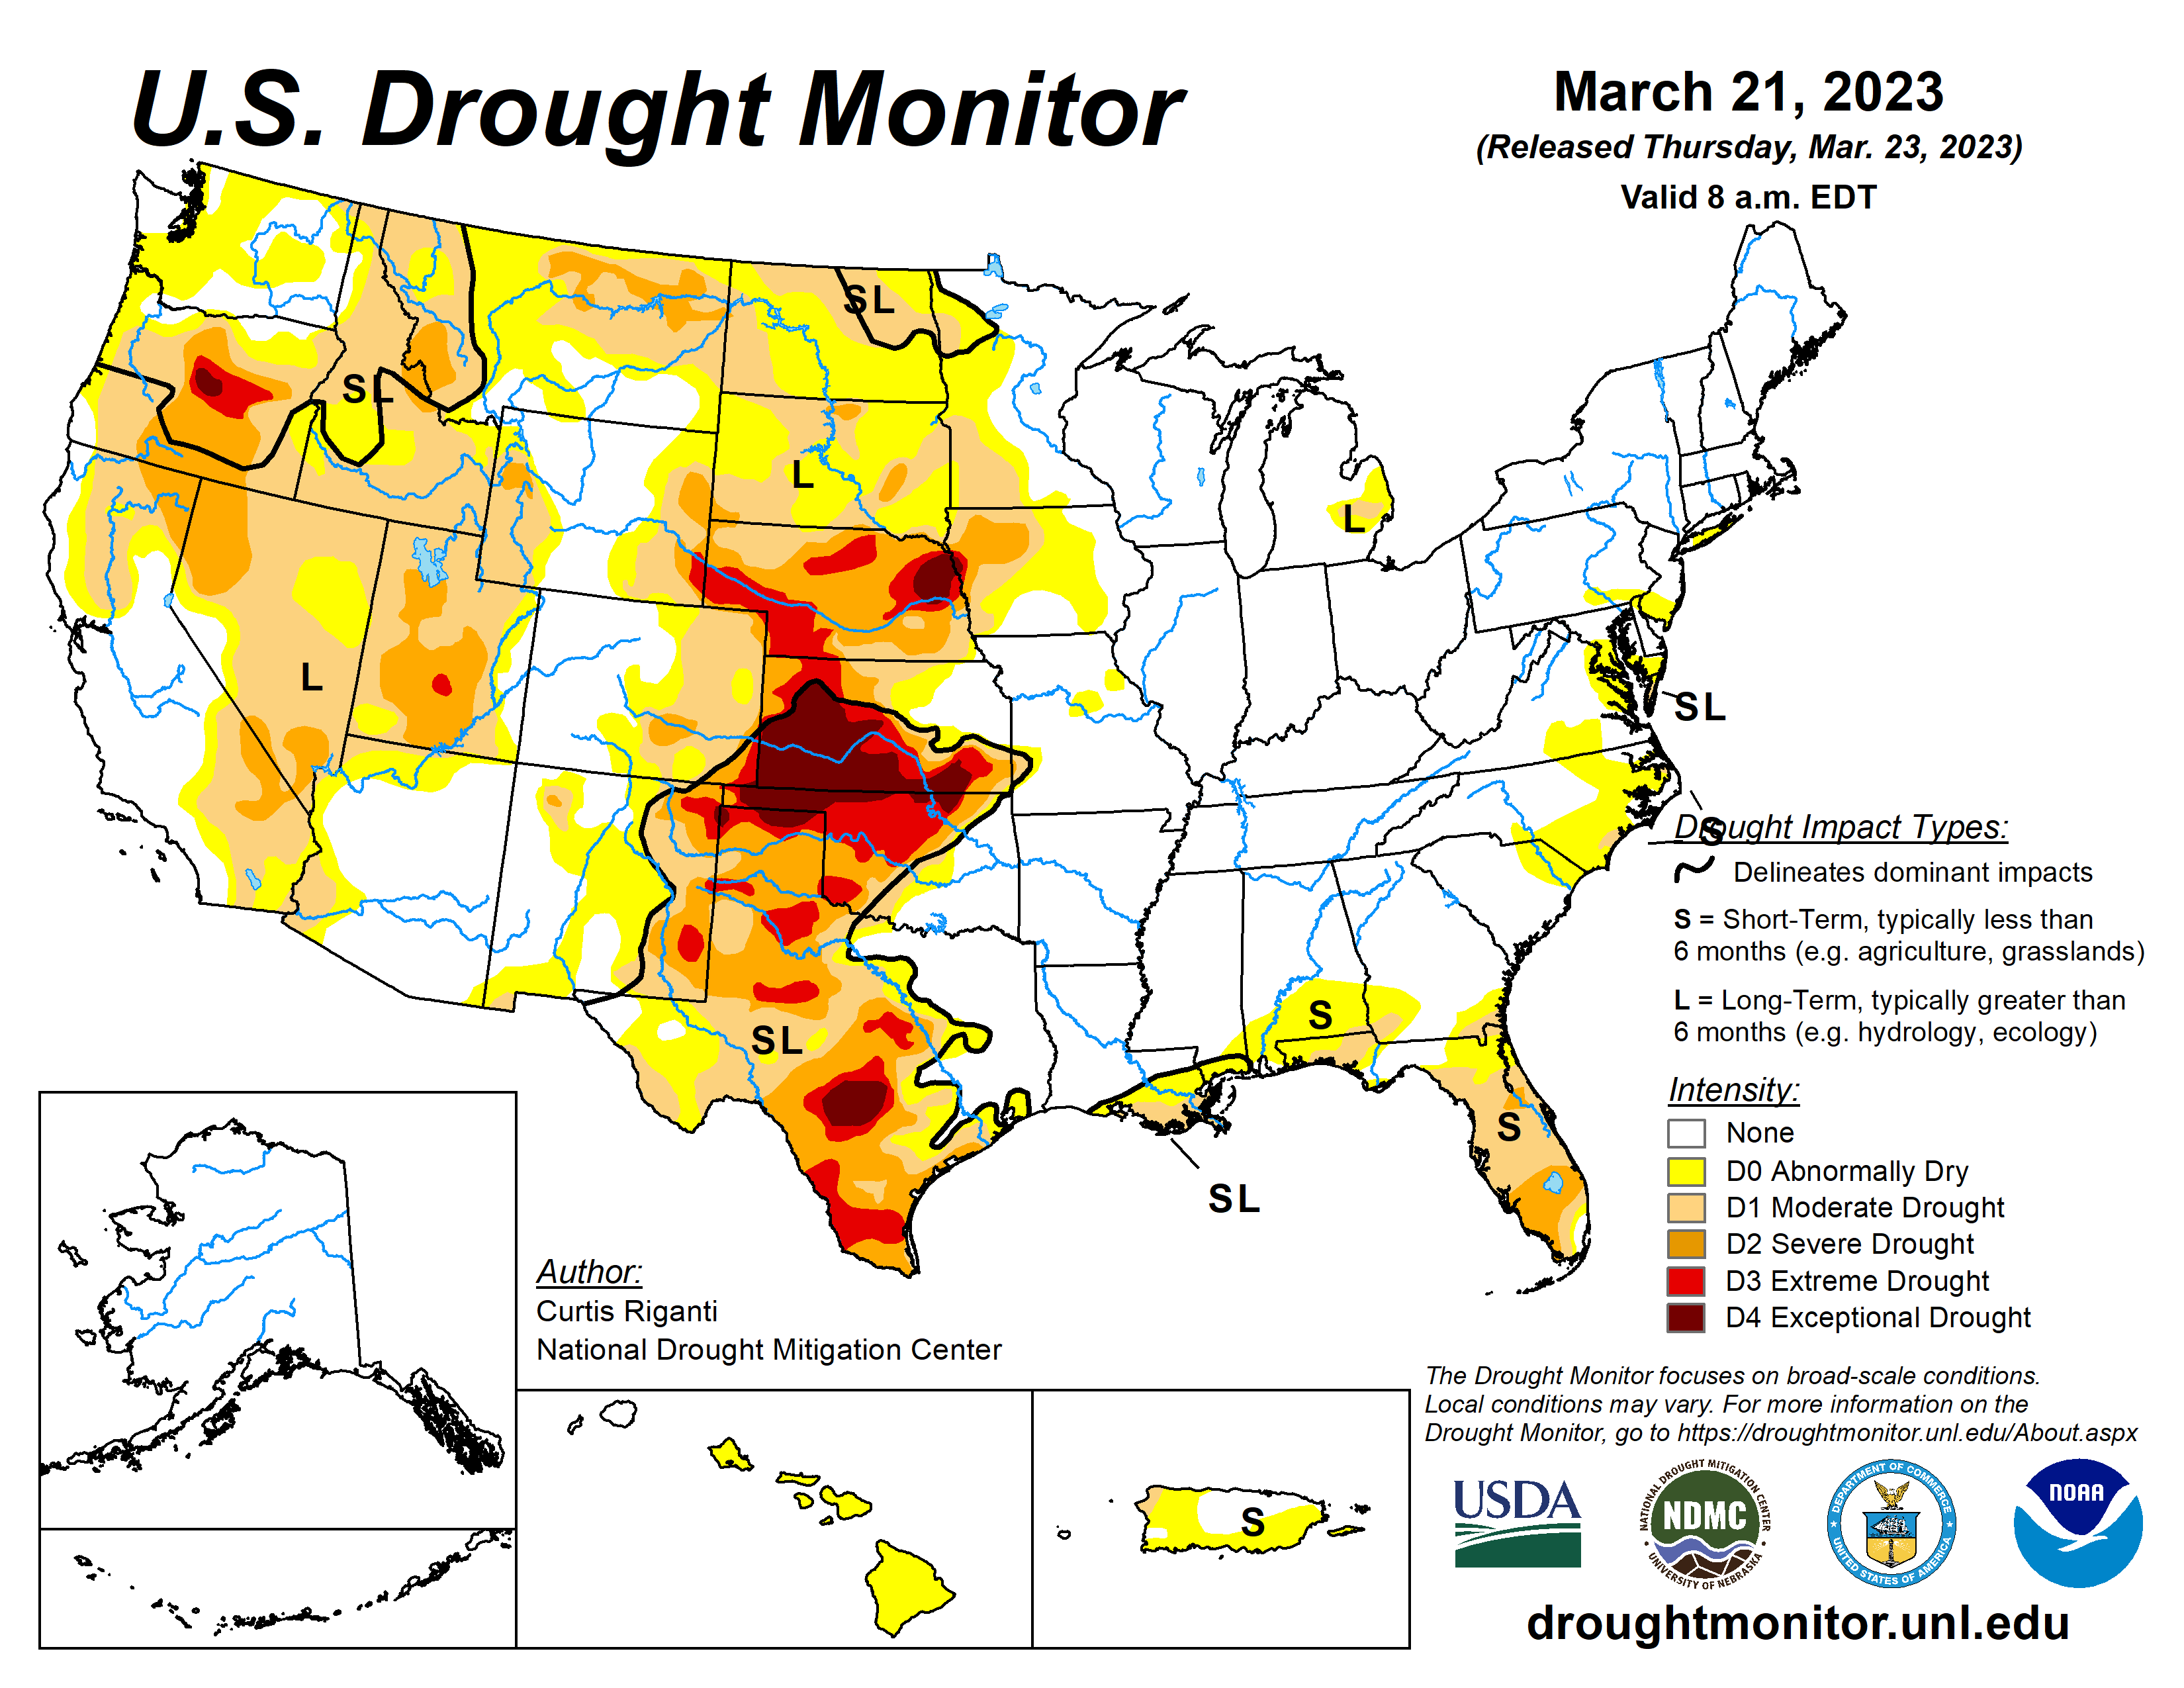
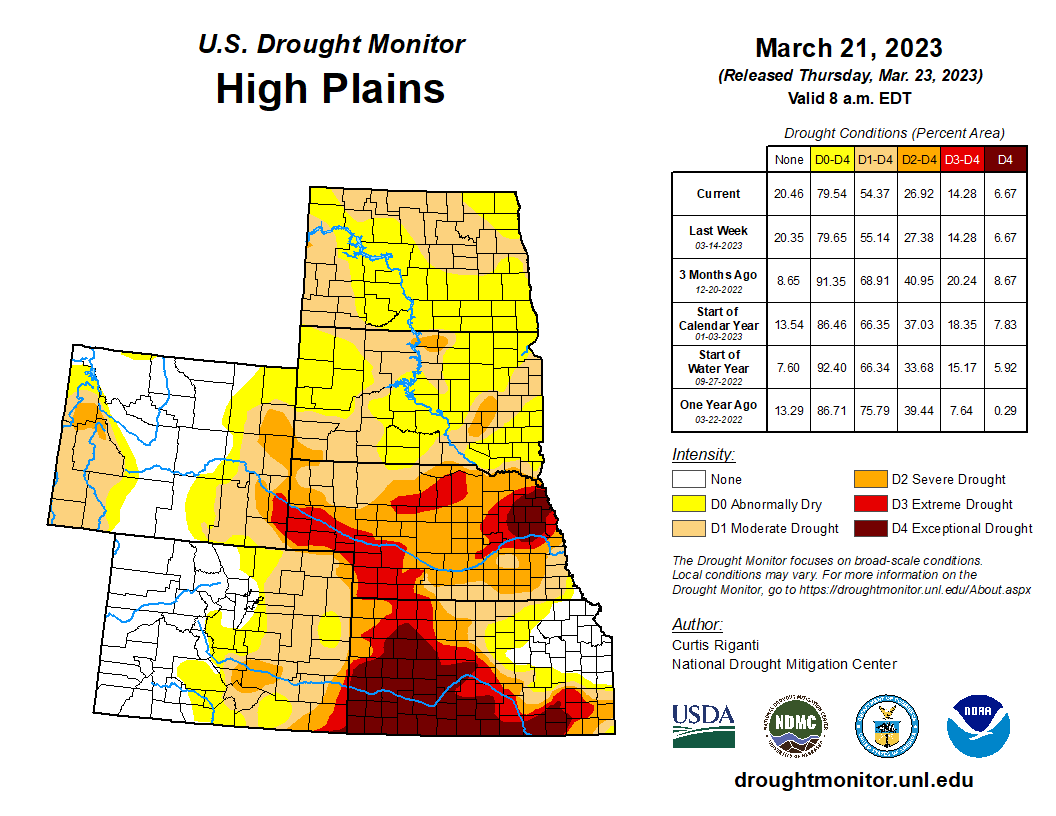
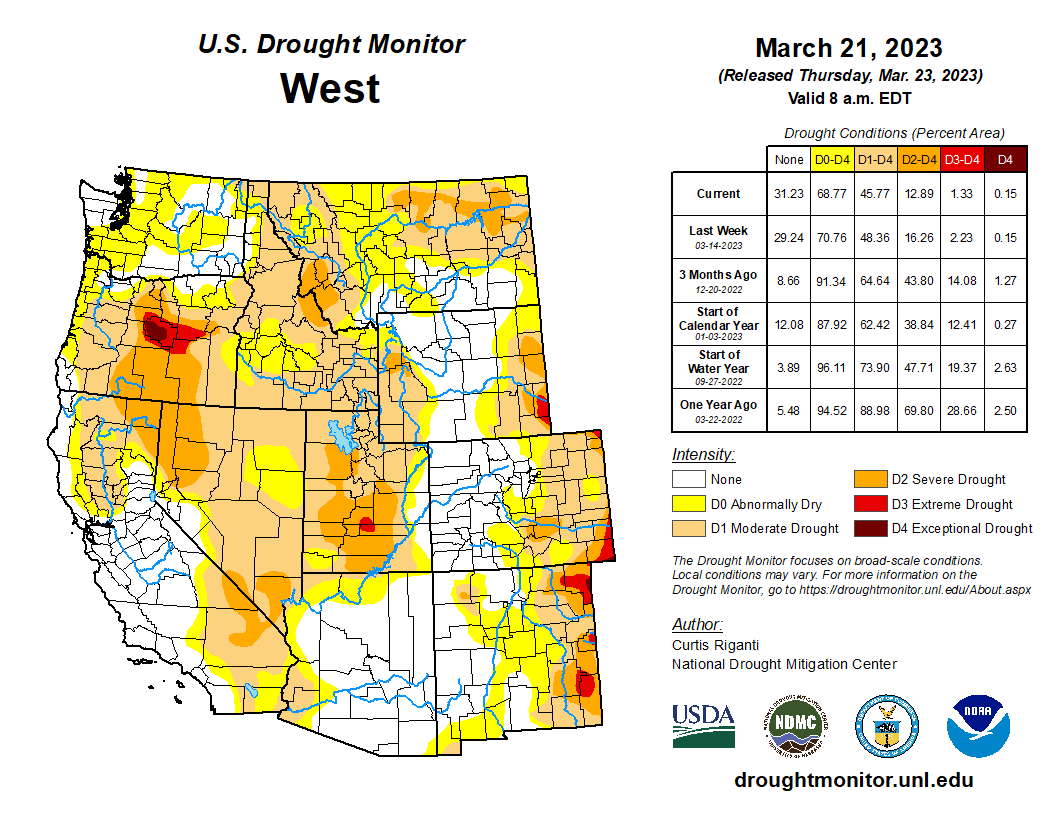
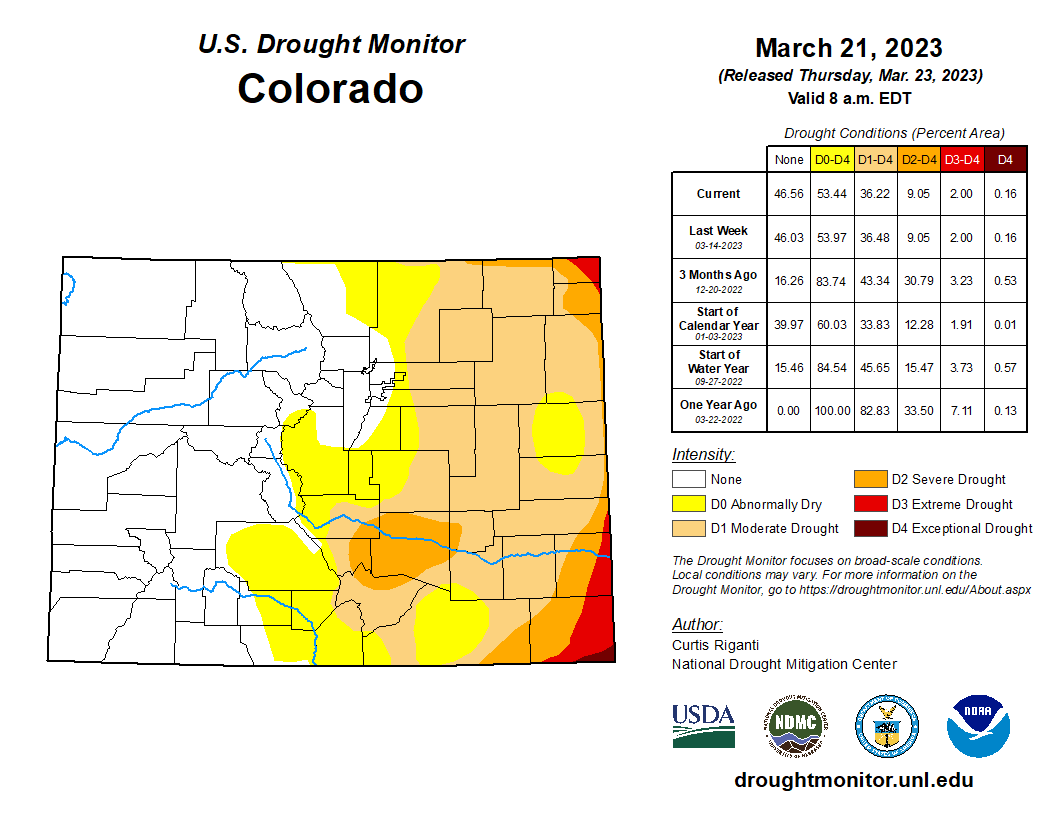
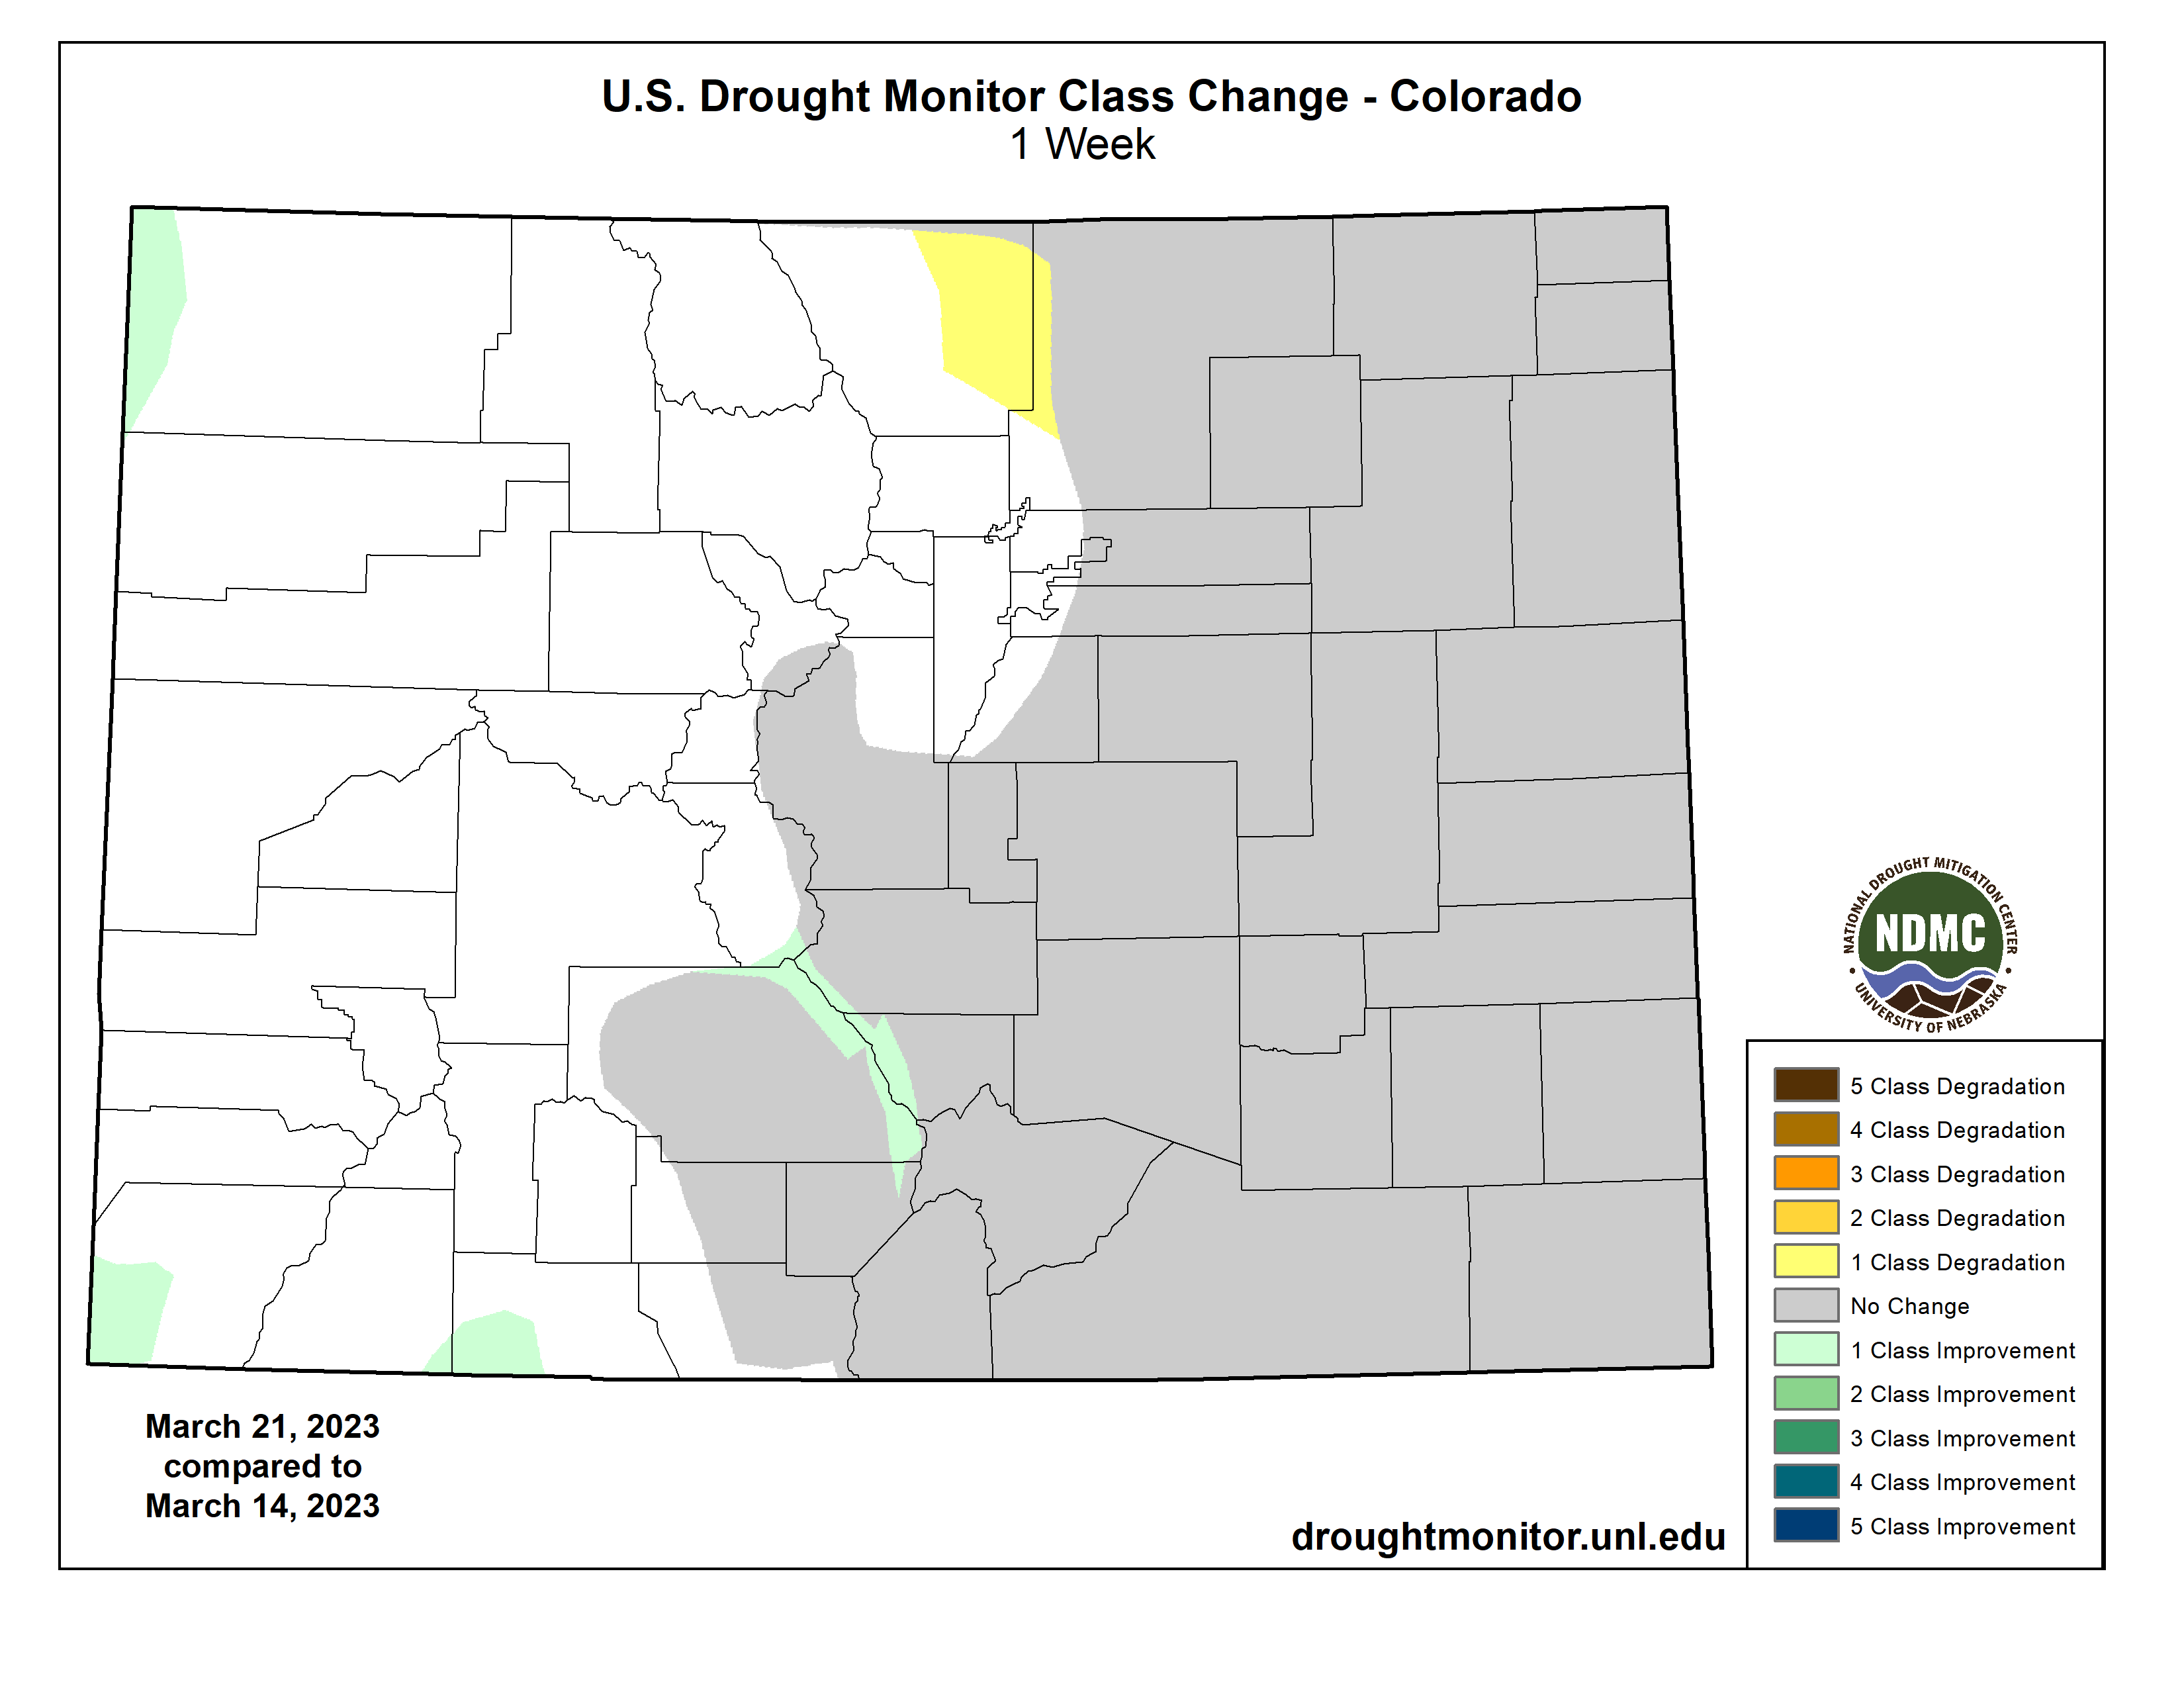
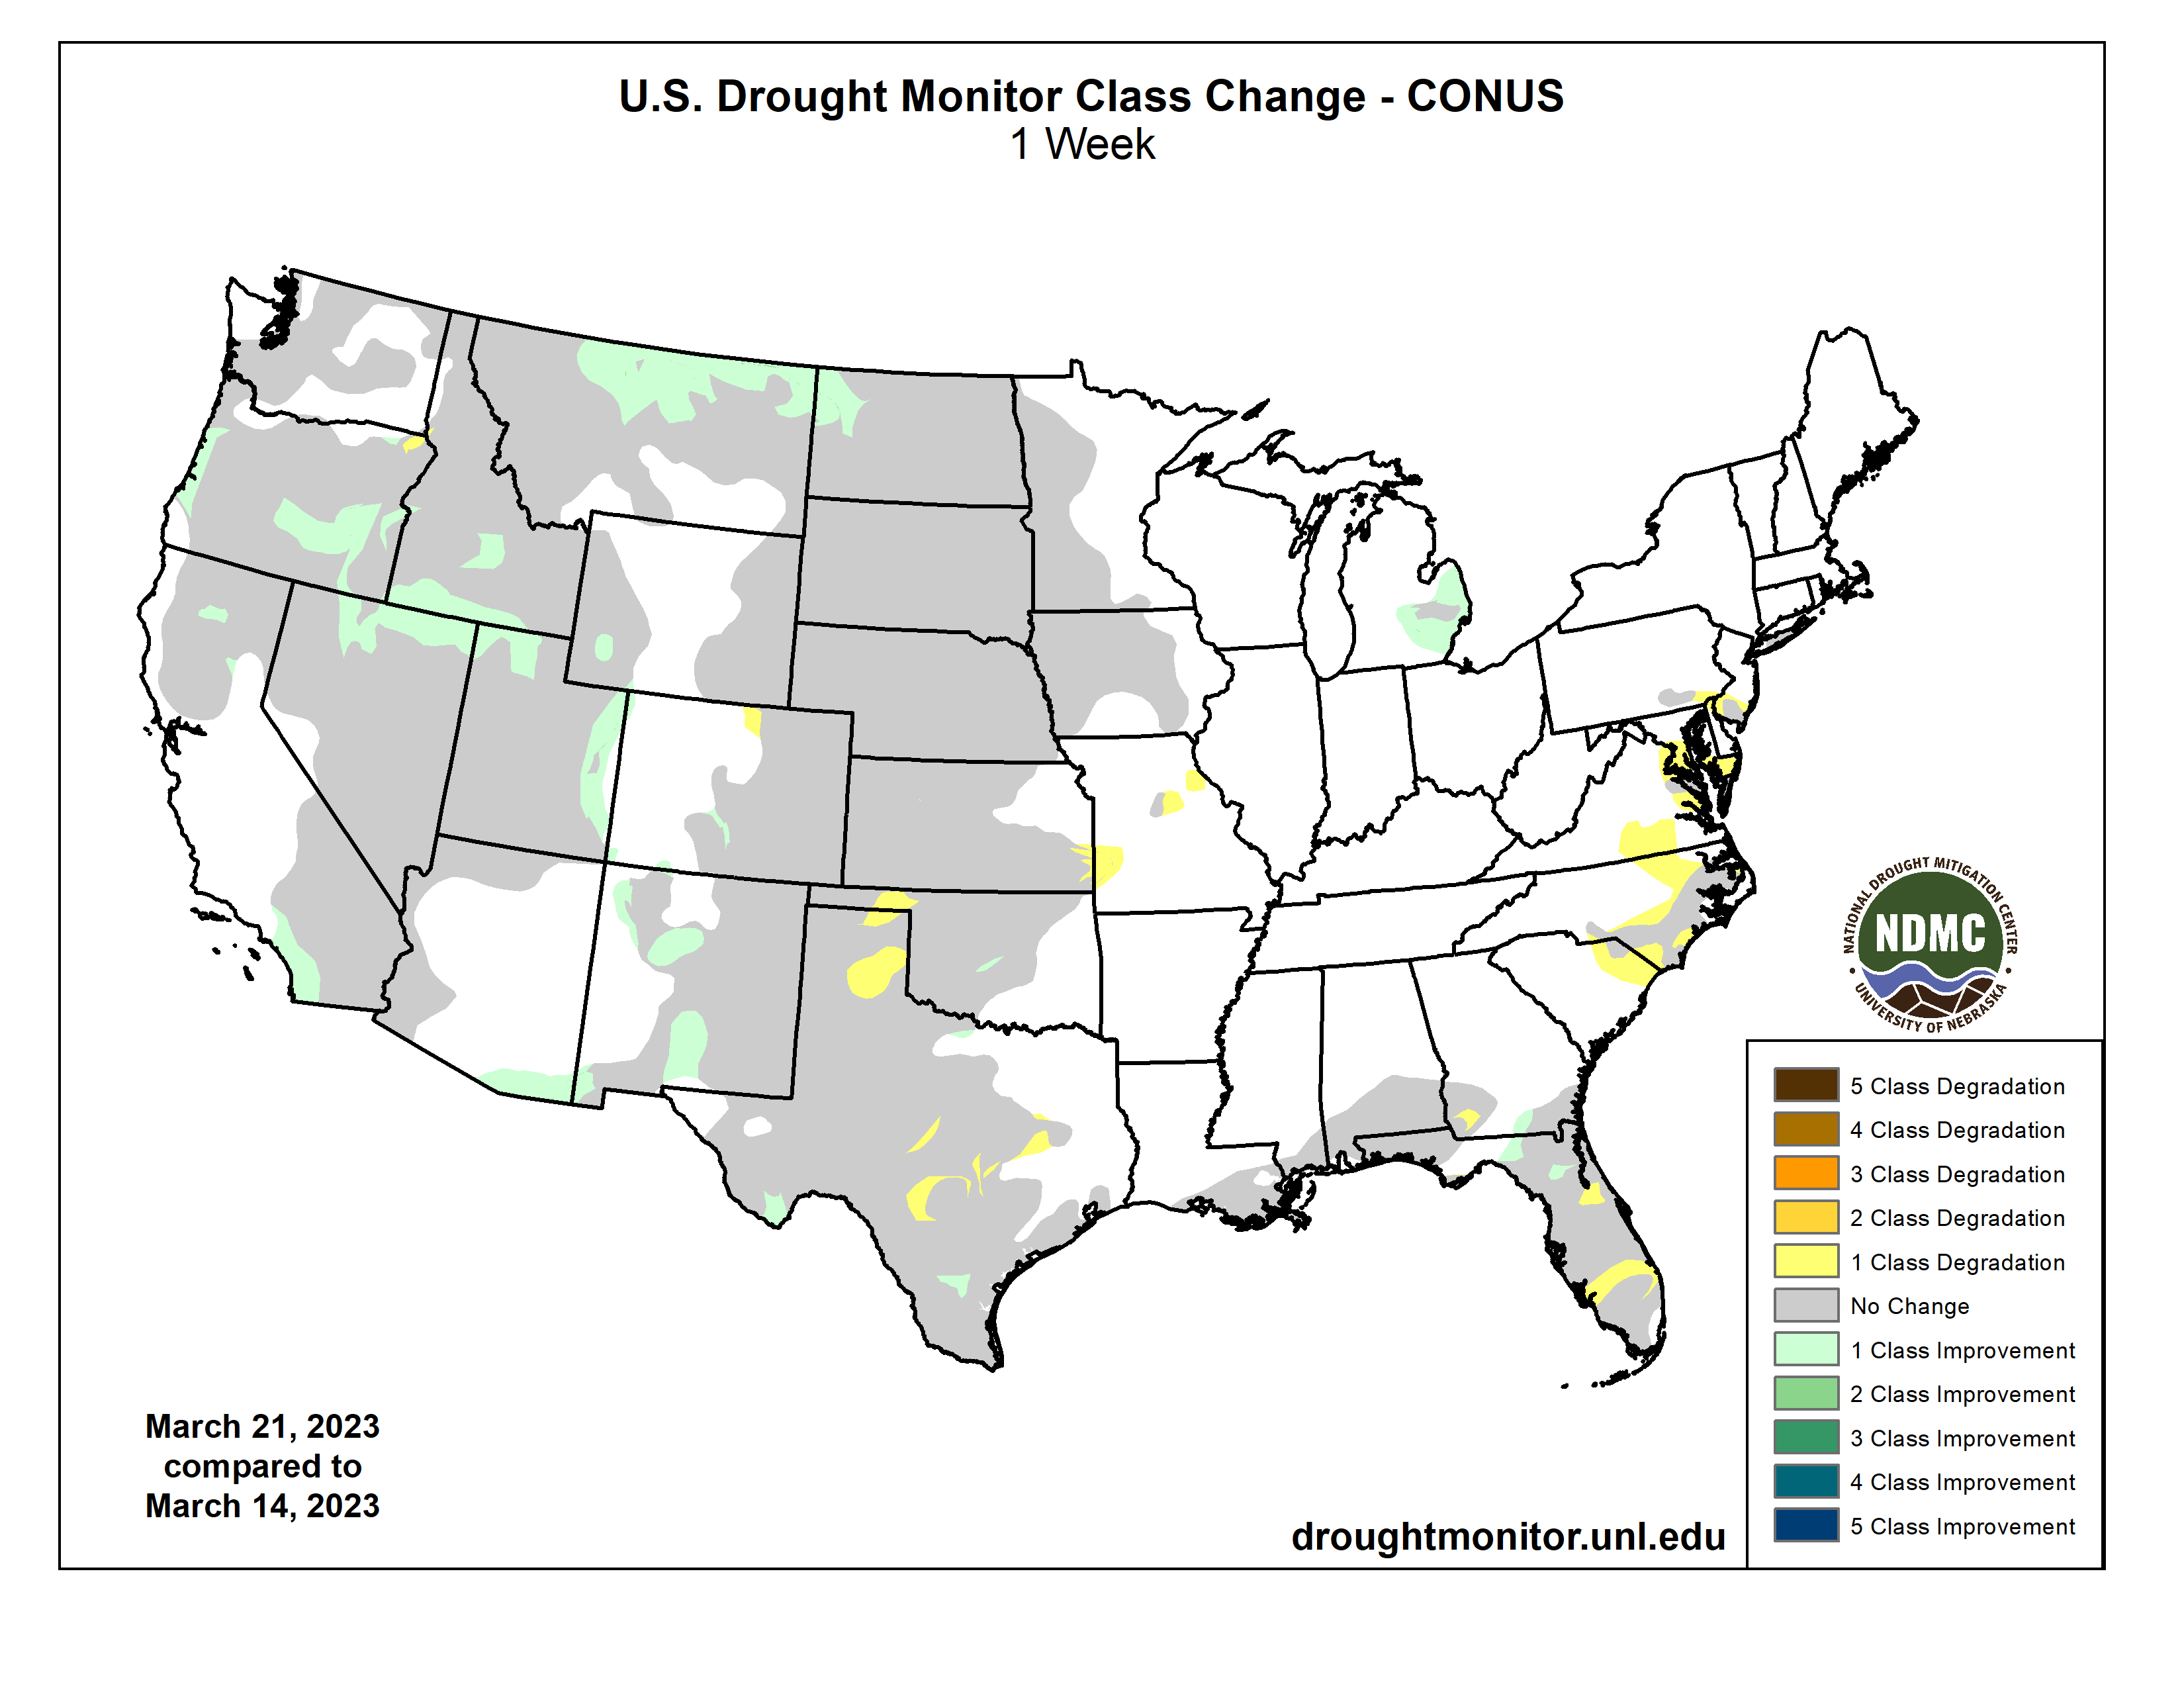


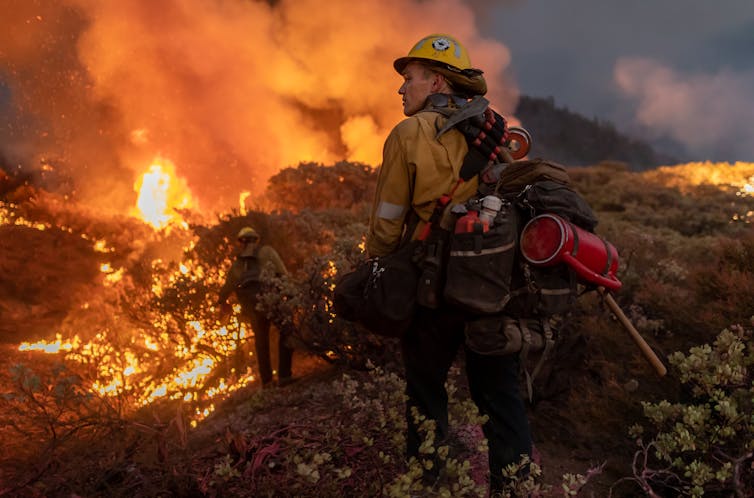
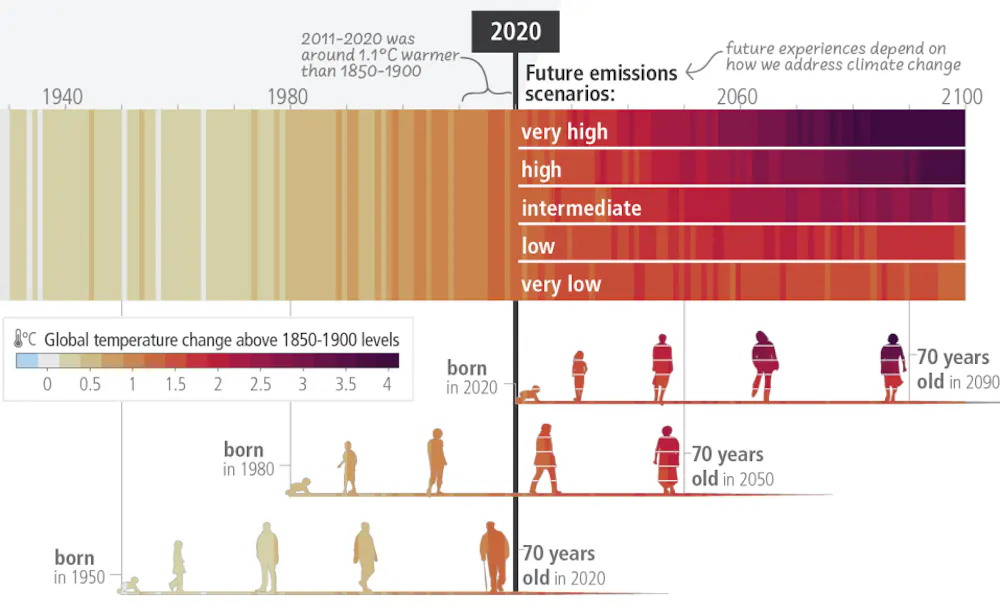
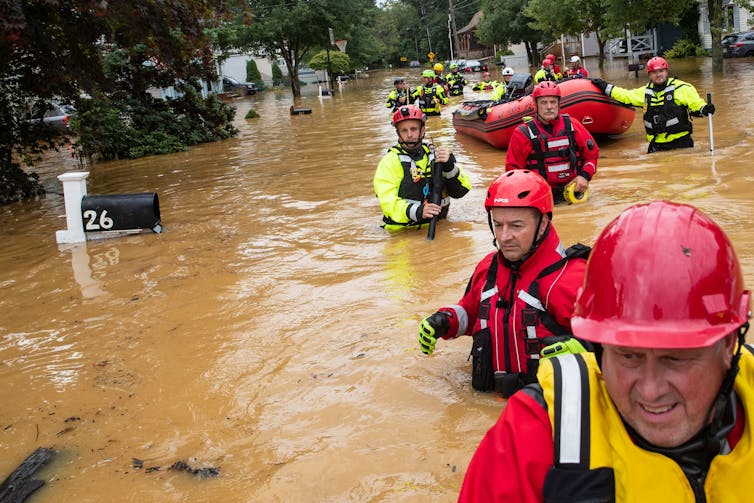
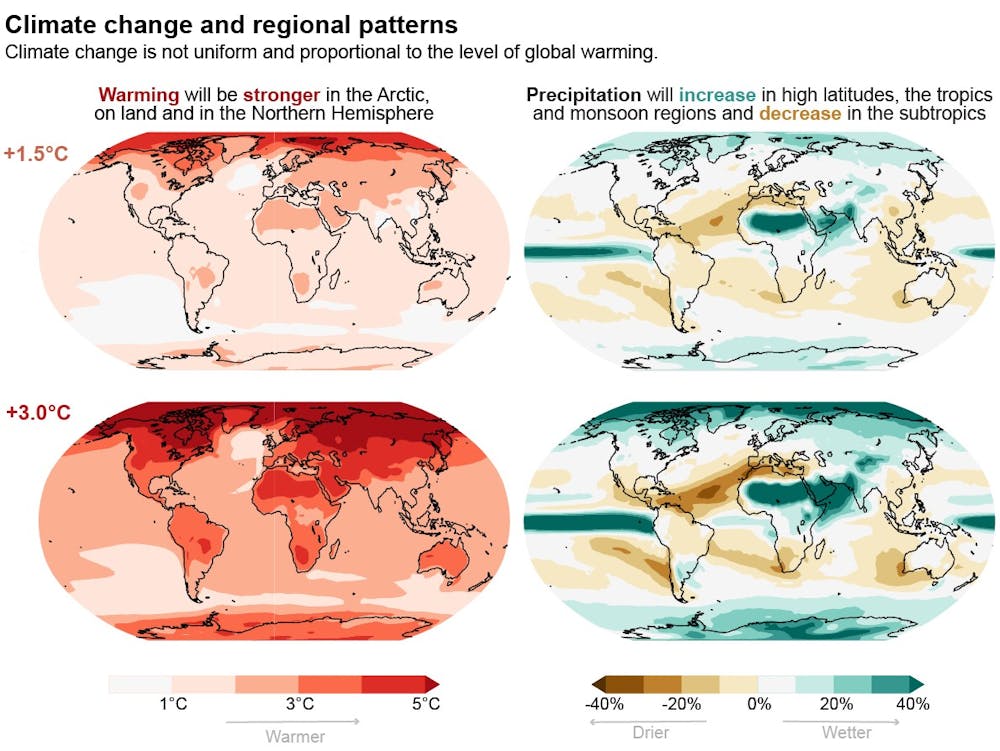
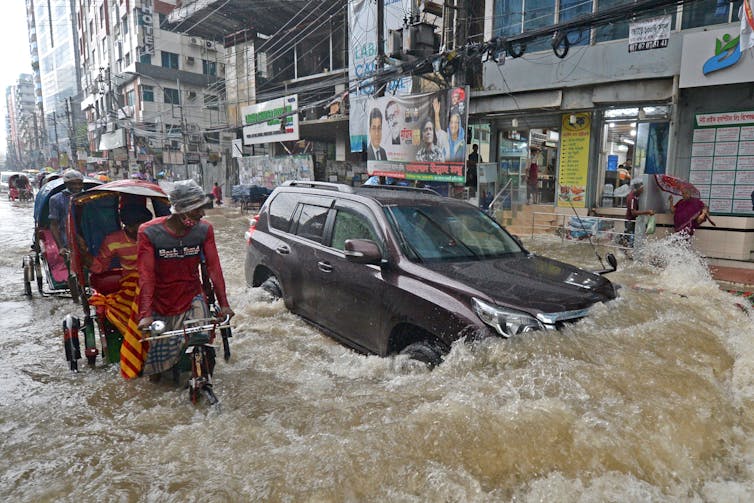
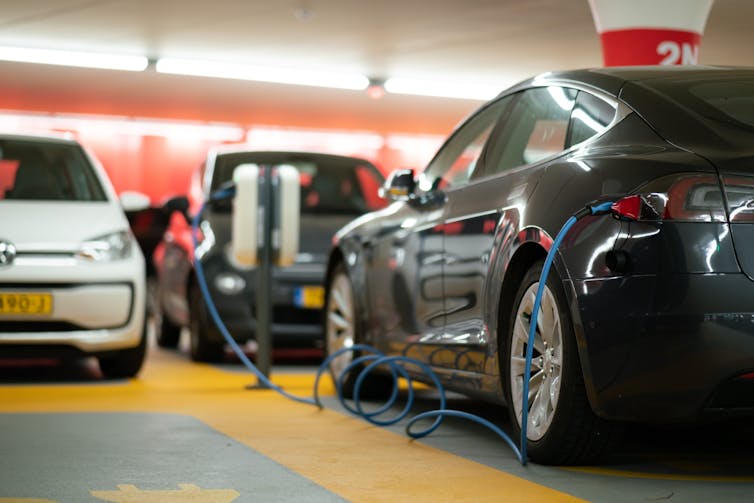
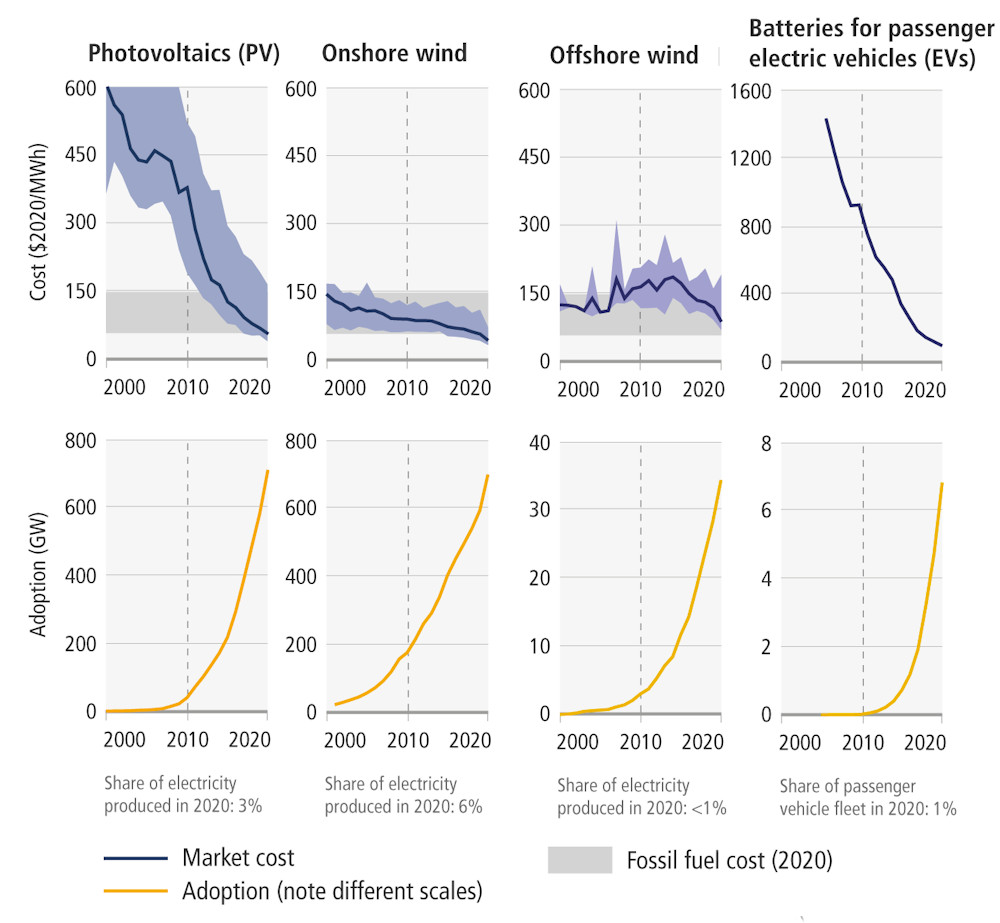
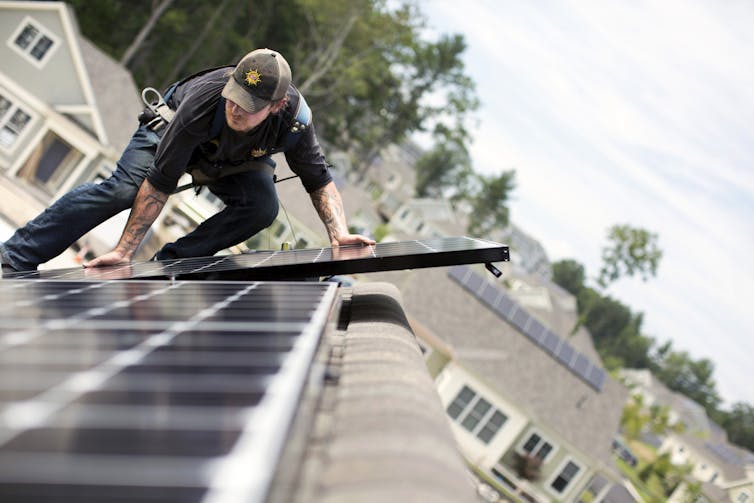


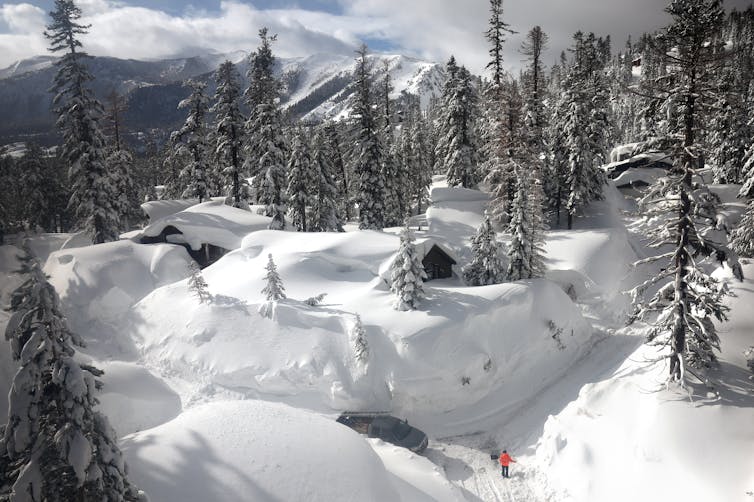
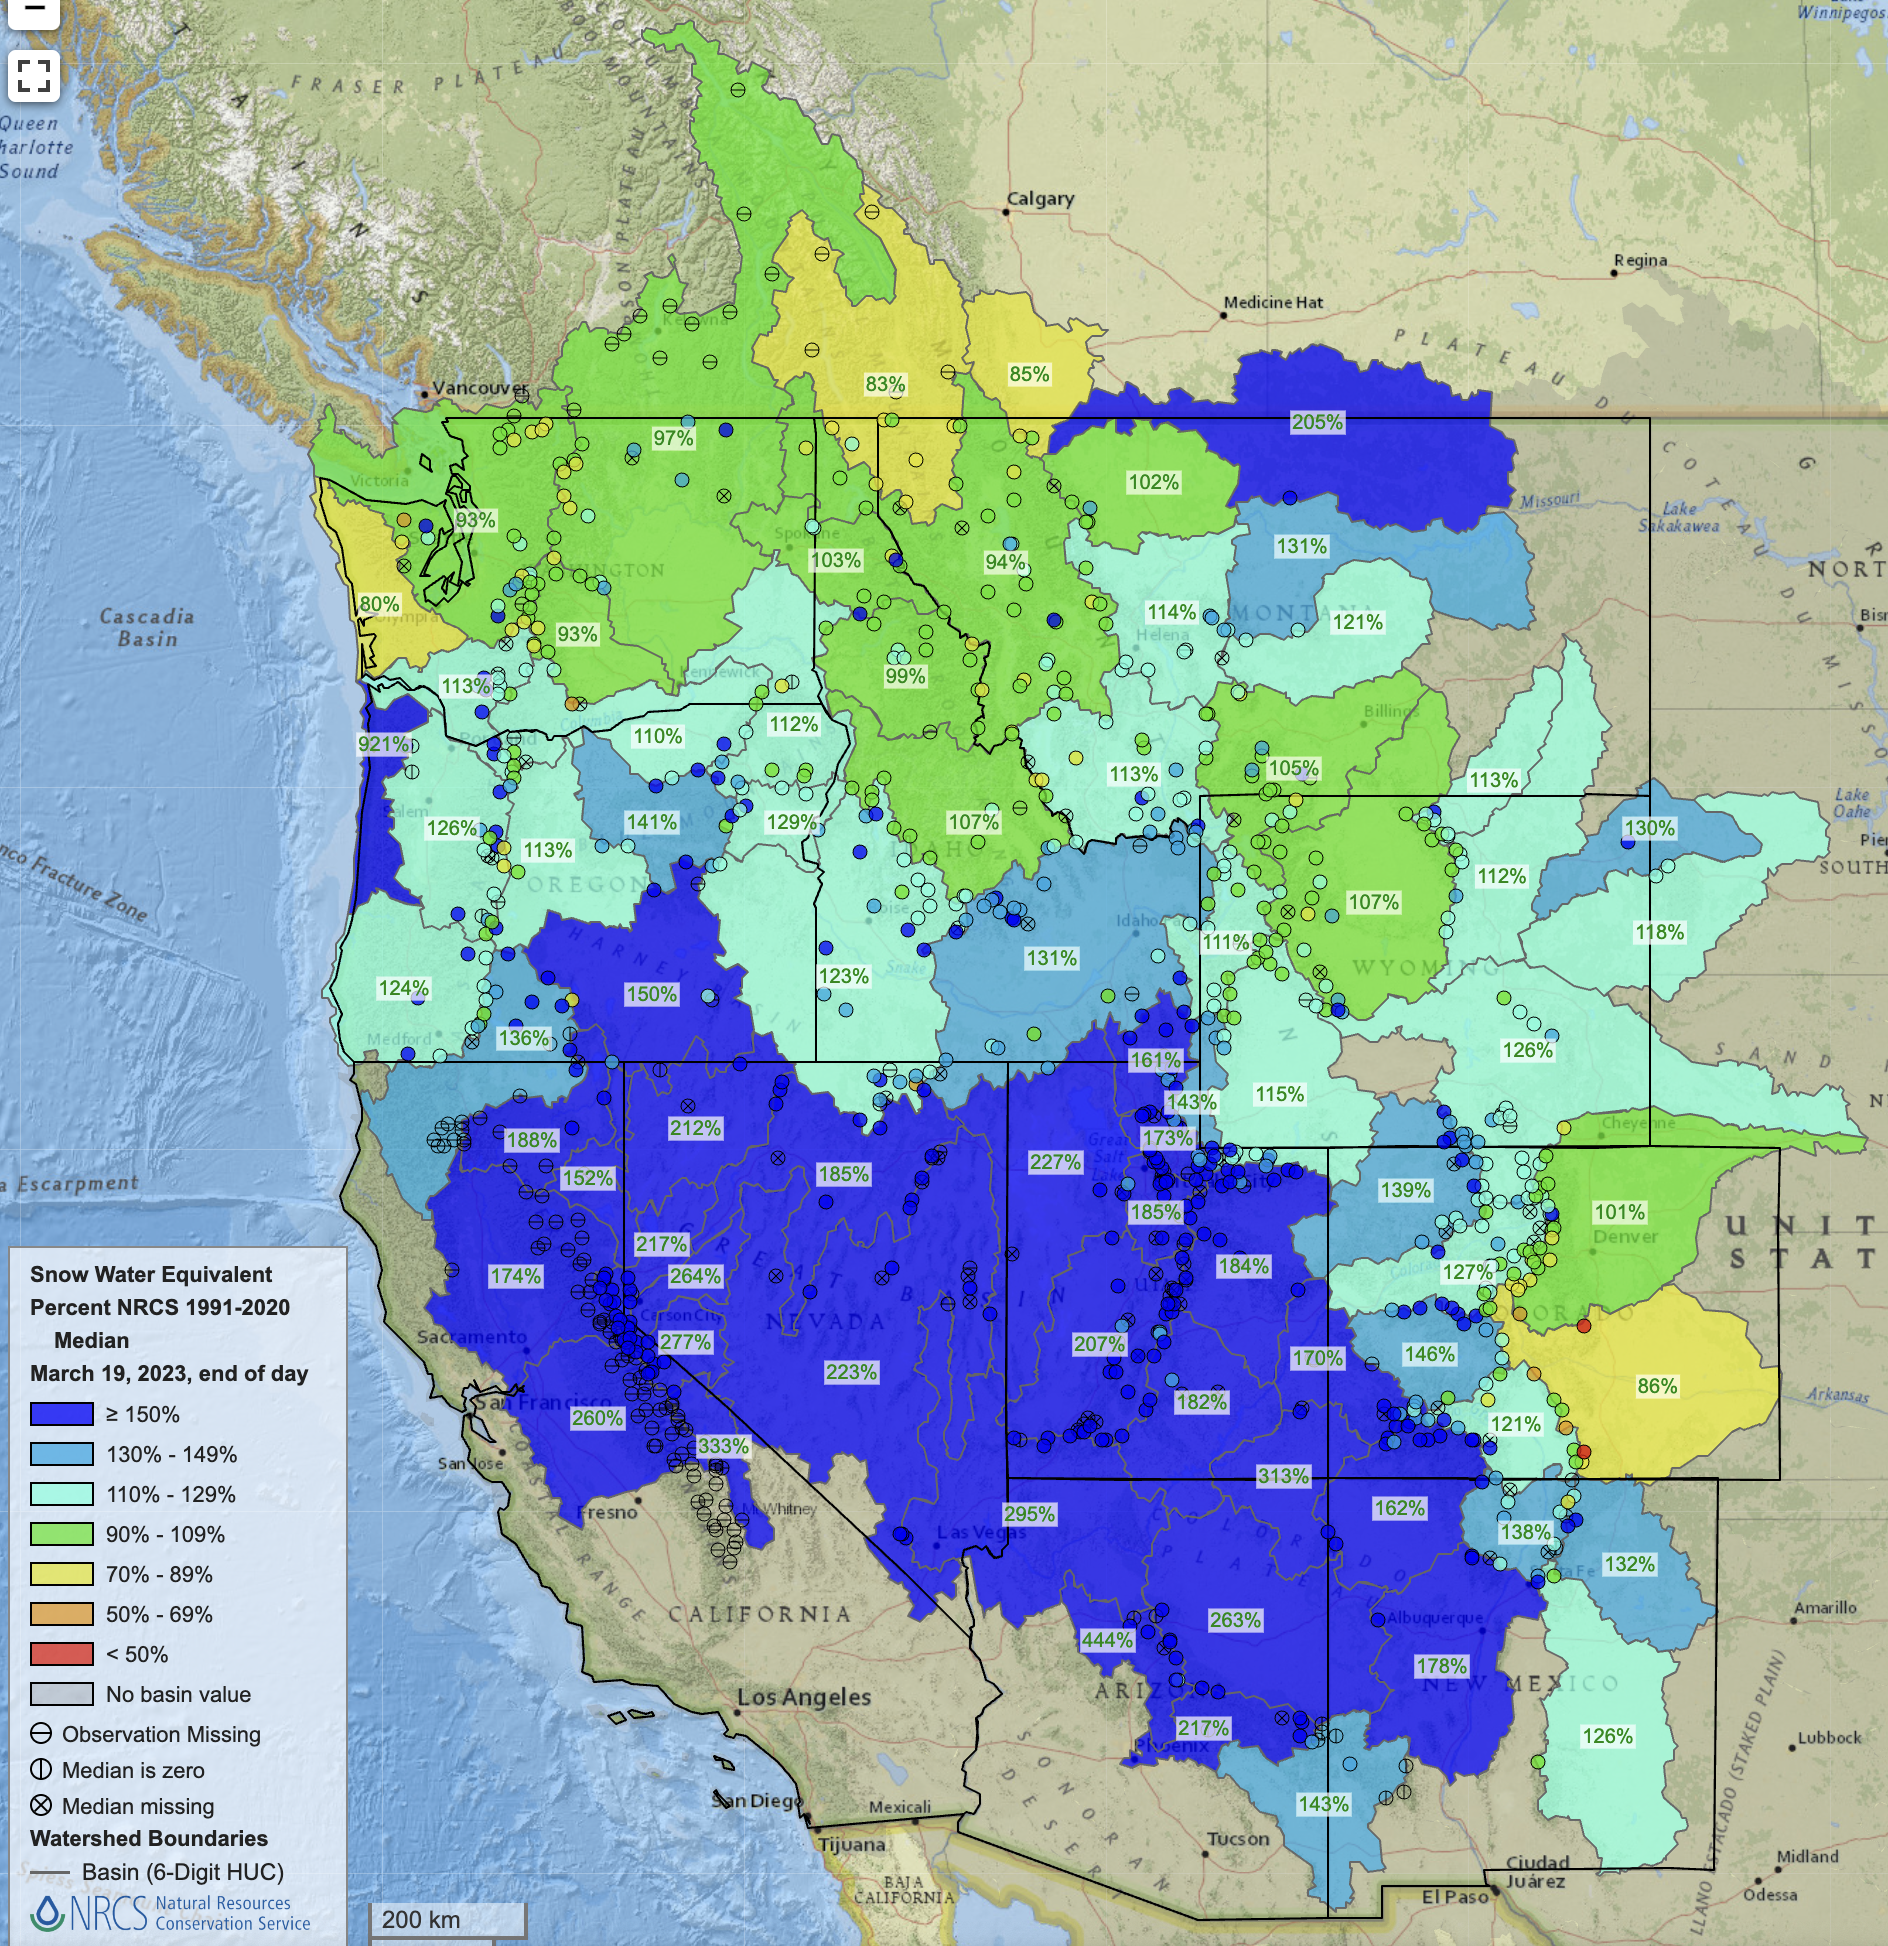
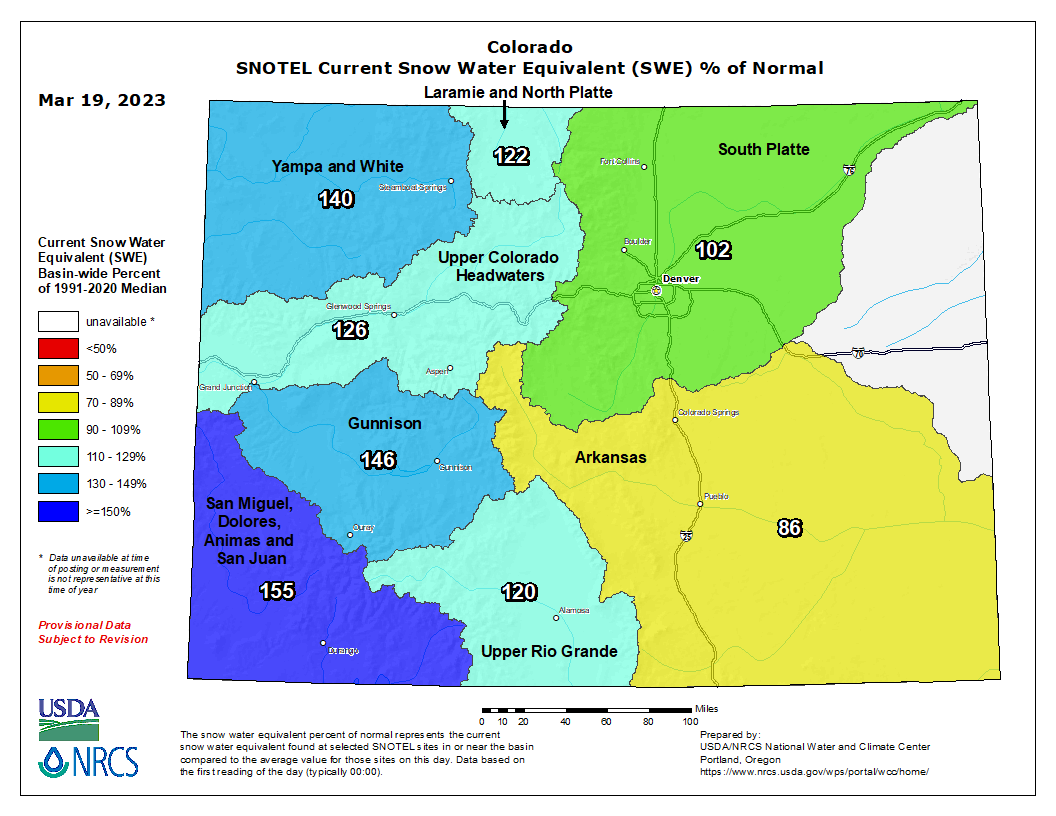


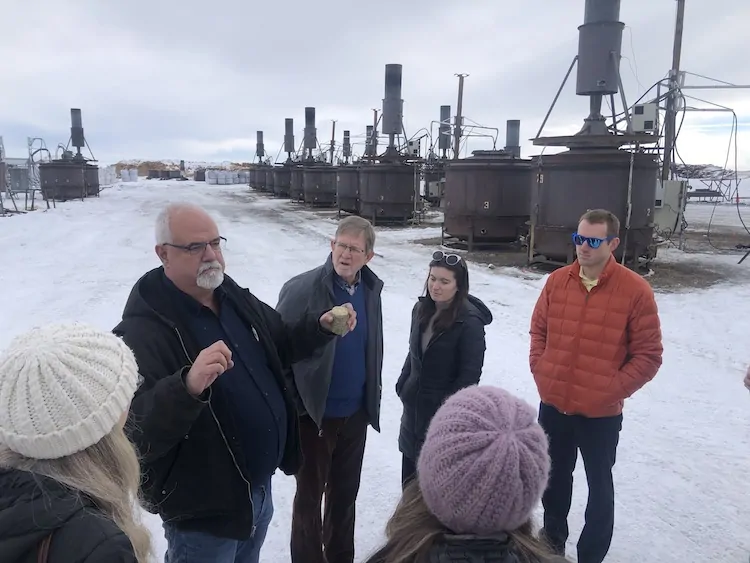


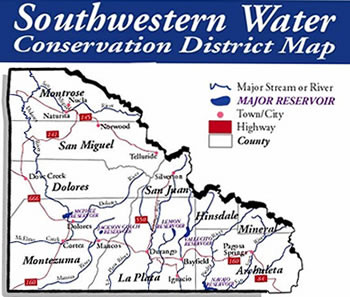

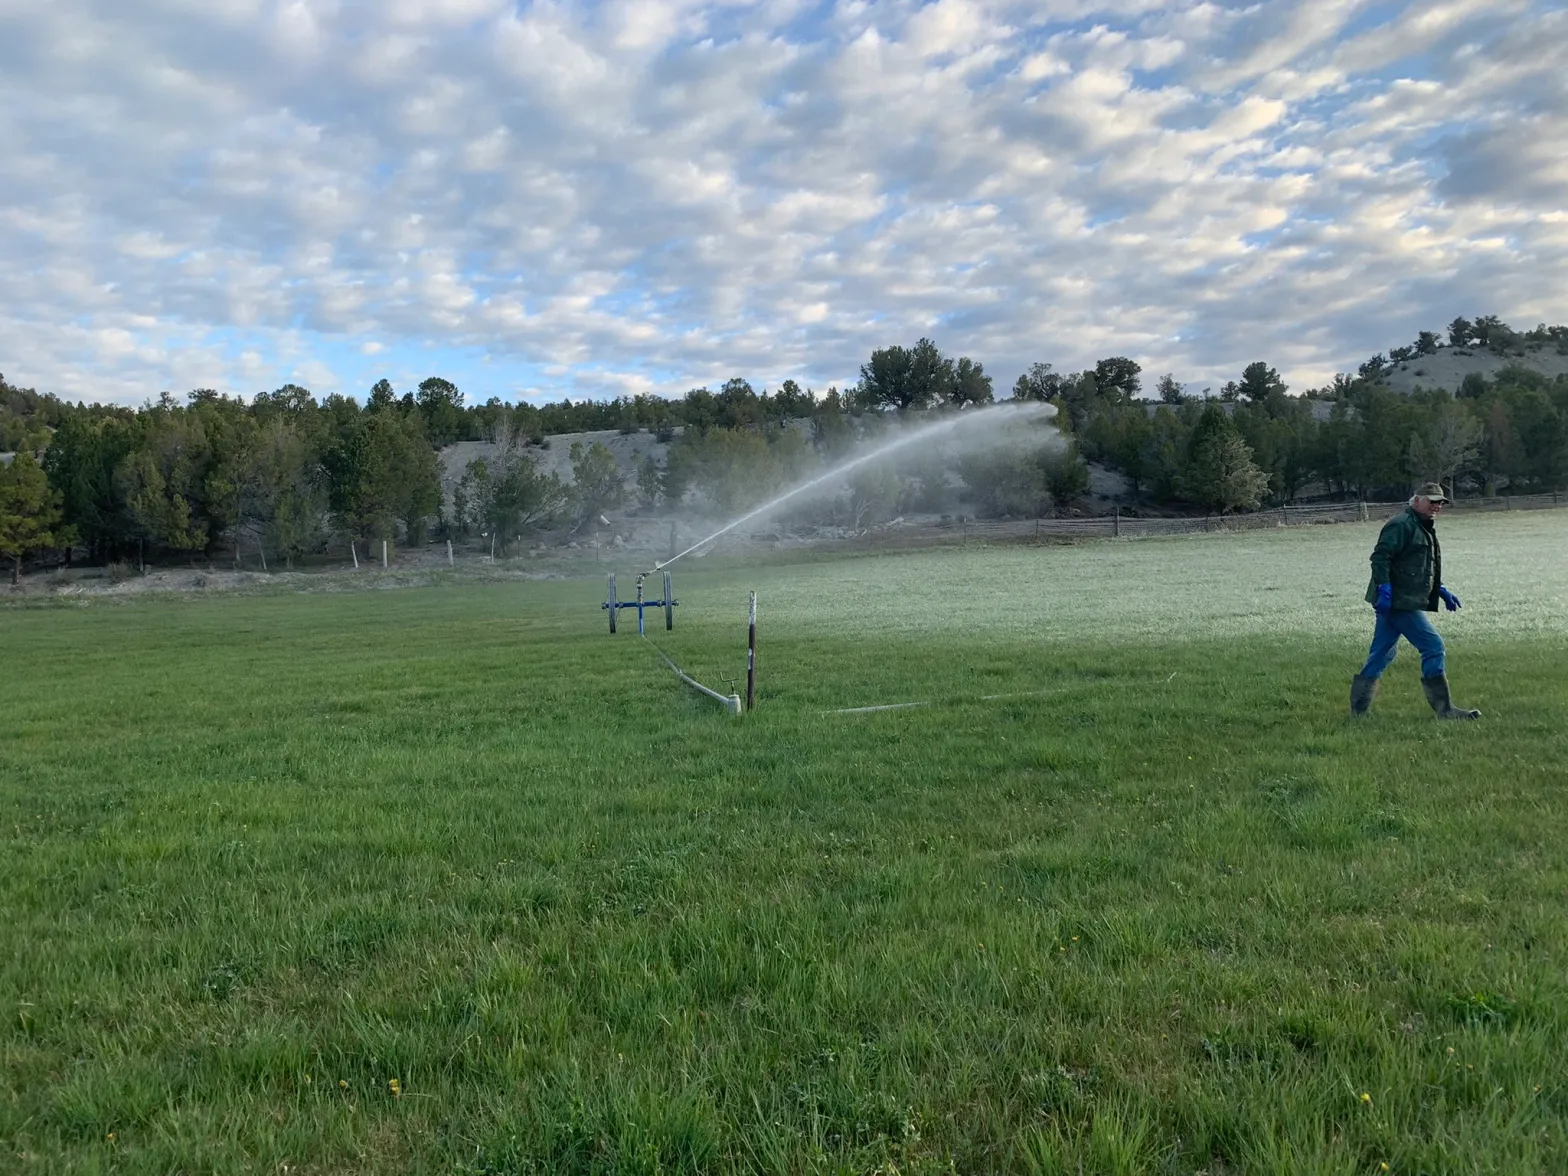
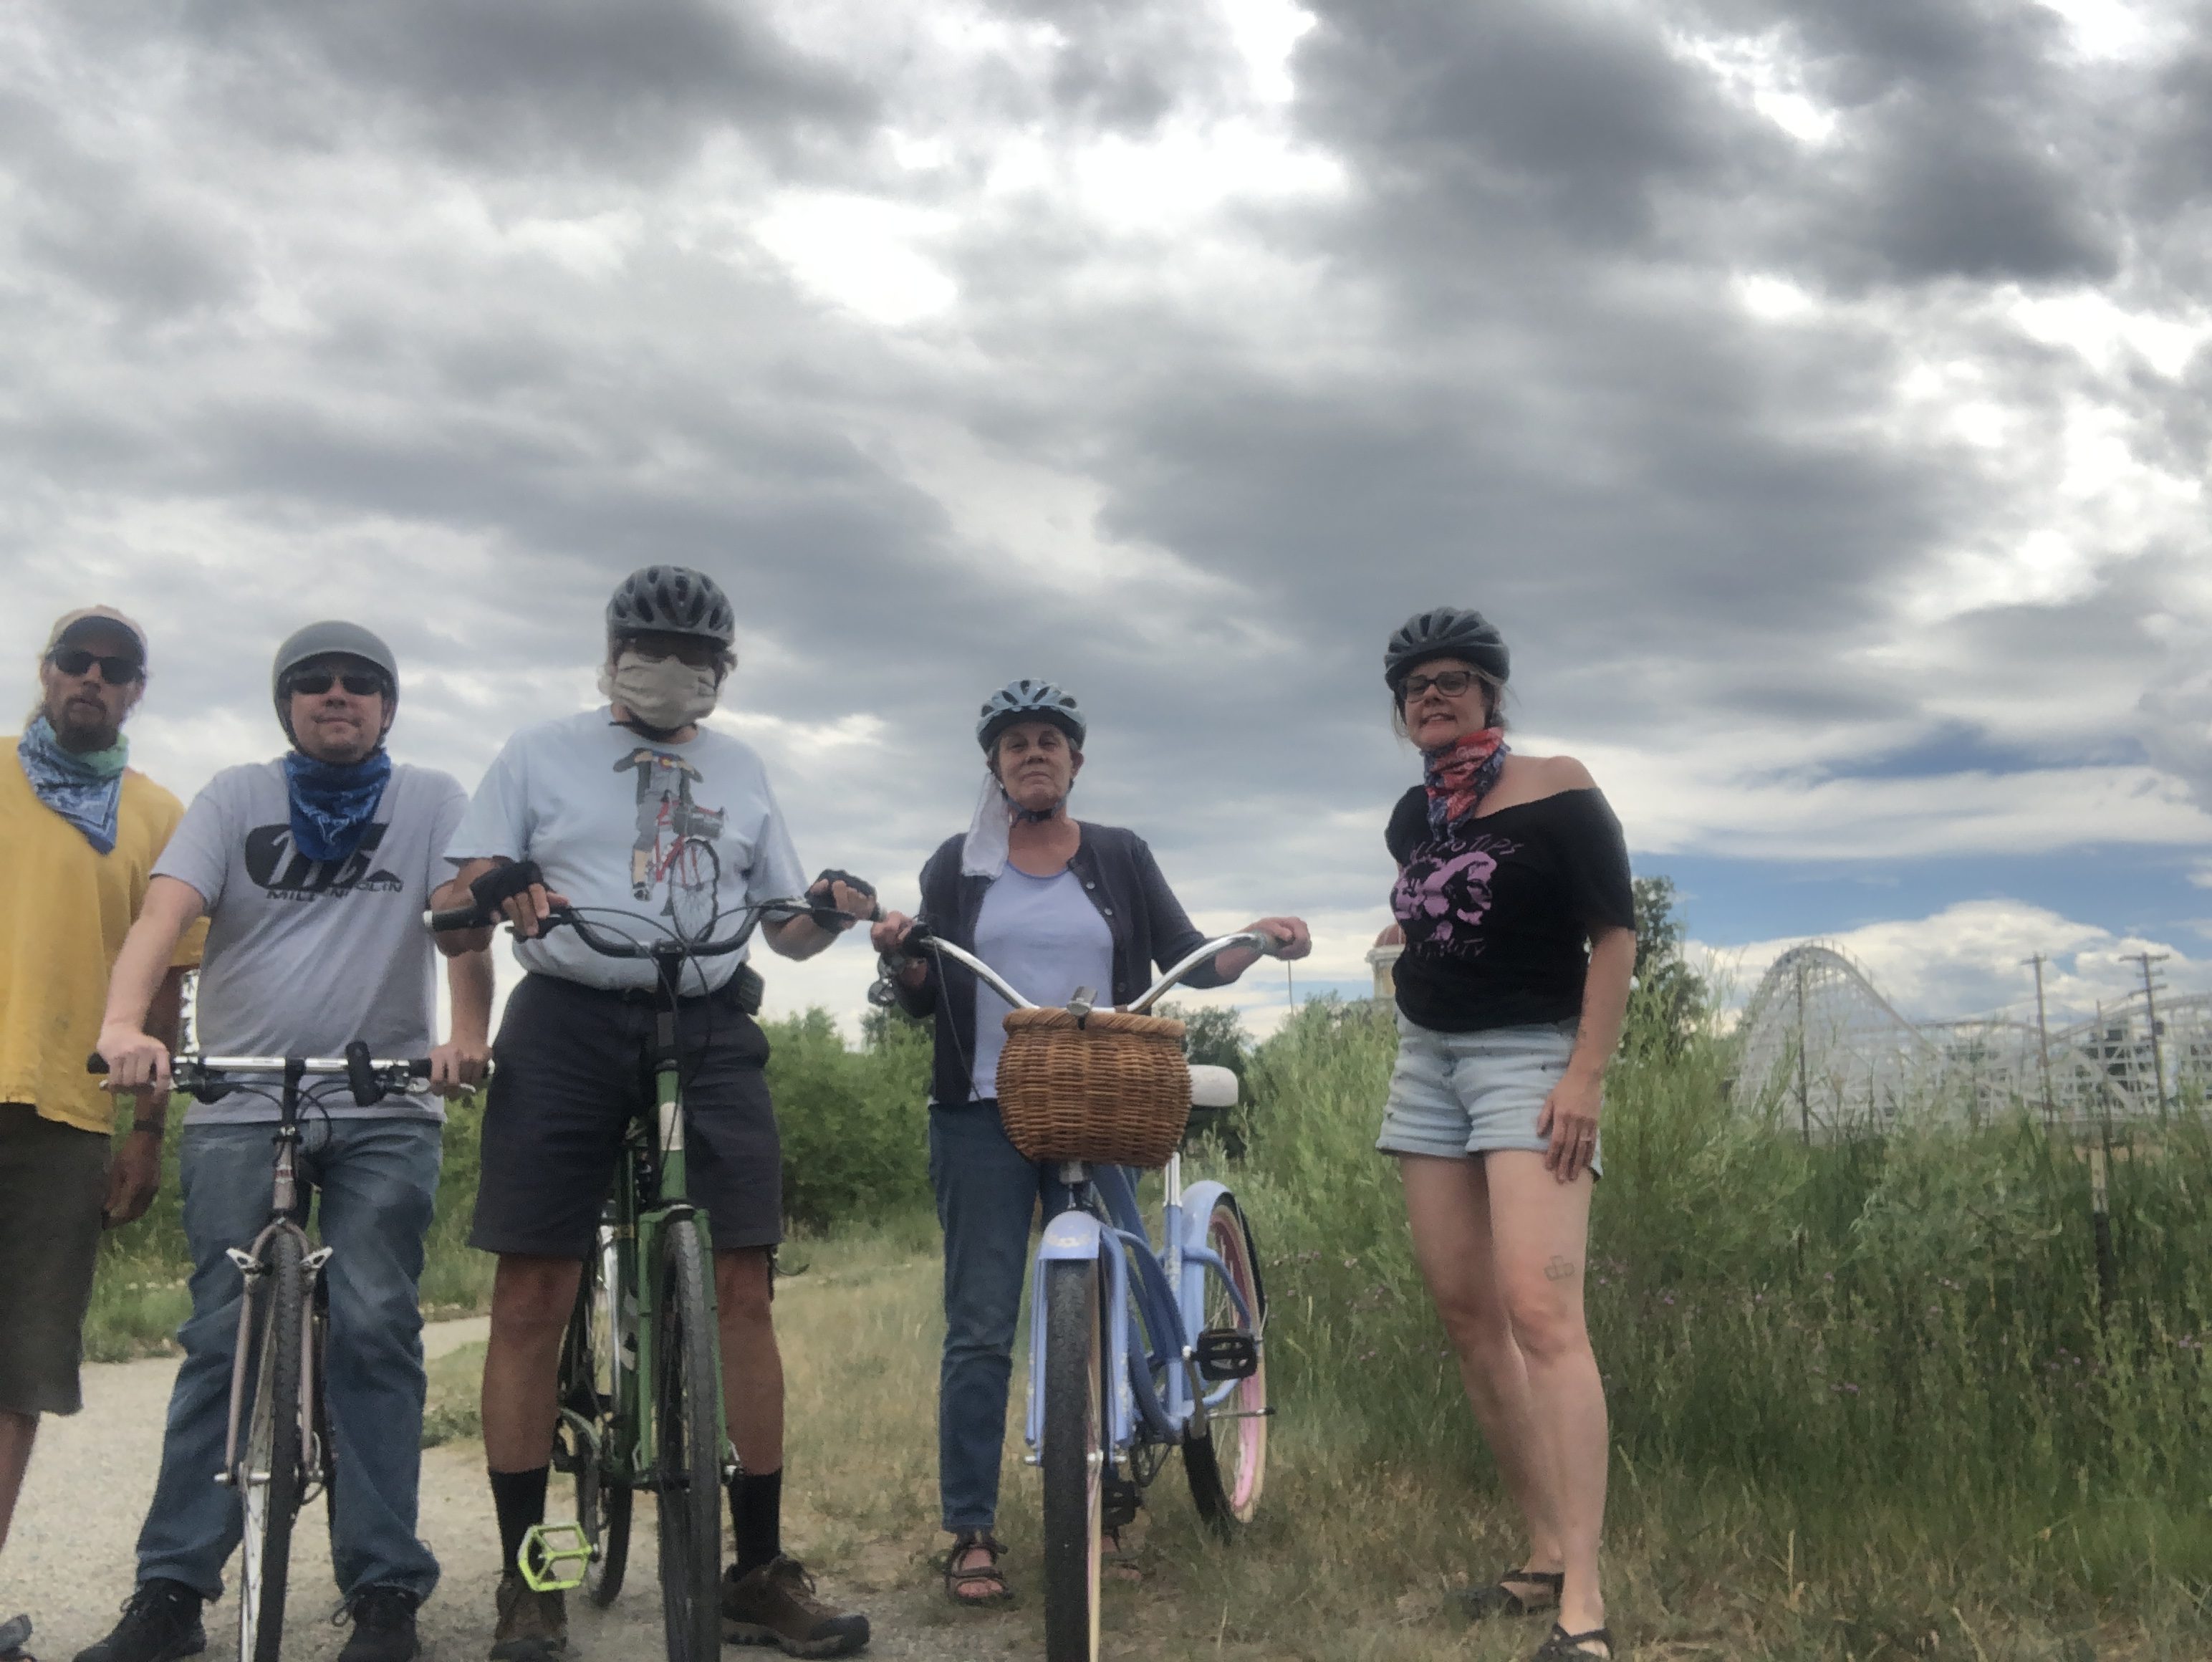
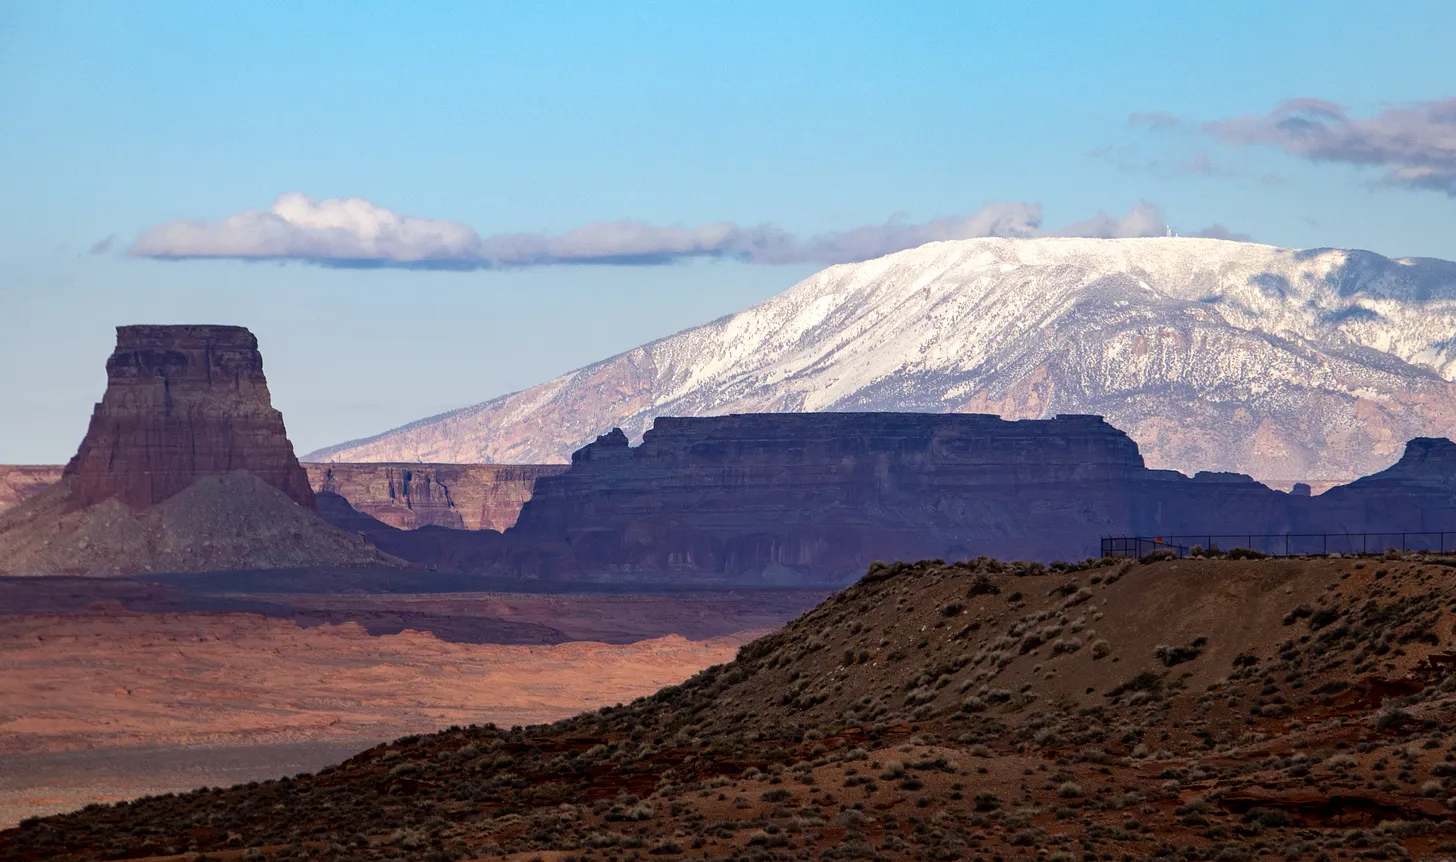
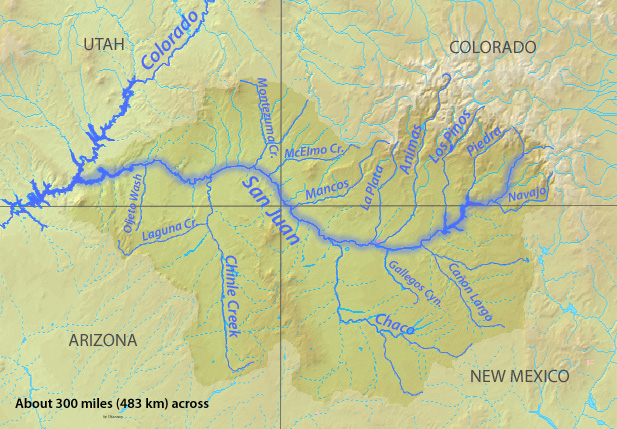
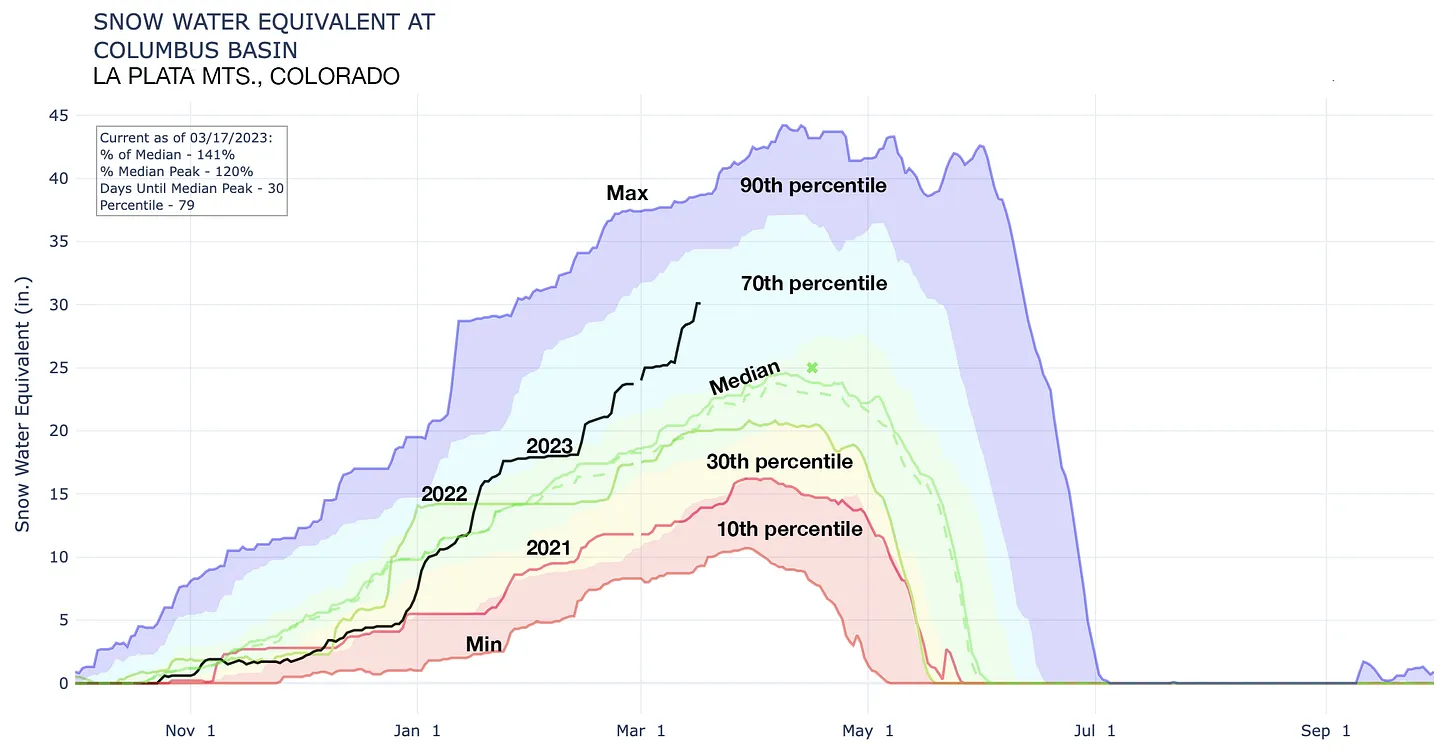
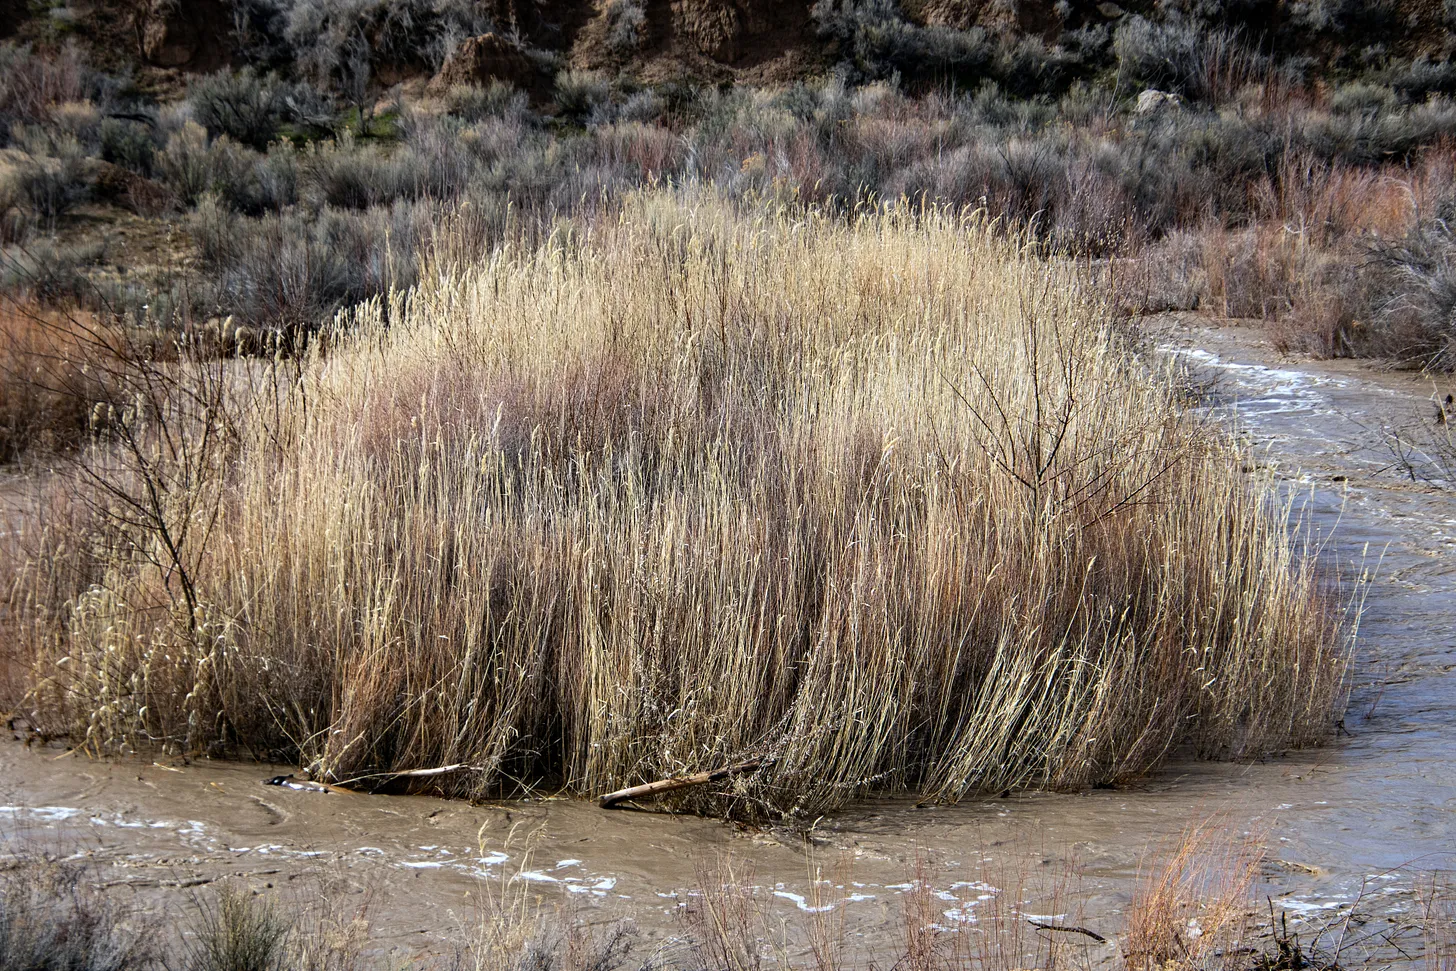


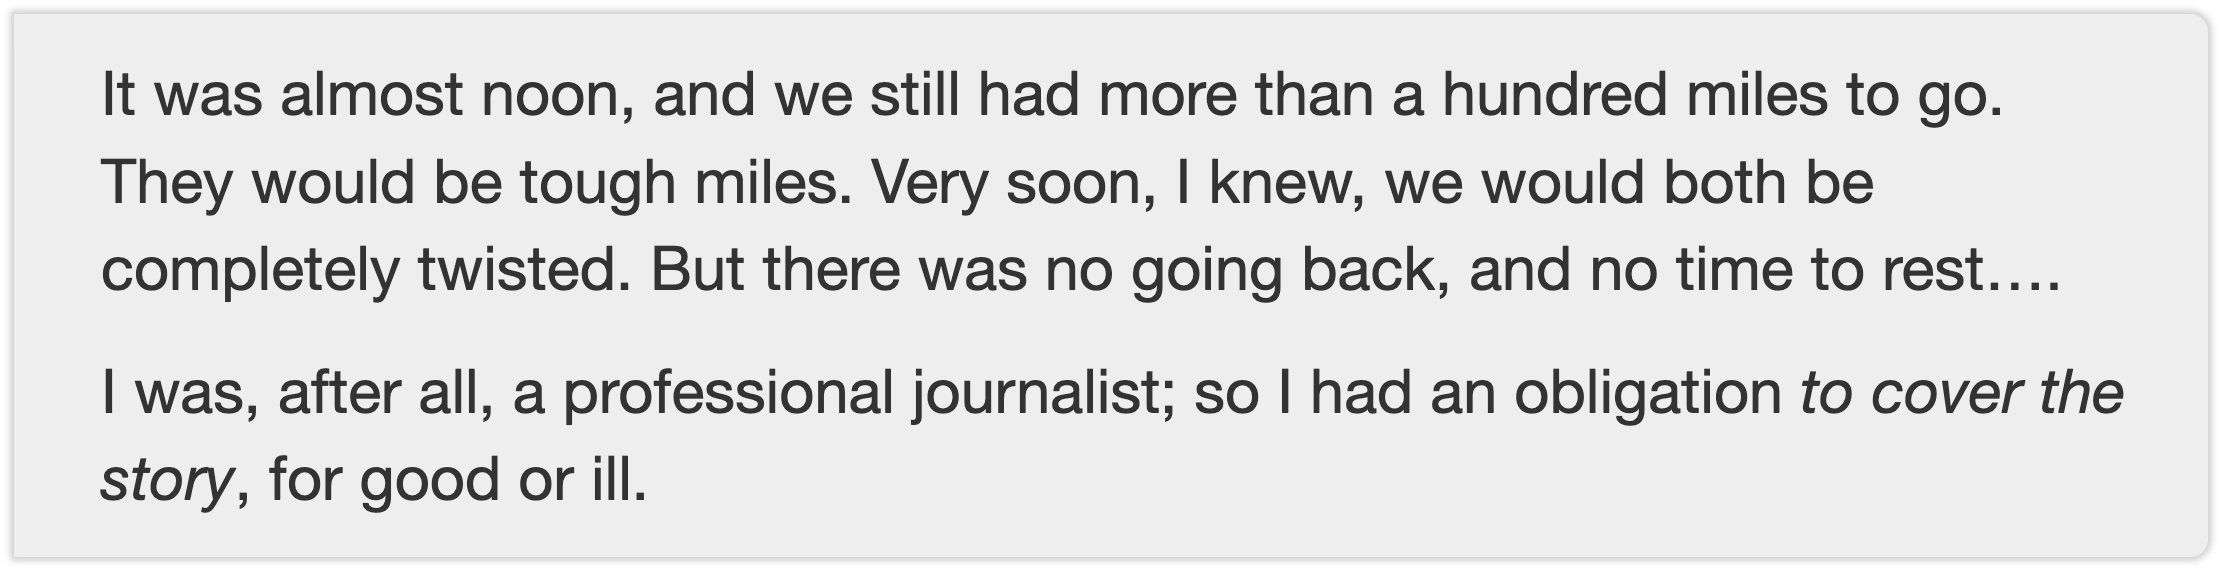


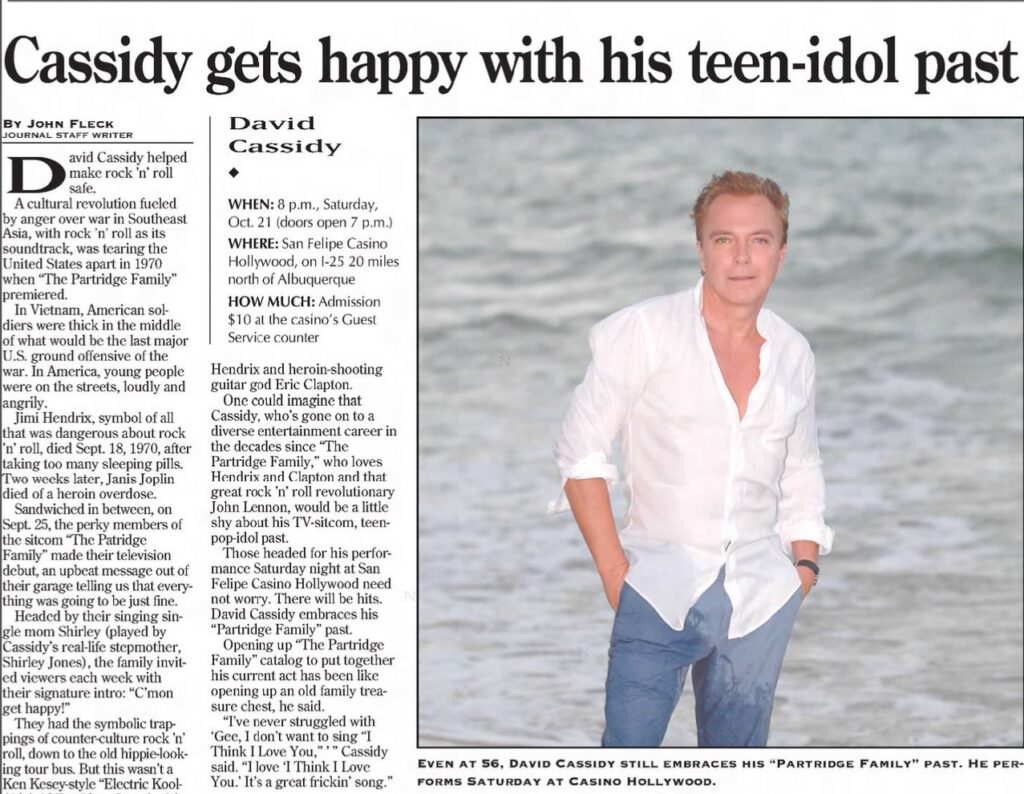
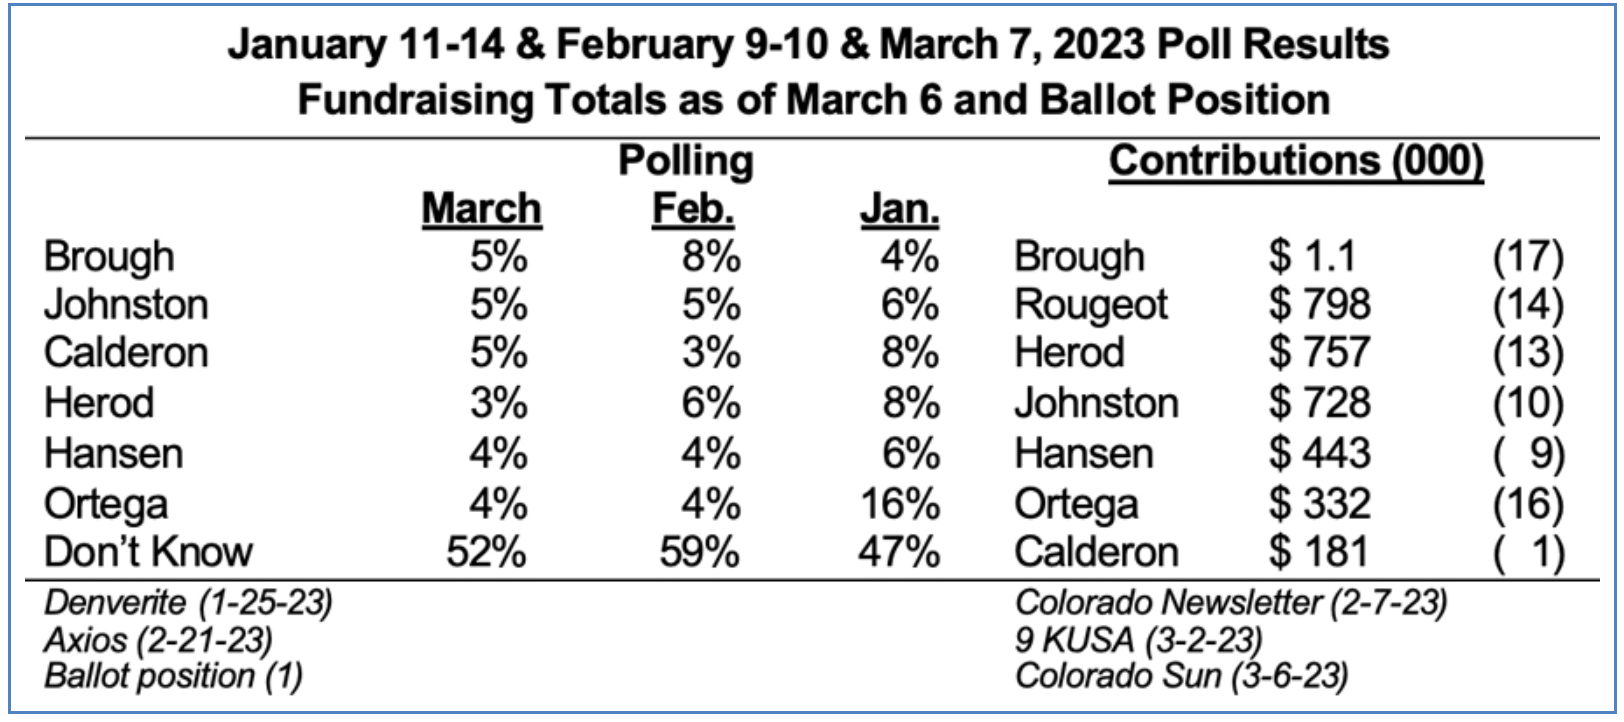
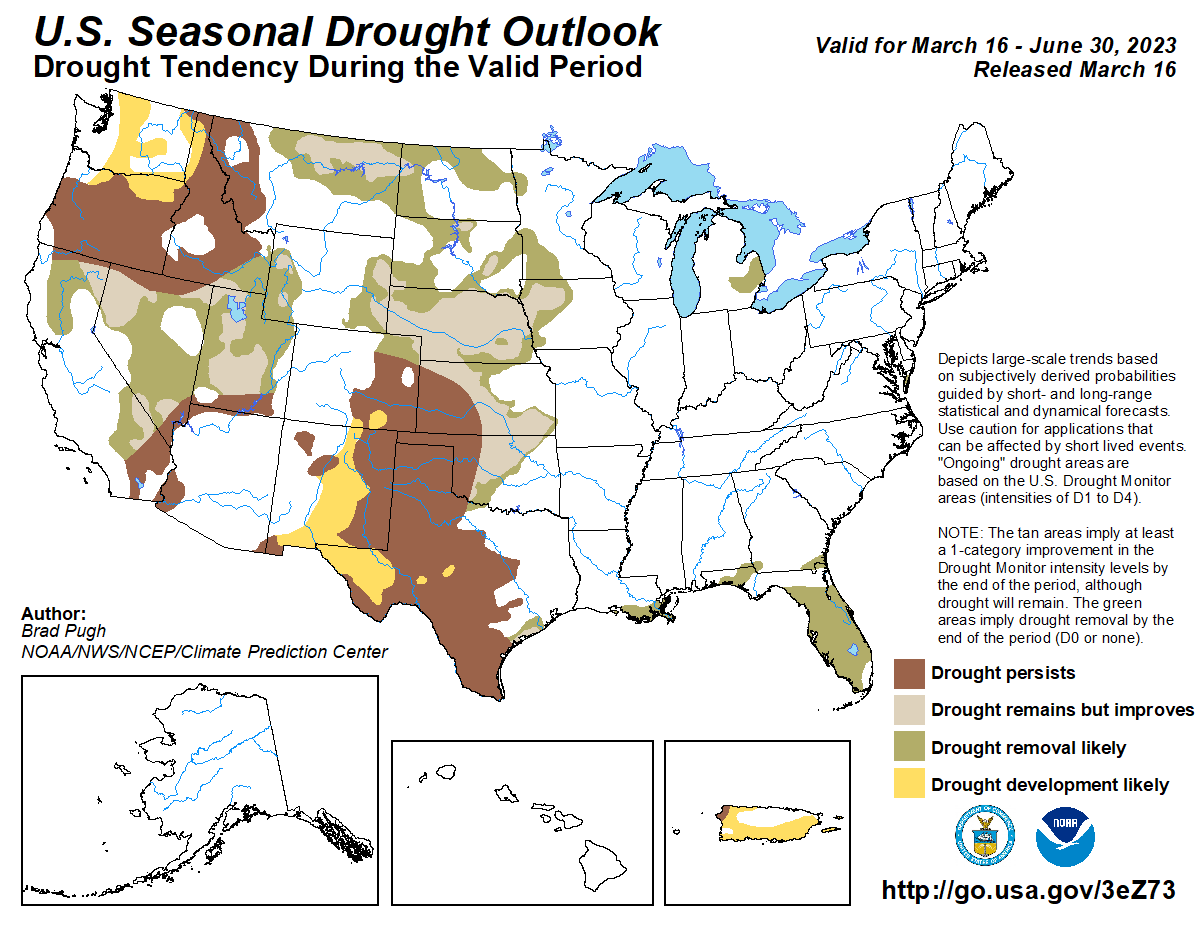
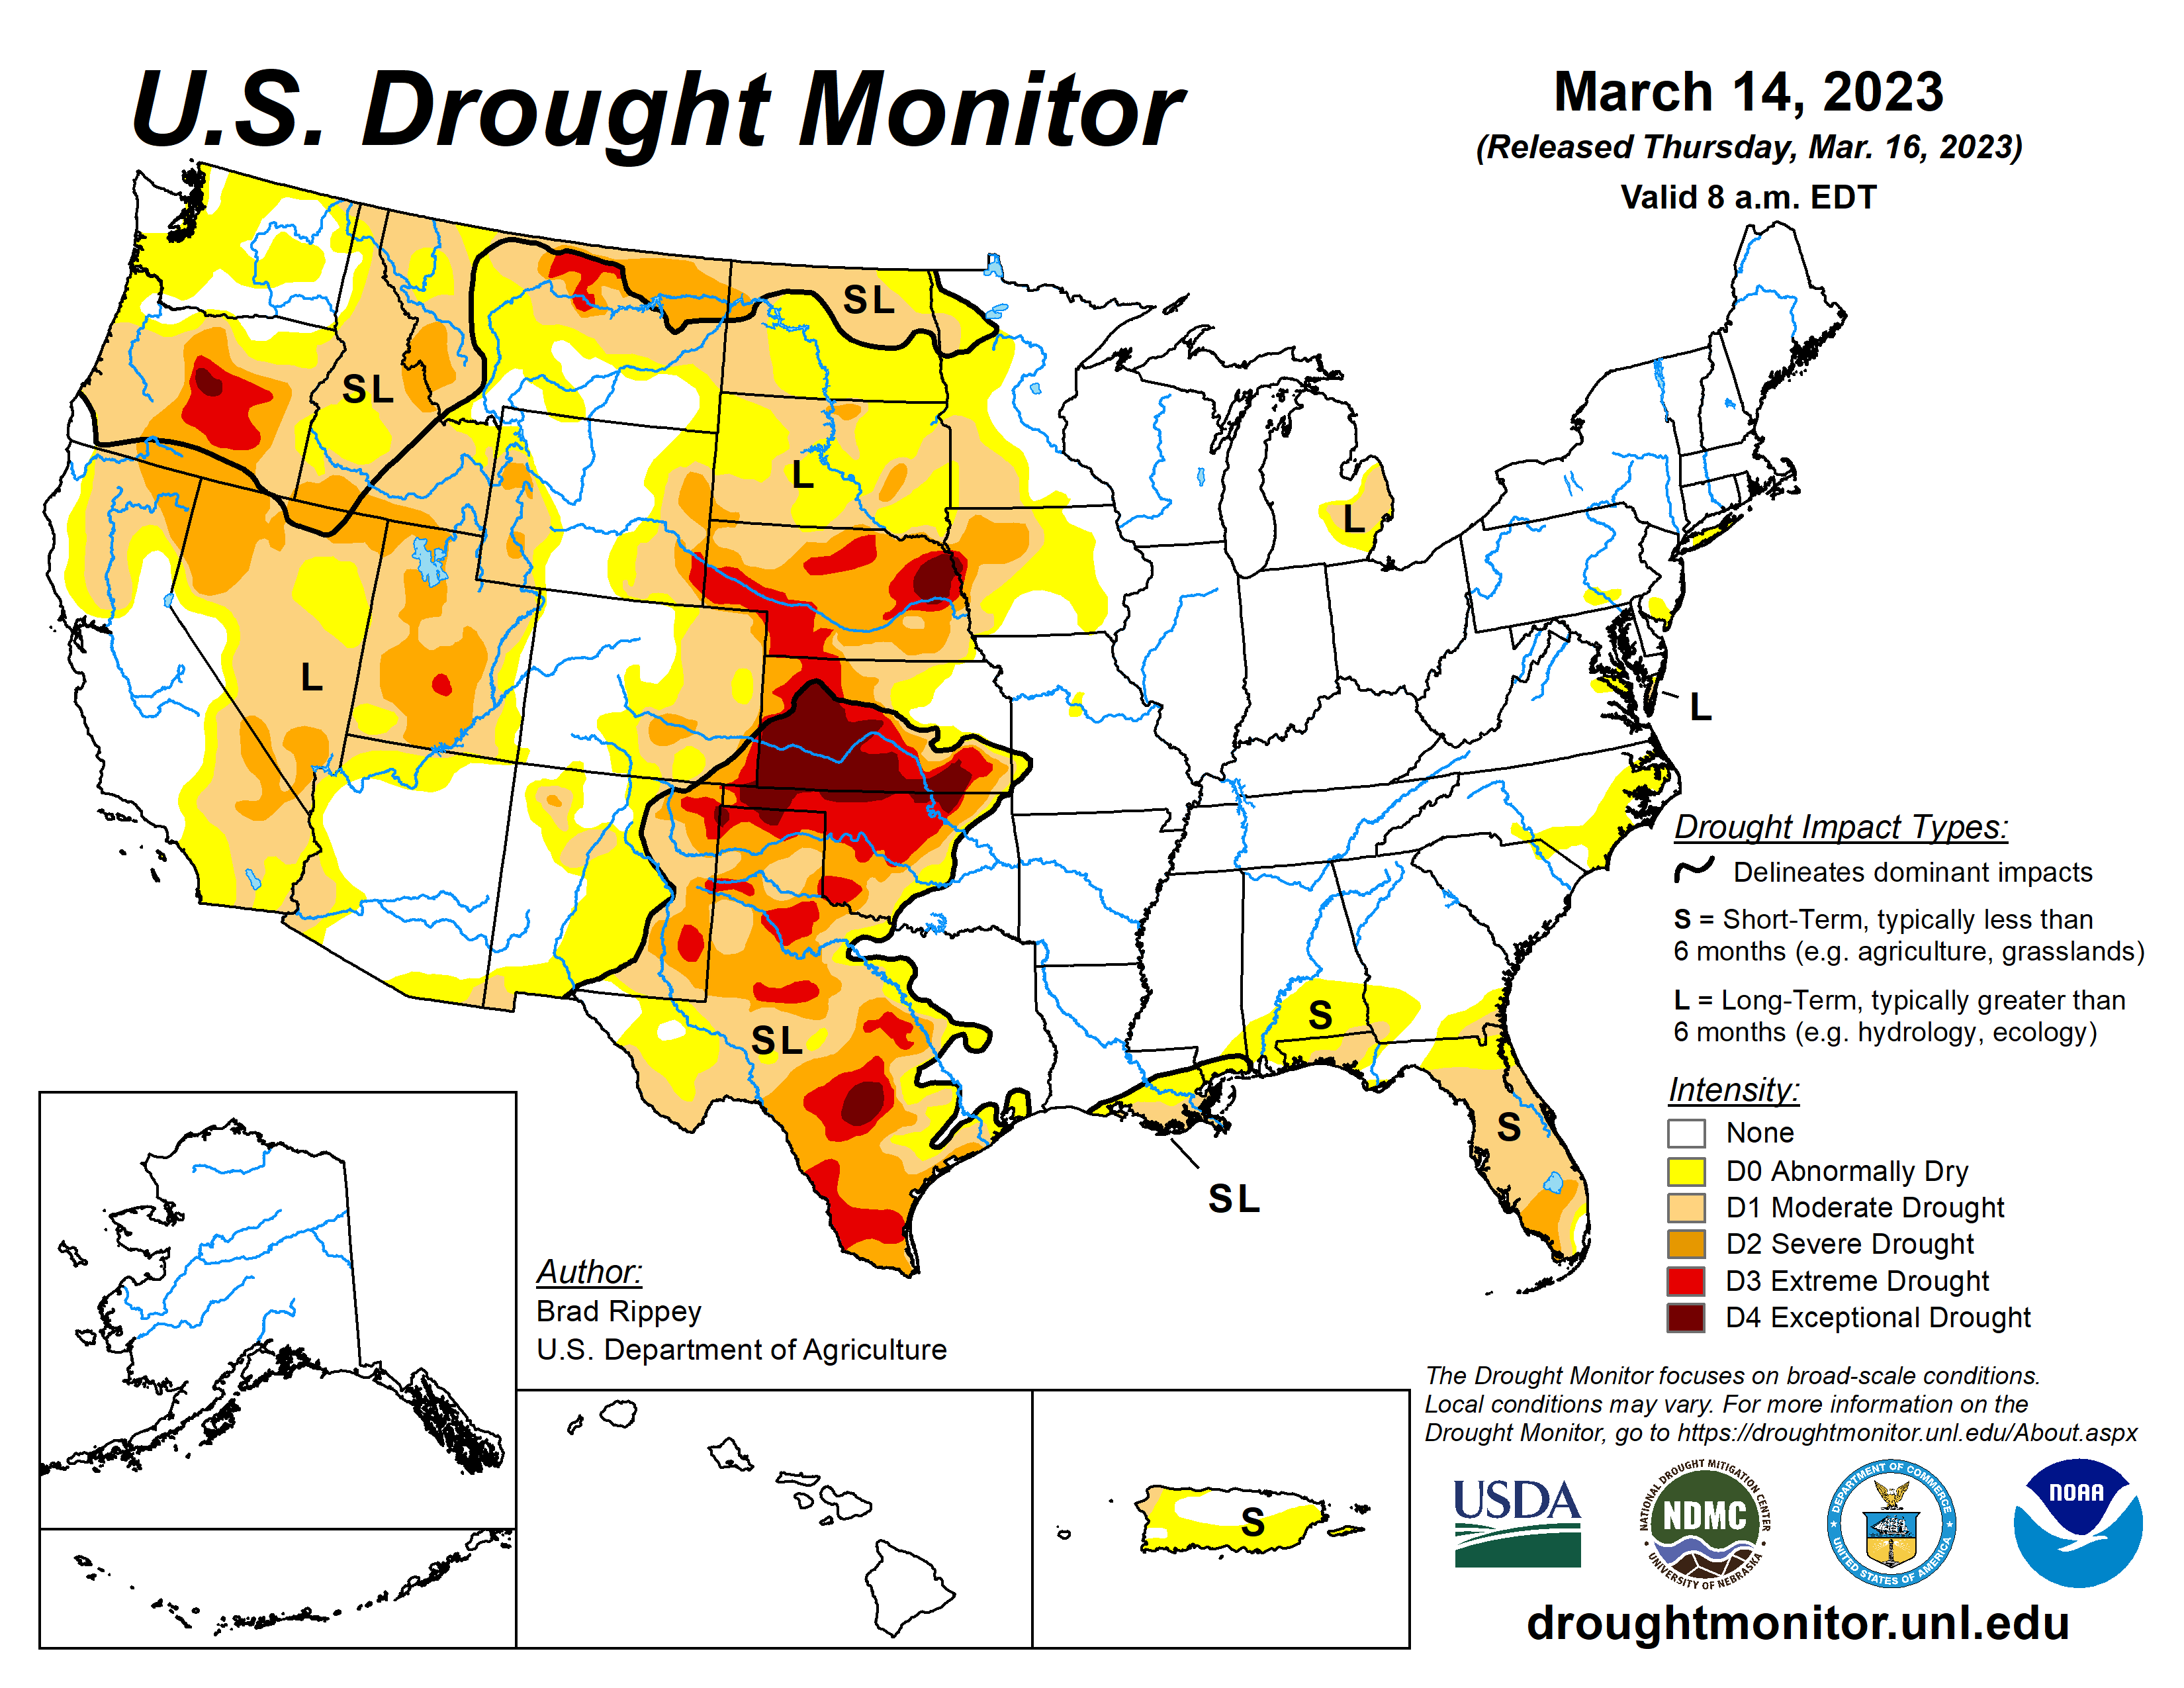
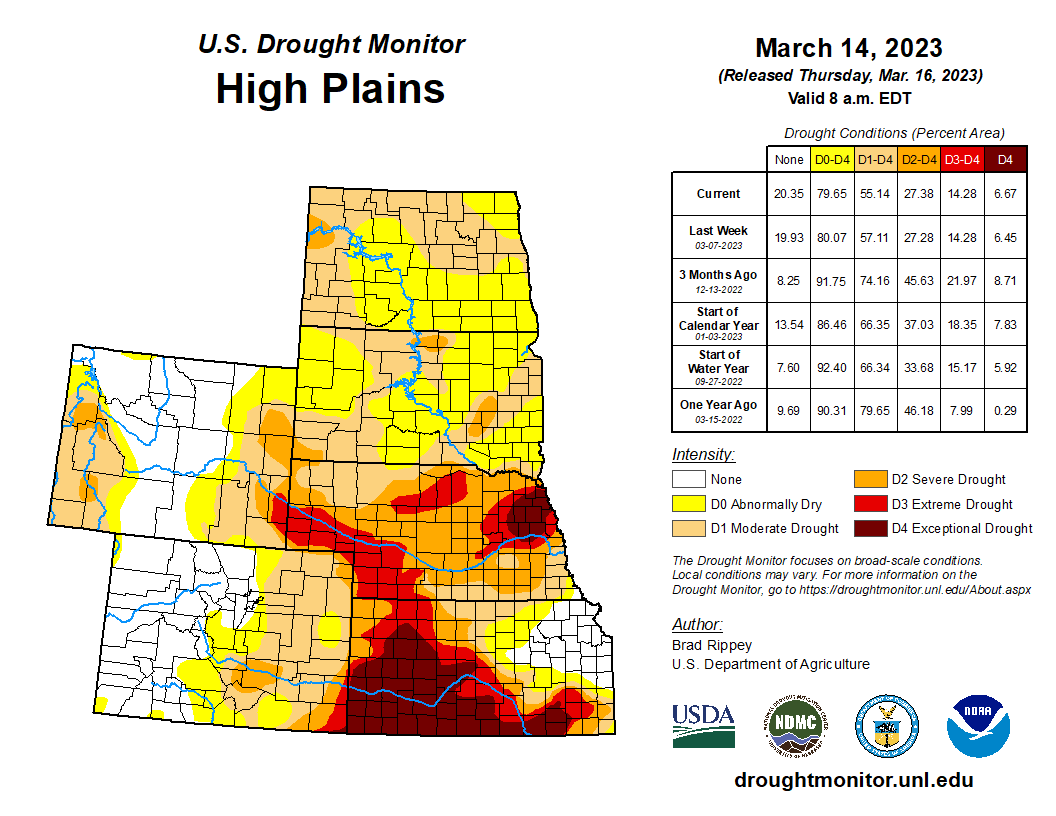
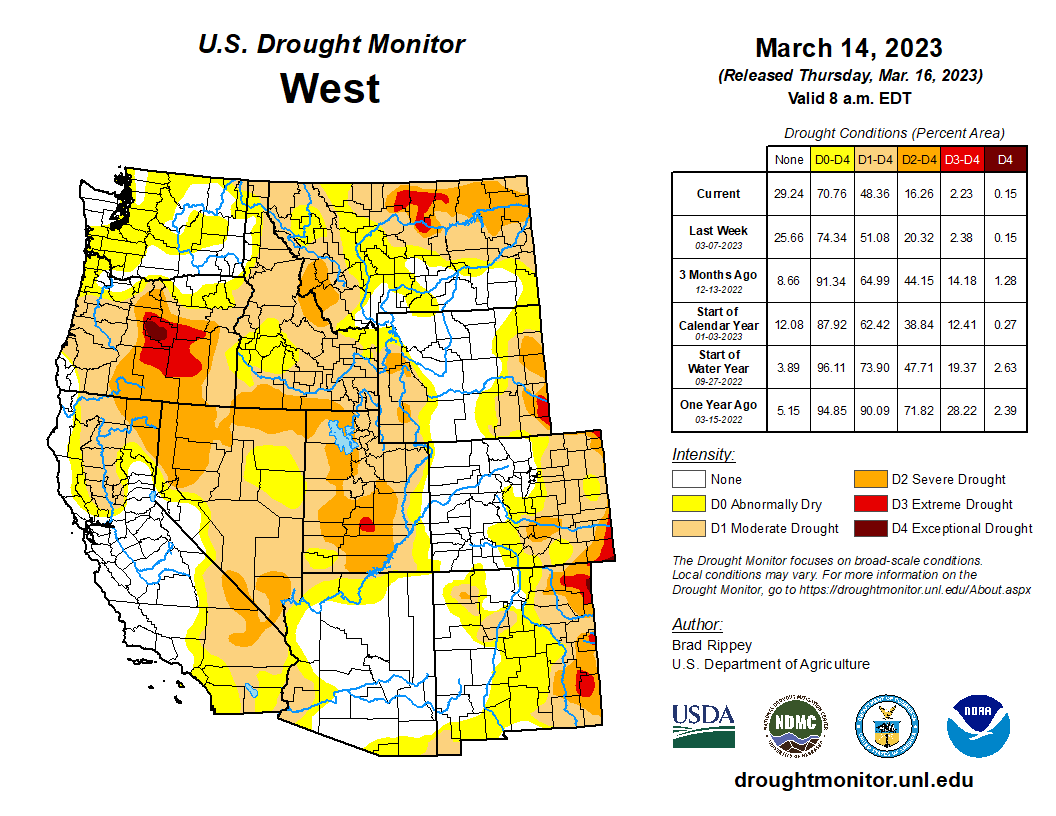
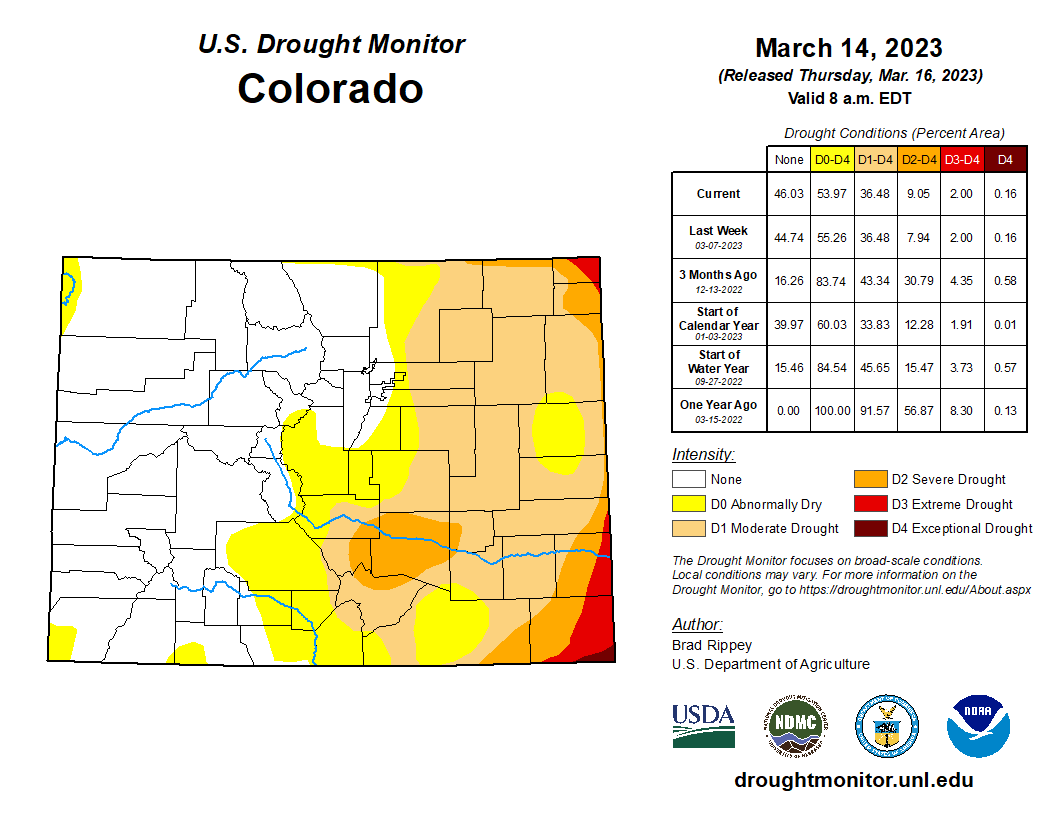
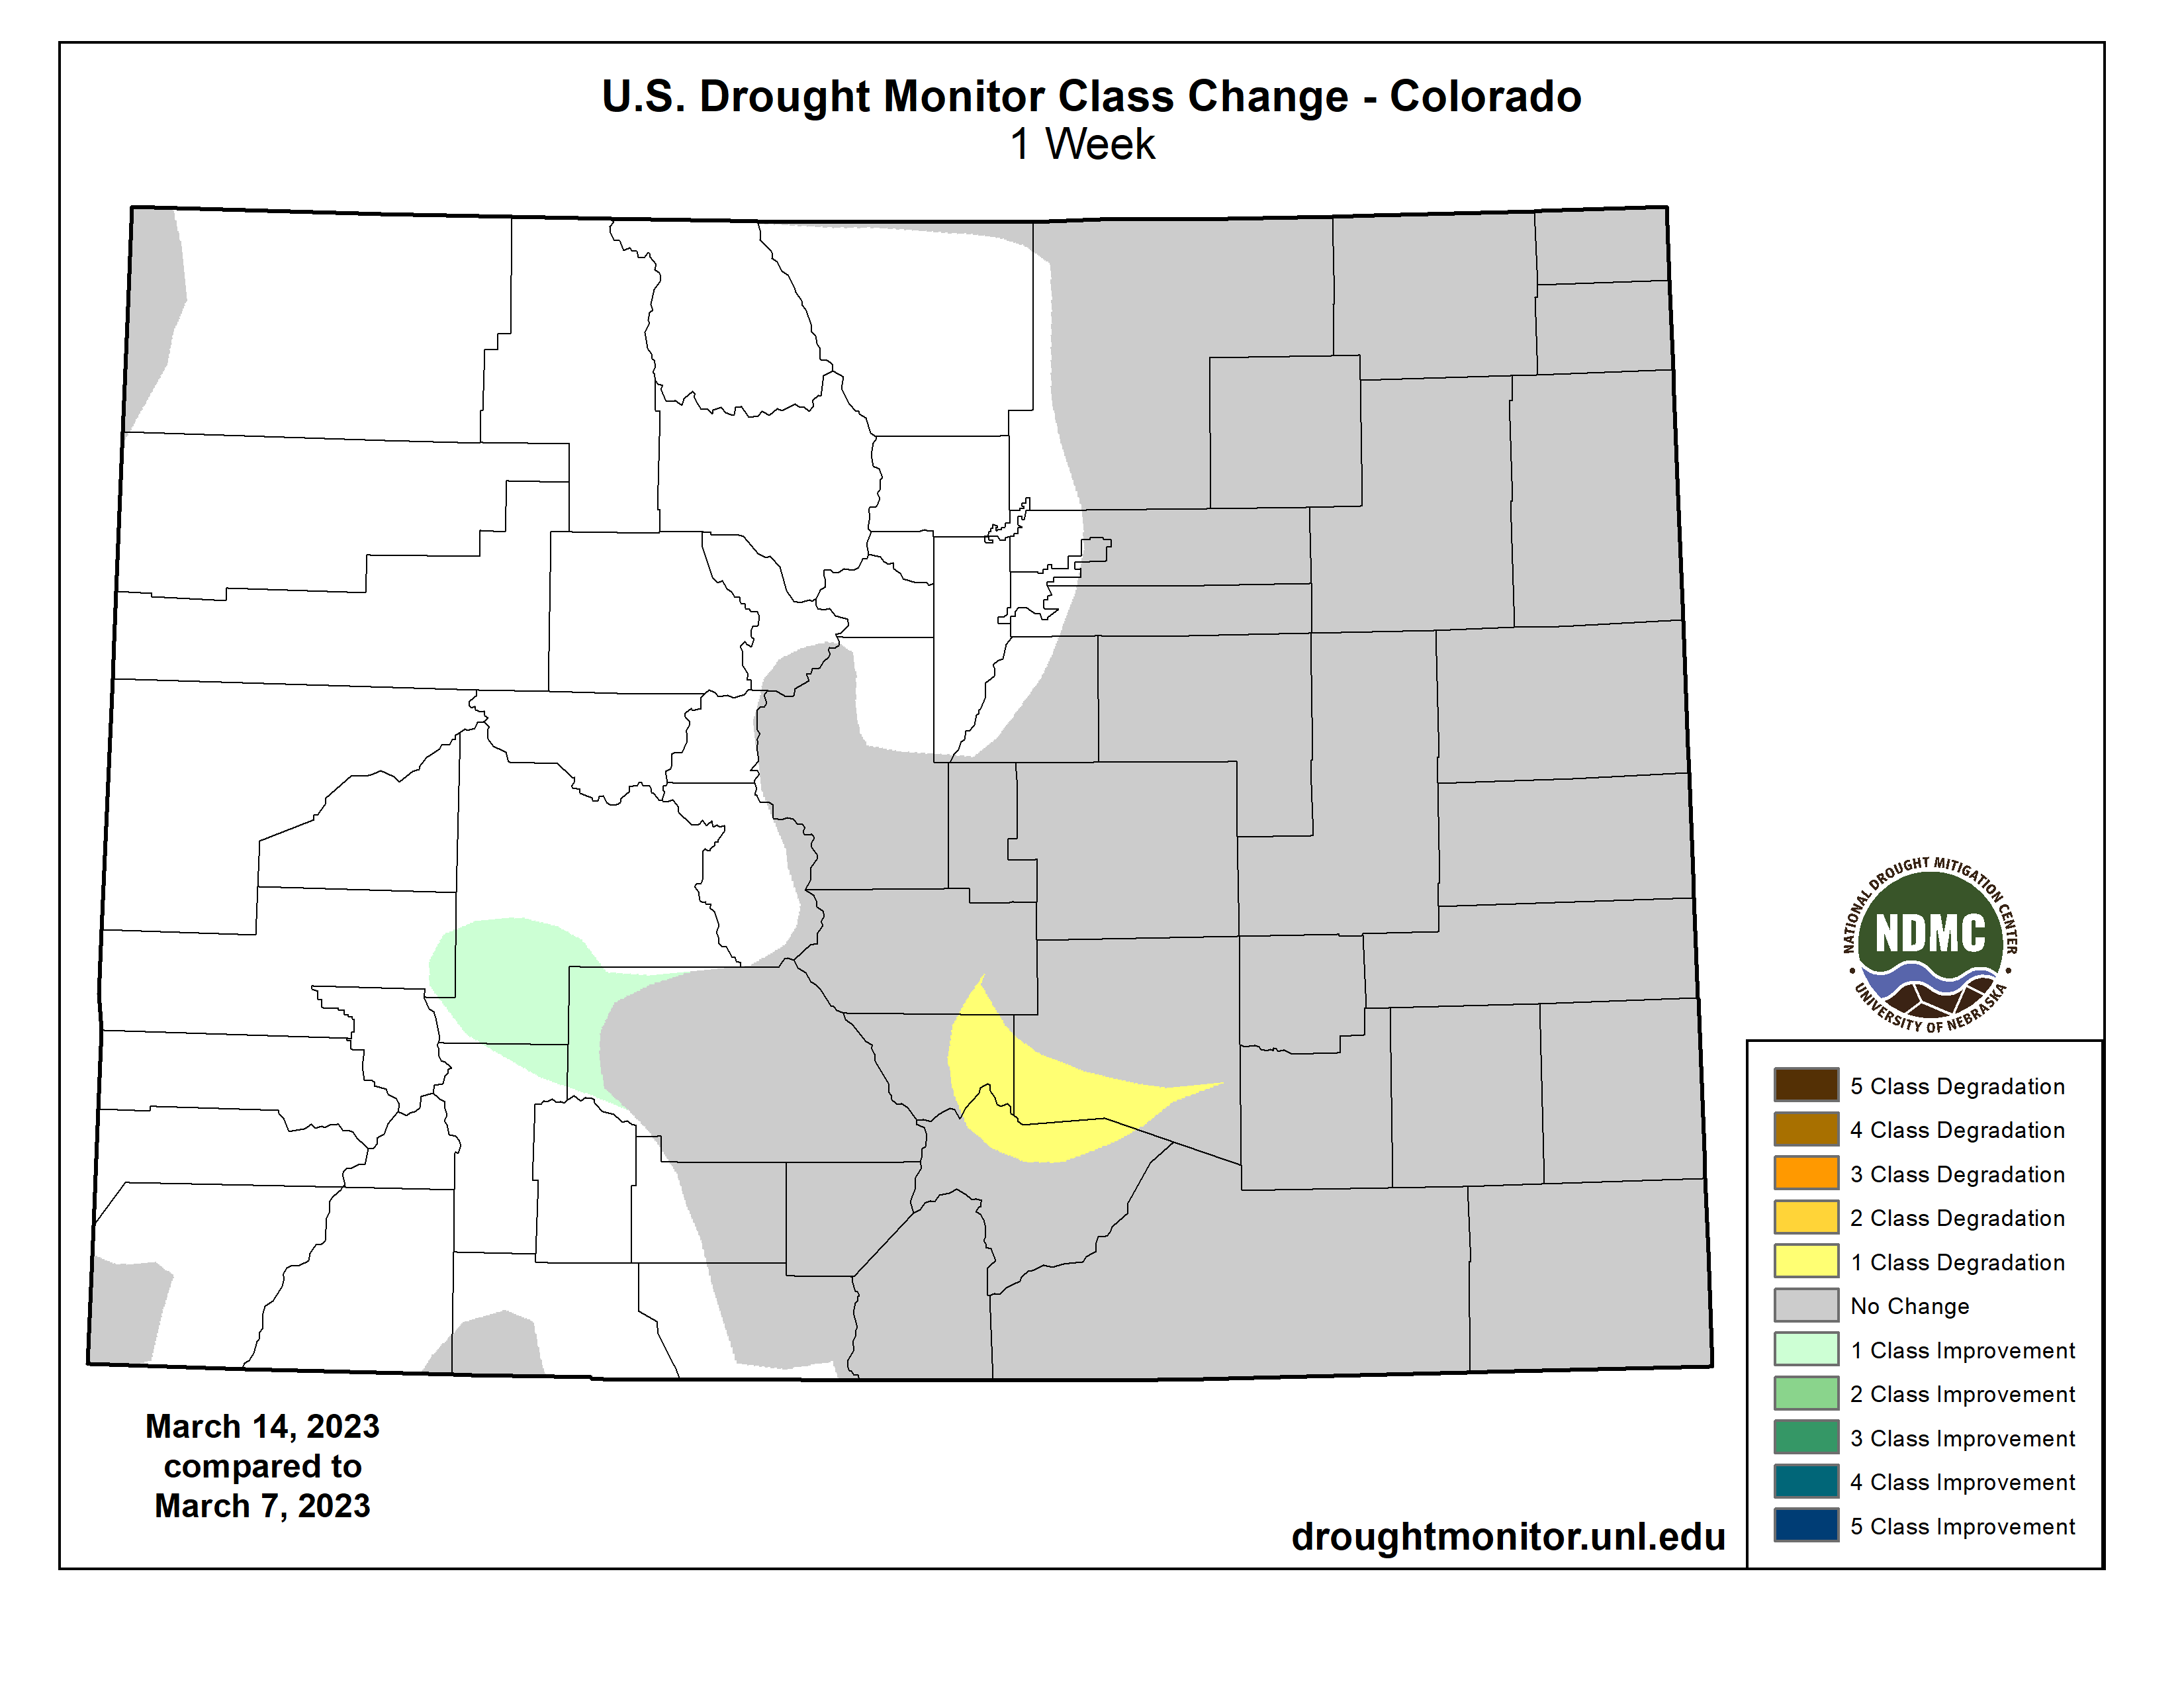
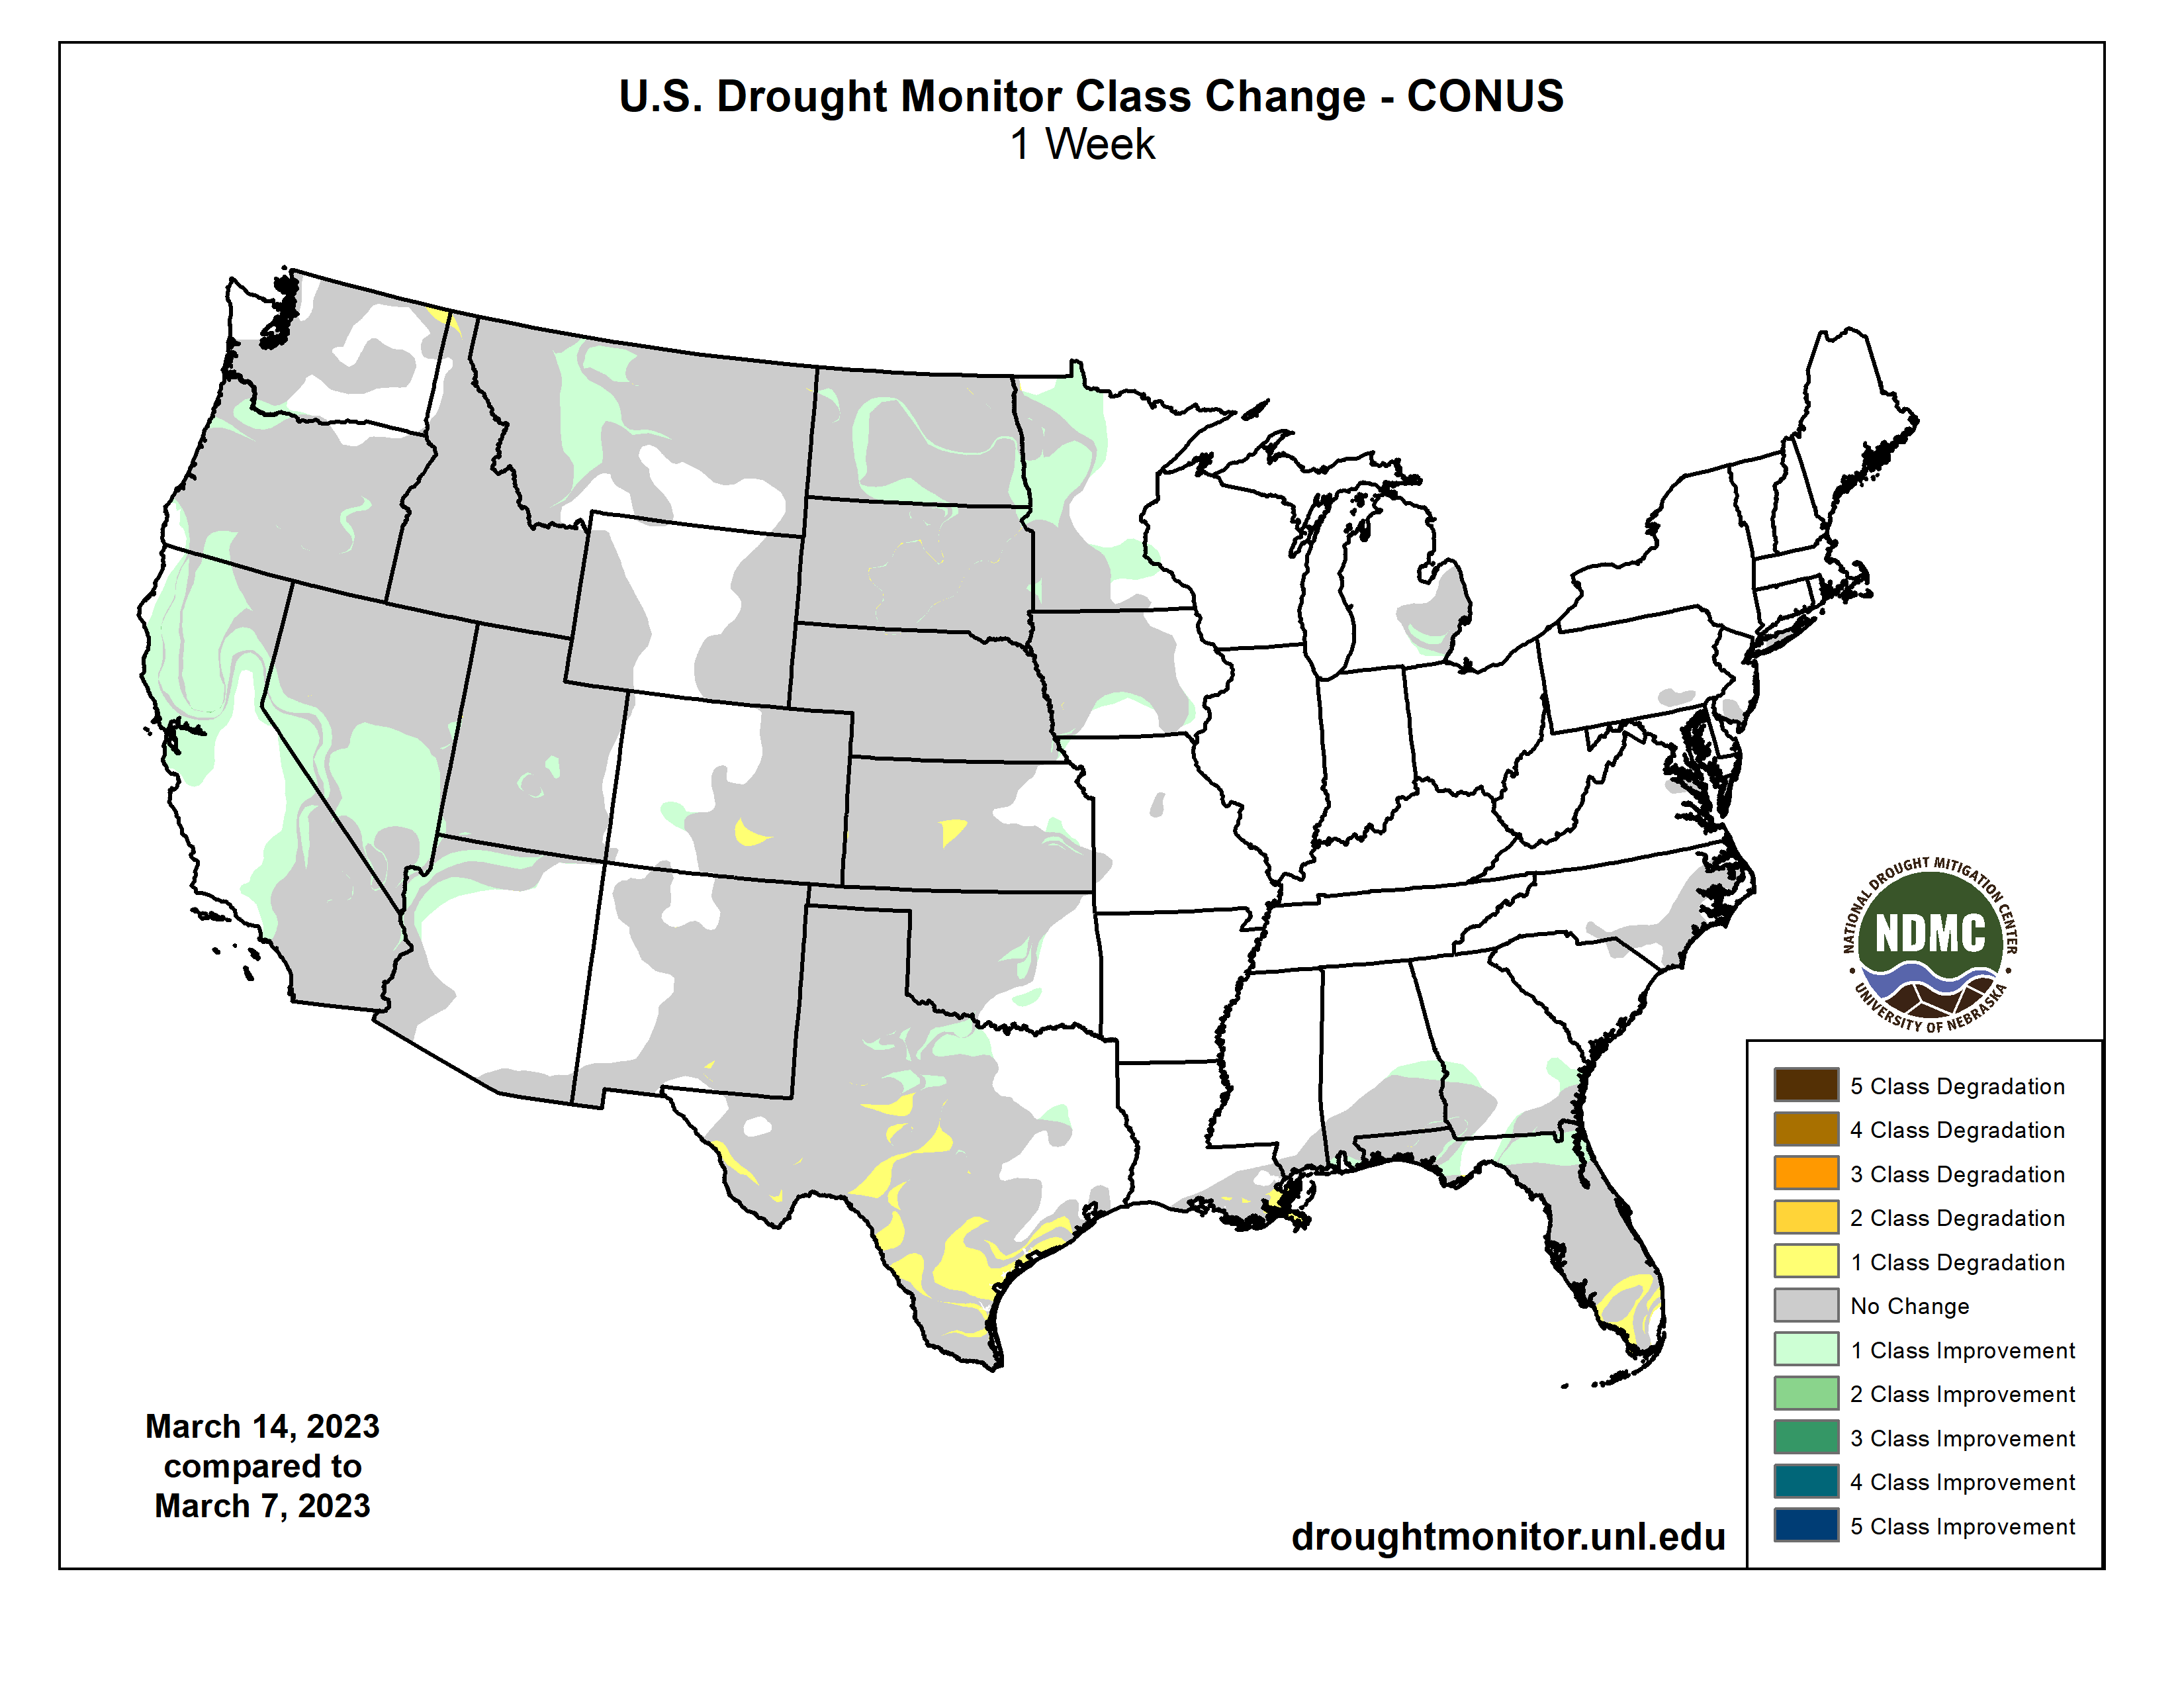

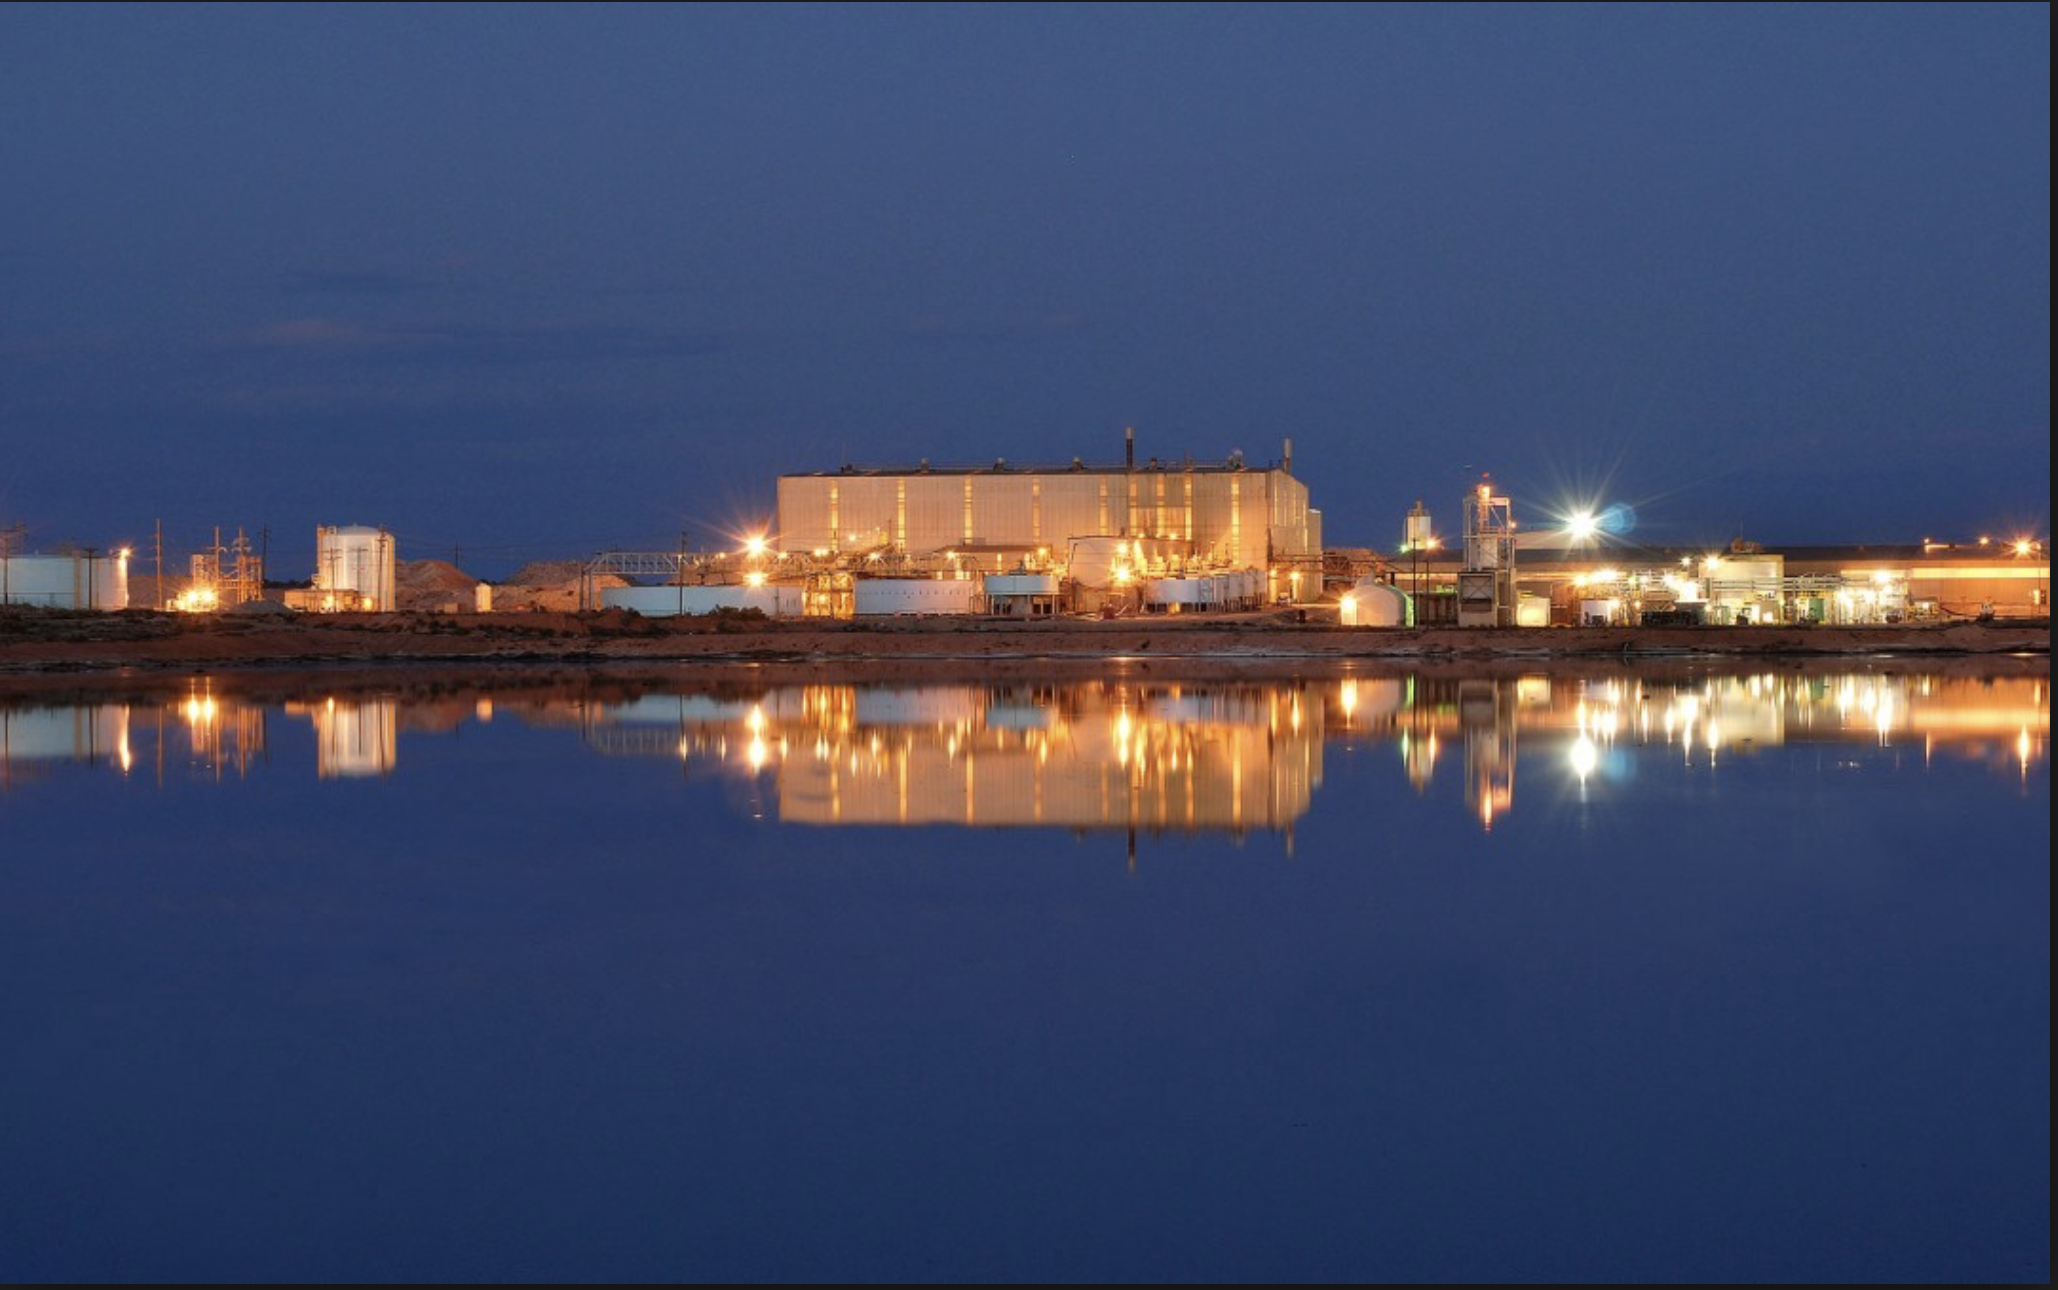
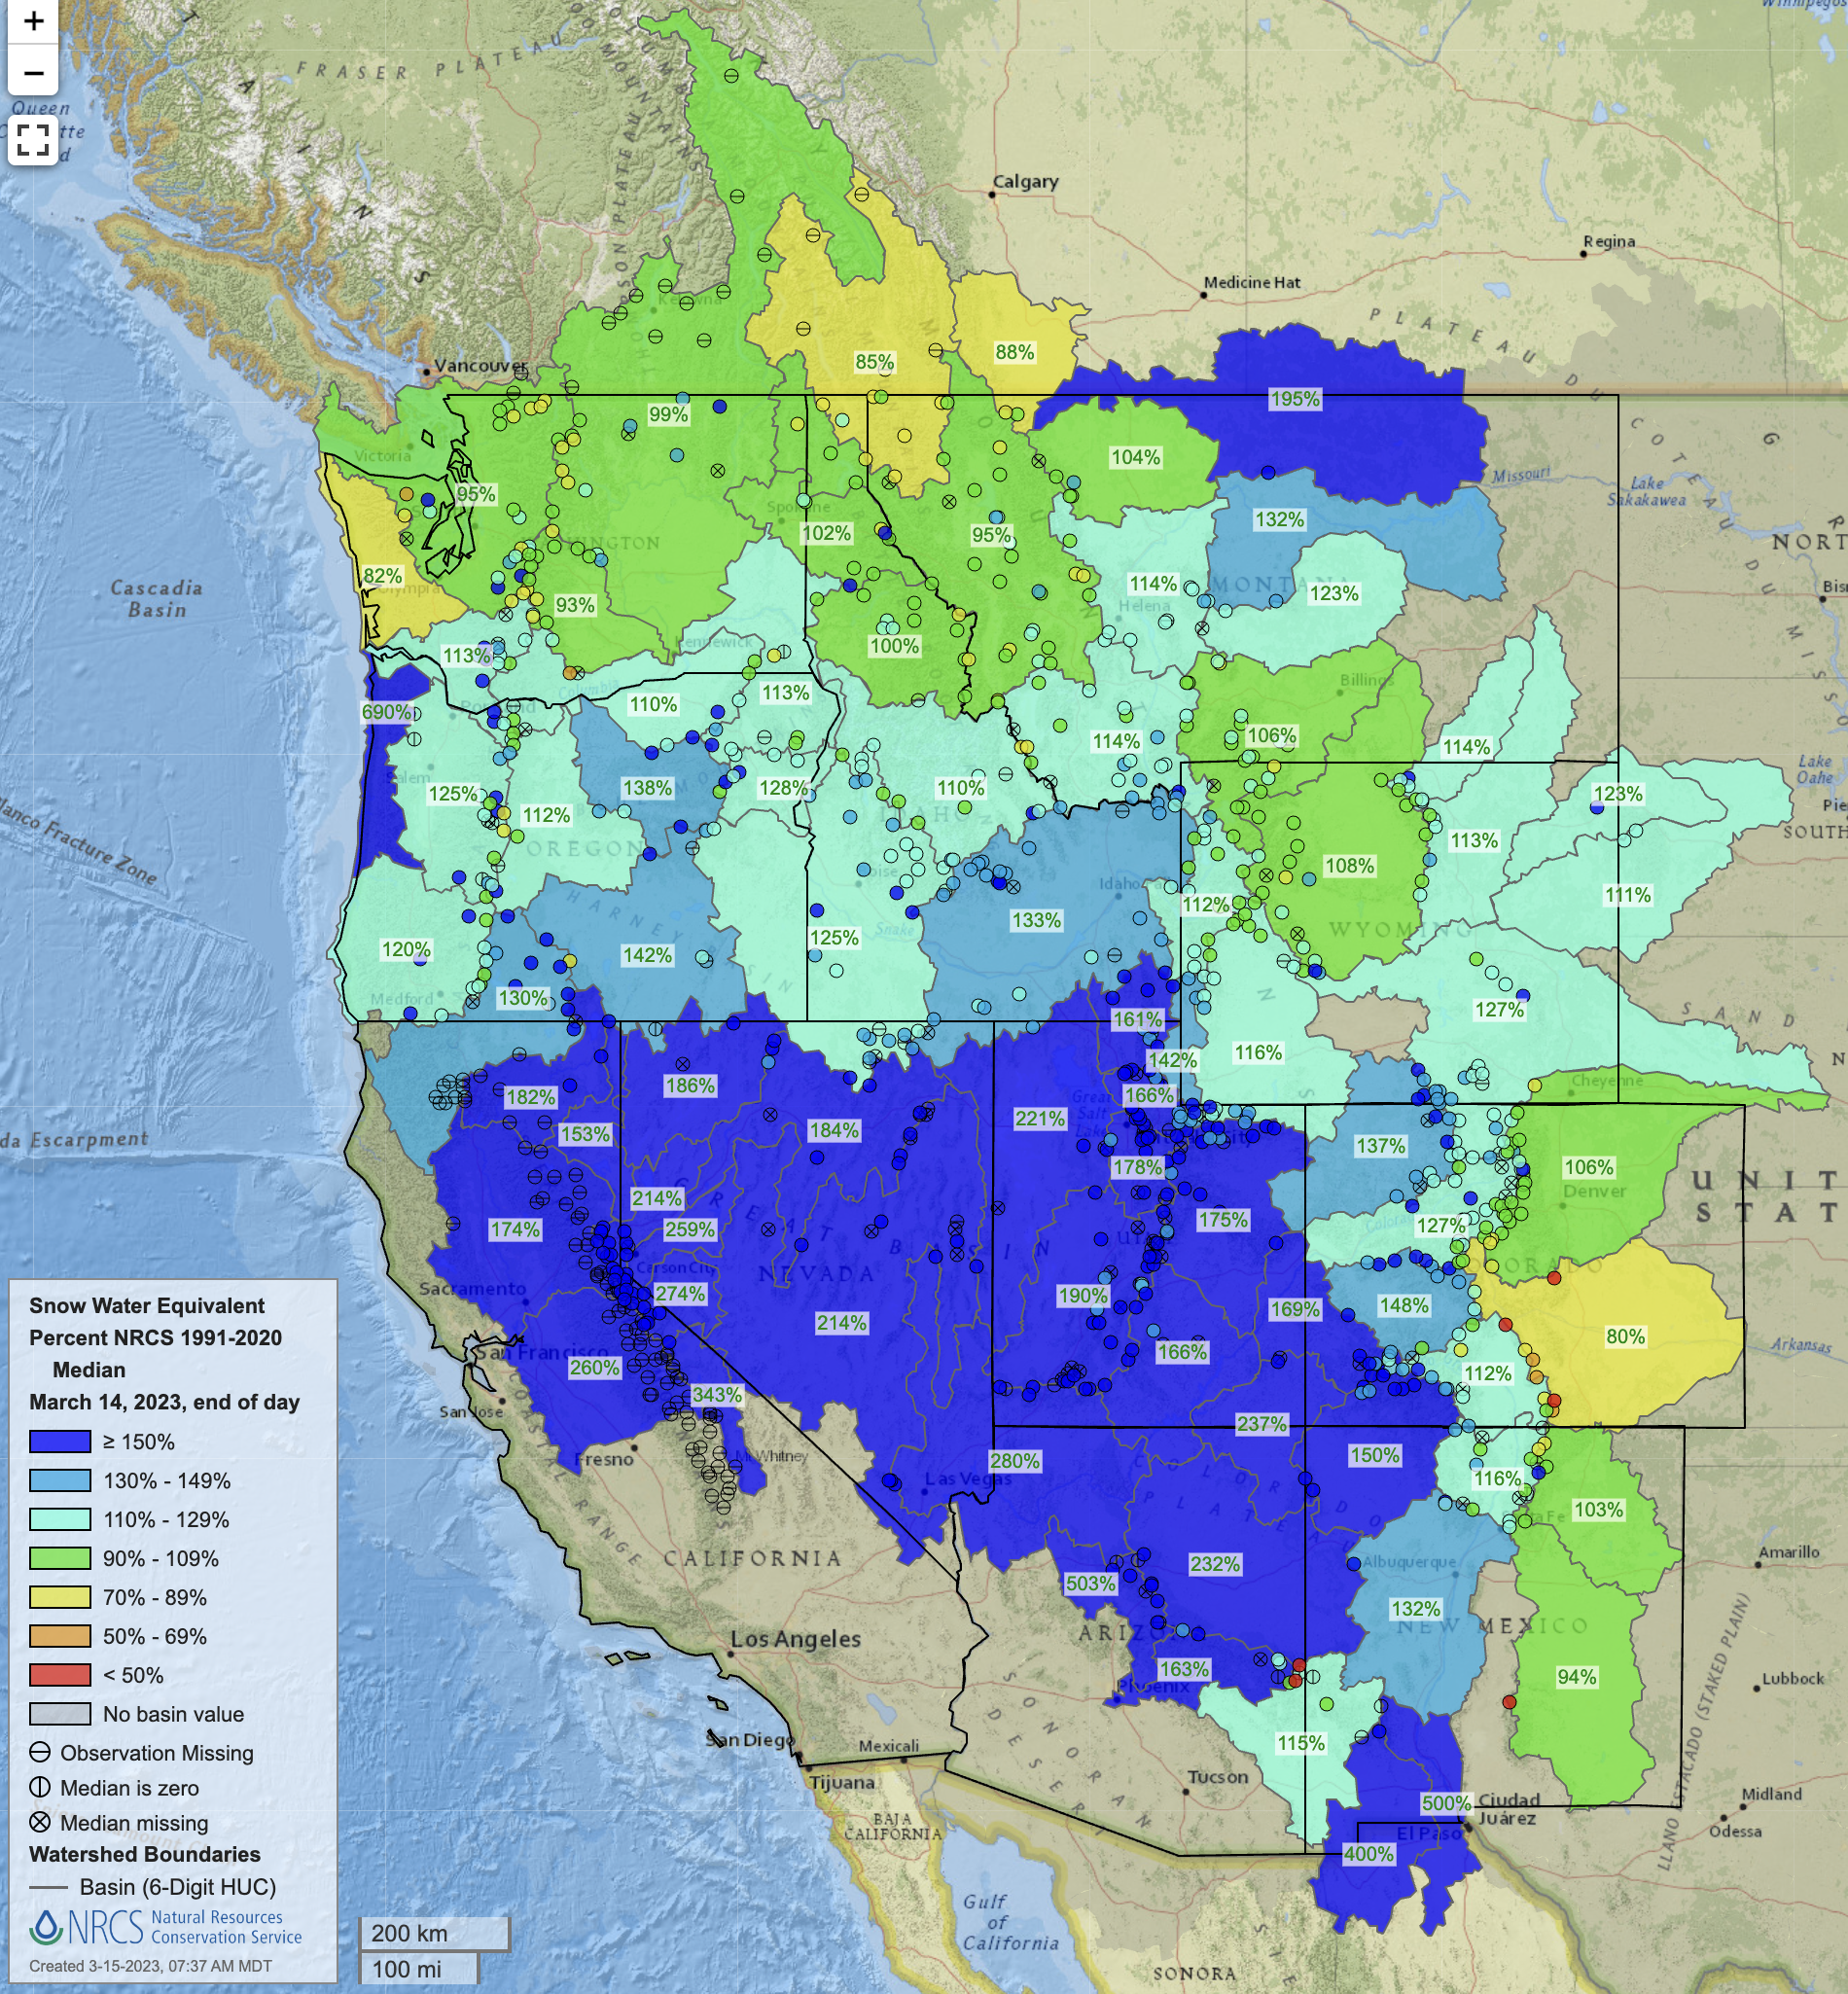
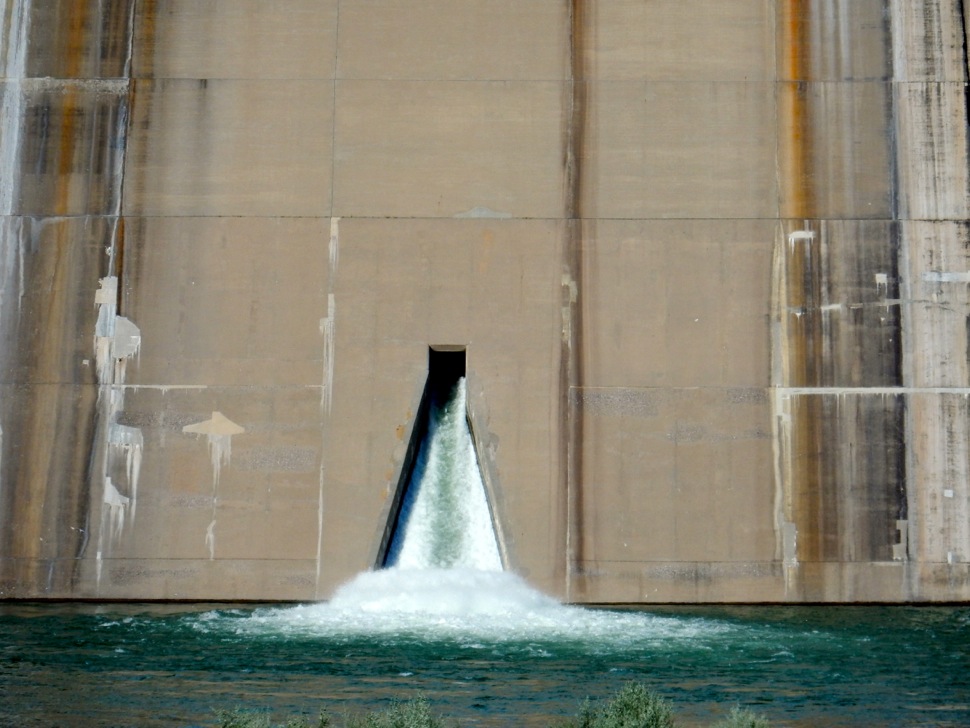

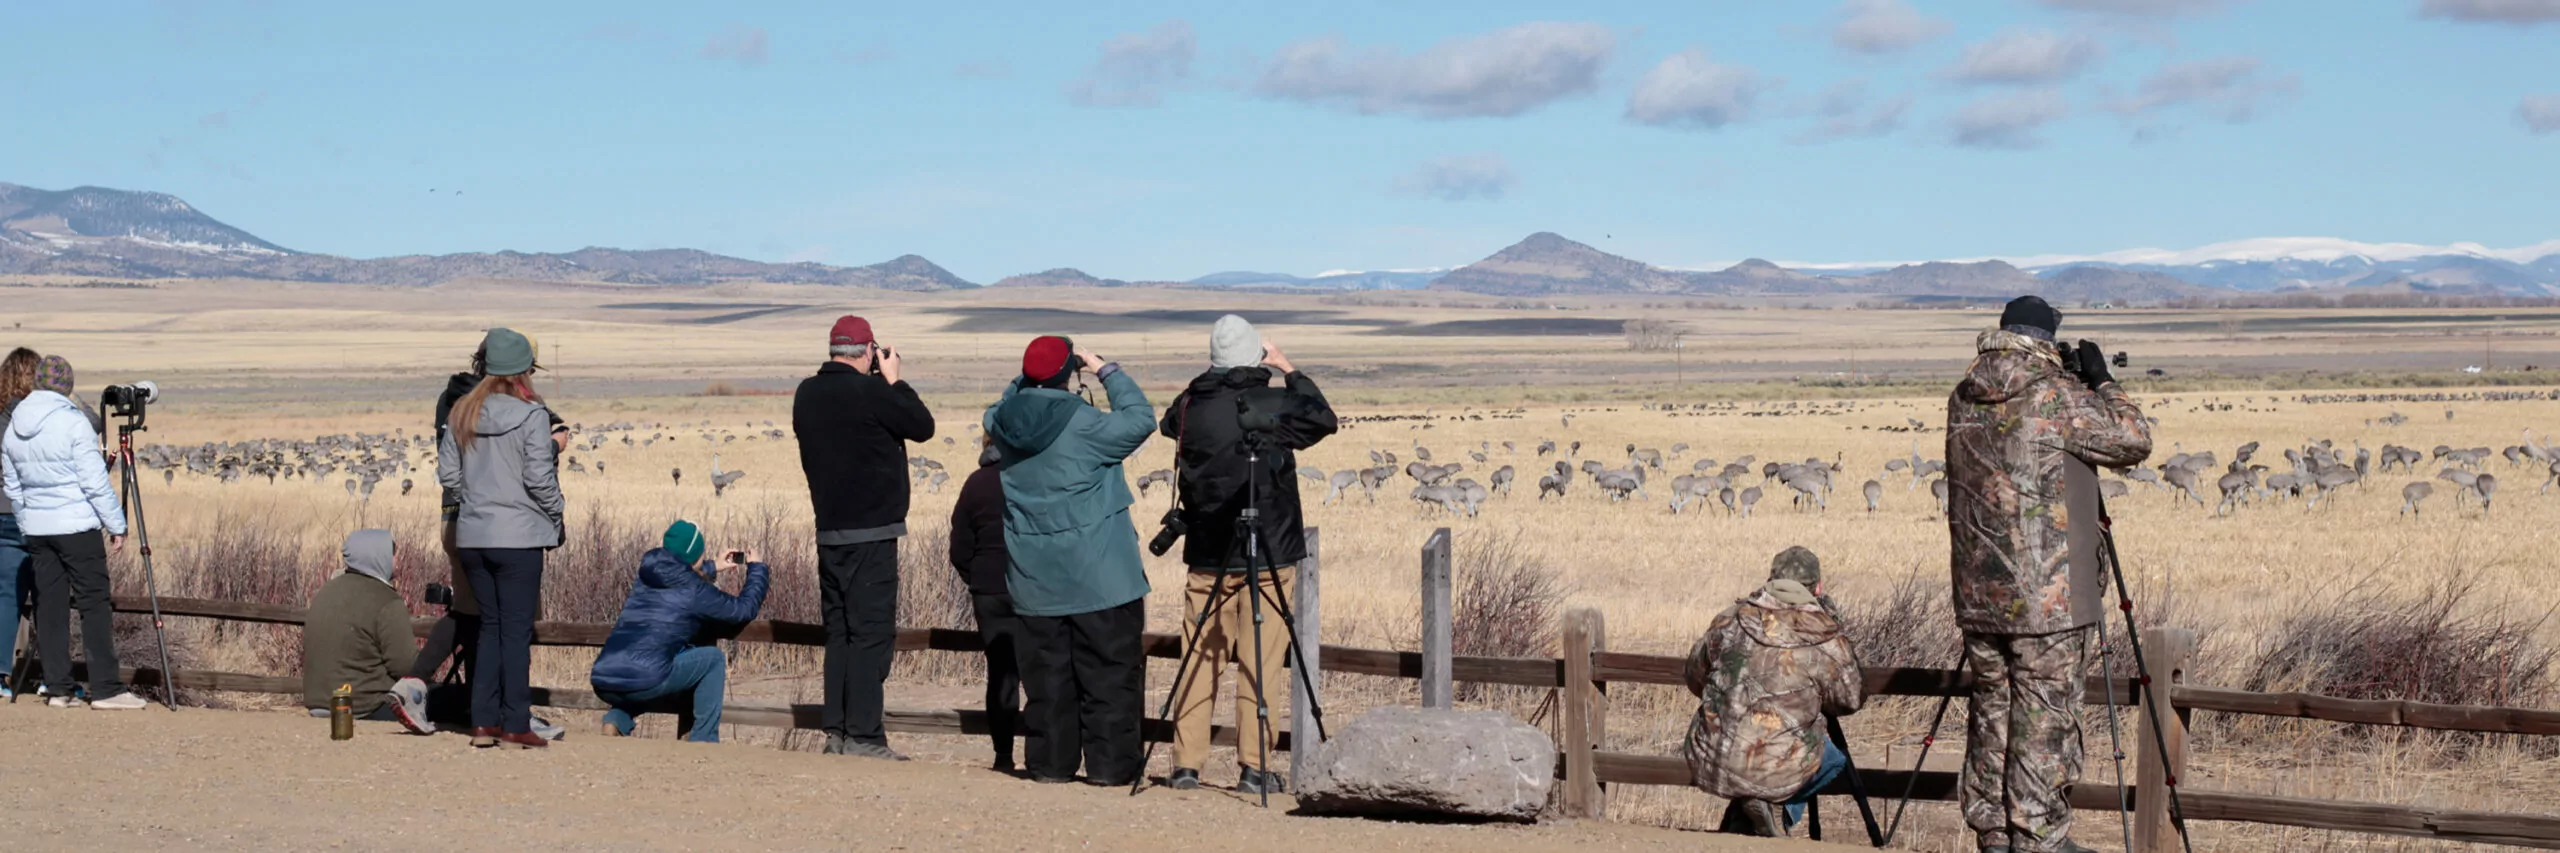
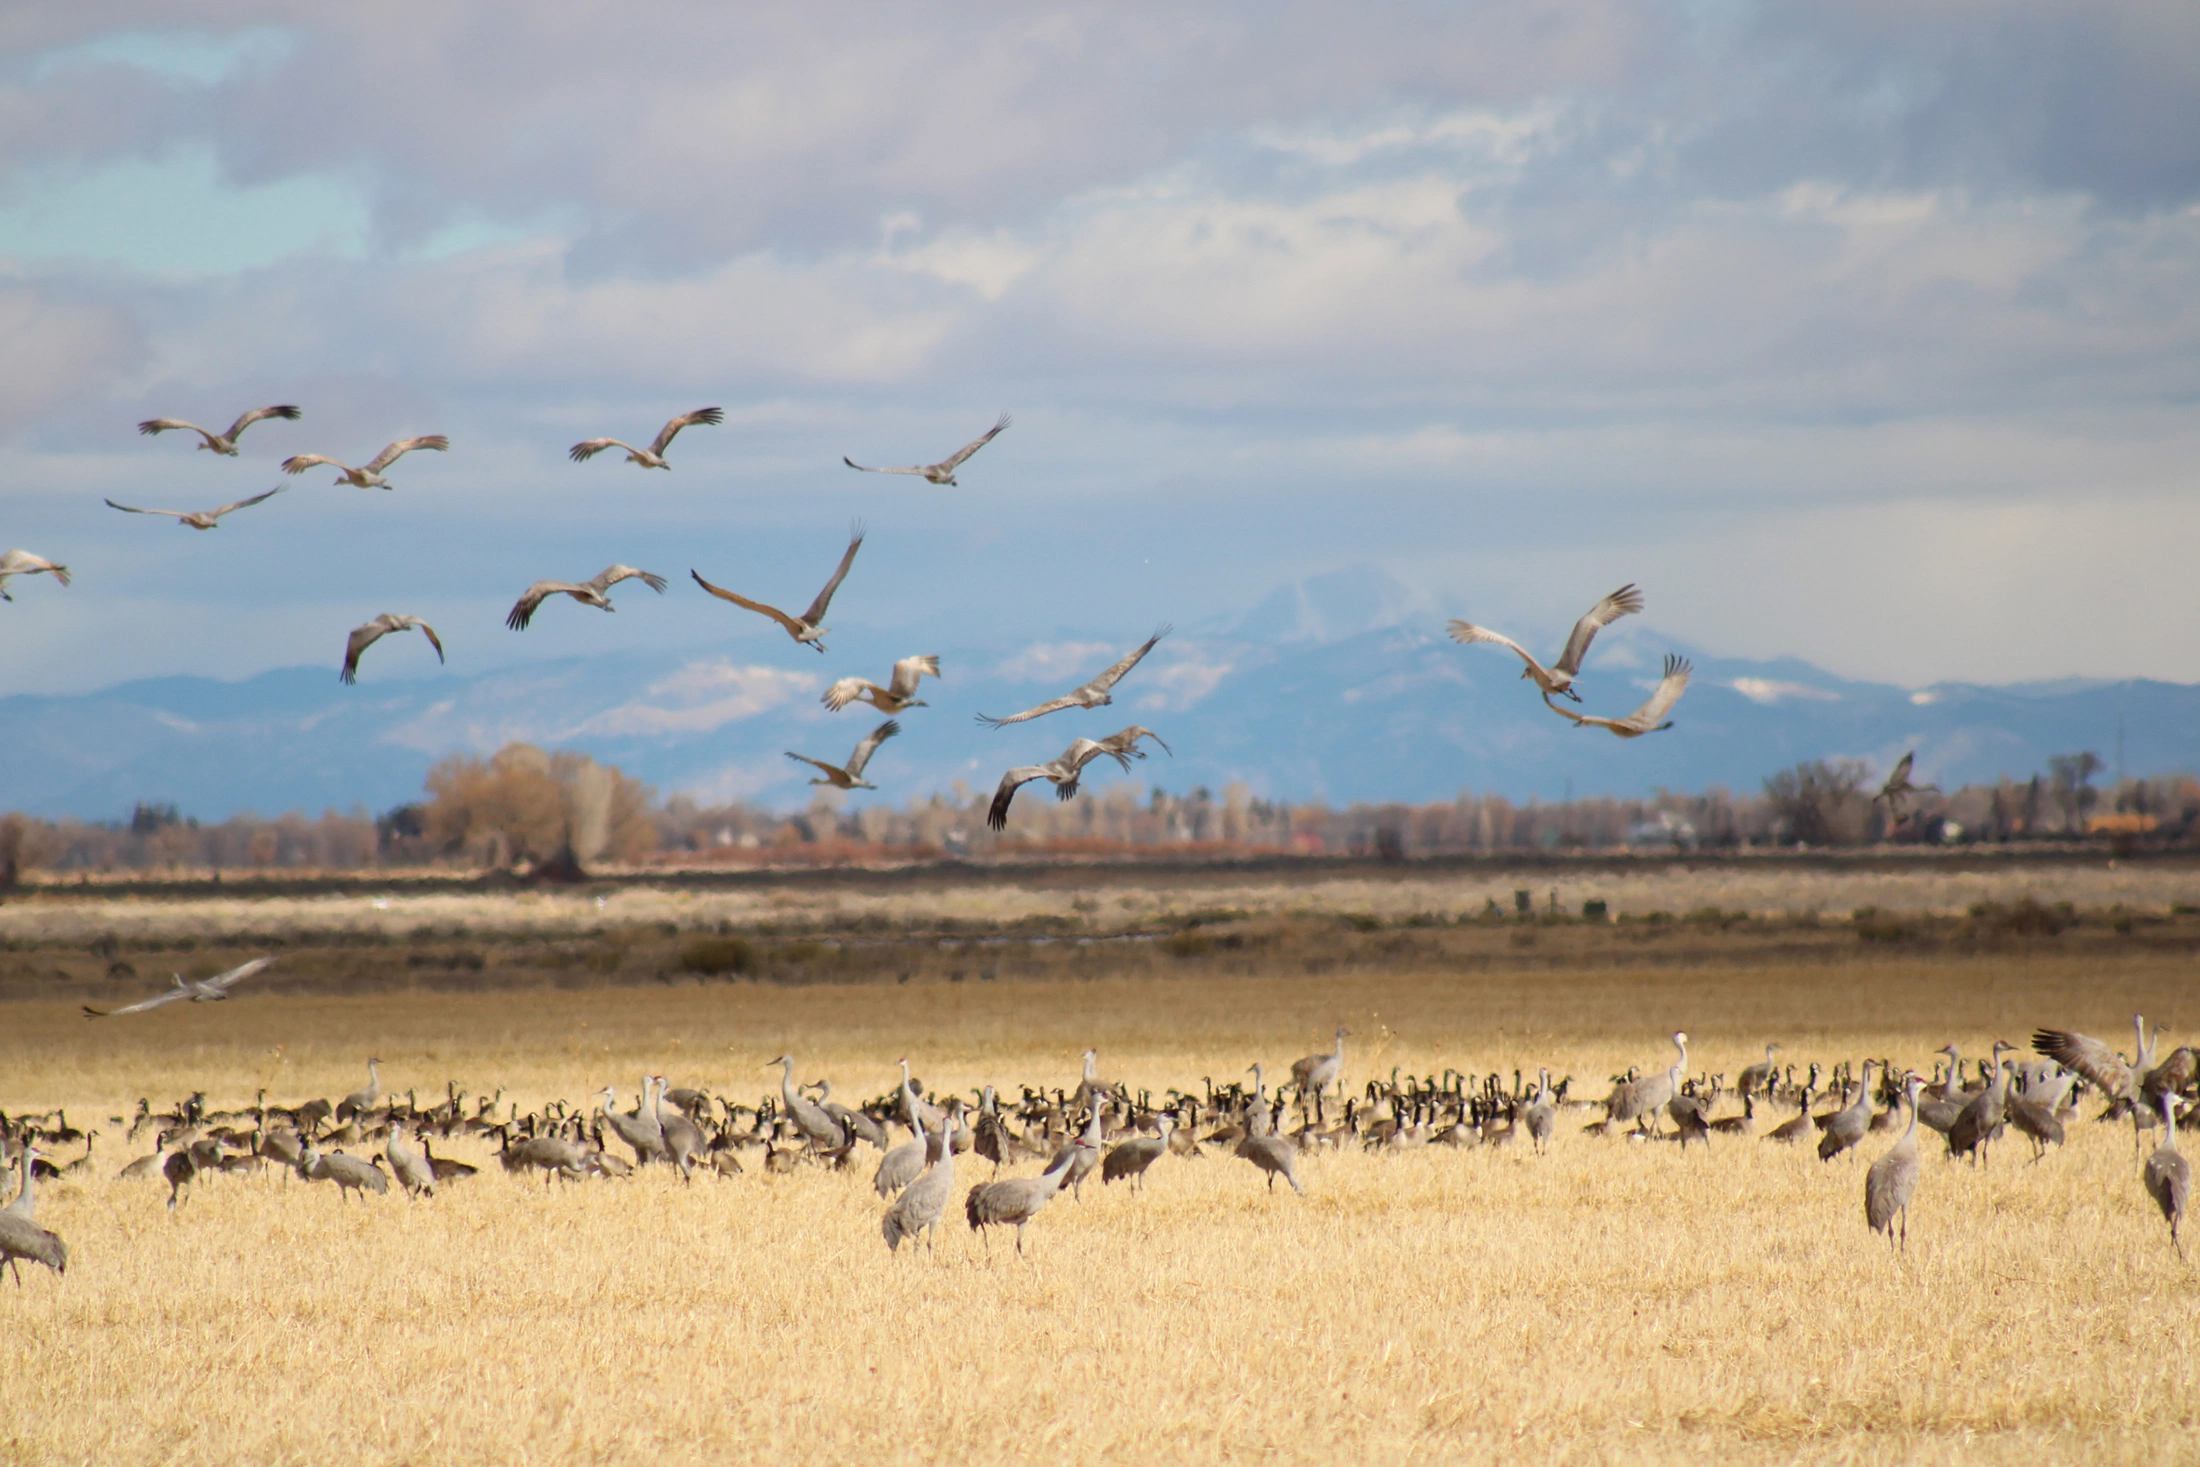


