The climate emergency poses an existential threat to our businesses, farms, and communities but there is no shortage of things we can be doing to address it. These include climate action opportunities in agriculture, land-use, electricity and power, and shifts in policy and priorities to drive these solutions. This report provides useful information on the climate crisis and its impacts on the Gunnison River Basin. It also provides examples of available actions for individuals, businesses, and governments.
Note: Local snowpack readings and chart are now using the percent of median instead of percent of average.
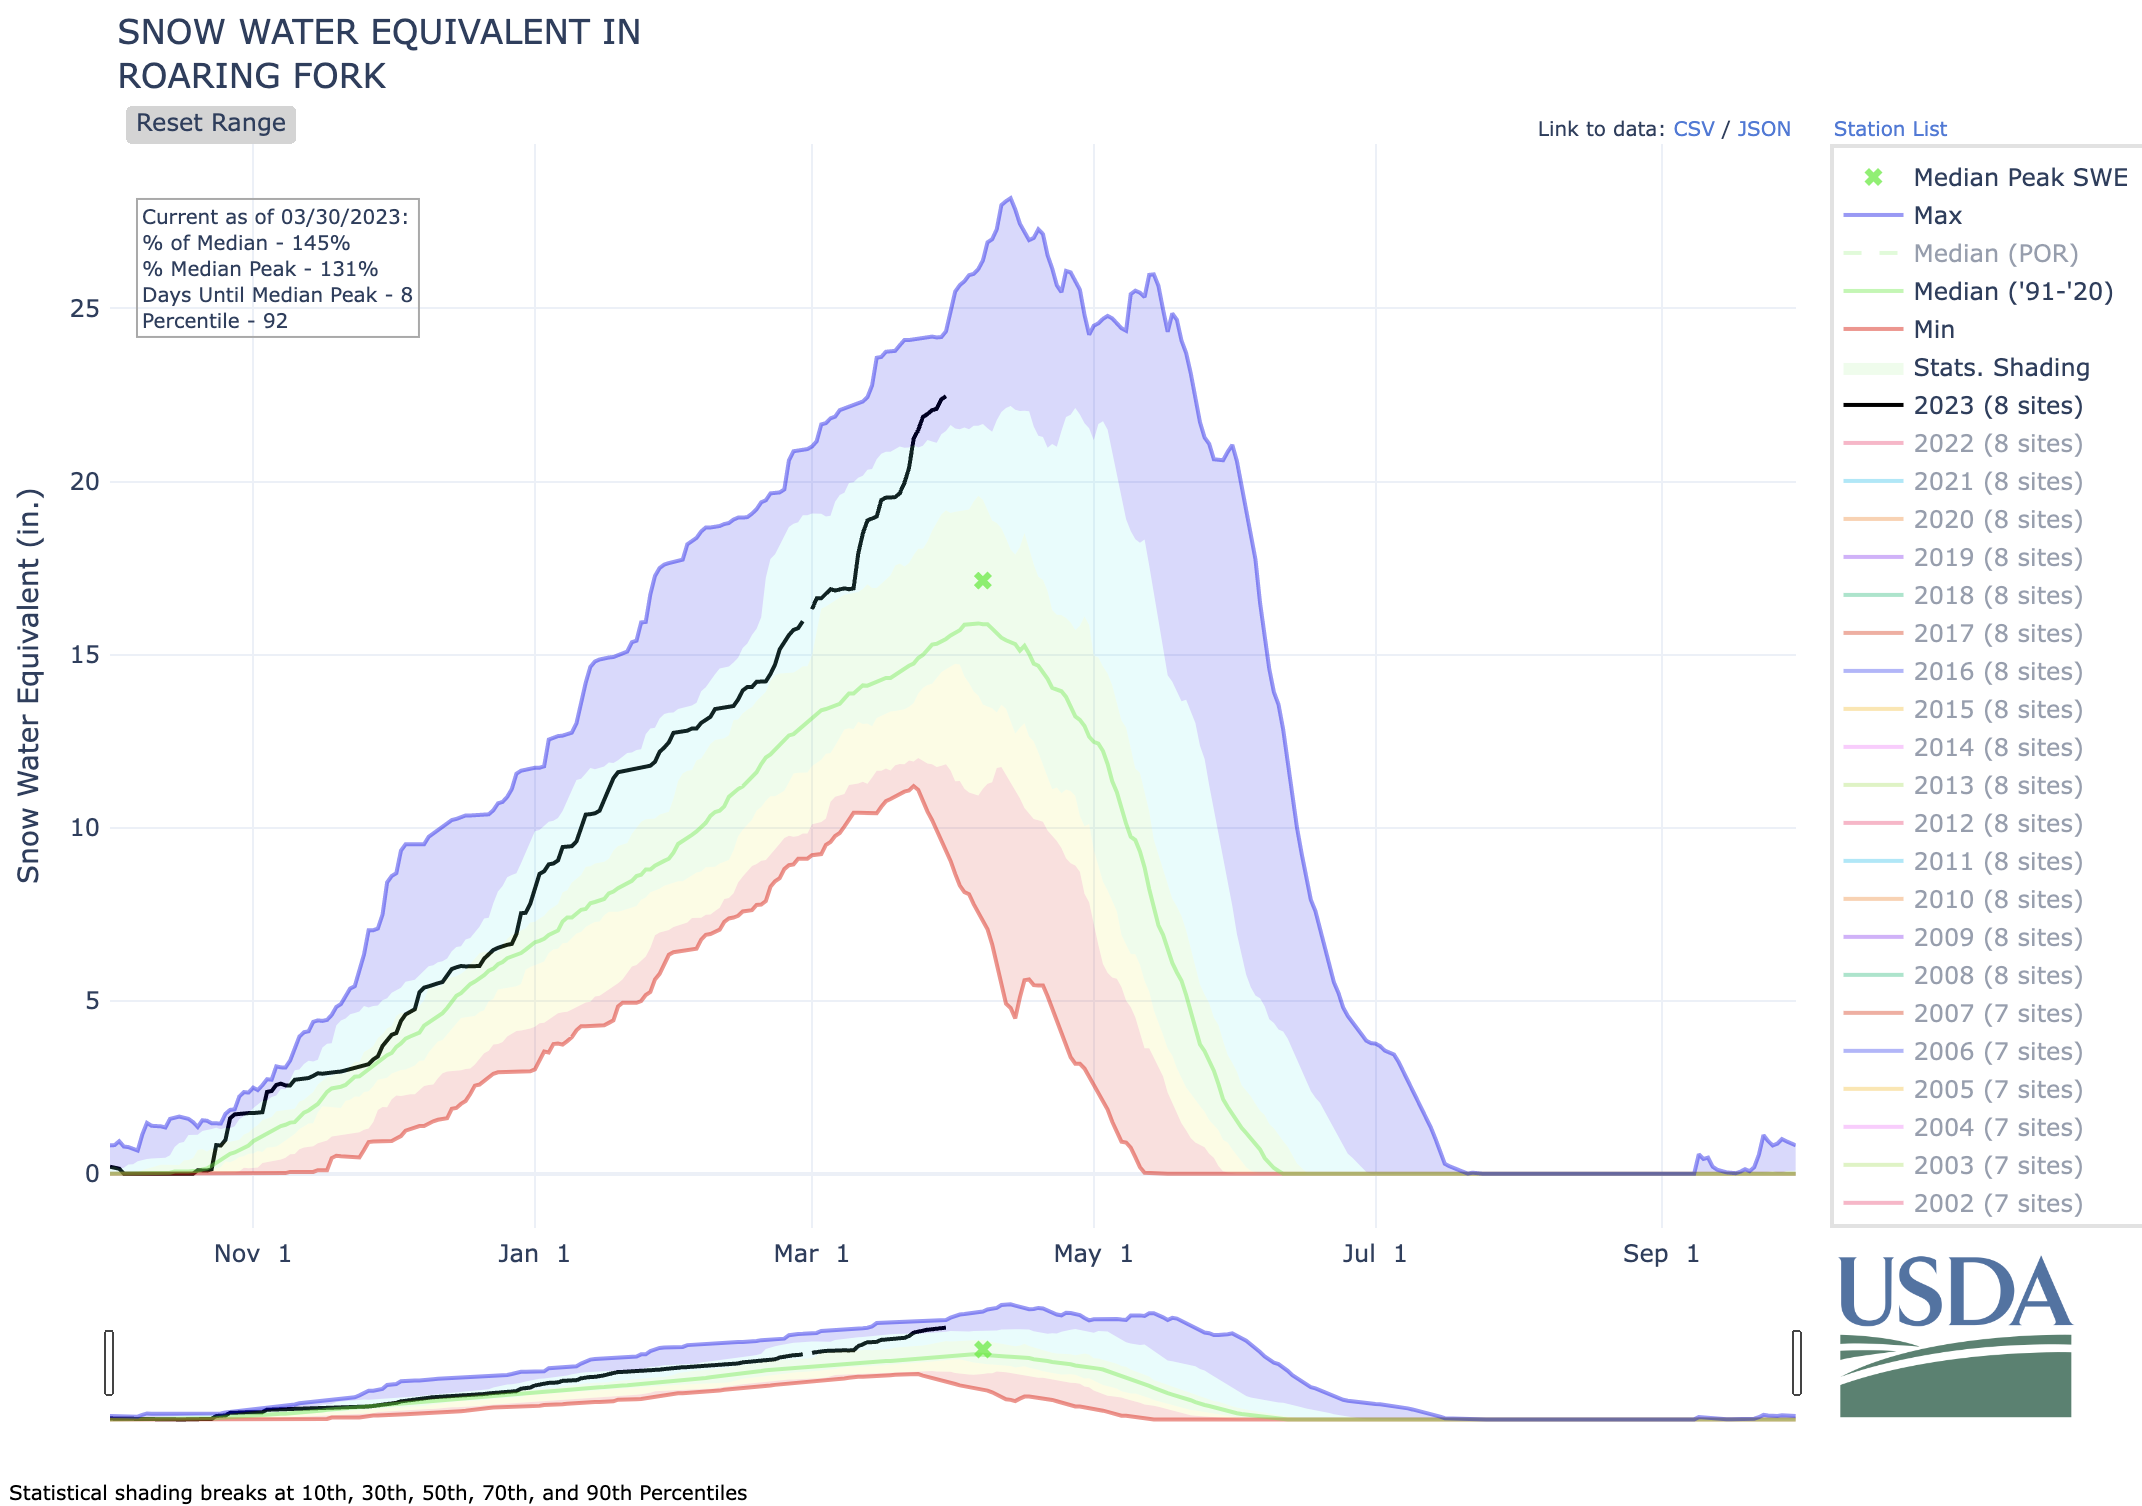
Snowpack in the Roaring Fork basin, which is exceeding the basin-wide median seasonal snow-water equivalent peak of 17.1 inches that typically occurs in mid-April, reached an average of 21.9 inches of snow-water equivalent per site on March 26 or 145% of median according to NRCS. Snowpack gained about three inches of SWE since last week on average per site after recent snow storms.
SNOTEL sites that monitor snowfall throughout the winter measured the snowpack at Independence Pass at 106.6% of median on March 26 with a “snow water equivalent” (SWE) of 16.2 inches, up from 15 inches on March 19. Last year on March 26, the SNOTEL station up the pass (located at elevation 10,600 feet) recorded an SWE of 13.2 inches.
The monitoring station at McClure Pass located at elevation 8,770 feet recorded a SWE of 27.5 inches on March 26, or 181% of median. That’s up from a SWE of 24.1 inches on March 19. Snowpack has gained three inches of SWE since March 21. Last year, on March 26, the station measured a snowpack holding 16.6 inches of water.
On the northeast side of the Roaring Fork Basin, snowpack at Ivanhoe, which sits at an elevation of 10,400 feet, reached 16.9 inches of SWE on March 26, or 125.2% of median.
Snowpack at Schofield Pass, which boasts some of the largest SWE accumulations in the basin, reached 46 inches on March 26, which represents 160.8% of median. Snowpack at this site gained six inches of SWE last week, the largest increase of SWE among these five Roaring Fork basin stations over the past week. Schofield Pass sits at an elevation of 10,700 feet between Marble and Crested Butte.
Snowpack at that site has been exceeding its median seasonal peak of 35.1 inches since March 11, which typically doesn’t come until mid April. McClure Pass, which as we reported earlier in March is seeing especially high snowpack readings this winter like other mid elevations stations, topped its median seasonal peak of 16.6 inches on Feb. 14 this year.
Snow water equivalent — the metric used to track snowpack — is the amount of water contained within the snowpack, which will become our future water supply running in local rivers and streams.
Ruedi Reservoir on the Fryingpan River as seen on March 24, 2022 The reservoir was at its lowest level in nearly two decades. Reclamation is confident it will fill in 2023. CREDIT: HEATHER SACKETT/ASPEN JOURNALISM
Click the link to read the article on the Aspen Daily News website (Scott Condon). Here’s an excerpt:
Hydrologist Tim Miller said the current snowpack levels make him confident Ruedi Reservoir can be filled in the first week of July without releasing extraordinary amounts of water…The Colorado Basin River Forecast Center is forecasting runoff into Ruedi at 104% of median. In 2019, when the region was hit with an ongoing storm cycle in March that triggered numerous destructive avalanches, the forecasted runoff volume was 144% of median, he noted.
The Fryingpan Valley snowpack is currently ranging between 120% to 159% of median at three automated stations called Snotel sites operated by the U.S. Natural Resources Conservation Service. Miller said the sites provide a good gauge of snowpack at lower and middle elevation ranges. He checks the Independence Pass Snotel site east of Aspen as well. Although it is out of the Fryingpan River basin, its close proximity provides a good clue about upper elevation snowpack. The cumulative snowpack at Kiln, Ivanhoe and Independence sites is 126% of median, he said. There isn’t a one-to-one relationship between snowpack levels and runoff forecasts, according to Miller. Runoff projections consider factors such as soil moisture levels, which were low coming into this winter because of drought. Drier soils capture some of the water before it reaches rivers and streams…
“We should be able to fill that without a problem,” Miller said. “It generally fills the first week of July, almost always.”
Joe Charbonnet is an environmental engineer at Iowa State University who develops techniques to remove contaminants like PFAS from water. He explains what the proposed guidelines would require, how water utilities could meet these requirements and how much it might cost to get these so-called forever chemicals out of U.S. drinking water.
1. What do the new guidelines say?
PFAS are associated with a variety of health issues and have been a focus of environmental and public health researchers. There are thousands of members of this class of chemicals, and this proposed regulation would set the allowable limits in drinking water for six of them.
Two of the six chemicals – PFOA and PFOS – are no longer produced in large quantities, but they remain common in the environment because they were so widely used and break down extremely slowly. The new guidelines would allow for no more than four parts per trillion of PFOA or PFOS in drinking water.
Four other PFAS – GenX, PFBS, PFNA and PFHxS – would be regulated as well, although with higher limits. These chemicals are common replacements for PFOA and PFOS and are their close chemical cousins. Because of their similarity, they cause harm to human and environmental health in much the same way as legacy PFAS.
A few states have already established their own limits on levels of PFAS in drinking water, but these new guidelines, if enacted, would be the first legally enforceable federal limits and would affect the entire U.S.
Chemicals used to create water-repellent fabrics and nonstick pans often contain PFAS and leak those chemicals into the environment. Brocken Inaglory/Wikimedia Commons, CC BY-SA
2. How many utilities will need to make changes?
PFAS are harmful even at extremely low levels, and the proposed limits reflect that fact. The allowable concentrations would be comparable to a few grains of salt in an Olympic-size swimming pool. Hundreds of utilities all across the U.S. have levels of PFAS above the proposed limits in their water supplies and would need to make changes to meet these standards.
While many areas have been tested for PFAS in the past, many systems have not, so health officials don’t know precisely how many water systems would be affected. A recent study used existing data to estimate that about 40% of municipal drinking water supplies may exceed the proposed concentration limits.
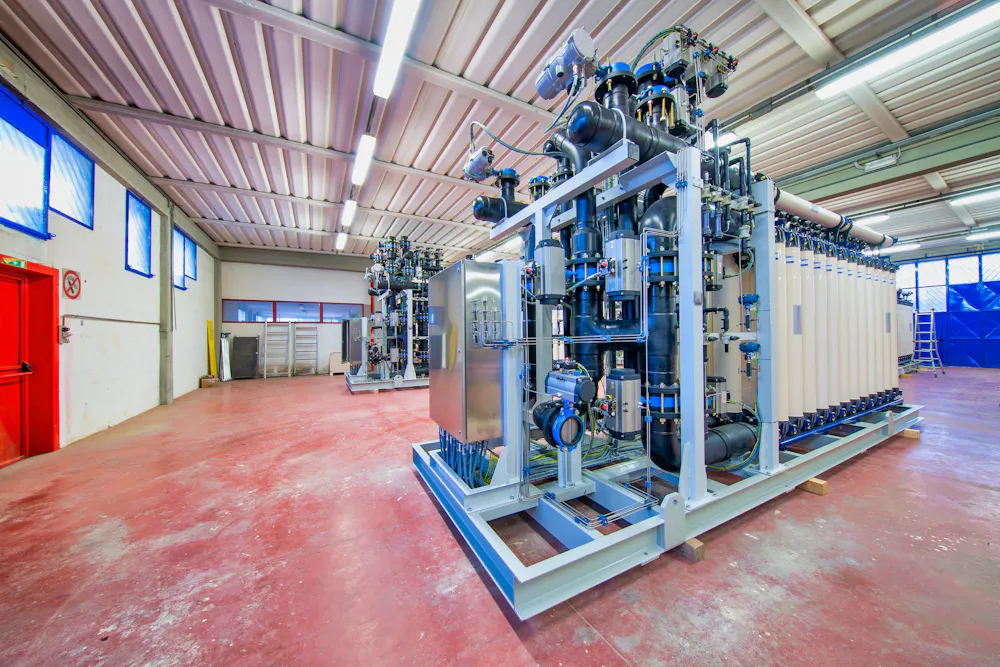
Activated carbon is a charcoal-like substance that PFAS stick to quite well and can be used to remove PFAS from water. In 2006, the town of Oakdale, Minnesota, added an activated carbon treatment step to its water system. Not only did this additional water treatment bring PFAS levels down substantially, there were significant improvements in birth weight and the number of full-term pregnancies in that community after the change.
Ion exchange systems work by flowing water over charged particles that can remove PFAS. Ion exchange systems are typically even better at lowering PFAS concentrations than activated carbon systems, but they are also more expensive.
Another option available to some cities is simply finding alternative water sources that are less contaminated. While this is a wonderful, low-cost means of lowering contamination, it points to a major disparity in environmental justice; more rural and less well-resourced utilities are unlikely to have this option.
4. Is such a major transition feasible?
By law, the EPA must consider not just human health but also the feasibility of treatment and the potential financial cost when setting maximum contaminant levels in drinking water. While the proposed limits are certainly attainable for many water utilities, the costs will be high.
The federal government has made available billions of dollars in funding for treating water. But some estimates put the total cost of meeting the proposed regulations for the entire country at around US$400 billion – much more than the available funding. Some municipalities may seek financial help for treatment from nearby polluters, while others may raise water rates to cover the costs.
5. What happens next?
The EPA has set a 60-day period for public comment on the proposed regulations, after which it can finalize the guidelines. But many experts expect the EPA to face a number of legal challenges. Time will tell what the final version of the regulations may look like.
This regulation is intended to keep the U.S. in the enviable position of having some of the highest-quality drinking water in the world. As researchers and health officials learn more about new chemical threats, it is important to ensure that every resident has access to clean and affordable tap water.
While these six PFAS certainly pose threats to health that merit regulation, there are thousands of PFAS that likely have very similar impacts on human health. Rather than playing chemical whack-a-mole by regulating one PFAS at a time, there is a growing consensus among researchers and public health officials that PFAS should be regulated as a class of chemicals.
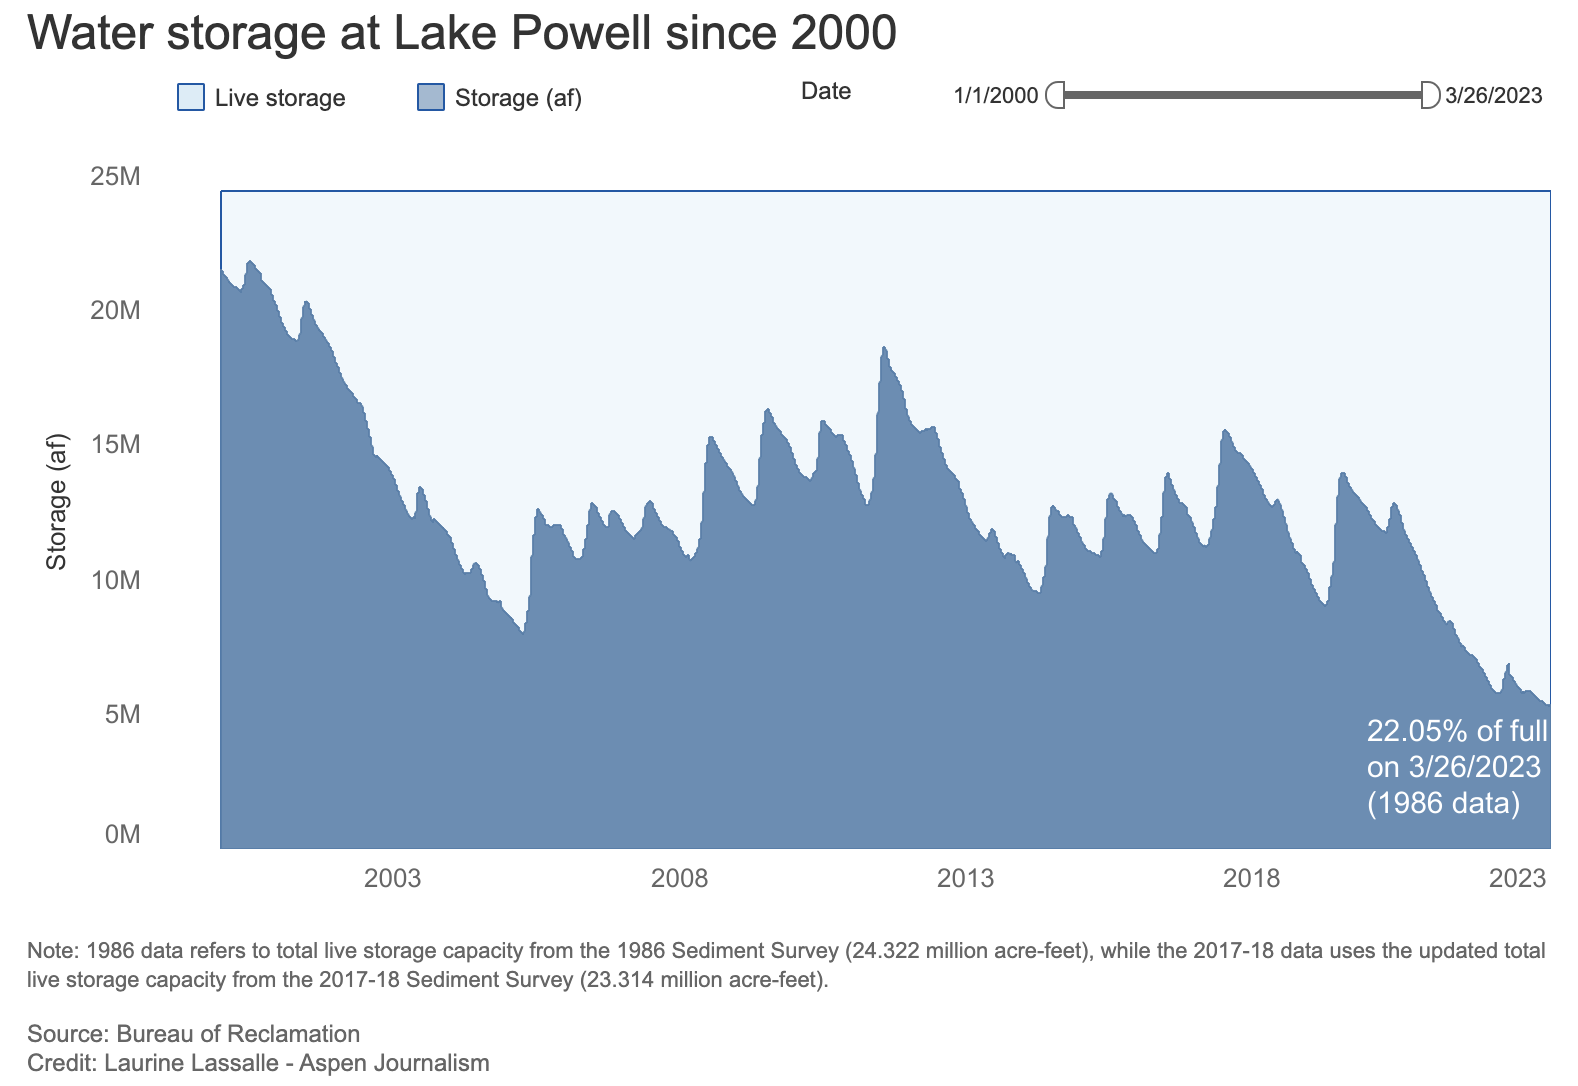
Lake Powell‘s storage dropped to its lowest level recorded since it began filling in the 1960s as of our last post, but water levels at the reservoir began their seasonal rise in mid-March as rising temperatures boosted snowmelt. On March 26, the reservoir was 22.05% full (with a total capacity based on a 1986 sedimentation survey) or 23.01% full (based on updated 2017-18 sedimentation data). That’s up from March 19, when the nation’s second-largest reservoir was at 21.86% of capacity (1986 data) or 22.8% (based on 2017-18 data).
On July 1, the Bureau of Reclamation revised its data on the amount of water stored in Lake Powell, with a new, lower tally taking into account a 4% drop in the reservoir’s total available capacity between 1986 and 2018 due to sedimentation. Aspen Journalism in July published a story explaining the that drop in storage due to sedimentation.
The reservoir’s capacity has fallen since last year, when on March 26, 2022, it was 24.02% full (based on 1986 data).


