Did #LaNiña drench the Southwest United States in early winter 2022/23? — NOAA

Click the link to read the article on the NOAA website (Nat Johnson):

Another meteorological winter is drawing to a close, though it feels like some of us in the East are still waiting for winter to arrive (not a single inch of snow here in central New Jersey so far!). I realize that this winter has been more eventful in other parts of the country, notably in the western U.S., where torrential rains and heavy mountain snows occurred in December and January. Such heavy precipitation was unexpected prior to the season in a region afflicted with a multi-year severe drought, especially given that we are in the third consecutive winter of La Niña. How unusual were these Southwestern wet conditions in the first two-thirds of a La Niña winter? And did tropical sea surface temperatures contribute? In this blog post, I hope to get this conversation rolling!

Percent of normal U.S. precipitation over the past 30 days (December 25, 2022, through January 23, 2023) after a series of weather events known as atmospheric rivers, fueled by tropical moisture, flooded the U.S. West with rain and snow. Places where precipitation was less than 100 percent of the 1991-2020 average are brown; places where precipitation was 300 percent or more than average are blue-green. NOAA Climate.gov image, based on analysis and data provided by the Climate Mapper website.

Western drenching

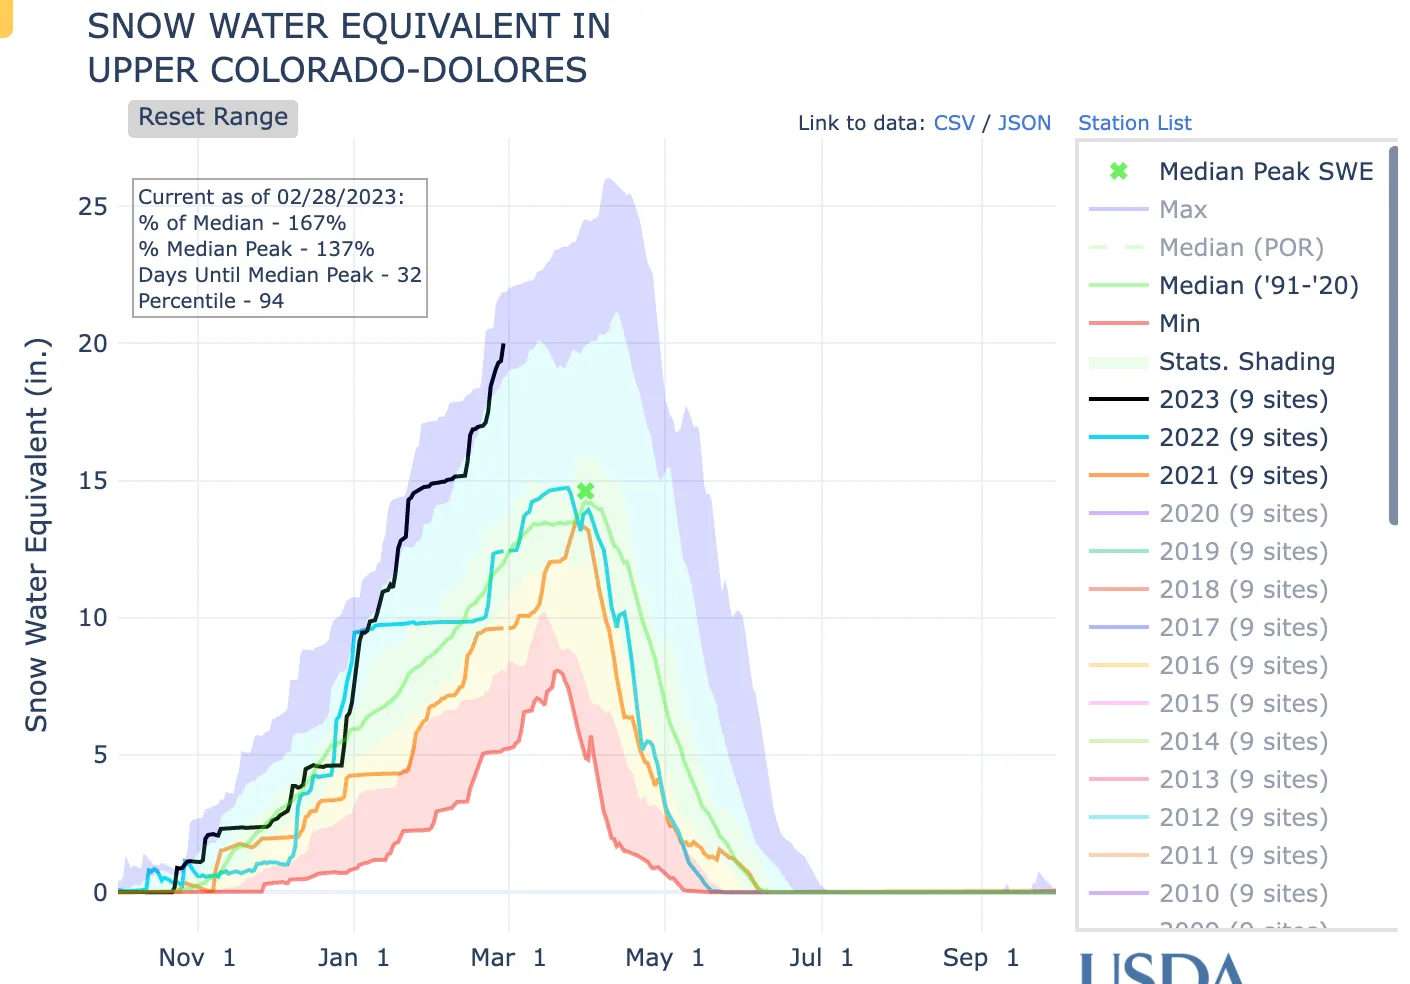
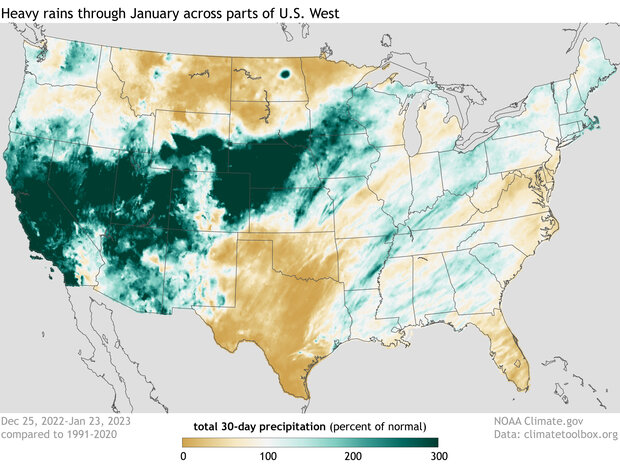
As the figure above shows, much of the western U.S. was pummeled from late December through mid-January, as a series of nine atmospheric rivers dumped more than a season’s worth of rain and snow in a few short weeks. The relief from an unrelenting drought was welcome, but too much of a good thing also meant flooding, mudslides, and dangerous debris flows.

Average December–January precipitation anomalies (percent of the 1991-2020 climatology) for all La Niña events from 1951-2020, defined as La Niña occurring in December–February. Places where precipitation was less than the 1991-2020 average are brown; places where precipitation was above average are blue-green The white box defines the Southwest U.S. region (32° – 40° N, 109°-125° W) that is the focus of further investigation. NOAA Climate.gov image, based on precipitation data from NOAA’s Precipitation Reconstruction over Land (PREC/L).

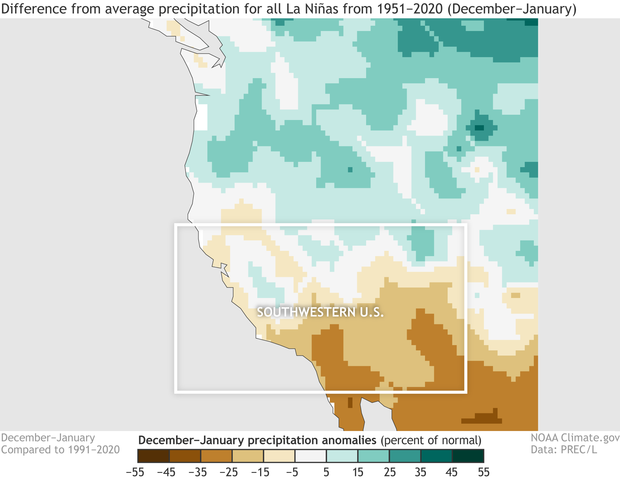
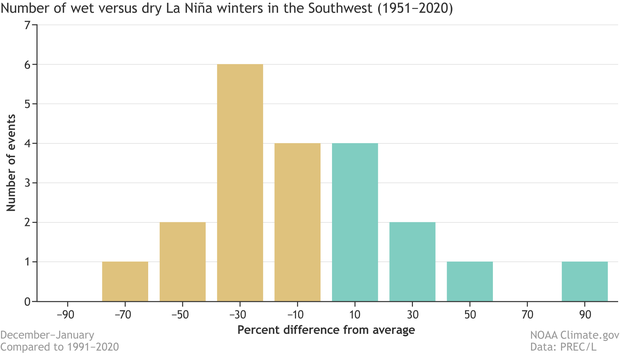
This atmospheric river onslaught surprised many who were expecting a dry season, especially in the Southwest, not only because of the prolonged drought, but also because La Niña tends to bring drier-than-average winter conditions to the region. Here, I am focusing on the Southwest region south of 40 °N that covers most of California, Nevada, Utah, and Arizona, in early winter (December–January). The figure below shows that most (13 of 21) of the La Niñas from 1951-2020 had below-average December-January precipitation in this region (1), although wet early winters during La Niña clearly are not that unusual. This early winter, the Southwest had 65% more precipitation than normal according to this precipitation dataset, which is the second highest La Niña total since 1951. The bottom line is that La Niña may tilt the odds toward dry early winter conditions in the Southwest, but La Niña clearly does not eliminate the chance of wet conditions either.

Distribution of December–January precipitation anomalies (percent of the 1991-2020 climatology) in the Southwest U.S. (region defined in the figure above) for all 21 La Niñas from 1951-2020. The precipitation anomalies are divided into 10 evenly spaced bins, and the number of La Niña events is totaled for each bin. The brown bars indicate events with below-average precipitation, and the green bars indicate events with above-average precipitation. This figure indicates that the Southwest December-January precipitation was below the 1991-2020 average in 13 of 21 La Niñas during the period. NOAA Climate.gov image, based on precipitation data from NOAA’s Precipitation Reconstruction over Land (PREC/L).

Was it predictable?

The million-dollar question for seasonal forecasters and climate scientists alike is whether this unusually wet Southwestern U.S. could have been anticipated more than a few weeks in advance. This question often boils down to whether there were subtle variations in the sea surface temperature pattern that preconditioned the atmosphere for wetter-than-usual conditions in the region (2). These variations include the magnitude and location of the strongest tropical Pacific sea surface temperature anomalies—a particular “flavor” of La Niña.

One way we could try to address this question is to group both the wettest and driest La Niñas over the Southwest in December-January and then see if there are notable differences in the sea surface temperature patterns that occurred during wetter La Niñas versus drier La Niñas. The problem with this approach, however, is that our record of reliable observations is just too short to slice and dice the data in this way. We don’t end up with enough events in each group, and the noise of chaotic weather variability hides the signal we are trying to identify.

A common approach to overcome this limitation of not enough real cases is to use global climate models to create hypothetical ones. We can run multiple simulations in which the ocean is always the same—forced to match observed sea surface temperatures, including all La Niñas from 1951-2020—but the starting atmospheric conditions are very slightly different each time. Since the ocean is the same in all the simulations, the models will produce a range of outcomes that account for the role of atmospheric chaos for each individual La Niña. When we average across all outcomes, we filter out the effects of chaotic climate variability (3).

30 alternate realities

For this analysis, I am using simulations of monthly climate from the Geophysical Fluid Dynamics Laboratory (GFDL) climate model called SPEAR, the same model that contributes seasonal forecasts to the North American Multi-Model Ensemble (NMME), but here the experiment is designed to analyze the climate effects of the observed sea surface temperature evolution from 1951-2020 (4). This set consists of 30 simulations, and since there are 21 winter La Niña events between 1951-2020, I have 30 x 21 = 630 simulations of December-January La Niña conditions—a much larger sample size than if I just relied on the 21 observed La Niña winters.

Difference in December–January precipitation anomalies (percent of the 1991-2020 climatology) between the wettest 20% and driest 20% of Southwestern U.S. La Niña outcomes simulated by the GFDL SPEAR climate model. The climate model produces a total of 630 possible climate outcomes covering all La Niñas from 1951-2020. This figure indicates that SPEAR produces very wet early winter conditions in the Southwest for some of the La Niña simulations, with the largest differences between the wet and dry groups exceeding twice the 1991-2020 climatology (more than 200%). NOAA Climate.gov image, based on precipitation data from the NOAA GFDL SPEAR climate model.

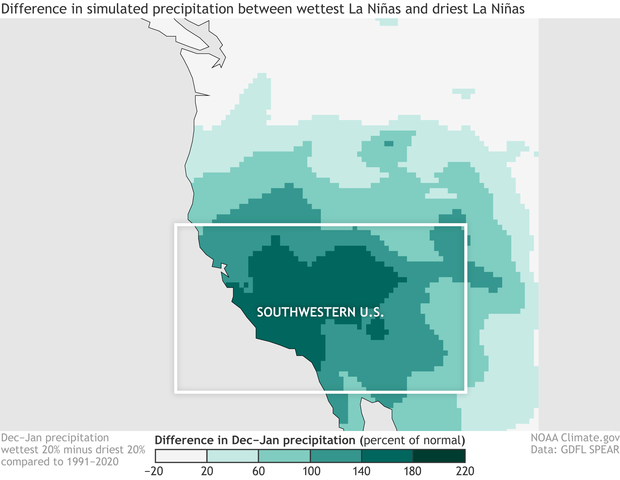
To analyze the effect of different sea surface temperature patterns on early-winter precipitation in the Southwest during La Niña, I first defined two groups: the wettest 20% and driest 20% of simulations. The figure above shows the high-minus-low precipitation average differences between these two groups. This figure confirms that SPEAR simulates very high Southwest U.S. precipitation totals in December-January in at least some of the simulated winter La Niñas. The question is, what’s different about those years?

Difference in December–January sea surface temperature anomalies (° C) between the wettest 20% and driest 20% of Southwestern U.S. La Niña outcomes simulated by the GFDL SPEAR climate model. The notably small sea surface temperature differences between the wet and dry groups indicate that the sea surface temperature pattern plays a very minor role in the Southwest precipitation differences during La Niña, according to the climate model. NOAA Climate.gov image, based on precipitation data from the NOAA GFDL SPEAR climate model.

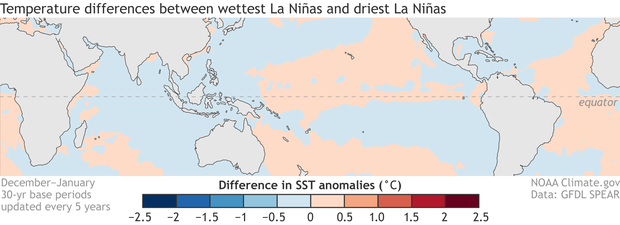
We know that all La Niñas feature below-average surface temperatures in the central and eastern equatorial Pacific, by definition, but the details vary from event to event. So, next, we want to know if there are any consistent differences in the sea surface temperature pattern between La Niñas that lead to wet versus dry early winters in the Southwest. The figure above shows the sea surface temperature differences between the high- and low-precipitation groups in the SPEAR simulations. If you’re struggling to identify any meaningful sea surface temperature differences in the map above, then you and I are in the same boat (5).

The pattern in the map is very weak, with very small departures between the two groups. The logical conclusion is that, according to the climate model, unusually heavy Southwest U.S. precipitation during December-January of La Niña has very little to do with the sea surface temperatures and instead is more closely tied to short-term and seasonally unpredictable weather conditions, as captured by the variations among the 30 simulations for a given La Niña.

To solidify this conclusion, I continued my investigation by calculating how much the variations in the La Niña sea surface temperature pattern contribute to the variations in Southwest U.S. December–January precipitation in the SPEAR simulations. I first averaged the 30 simulations for each of the 21 La Niña winters, giving me 21 precipitation outcomes. These represent the range of variation when the only thing we’re taking into account is “it’s a La Niña winter.” Then, for each of those 21 years, I looked at the range of outcomes across the 30 simulations, thus including the chaotic, unpredictable weather variability. My conclusion: the chaotic weather variations are about 14 times more important than the variations in La Niña amplitude or flavor for Southwest U.S. precipitation, which is consistent with the figure above. (Head to footnote 6 for all the gory math details.)

That doesn’t mean that the different flavors of La Niña cannot be important for Southwest U.S. precipitation, and it’s worth trying to better understand the simulated La Niña precipitation variations. Even modest variations could tip the scale toward wetter or drier conditions in a particular winter. But if these big picture findings hold up to further scrutiny, then it means that the typical or averaged La Niña precipitation pattern still may be the most reliable guide for seasonal predictions of Southwest precipitation in early winter, but we may have to rely on subseasonal and weather forecasts rather than seasonal outlooks to anticipate the sort of soaking that occurred in December and January of this winter.

Familiar caveats

All good scientific studies note their limitations, and this analysis carries some caveats that are familiar to most climate scientists. Because the observed record is too short to tease out the relationships we seek with sufficient precision, we rely on climate models to sharpen the signal relative to the noise of random weather variability. Although such climate models are rather sophisticated and reliable, they are imperfect. We cannot rule out the possibility that the model is missing some sort of predictable connection between a particular “flavor” of La Niña sea surface temperatures and Southwest precipitation. I did just one set of analyses focused on one particular region with one climate model, and that’s why I stated up front that this is just the start of the conversation. That means that this post is definitely not the last word on this topic!

Footnotes

  1. It’s interesting to note that the La Niña dry signal over the Southwest U.S. appears to be a little more robust in February-March than December-January, as 15 of the 21 events classified as La Niña in December-February had drier-than-average conditions in February-March. Even the wettest December-January event before this year, 1955/56, was drier-than-average in February-March, demonstrating that a wet early winter doesn’t necessarily mean a wet late winter. I saw this same behavior in my analysis of the SPEAR climate model simulations, which increases confidence that this more robust dry signal in February-March is a real phenomenon.
  2. For completeness, I will mention that there are other potential sources of seasonal predictability, such as stratospheric, cryosphere, land surface or radiative forcing variations, but sea surface temperature variations generally are the most important.
  3. This procedure of ensemble averaging is the same procedure we perform with seasonal forecast models. The difference here is that we are not identifying a forecast signal, but instead we are trying to isolate the effects of the sea surface temperature pattern on the climate, i.e., the effects of La Niña on southwestern U.S. precipitation in this example.
  4. I don’t want to be guilty of self-promotion, but I recently published a paper that demonstrates that SPEAR does pretty well at simulating the historical impacts of El Niño and La Niña.
  5. If we were to zoom into the tropical region, where sea surface temperatures have the greatest global climate impact, we would see some sea surface temperature differences of up to 0.2° C in the tropical Pacific and Indian Oceans. It’s conceivable that such differences could influence precipitation in the Southwest U.S., but these differences are much smaller than the amplitude of the largest average La Niña tropical Pacific sea surface temperature anomalies, which approach 2° Therefore, it is difficult to see how such small sea surface temperature differences could have an influence that is comparable with the average La Niña influence. My calculation that follows confirms this suspicion.
  6. If you’re wondering what sort of calculations led to this conclusion, then I will give you all the details here. I’m basically doing a signal versus noise calculation. The signal of interest is Southwest U.S. precipitation variations due to the sea surface temperature variations during all La Niñas. To determine this signal, I first calculated the average of the December-January Southwest U.S. precipitation across all 30 ensemble members for each La Niña. This results in 21 values covering all historical La Niñas during the period for which the noise of chaotic weather variability has been largely averaged out. Therefore, the variations among these 21 ensemble-averaged values, quantified as a standard deviation of 0.194 mm/day, largely reflect the effects of the different sea surface temperature patterns among the 21 La Niñas. Technically, this value also will reflect, in part, the increases in greenhouse gas increases in the simulation, but this effect on precipitation is relatively small.Next, I tackled the noise part of the calculation, which represents the Southwest precipitation variations that are unrelated to the sea surface temperature patterns. This is calculated as the deviation of the 30 ensemble members from the average for each individual La Niña event, and so I wind up with a total of 630 deviations from the ensemble average that capture precipitation variations resulting from the uncertainty in the initial conditions, i.e., chaotic weather variability. The standard deviation of this set of values is 0.725 mm/day.The signal-to-noise ratio is typically calculated as a ratio of variances, which are the squares of the standard deviations. I follow that convention here, though I’m really calculating the inverse, meaning the noise-to-signal ratio. When we plug those values in, we get (0.725)2/(0.194)2 = 14, which is why I conclude that chaotic weather variations are about 14 times more important than the variations caused by sea surface temperature variations for December-January Southwest U.S. precipitation during La Niña events. The exact value may change depending on what metric you use, but the overall conclusion shouldn’t change.

Still Pools: Teeming with life at the edge: “But extinction is not a promise. It’s a process” — Source #NewMexico #RioGrande

White-throated swifts carry insects to feed their young, nestled against the bottom of bridges along the Rio Grande. (Photo by Diana Cervantes for Source NM)

Click the link to read the article on the Source New Mexico website (Danielle Prokop):

SUNLAND PARK — Below the crags of Mount Cristo Rey, a string of little pools in the riverbed reflect its steep hills and white cross perched atop the peak. Black-necked stilts pick their way across on shocking pink legs, pushing through vibrant grass. A lone peacock, gone feral, zips through the streambed, interrupting the mountain’s reflection.

Diana, quietly stalking the stilts, nearly misses my wild pantomiming, trying to point out the bright blue bird just a few yards away. We both catch a glimpse of indigo wings as he flaps into the brush, and melts away unseen.

We came to this place to see the year-round pools. The high groundwater squeezes through the earth in a space between state and international borders — nearly a no-man’s land. A truck occasionally rumbles across the bridge, or a cyclist pauses to look over the river. Most city sounds sink away, replaced by the flutter of young cottonwoods, the rustle of grasses, the squawk if we get too close to a stilt, a frog gently peeping.

People from all walks of life, all along the river spoke a poetry of place. Each shared a memory of the Rio Grande — taking a fishing trip with grandparents or being struck for the first time by the lush green of a wetland in the desert.

We return again and again. At dawn and dusk, the place is filled with the raucous twittering of white-throated swifts, corkscrewing to alight on precarious lumpy nests, cradling their young. We pick in the mud under the bridge, looking up to see bright-eyed chicks peeping out their heads — next to the empty imprints of broken nests.

Groundwater pools into the Rio Grande riverbed, offering refuge to black-necked stilts, waterfowl, even a rogue peacock. (Photo by Diana Cervantes for Source NM)

This is just one of thousands of small places on the river, already reshaped by a different climate, an echo of a river system that no longer runs naturally. It is a place where creatures belong, but none express rights to its water.

Diana and I set out to tell stories about the memory of a river and document the Rio Grande as it is now. One of those aims was to foster a sense of place, even if people had never seen these portions of the river before.

“I feel oftentimes, we don’t get outside enough,” Diana said in a talk with Estela Padilla at the outset of this project. “If people don’t get a chance to love a place, they don’t understand it’s fragile — it’s not here forever.”

So much of the river’s story is about human hands dipping into it — to take from it, to manipulate it, and also to restore it, to worship in it.

We’ve told some of the story of how governments reshaped the river through dams and other controls over decades. How climate change is amplifying the consequences of that interference. How such major alterations to the Rio Grande set us on a path to where the riverbed goes dry now for miles at a time. How the overallocation of water for agriculture is paired with a refusal to devote water to the river just so it can sustain itself and its ecosystems. How we’re all a part of those ecosystems.

Black-necked stilts alight in the pools in Sunland Park, where the high groundwater creates year-round pools that offer sustenance and a home to creatures in the desert landscape. (Photo by Diana Cervantes for Source NM)

We told you about the desperate, short-sighted rescue effort to save one kind of fish while throwing hundreds of others back into the mud. The historic and ongoing exclusion of the pueblos from the decision-making table

We’ve talked to some of the farmers and ranchers who are trying to figure out how to conserve, who understand how the river’s health is essential to survival. And we’ve sat with some of the advocates hand-watering trees and fighting for patches of restoration along the river — or for its overall endurance in the era of global warming. 

And Source NM has published other stories about big legal fights over less and less water, and still more articles about extractive industries and their outsized contribution to ever hotter, drier conditions.

Even with all of this time, all of these miles on the river, I don’t have any simple answers.

But extinction is not a promise. It’s a process.

Trucks occasionally rumble over the Sunland Park pools, cut by a train horn in the distance. Otherwise, sounds of the city slip away, and the twittering of swallows dominates the pools. (Photo by Diana Cervantes for Source NM

People alter processes and their trajectories all the time. Sometimes just a few people’s efforts build the backbone of transformation. But across place, across life experience, many value the river. They fight to sustain it, as it sustains life here. 

Any real shift takes time, and there’s not much left. The Rio Grande remains suspended on the bleeding edge of climate change. I fear one day all of these little pools will just be a memory of ours. That our prayer for this river, too, will be a lamentation. 

But the fear subsides a little, slipping into the rustle of long grasses. This moment remains, suspended aloft, like young swifts.

Swifts fly to and from a bridge near the Sunland Park pools to roost for the night in nests they have built out of sediment from around the river. (Photo by Diana Cervantes for Source NM)

This is the last article in our series. Find our other stories:Crisis on the Rio Grande

This project was funded by a grant from the Water Desk and by States Newsroom, a network of nonprofit news organizations and home to Source NM.

Upper Basin states want to pause some releases from a major #ColoradoRiver reservoir — KUNC #GreenRiver #ColoradoRiver #COriver #aridification

Utah, Colorado, Wyoming and New Mexico are asking the federal government to pause some releases from Flaming Gorge Reservoir, which straddles the border between Wyoming and Utah. The reservoir, pictured here in 2021, is the third-largest in the Colorado River system.

Click the link to read the article on the KUNC website (Alex Hager). Here’s an excerpt:

Utah, Wyoming, Colorado and New Mexico, which make up the river’s Upper Basin, voted to suspend additional releases starting March 1. Delegates from those states say the federal government should let heavy winter precipitation boost water levels in Flaming Gorge. The reservoir, which straddles the border of Wyoming and Utah, is the third largest in the Colorado River system, behind only Lake Mead and Lake Powell.

The Bureau of Reclamation, the federal agency which manages dams and reservoirs in the arid West, has turned to Flaming Gorge to help prop up Lake Powell, where record low levels are threatening hydropower production inside the Glen Canyon Dam. Under the 2019 Drought Response Operations Agreement, those states outlined plans for water releases that would be triggered by dipping levels in Lake Powell. This current schedule of releases was set to finish by the end of April, so this week’s vote is suggesting that releases end two months early. Utah’s top water negotiator, Gene Shawcroft, cited two reasons for the decision – the releases did their job and helped boost Powell, and this winter’s above-average snow totals will soon help refill Powell and decrease the need for water from Flaming Gorge.

“[Suspending releases] preserves all of our future options,” Shawcroft said. “I expect Reclamation to consider that, and recognize that we still have options if we need to reinstate the releases. But at this point, I think it’s fairly obvious that water left in Flaming Gorge makes more sense than to release it where we can never get it back.”

[…]

Wahweap Marina on Lake Powell at low water. Jonathan P. Thompson photo

The four Upper Basin states often claim that they must adapt their water use each year in response to the ebb and flow of mother nature, while the Lower Basin states of California, Arizona and Nevada can rely on a legally-obligated water delivery from the Upper Basin each year. Pausing these extra releases from Flaming Gorge, Shawcroft said, helps to send a message.

“The Upper Division states and Reclamation should be the ones that determine how and when that water gets released so that we don’t simply have the Lower Basin believing that they can access Upper Division storage at whatever time they want,” he said.

Brough in Lead – Most Voters Undecided — The Buzz @FloydCiruli

First debate in race for Denver mayor: Candidates give their views on affordability and the cost of living in Denver Photo: 9news.com

With only three weeks until ballots go out, 59 percent of Denver voters have little idea as to who they will vote for on April 4th, election day. Kelly Brough appears to be the front runner (8%) in a field of candidates few know. Her lead is less than the margin of error over second place Leslie Herod (6%).

Brough is the last name on the ballot, but first in fundraising. The March financial reports will likely show her in an ever more substantial lead. Expect media advertising to begin shortly.

The poll was sponsored by a business political committee, no doubt concerned that voters are not yet engaged.

2023 Report on the Health of #Colorado’s Forests — Colorado State Forest Service #ActOnClimate

Click the link to access the report on the Colorado State Forest Service website. From the Watershed Protection page:

Watershed Protection

Providing Clean Water for Colorado and Beyond

Colorado’s forests and regional water supplies are inextricably linked. Trees capture pollutants before they enter rivers, streams and reservoirs. Effectively managed forests have a lower risk of uncharacteristic wildfire that may scorch the earth and lead to mudslides and floods, damaging municipal water infrastructure, such as reservoirs and pipelines.

The Powderhorn Wilderness Area in the southern Rocky Mountains is home to part of the Gunnison River watershed. Photo: Bob Wick, BLM

Colorado is a headwaters state. Mountain snow provides water for four major rivers in the region: the Colorado, Arkansas, Rio Grande and South Platte. Colorado’s high-country watersheds provide water to Colorado and 18 other states; the need for effective forested watershed management cannot be overstated. The Colorado State Forest Service works with partners all over the state and region on projects to protect these vital resources.

Stressors on Colorado’s Watersheds

Forests have a critical impact on water quality. In addition to removing pollutants, forests keep sediment out of water supplies, regulate stream flows, reduce flood damage and store water. They also provide habitat for wildlife and increase biodiversity, which improves the resiliency of the entire forest.

Unfortunately, Colorado’s forests are vulnerable to increasing stressors:

  • Uncharacteristic wildfire can trigger cascading effects. Areas that burn completely tend to have slower regeneration of trees and other plants, resulting in changes in snowmelt timing and a higher potential for flooding and debris flows that harm water infrastructure.
  • Population increases in the wildland-urban interface (WUI) put more pressure on wildfire mitigation resources, heighten demand for water-intensive agricultural products and inflate the number of people recreating in Colorado’s forests.
  • Insects and diseases can cause a slow but steady change in forests, frequently making wildfire in areas dense with beetle-killed trees more intense and more difficult to suppress.
  • Climate change affects snowpack levels and the timing of precipitation. For example, the Colorado Water Center at Colorado State University describes how the timing of peak snow runoff historically occurred in June. Recently, runoff has occurred in pulses that disrupt water storage systems and some runoff may not be captured.

These stressors already affect watersheds across Colorado, threatening water quality and availability for millions of Americans. Future water security requires direct and immediate action.

How the Colorado State Forest Service Protects Watersheds

As a headwaters state, actions taken in Colorado affect water security in other states. The CSFS addresses forested watershed protection in many ways, and it’s important to remember that the success of this work depends on effective collaboration and constant work with contractors, landowners and partners, whether they’re federal, local, private or non-governmental.

Identify Priority Watersheds

The Colorado Water Plan is the framework developed to meet the state’s water needs, and it describes a shared stewardship ethic to protect the health of watersheds. As part of this shared stewardship, staff at the CSFS consults with partners and other entities to identify priority areas for watershed protection projects. The CSFS’ 2020 Colorado Forest Action Plan identifies key watersheds that affect agriculture, downstream communities, recreation and ecosystem function.

The CSFS is uniquely positioned to lead cross-boundary, watershed-level projects that have large impacts on communities and individuals. Some examples of the agency’s partnerships include the Forests to Faucets program and the Forest and Land Management Services Agreement with Denver Water, which has supported healthy forest practices in Boulder, Clear Creek, Douglas, Eagle, Grand, Jefferson, Park and Summit counties since the mid-1980s.

Manage Forests

CSFS staff regularly completes and oversees on-the-ground work in forests across Colorado. When insects or diseases have left swaths of standing dead trees, foresters take on fuels reduction to remove trees that increase the risk of uncharacteristic wildfire. This also happens in areas that have experienced decades of fire suppression and consequently have dense undergrowth that raises the risk of a high-intensity crown fire.

After disturbances such as wildfire, insect infestation or flooding, forests may require some management to improve the speed and quality of regeneration. These management techniques may include reseeding, planting seedlings, removing slash or spreading mulch to prevent landslides or flooding. All management activities require monitoring and adaptive management to ensure success over time.

High Priority Watershed: The Colorado River

The Colorado River originates from the high-elevation snowfields in Rocky Mountain National Park and supplies water to 40 million people downstream.

Decades of drought combined with higher demands on the water from growing populations have dramatically decreased the amount of water in the river, as well as the reservoirs it feeds. The Glen Canyon Dam, filled by the Colorado River, produces power for 5 million people in seven states. The dam holds back Colorado River water to create Lake Powell. KUNC reported that in 2022 the lake held less than 25 percent of its capacity.

Concerns about water availability are not hypothetical; shortages are already being felt and observed. As soon as June 2023, the Glen Canyon Dam may no longer produce electricity due to continuing low water levels in Lake Powell. The effects will not just be downstream. Front Range agriculture and municipal water consumption may be affected.

Assist Communities

The CSFS is a forestry and outreach agency, dedicated to educating and assisting communities and individuals across Colorado with forest management, especially how it relates to watershed protection. For example, each May the CSFS works with partners to promote Wildfire Awareness Month and provide information to homeowners about steps they can take to reduce the risk of wildfire to their homes and properties.

A volunteer helps thin an area of lodgepole regrowth in northern Colorado. Photo: CSFS

Community groups, local governments and landowners can apply for several grant programs throughout the year. In 2022, legislation made it possible to provide approximately $15 million in grants to communities and groups through the Forest Restoration and Wildfire Risk Mitigation grant program. Two other programs include the Wildfire Mitigation Incentives for Local Government and Wildfire Mitigation Resources & Best Practices.

CSFS foresters in 17 field offices across Colorado provide direct assistance to landowners in their areas. They create forest management plans and advise on development of Community Wildfire Protection Plans (CWPPs). By working so closely with community groups, foresters can include watershed protection expertise when planning projects.

Support Timber Industry

Reduction and removal of hazardous, flammable materials is an important aspect of managing forests for watershed protection. Ideally, these materials can be used by the timber industry in some manner, whether it’s for firewood, building materials or furniture. Profitable Colorado wood products help offset the costs of forest management that protects our forested watersheds.

It’s impossible to separate watershed protection from other forest management goals and objectives. Activities that help reduce the risk of uncharacteristic wildfire often reduce the risk of damage to municipal water infrastructure. Reforestation goals also promote watershed health by growing trees that remove pollutants from waterways. Protecting the forested watersheds that are the source of water for millions of Colorado residents, as well as residents of other states, is an immense responsibility and a guiding priority of the work of the CSFS.

Citing success, Utah moves to stop sending Flaming Gorge #water downstream: The #ColoradoRiver Authority of #Utah #COriver #aridification

View below Flaming Gorge Dam from the Green River, eastern Utah. Photo credit: USGS

From email from The Colorado River Authority of Utah (Mary Carpenter):

Utah and its three sister states in the Upper Colorado River Basin voted to suspend additional releases at Flaming Gorge, starting March 1. 

“The releases from Flaming Gorge succeeded in protecting critical elevations at Lake Powell” said Utah’s River Commissioner Gene Shawcroft, who chairs the Colorado River Authority of Utah. “Given the operation’s success and improving hydrology, it’s time to stop sending water downstream and start focusing on restoring Flaming Gorge.” 

Now experts agree there is little chance that Lake Powell will fall to elevation 3,490 in the near term. 

The Bureau of Reclamation has yet to approve the modification.

Why it matters
For almost a year, water has flowed from Flaming Gorge to Lake Powell to protect critical infrastructure and continue the generation of electricity at Glen Canyon Dam. However, given wetter-than-average conditions in the Colorado River Basin and resulting increases in levels at Lake Powell projected to occur this spring, water managers in Utah say the releases achieved their intended purpose and now it is time to stop additional releases and begin putting water back into Flaming Gorge reservoir.

Go deeper
In March 2022, Lake Powell dropped below 3,525 feet in elevation, raising concerns water levels would soon drop to an elevation of 3,490 feet, limiting the release of water from Lake Powell and jeopardizing the ability to generate hydroelectric power. 

In response, Utah, Wyoming, Colorado and New Mexico, together with the U.S. Bureau of Reclamation, created a plan to release 500,000 acre-feet of water from Flaming Gorge to Lake Powell over a twelve-month period.  

The plan was authorized by the Drought Response Operations Agreement, an element of the Drought Contingency Plan passed by Congress in 2019 and signed into law by President Donald Trump, which outlines specific actions to avoid dangerously low water levels at Lake Powell. 

Colorado River Authority of Utah
Established in 2021, the Colorado River Authority of Utah is a state agency with a mission to protect, use, conserve, and develop Utah’s Colorado River system interests. The Authority collaborates with peer agencies in the six other Colorado River Basin states. Wyoming, Colorado, New Mexico, and Utah make up the Upper Division States, while Arizona, California, and Nevada are the Lower Basin States. Follow the Authority on Twitter @AuthorityUT

Map of the Colorado River drainage basin, created using USGS data. By Shannon1 Creative Commons Attribution-Share Alike 4.0

A reprieve for Powell?: The reservoir is at its lowest level since filling up — @Land_Desk #LakePowell #ColoradoRiver #COriver #aridification

Click the link to read the article on the Land Desk website (Jonathan P. Thompson):

The calamitous headlines have come fast and furious: Lake Powell’s water levels reach record low. The new low-water mark, the stories said, is emblematic of the Colorado River crisis and the dreaded dead pool — when Lake Powell gets so scraggly that its water can’t even make it through Glen Canyon Dam — is imminent.

I suggest taking this news with a grain of salt.

It’s true that the reservoir hasn’t been this low since 1968, five years after the Colorado River began backing up behind Glen Canyon Dam. It’s also true that the river on which some 40 million people depend is caught in what appears to be an irreversible decline. Dead pool is inevitable. But it’s not happening this year, because once that massive snowpack upstream from the reservoir starts melting, Lake Powell’s going to get a bit of a reprieve.

In fact, Lake Powell’s record low is actually a good sign — if looked at from a certain angle — because it indicates that water managers are confident enough in this year’s snowpack to release a bit more water from Lake Powell than they otherwise would. That has helped Lake Mead recover, slightly, with water levels climbing five feet since December.

So far 2023’s snowpack levels are tracking identically to snowy 2011’s on this date. But current trends will have to continue for two more months in order for this year to match the bounty of 2011. Source: USDA NRCS.

And the snowpack is looking good. Very good. As of Feb. 28, snow levels in the Upper Colorado River Basin were well above average and tracking similarly to 2011, one of the most bountiful water years of the last two decades. That spring and summer saw rivers swelling up, overflowing their banks, and giving river runners a good — yet dangerous — time. Lake Powell’s level climbed 45 feet that year, in spite of larger than average releases from the dam.

Note that this forecast is from Feb. 3. The snowpack has continued to grow, substantially, since then, meaning the forecasts are somewhat out of date. So far the snowpack is comparable to 2011, when 16.4 million acre feet ran into Lake Powell. Contrast that with 2021, when just 4 maf ran down the Upper Colorado River. Source: USBR.

It’s certainly too early to count on a repeat of the 2011 Colorado River runoff. Snowfall trends could flip. Early springtime temperatures could soar, as they did in 2021, which not only speeds up the runoff but also diminishes it by increasing evaporation. The parched ground could suck up some of the snowmelt, taking it away from the streams.

Yet there is still plenty of reason to be optimistic. Here’s one of them:

The Upper Dolores River watershed in southwestern Colorado, which has been especially hard hit by aridification and overallocation over the last couple decades, currently has 37% more snow than it typically does in early April, when snowpack normally peaks. The snowpack hasn’t been this good since 1993. That means if it stopped snowing now, there’d still be a healthy runoff into McPhee Reservoir, which would mean farmers would get their full share of water and the Lower Dolores might actually get enough water to be called a river.

And yet, aridification is not over. And even if snowfall trends do continue, officials must not backslide on efforts to cut water consumption. Nature has granted a reprieve — but only a temporary one.

Navajo Dam operations update: 250 cfs in the #SanJuanRiver March 20, 2023

The Navajo Dam on the San Juan River.Photo credit Mike Robinson via the University of Washington.

From email from Reclamation (Susan Novak Behery):

On the morning of March 20th, 2023 (Monday), the release at Navajo Dam will be transferred to the 4×4 Auxiliary outlet, where the release will be reduced to the minimum of 250 cfs.  The outage at the main outlet works and minimum release will accommodate maintenance work at the City of Farmington’s hydroelectric plant and instream work for the Turley Manzanares Ditch Company Diversion Dam Rehabilitation Project.  The release will be transferred back to the power plant and increased back to its current level on the morning of March 24th, 2023 (Friday). The exact times are to be determined, and will be announced the week prior to the operation. You may expect some silt and discoloration downstream in the river during this time due to the location of the 4×4.