
From the Sterling Journal-Advocate (Wilma Trujillo):
In the early 1990s, a group of plant pathologists from Colorado State University and a group of researchers from the USDA’s Agricultural Research Service (ARS) Water Management Unit recognized the need to collect localized weather data in irrigated agricultural areas across the state. The plant pathologists wanted weather data for the prediction of disease outbreaks in high value crops, such as onions and potatoes, while ARS researchers needed almost the same information to provide irrigation scheduling recommendations.
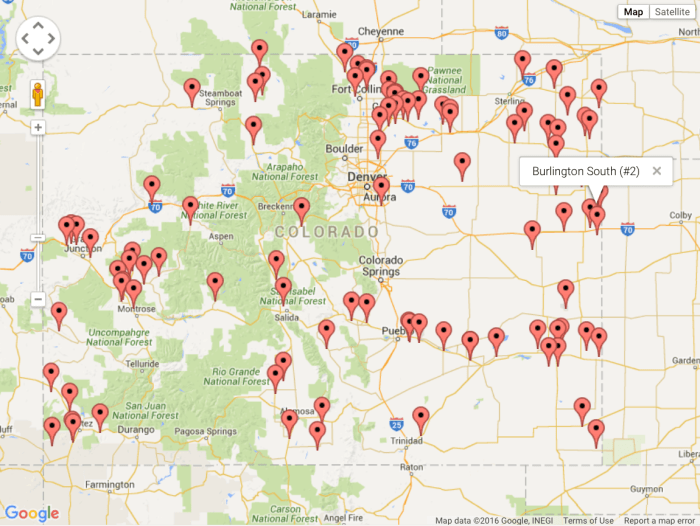
These two groups formed an informal coalition and invited others in the agricultural research community to join. They wanted input into the kinds and frequency of measurements that would be most useful to a broad spectrum of agricultural customers. Eight stations were established in major irrigated areas of eastern Colorado. These stations had a standardized set of instruments collecting and recoding data with a standard data logger program. As interest grew and funds were made available, primarily from potential users, more stations were added. Currently, there are 79 weather stations across the state in the Colorado Agricultural Meteorological Network (CoAgMet).
Initially, the station sites were located near established phone service to allow daily collection of data. Currently, the data retrieval is through cellular phone service. Today, this methodology is widely available, reliable and inexpensive. Commercial software is used to download data from the stations shortly after midnight to a USDA-ARS computer, from which it is then distributed to interested users.
As the network grew, the Colorado Climate Center (CCC) at Colorado State University became interested in the data collected, and subsequently took over the daily data collection and quality assessment. The CCC added Internet delivery and a wide range of data delivery options (fax, email, text and voice messages, etc.), and continues to improve the user interface in response to a growing interest in the data collected.
Data collected by the network is also available online at http://www.coagmet.com. Weather records date back to 1992 for the oldest stations. The home page of CoAgMet provides links to weather information descriptions of various aspects of the network. For example, there is a link to a list of the weather sensors typically installed on a CoAgMet weather station and their measurement characteristics. Another link provides a resizable map of all the stations and can help find the one(s) nearest your location.
Also the link “Monthly Summaries” provides users the option of selecting a year and a month for a specific station, plus setting options for calculating growing degree days (GDD). The link ‘Hourly Data Plots’ allows users to plot temperature, relative humidity, wind speed, wind direction, soil temperature, and solar radiation for a single day or up to an entire year at a selected station.
CoAgMet also provides daily crop water use or evapotranspiration (ET) reports. Evapotranspiration reports from CoAgMet can be used to improve irrigation management and conserve limited water resources by fine-tuning irrigation timing and amount.
The weather stations have been also classified as partially irrigated, fully irrigated or dryland. These designations describe the predominant land use in the immediate vicinity of the weather station and/or the vegetation growing around the site.
For more information on CoAgMet, please visit: http://coagmet.com/. There is also a useful fact sheet ( http://www.ext.colostate.edu/pubs/crops/04723.html) that gives more details on how to generate and use the Crop ET Reports.