Last month was the world’s third-hottest July on record, new data show — the latest milestone in a global warming trend that has seen the three hottest Julys within the last five years.
With the heat has come a high level of ice melt in the Arctic, where the extent of sea ice last month hit the lowest level for July since the polar satellite record-keeping began four decades ago, according to the European Union’s Copernicus Climate Change Service…
Atmospheric temperature records dating back to the mid-19th century reveal the last five years to be the hottest yet. In terms of records for the month of July, only 2019 and 2016 were warmer than last month. (Graphic: tmsnrt.rs/3ifC6gx)
Last month, the U.S. states of New Mexico and Texas posted record highs. The Middle East also saw record heat, with Bahrain recording its hottest July since 1902.
Even above the waters of the northeastern Pacific Ocean, sea surface temperatures reached nearly 5 degrees Celsius above the 40-year average in some places, the data show.
In the Arctic, which has been warming at more than twice the global rate in recent decades, the expanse of sea ice shrank to its lowest level recorded for any July since 1979. The data service said satellite images reveal ice-free conditions “almost everywhere” along the Siberian coastline – a shipping route that, until a few years ago, could be crossed only with an ice-breaking vessel.
July Arctic Sea Ice Anomalies via Copernicus Climate Change Service
Two weeks ago, nearly all of Colorado was in a drought. This week, it’s even worse. Just over 85 percent of the state is experiencing moderate to extreme drought, and the remaining 15 percent is abnormally dry, often a precursor to drought…
But, according to the most recent map from the U.S. Drought Monitor, 26 percent of Colorado — mostly in the southern half of the state — is in an extreme drought, level D3, which is when large fires develop, insect infestations occur and water restrictions have to be implemented.
Colorado had its eighth driest stretch from January to July of this year with only 8 inches of precipitation, that’s 3.17 inches below average, according to the National Centers for Environmental Information…
Colorado isn’t alone in experiencing a dry first half of 2020, much of the West and parts of the Deep South, central Plains and the Southeast recorded below-average precipitation. Arizona ranked sixth driest while Nevada ranked 11th driest.
Throughout most of the country above average temperatures were recorded. Florida, for example, had its warmest year-to-date period on record. New Jersey ranked a second warmest period along with Virginia, Maryland, Delaware, Connecticut, and others.
Sailboats dock at the Aspen Yacht Club marina in 2018. Levels in Ruedi Reservoir are projected to be down to about 84,500 acre-feet around Sept. 1, which could reduce access to the club’s boat ramp. Photo credit: Brent Gardner-Smith/Aspen Journalism
Ruedi Reservoir is feeling the effects of an unusual water year, with less water for endangered fish and with low reservoir levels predicted for late summer and fall.
“This year was a strange year,” Tim Miller, a U.S. Bureau of Reclamation hydrologist who manages operations at Ruedi, said at an annual public meeting about reservoir operations held virtually Wednesday. “For most of the year, it seemed like we were doing well, we thought we would get a fill on the reservoir. However, things really turned around in late spring and early summer.”
At the meeting convened by the Bureau of Reclamation, Miller said the reservoir, which holds just over 102,000 acre-feet of water, topped out at 96,750 acre-feet this year — about 5,000 acre-feet short of filling. That means there is 5,000 acre-feet less water available this season to boost flows downstream for endangered fish in what’s known as the “15-mile reach” of the Colorado River near Grand Junction.
As reservoir levels continue to drop over the next month, Aspen Yacht Club members may not be able to access the boat ramp over Labor Day weekend. By Sept. 1, reservoir levels are predicted to be down to about 84,500 acre-feet and the surface to be at an elevation of 7,747 feet, which is 19 feet lower than when it’s full.
“After Sept. 1, it’s going to be dicey,” Miller said of accessing the private marina’s boat ramp. The U.S. Forest Service boat ramp will still be accessible at those levels, he said.
Bruce Gabow of the Aspen Yacht Club said that when water levels are 13 feet below full, the club’s docks become grounded and inoperable. He said that most years, boats are taken out of the reservoir by mid-September, but with water levels dropping sooner this year, many will need to go before the end of August.
“Everyone has kind of been expecting it, but they will be bummed out,” he said of the club’s members.
Ruedi Reservoir is currently 92% full, at 94,065 acre-feet. It topped out on July 17 at 96,914 acre-feet. In 2018, the reservoir also didn’t fill, topping out at 92,650 acre-feet, according to Miller.
Each spring, Miller must decide how much water to release from Ruedi and when to release it to make room for inflow from snowmelt. Those decisions are based on streamflow forecasts from the Colorado Basin River Forecast Center and the Natural Resources Conservation Service, as well as the Bureau of Reclamation’s statistical forecasts.
This year’s unusual conditions made for tricky forecasting, leading some to question whether more and better data collection is needed, instead of relying primarily on snow telemetry, or SNOTEL, data. These automated remote sensors collect weather and snowpack information in remote watersheds, but they provide only a snapshot of a specific location. Each of the three forecasting agencies over-predicted Ruedi inflow for the months of April, May and June.
Usually, the amount of runoff closely mirrors snowpack. And with snowpack in the Roaring Fork River basin slightly above normal, as measured by SNOTEL sites, it seemed that is where runoff would also end up. But parched soils from a dry fall sucked up some of the moisture before it made its way to streams and eventually the reservoir. Miller also suspects that a high rate of sublimation — where snow goes from a frozen state to vapor, skipping the liquid phase — may have also played a role.
“To do our statistical forecast, it’s 90% snowpack only,” Miller said. “We had some different variables this year.”
By the end of May, Miller realized inflow projections were too high and began scaling back releases. Ruedi also did not participate in Coordinated Reservoir Operations this year. In the annual CROS, which began around May 29, water managers from across the state aimed to enhance peak spring runoff by releasing water from reservoirs at the same time. The peak flows have ecological benefits, especially for fish in the 15-mile reach.
“It was pretty much a last-minute declaration we couldn’t do CROS,” Miller said.
This photo from August 2018 shows low water levels at the Aspen Yacht Club docks at Ruedi Reservoir. The reservoir missed filling by 5,000 acre-feet in 2020 because of low runoff. Photo credit: Brent Gardner-Smith/Aspen Journalism
Better data?
April Long, executive director of Ruedi Water & Power Authority, suggested that water managers should explore other ways of collecting data in addition to SNOTEL information to improve forecast accuracy. The city of Aspen and Denver Water have experimented with LiDAR technology — which analyzes the reflection of laser light to create detailed three-dimensional maps — to track the depth of mountain snowpack, providing a more complete picture of the water contained in that snowpack.
“With this year of unexpected results from our snowpack and the way it melted off, I have concern that with climate change and climate variability, we are going to see more uncertainty,” Long said in a follow-up interview with Aspen Journalism. “I wonder how much benefit we could gain if we knew a little more.”
This map shows the snowpack depth of the Maroon Bells in spring 2019. The map was created with information from NASA’s Airborne Snow Observatory, which will help water managers make more accurate streamflow predictions. Jeffrey Deems/ASO, National Snow and Ice Data Center
A flight from NASA’s Airborne Snow Observatory in 2019 gathers data about the snowpack above Dillon Reservoir on a flight. Information gathered from the flight helped Denver Water manage reservoir operations. Photo courtesy of Quantum Spatial
Editor’s note: This story has been updated to reflect the date Ruedi storage peaked in 2020.
Aspen Journalism is a local, investigative, nonprofit news organization that collaborates on coverage of water and rivers with The Aspen Times and other Swift Communications newspapers. This story ran in the Aug. 7 edition of The Aspen Times.
The COVID-19 pandemic in the United States is the deepest and longest period of malaise in a dozen years. Our colleagues at the University of Vermont have concluded this by analyzing posts on Twitter. The Vermont Complex Systems Center studies 50 million tweets a day, scoring the “happiness” of people’s words to monitor the national mood. That mood today is at its lowest point since 2008 when they started this project.
They call the tweet analysis the Hedonometer. It relies on surveys of thousands of people who rate words indicating happiness. “Laughter” gets an 8.50 while “jail” gets a 1.76. They use these scores to measure the mood of Twitter traffic.
The Hedonometer measures happiness through analysis of key words on Twitter, which is now used by one in five Americans. This chart covers 18 months from early 2019 to July 2020, showing major dips in 2020. hedonometer.org
Tweets from parks contained fewer negative words such as “no,” “not” and “can’t,” and fewer first-person pronouns like “I” and “me.” It seems that nature makes people more positive and less self-obsessed.
Parks keep people happy in times of global crisis, economic shutdown and public anger. Research has also shown that transmission rates for COVID-19 are much lower outdoors than inside. As scholars who study conservation and how nature contributes to human well-being, we see opening up parks and creating new ones as a straightforward remedy for Americans’ current blues.
Park visits are up during the pandemic
According to the Hedonometer, sentiments expressed online started trending lower in mid-March as the impacts of the pandemic became clear. As lockdowns continued, they registered the lowest sentiment scores on record. Then in late May, effects from George Floyd’s death in police custody and the following protests and police response once again could be seen on Twitter. May 31, 2020 was the saddest day of the project.
Recent surveys of park visitors around the University of Vermont have shown people using green spaces more since COVID-19 lockdowns began. Many people reported that parks were highly important to their well-being during the pandemic.
The powerful effects of nature are strongest in large parks with more trees, but smaller neighborhood parks also provide a significant boost. Their impact on happiness is real, measurable and lasting.
Twitter records show that parks increase happiness to a level similar to the bounce at Christmas, which typically is the happiest day of the year. Schwartz has since expanded his Twitter study to the 25 largest cities in the U.S. and found this bounce everywhere.
Parks and public spaces won’t cure COVID-19 or stop police brutality, but they are far more than playgrounds. There is growing evidence that parks contribute to mental and physical health in a range of communities.
It isn’t easy to create new parks on the scale of San Francisco’s Golden Gate Park or the Washington Mall, but smaller projects can expand outdoor space. Options include greening vacant lots, closing streets and investing in existing parks to make them safer, greener and shadier and support wildlife.
These initiatives don’t have to be capital-intensive. In the University of Pennsylvania study, for example, renovating a vacant lot by removing trash, planting grass and trees and installing a low fence cost only about US$1,600.
Waterfall Garden Park, a pocket park in Seattle built and maintained by the Annie E. Casey Foundation. Joe Mabel/Wikipedia, CC BY-SA
Cities can also create parklike spaces by closing streets to cars. Many cities worldwide are currently retooling their transportation systems for the post-COVID-19 world in order to reallocate public space, widen sidewalks and make more space for nature.
Urban designers, artists, ecologists and other citizens can play a direct role, too, creating pop-up parks and green spaces. Some advocates transform parking spaces into mini-parks with grass, potted trees and seating for just the time on the meter, to make a larger point about turning so much public space over to cars.
Or cities can invest a little more. Minneapolis, Cincinnati and Arlington, Virginia, have won national recognition for their ambitious investments in public park systems. These areas could serve as models for neighborhoods that lack access to parks.
A New Park Deal?
The United States has historically driven economic recovery with major infrastructure investments, like the New Deal in the 1930s and the 2009 American Reinvestment and Recovery Act. Such investments could easily include nature-positive spaces.
We believe investments in nature are well worth it, offering both short-term solace in difficult times and long-term benefits to health, economies and communities.
Largest behind-the-meter solar project in U.S. provides cost edge for steel mill expansion
What might be called the world’s first solar-powered steel mill will be moving forward.
EVRAZ North America plans construction of a long-rail mill at its Rocky Mountain Steel operation in Pueblo, Colo. This decision allows execution of an agreement reached in September 2019 for a 240-megawatt solar facility located on 1,500 acres of land at the steel mill.
It will be the largest on-site solar facility in the United States dedicated to a single customer. Another way of saying it is that it will be the largest behind-the-meter solar project in the nation.
The solar production from the project, called Bighorn Solar, will offset about 90% of the annual electricity demand from the mill.
Lightsource BP will finance, build, own and operate the project and sell all the electricity generated by the 700,000 solar panels to Xcel Energy under a 20-year power-purchase agreement. Lightsource says it is investing $250 million in the solar project.
Kevin B. Smith, chief executive of the Americas for Lightsource BP, said he expects construction to start in October. Commercial operations will begin by the end of 2021. He rates the solar resource at Pueblo as 8 on a scale of 10.
Several states had been vying for the long-rail mill, which will be able to produce rails up to 100 meters long, or about as long as a football field with its end zones, for use in heavy-haul and high-speed railways. The mill uses recycled steel from old cars and other sources. The new mill is to have a production capacity of 670,000 short tons, according to a 2019 release.
The Pueblo Chieftain and other Pueblo media reported the decision to go forward on Thursday evening, citing a report from the Pueblo Economic Development Corp.
The price of the solar energy was crucial to the decision for the siting in Pueblo, says Lightsource BP’s Smith.
“The long-rail mill is a go on the basis of the EVRAZ-Xcel Energy long term electricity agreement for cost-effective electricity,” Smith said in an email interview. “Xcel was able to provide that cost-effective pricing on the basis of the Lightsource BP solar project on the EVRAZ site, which provides cost effective energy to Xcel under a 20-year contract.”
That was also the message from Skip Herald, chief executive of EVRAZ North America in a 2019 release. “This long-term agreement is key to our investment in Colorado’s new sustainable economy,” he said.
The steel mill in Pueblo was Colorado’s largest employer for a century and, for part of that time, the state’s largest consumer of electricity. Photo credit: Allen Best/The Mountain Town News
Pueblo sweetened the pot, giving EVRAZ an incentive package reported to be worth $100 million, a portion of it to be used for environmental clean up of the site. In turn, EVRAZ needed to commit to keeping 1,000 employees, KOAA News reported in 2019. The new mill was expected to produce 1,000 new jobs that will pay between $60,000 and $65,000.
The solar farm will also help Xcel achieve 55% renewable penetration in its Colorado electrical supply by 2026. By then, two of the three coal-fired Comanche units that serve as a backdrop for the steel mill will have been retired. The new solar farm will surpass in size and production the nearby 156-megawatt Comanche solar project, which currently is the largest solar production facility east of the Rocky Mountains.
Colorado Gov. Jared Polis issued a statement Thursday evening saying that he’s “thrilled that the steel mill’s new expansion has passed this important milestone. Pueblo workers have been making the world’s best steel for nearly 140 years, and with this addition, Pueblo’s next generation of steelworkers can count on good-paying jobs well into the future.”
The new steel mill was still tentative in September 2019 when Polis and various other dignitaries gathered on an asphalt parking lot on the perimeters of the steel mill to announce the solar deal.
With the early-autumn sun beating down, Pueblo Mayor Nick Gradisar spoke, saying that people had come to Pueblo from all over the world to make the stele that created the American West. For nearly 100 yeas, he said, the mill was the largest employer in the state of Colorado. His family, he said, was part of that story, his grandfather arrived from Slovenia in 1910 and worked at the steel mill for 50 years, while his father worked there for 30 years. (See video here).
Colorado Gov. Jared Polis talks about the competitive advantages of renewable energy. Photo credit: Allen Best/The Mountain Town News
Alice Jackson, chief executive of Public Service Co. of Colorado, the Xcel subsidiary, pointed to three years of negotiations that weren’t always easy but lauded the result as “perfective marriage of a variety of parties coming together” to show the world how to use renewable energy.
U.S. Senator Cory Gardner emphasized the combination of recyclable—the mill uses 1.2 million tons of material a year, he said—and renewable energy.
During his turn at the lectern, Polis, who had announced his candidacy for governor the prior year at a coffee shop in downtown Pueblo called Solar Roasters, emphasized the competitive edge that renewable energy provides.
“For those who wonder what a renewable energy future will look like, this is a great example of what that future will look like: low-cost energy for a manufacturing company that will stay in Pueblo and grow jobs for Pueblo residents,” he said.
Polis also pointed to symbolism on the Pueblo skyline, the smoke stacks of the Comanche power plants in the background. The steel mill—which once burned prodigious amounts of coal, with smudges of that past still evident—was the impetus for construction of the Comanche power station in the early 1970s. Now, as two of those three coal-burning units will be retired within a few years, another shift is underway.
“By working together to make change work for us, rather than against us, we can lead boldly in the future, create good jobs, create low-cost energy and cleaner air and do our part on climate,” he said.
Herald, the chief executive of EVRAZ, said his company will be making the “greenest steel products in the world.” It is a change, he said, that amazes him. “Just imagine recycled scrap metal being melted into new steel just a few hundred yards from where we stand in the electric arc furnace powered by the sun,” he said.
It is, he added, “one of the most amazing feats I’ve seen in my 40 years” in the steel industry.
This is from Big Pivots. Go HERE to be put on the mailing list.
Allen Best is a Colorado-based journalist who publishes an e-magazine called Big Pivots. Reach him at allen.best@comcast.net or 303.463.8630.
For a few days in August 2015, invisible mining pollutants could be seen by the world
Five years ago today, a breach at the Gold King Mine north of Silverton sent a deluge of water loaded with heavy metals into the Animas River, turning the waterway an electric-orange hue that caught the nation’s attention.
But five years later, and four years into the Environmental Protection Agency’s Superfund cleanup program, there has yet to be meaningful improvements to water quality and aquatic life.
Dan Wall, with the EPA’s Superfund program, said most of the focus since the Bonita Peaking Mining District Superfund site was declared in fall 2016 has been on studying the watershed and the multitude of mines impacting water quality.
The EPA is still in that effort, Wall said, and there’s no time frame for when the agency will present its final work plan for a comprehensive cleanup in the Animas River basin.
The EPA has spent more than $75 million on the site to date.
“It may be slower than what people want,” Wall said. “But we want to make sure our remedy selection is based on science … so the money won’t be wasted and we can be confident to see improvements based on the work we take.”
[…]
The stretch of the Animas River between Silverton and Bakers Bridge, about 15 miles north of Durango, is virtually devoid of aquatic life. Fish populations in the river through Durango are unable to reproduce, in part because of heavy metal contamination. And, years ago, the city of Durango switched its main source of water to the Florida River because of quality issues in the Animas.
The Animas River Stakeholders Group formed in 1994 and brought together a coalition of local, state and federal agencies, as well as mining companies and interested people, who sought to improve the health of the river amid heavy metal loading from legacy mines.
Prior to mining, snowmelt and rain seep into natural cracks and fractures, eventually emerging as a freshwater spring (usually). Graphic credit: Jonathan Thompson
Despite the many Stakeholders Group successes, water quality in the Animas River in recent years has diminished, mainly from the mines leaching into one of the river’s tributaries, Cement Creek.
In 2014, the EPA decided pollution had gotten so bad that it stepped in with a $1.5 million cleanup project of its own…
Despite millions of dollars in claims, no one was reimbursed for their losses after the EPA claimed governmental immunity. A lawsuit still lingers in the federal courts from those seeking to recoup costs.
But ultimately, the Animas River did not appear to be too adversely impacted – the spill did not cause a die-off of fish, and long-term studies have shown little to no effect on aquatic life or the waterway…
The “Bonita Peak Mining District” superfund site. Map via the Environmental Protection Agency
What the spill did accomplish was to highlight the legacy of mines chronically contaminating the Animas River: The amount of metals released from the Gold King Mine spill is equal to that released every 300 days from all the mines around Silverton.
After years of the possibility of the EPA’s Superfund program stepping in, it became official in fall 2016, with the agency singling out 48 mining-related sites set for some degree of cleanup…
Gold King Mine Entrance after blow out on August 5, 2015. Photo via EPA.
Immediately after the Gold King Mine spill, the EPA built a $1.5 million temporary water treatment plant that takes in discharges from the mine and removes metals, which costs about $2.4 million to $3.3 million a year to operate.
But other than some minor projects around the basin, the EPA has focused on studies to better understand the complex mining district, and evaluate what long-term options would be best for cleanup.
The EPA is set, remedial project manager Robert Parker said, to make stronger headway on a quick action plan to address about 23 mining sites over the next few years while longer-term solutions are being examined.
Cement Creek aerial photo — Jonathan Thompson via Twitter
Communities in North America—both coastal and inland— must better manage water in the face of drought, flooding, sea level rise, and urbanization. In this session of our Connecting for Conservation webinar series, we will discuss stormwater management in cities and new ways of harnessing natural solutions and community building to promote resilience.
Releases from the Aspinall Unit will be increased from 1550 cfs to 1600 cfs on Friday, August 7th. Releases are being adjusted to raise flows back to the baseflow target in the lower Gunnison River. The actual April-July runoff volume for Blue Mesa Reservoir came in at 57% of average.
There is a drought rule in the Aspinall Unit Operations EIS which has changed the baseflow target at the Whitewater gage. The rule states that during Dry or Moderately Dry years, when the content of Blue Mesa Reservoir drops below 600,000 AF the baseflow target is reduced from 1050 cfs to 900 cfs. Therefore, the baseflow target for July and August will now be 900 cfs.
Flows in the lower Gunnison River are currently below the baseflow target of 900 cfs. River flows are expected to trend up toward the baseflow target after the release increase has arrived at the Whitewater gage.
Currently, Gunnison Tunnel diversions are 1050 cfs and flows in the Gunnison River through the Black Canyon are around 550 cfs. After this release change Gunnison Tunnel diversions will still be around 1050 cfs and flows in the Gunnison River through the Black Canyon will be around 600 cfs. Current flow information is obtained from provisional data that may undergo revision subsequent to review.
The July 2020 contiguous U.S. temperature was 75.7°F, 2.1°F above the 20th-century average and ranking 11th warmest in the 126-year record. For the year-to-date, the national temperature was 53.6°F, 2.4°F above average, ranking seventh warmest on record.
The July precipitation total for the contiguous U.S. was 2.93 inches, 0.15 inch above average, and ranked in the wettest one-third of the 126-year period of record. The year-to-date precipitation total for the Lower 48 was 19.29 inches, 1.20 inches above average, also ranking in the wettest one-third of the historical record.
This monthly summary from NOAA National Center for Environmental Information is part of the suite of climate services NOAA provides to government, business, academia, and the public to support informed decision-making.
July Temperature
Above-average July temperatures were present across much of the West, Southwest, central Rockies and from the Mississippi River Valley to the East Coast. Virginia (tied with 2012), Pennsylvania (tied with 1955), and Connecticut (tied with 2013) as well as Delaware, New Jersey, Maryland, and New Hampshire each had their warmest July and month on record with 14 additional states across the South and East having a top-10 month.
Below-average temperatures were limited to portions of the northern Rockies and central Plains.
The Alaska average July temperature was 53.3°F, 0.6°F above the long-term mean and ranked in the middle third of the historical record for the state. It was the coolest July since 2014.
Much of the northern and eastern portions of the state were cooler than average during July.
Like much of northern and eastern Alaska, Utqiaġvik (Barrow) had a high temperature for the month of 53°F — the second-lowest July maximum temperature in more than 100 years.
As a result of the cooler temperatures across the Interior during July and the above-average precipitation during June, the Alaskan wildfire season, to-date, is well-below average and has consumed the lowest number of acres since 2008.
In contrast to the cooler conditions across the northern and eastern portions of the state, southwestern, south central and portions of southeastern Alaska experienced above-average temperatures during July.
Kodiak had its third-warmest July since 1915, while Cold Bay tied for fourth warmest (since 1950).
Sea ice across the Chukchi Sea continues its summertime melt phase with a July average extent at 81% of average — the highest coverage since 2016.
July Precipitation
Above-average precipitation was observed across much of the northern and central Plains as well as the Great Lakes, Mississippi Valley and Gulf Coast. Kansas ranked seventh wettest for July.
Below-average precipitation fell across much of the West and portions of the Deep South, central Plains, Ohio Valley and Southeast. Arizona ranked sixth driest while Nevada ranked 11th driest.
The Atlantic Hurricane season has been active with a combination of three tropical storms and two hurricanes named during July.
These storms became the earliest fifth, sixth, seventh, eighth and ninth named storms on record in the Atlantic Basin.
Tropical Storm Edouard formed in the Atlantic Ocean on July 4 off the coast of South Carolina and moved away from land.
Tropical Storm Fay formed in the Gulf of Mexico on July 9 and, as a depression, proceeded to make landfall over the Florida Panhandle before emerging into the Atlantic Ocean off the Georgia coast, intensifying into a tropical storm and making landfall again near Atlantic City, NJ.
Tropical storm Gonzalo formed in the eastern Caribbean on July 21 and drifted westward toward the islands of Barbados, St. Vincent and the Grenadines as well as Trinidad and Tobago before dissipating near the Venezuelan coast.
Hurricane Hanna formed in the Gulf of Mexico on July 23 and tracked westward making landfall on Padre Island, TX as a strong category 1 hurricane. Hanna was the first hurricane of the season in the Atlantic Basin.
Hurricane Isaias formed in the Caribbean on July 30, bringing heavy winds and rainfall to Puerto Rico before strengthening and moving toward the southeastern U.S.
Alaska received near-average precipitation during July, but regional amounts varied. Much of the West Coast and portions of the Aleutians, Southeast Interior and Northeast Gulf divisions had drier-than-average precipitation while most of the Panhandle and portions of the Northeast Interior, Central Interior and Bristol Bay divisions received above-average precipitation for the month.
According to the July 28 U.S. Drought Monitor, approximately 33% of the contiguous U.S. was in drought, which is about seven percentage points higher than what was reported at the end of June. Drought conditions expanded or intensified across parts of the West, South, central Plains, central Rockies, Great Lakes, Ohio Valley and Northeast. Drought intensity lessened across portions of the northern Plains and central to southern High Plains. Outside of the contiguous U.S., drought intensity lessened across portions of Puerto Rico, Hawaii and Micronesia.
Above- to much-above-average January-July temperatures were observed across much of the Lower 48. Florida had its warmest year-to-date period on record with New Jersey ranking second warmest and Virginia, Maryland, Delaware, Connecticut, Rhode Island and Massachusetts ranking third warmest. The Florida statewide average temperature for the first seven months of 2020 was 72.7°F, 3.3°F above average. Three of the last four years have been the three warmest January-July periods on record.
Near-average temperatures were concentrated across portions of the northern Rockies and scattered over the northern Plains and the South.
The Alaska statewide average temperature for this year-to-date period was 26.0°F, 0.2°F above average and ranked in the middle one-third of the record. It was the coolest January-July since 2012. Above-average temperatures were limited to the northwest West Coast division as well as the Aleutians. Below-average conditions were present across much of the Southeast Interior division and portions of the Northeast Interior, Central Interior, Cook Inlet and Northeast Gulf divisions. Near-average temperatures were present across the vast majority of the state.
Year-to-date (January-July) Precipitation
Above-average precipitation occurred across portions of the Northwest, central Plains and from the Great Lakes to the Gulf Coast and into the Southeast. Tennessee and West Virginia ranked fifth wettest for January-July with an additional five states ranking in the top-10 wettest for this year-to-date period.
Below-average precipitation was observed from the West Coast to the Rockies, from the northern Plains to southern High Plains, as well as across portions of the Upper Midwest and Northeast. Colorado had its eighth-driest January-July period on record with 8.00 inches of precipitation, 3.17 inches below average.
Year-to-date precipitation across Alaska ranked at the top of the middle third of the historical record. Much of the Alaskan mainland received above- to much-above-average precipitation over the first seven months of 2020, while the Aleutians, Cooks Inlet and Northeast Gulf regions received below-average precipitation.
The hot, dry weather during July has resulted in high fire danger and low stream levels, and forecasters say little relief is in sight.
Aspen could only coax 1.17 inches of precipitation out of the clouds last month even though it rained 14 days, according to record keepers at the Aspen Treatment Water Plant. Normal rainfall for July is 1.74 inches…
For May, June and July, the water plant was down about three-quarters of an inch, or 16%, from the average of 4.85 inches. This year, 4.08 inches of precipitation fell.
Three wildfires have materialized in the region over the last week — a small one north of Ruedi Reservoir popped up over the weekend and was snuffed by Monday. Another fire erupted in steep hillsides west of Glenwood Springs on Wednesday and continued to hamper traffic on Interstate 70 on Thursday. The biggest regional wildfire is 18 miles north of Grand Junction. The Pine Gulch Fire had grown to nearly 12,000 acres as of Wednesday night…
The latest U.S. Drought Monitor map released by the federal government on Thursday showed Pitkin County divided nearly evenly between severe drought on the lower elevation terrain in the western half, and moderate drought on the higher elevation lands on the eastern half.
Basalt, El Jebel, Carbondale and Glenwood Springs are all in the severe drought category…
Basalt-based nonprofit Roaring Fork Conservancy said the weather is taking a toll on local rivers and streams. The Roaring Fork River near Aspen is running at 53.4 cubic feet per second. The mean for Thursday was 84 cfs. The Crystal River at Redstone was running at 101 cfs compared to a mean of 251.
Conditions are better on the Fryingpan River below Ruedi Reservoir. The holders of senior water rights on the Colorado River placed a “call” on water, which is requiring releases from the reservoir. That’s creating increased flows on the Fryingpan River and on the Roaring Fork River below the confluence.
The Fryingpan River was running at 208 cfs on Thursday, above the mean of 191.
US Drought Monitor one week change map ending August 4, 2020.
Water Congress will hold a virtual summer meeting beginning August 25 and will continue for 4 weeks. Sessions will be on Tuesdays and Thursdays starting at noon with each one running 60 to 75 minutes. More information on specific topics and related workshops will be released in the upcoming weeks.
Click on a thumbnail graphic below to view a gallery of drought data from the US Drought Monitor.
US Drought Monitor August 4, 2020.
West Drought Monitor August 4, 2020.
Colorado Drought Monitor August 4, 2020.
Click here to go to the US Drought Monitor website. Here’s an excerpt:
This Week’s Drought Summary
As Tropical Storm Isaias churned through the northern Caribbean and then northward along the east coast of the United States, an active pattern from the central Plains through the Midwest also brought precipitation with it. Temperatures were cooler through the center of the country, with departures of 6 to 8 degrees below normal in Kansas and Oklahoma while temperatures were well above normal in the Northwest, Southwest and from the Mid-Atlantic up into New England. Several areas broke or tied temperature records for the month: Phoenix had their all-time warmest month ever with an average temperature of 98.9 degrees and Tucson also had their warmest July ever at 91.5 degrees, breaking the previous warmest July by almost a full degree (90.6 degrees in 2005). Sitka, Alaska reached 88 degrees on July 31, tying an all-time record high originally set on July 30, 1976. Richland, Washington recorded 113 degrees on July 30, tying an all-time record high first achieved on August 5, 1961…
Cooler than normal temperatures helped to slow down some of the drought development in the region this week. Temperatures were generally 2-4 degrees below normal, with pockets in Kansas that were 6-8 degrees below normal. Precipitation was mixed as areas of eastern Kansas, eastern Wyoming, central South Dakota, south central and southwest Nebraska and far southwest Kansas all had above-normal precipitation for the week with thunderstorm activity. Improvements to the moderate drought and abnormally dry conditions were made in southeast Kansas and central Nebraska. Moderate drought was expanded in the Nebraska panhandle and northeast Colorado while abnormally dry conditions were introduced here as well. A new area of severe drought was added in eastern Nebraska in response to dryness that has lingered in the region since last fall. Moderate drought was expanded in southeast Wyoming and abnormally dry conditions were expanded in northwest Wyoming…
Well above normal and record-setting temperatures continued in the region, with many areas 2-4 degrees or more above normal for the week. Much of the region was dry for the week with only some spotty precipitation in places; the bulk of the precipitation was in eastern New Mexico and southwest Colorado as the monsoon brought some relief to this region. The hot and dry conditions allowed for a full category degradation over much of Arizona and into portions of southern Nevada and southern California. Even with the rains in New Mexico, the issues related to drought continued and further degradation was shown in the north and southeast portions of the state this week as a mix of both short and long-term issues continue…
In typical summer fashion, precipitation was spotty through the region, with Oklahoma and Arkansas and into northern Texas recording the most widespread precipitation this week. Portions of the Texas panhandle and central into west Texas as well as eastern Arkansas and into Mississippi remained dry this week. Temperatures were 2-4 degrees below normal in Arkansas, Louisiana, western Mississippi, east Texas and north Texas. Portions of central Oklahoma were 6-8 degrees below normal for the week while much of west Texas was normal to 4-6 degrees above normal. Almost a full category improvement was made from central Oklahoma into northwest Arkansas in response to both the cooler temperatures and above-normal precipitation. Areas of southeast Texas were improved with both abnormally dry and moderate drought reduced. Areas of central and west Texas had degradation with an expansion and introduction of extreme drought in this region. Continued improvement occurred over the panhandle of Texas where rains have helped local conditions while neighboring counties saw degradation. Abnormally dry conditions were improved in Louisiana but were expanded in northern Mississippi…
Looking Ahead
Over the next 5-7 days, it is anticipated that the West remains dry with only light precipitation over portions of New Mexico and southeast Arizona and into the coastal regions of the Pacific Northwest. The greatest precipitation is anticipated over the Midwest and areas from Florida north along the East coast. Temperatures during this time will be warmest over the West with departures of 3-6 degrees above normal widespread over the Southwest and into the Rocky Mountains. Cooler than normal temperatures are projected over the lower Mississippi Valley with departures of up to 3 degrees below normal.
The 6-10 day outlooks show the greatest likelihood of above-normal temperatures over the areas east of the Rocky Mountains, with the greatest probabilities over southern New Mexico and the Great Lakes. There are also above-normal chances of below-normal temperatures over the west coast and into the Great Basin. The greatest chances of above-normal precipitation are over the eastern half of the country, centered on the Midwest, and also over the Pacific Northwest. The highest chances of below-normal precipitation are centered over Colorado and New Mexico and dominating the Rocky Mountain states and into the Plains.
US Drought Monitor one week change map ending August 4, 2020.
A center pivot irrigates a field in the San Luis Valley, where the state is warming farmers that a well shut-down could come much sooner than expected. Credit: Jerd Smith via Water Education Colorado
The race against time continues for farmers in southern Colorado’s San Luis Valley, with the state’s top water regulator warning that a decision on whether hundreds of farm wells will be shut off to help save the Rio Grande River could come much sooner than expected.
July 28, at a virtual symposium on the Rio Grande River, the state warned growers that they were running out of time to correct the situation.
“We’ll see in the next couple of years if we can turn around this trick,” said State Engineer Kevin Rein. “If we’re not turning it around, we need to start having that more difficult conversation.”
The valley is home to the nation’s second-largest potato economy and growers there have been working voluntarily for more than a decade to wean themselves from unsustainable groundwater use and restore flows in the Rio Grande. Thousands of acres of land have been dried up with farmers paying a fee for the water they pump in order to compensate producers who agree to fallow land.
Artesian well Dutton Ranch, Alamosa 1909 via the Crestone Eagle
The San Luis Valley, which receives less precipitation than nearly any other region in Colorado, is supplied by the Rio Grande, but under the river lies a vast aquifer system that is linked to the river. It once had so much water that artesian springs flowed freely on the valley floor.
As modern-day farmers began putting powerful deep wells into the aquifer, aquifer levels declined, and flows in the river declined too as a result, hurting the state’s ability to deliver Rio Grande water downstream to New Mexico and Texas, as it is legally required to do.
Between July 2019 and July 2020 the valley’s unconfined aquifer, which is fed by the Rio Grande River, dropped by 112,600 acre-feet. All told the aquifer has lost around 1 million acre-feet of water since the drought of 2002.
Through a plan written by growers in the valley and approved by the state in 2011, farmers had 20 years, from 2011 to 2031, to restore the aquifer. But multiple droughts in the past 19 years have made clear that the region can’t rely on big snow years to replenish the valley’s water supplies because there are fewer of them, thanks to climate change.
“So what is the future, the short-term future, if we can’t count on climate? And let’s admit we can’t,” Rein said. “If climate’s not cooperating the only thing that can be done is consuming less water.”
A powerful sprinkler capable of pumping more than 2,500 gallons of water per minute irrigates a farm field in the San Luis Valley June 6, 2019. Credit: Jerd Smith via Water Education Colorado
Adding to pressure on the region is a proposal by Denver developers to buy thousands of acres of the valley’s farm land, leaving some of the associated water rights behind to replenish the aquifer, while piping thousands of acre-feet of water northeast to the metro area.
Rein said drastic steps, like drying up more fields and sharply limiting how much growers can pump, are needed. But this could result in bankruptcies and could cripple the valley’s $370 million agriculture economy, which employs the majority of workers in the region. Worse still, though, would be the shutdown of all wells in the region, which is what could occur if farmers aren’t able to make progress toward aquifer sustainability.
While the deadline to restore the aquifer is set for 2031, if it becomes clear before then that growers aren’t able to restore groundwater levels, Rein will be forced to take action early by turning off all wells.
Rein said his decision likely won’t come as early as next year. But, he said, “Do we wait until 2031, the deadline? Probably not.”
The groundwater challenges and associated deadline stem from Colorado’s historic 2002 drought which led to more groundwater pumping than ever before and resulted in a falling water table, decreases in water pressure, and failing wells.
Groundwater declines have been so severe that they’ve affected surface water levels in parts of the valley. In 2004, state lawmakers passed a bill requiring the state to begin regulating the aquifer to make it more sustainable.
Landowners within the Rio Grande Water Conservation District (RGWCD) responded by forming a groundwater management district known as Subdistrict 1—that was just the first of what will soon be seven approved subdistricts.
Subdistrict 1 set goals and developed a plan of water management in late 2011 that spelled out how to reduce groundwater depletions and recharge the aquifer.
In 2012 they began paying a fee for every acre-foot of water used. That revenue helps pay irrigators who elect to participate in voluntary fallowing programs and other efforts to replenish the river and reduce stress on the aquifer.
Colorado Drought Monitor August 7, 2018.
And by 2017, irrigators had restored 350,000 acre-feet of water in the aquifer, halfway to their goal. But drought and disaster struck in 2018. With less surface water available and high temperatures, irrigators pumped heavily to maintain their crops. And by September 2018, farmers had lost about 70 percent of the groundwater gains they had worked so hard to recover.
“2018 was extremely frustrating,” said Cleave Simpson, manager of the RGWCD who is also a fourth-generation grower. ”It really kind of set us back to where we were when we started this in 2012.”
It’s not over yet. Some of that groundwater lost in 2018 has been recovered and this year participation in the fallowing program is higher than ever, with more than 13,000 acres enrolled, according to Amber Pacheco who manages the RGWCD’s subdistrict programs—that’s in addition to the 8,800 acres fallowed through the conservation programs that have been running since 2012.
Simpson and others, faced with another severe drought year, are deeply worried about the success of their conservation efforts, but dire times are also boosting motivation to solve the problem, Simpson said.
“There’s a sense of urgency from the board of managers that we’ve got to keep doing more,” Simpson said. “We’ve got to get back what we lost.”
Caitlin Coleman is the Headwaters magazine editor and communications specialist at Water Education Colorado. She can be reached at caitlin@wateredco.org.
Here’s the release from the Colorado Water Conservation Board (Megan Holcomb/Tracy Kosloff):
On June 22, 2020, Governor Polis activated the State Drought Mitigation and Response Plan and the supporting Drought- and Agricultural Impact Task Forces to respond to deepening drought conditions across the state. As of July 30th, dry conditions now cover 99.35% of the state with 83.72% in severe, extreme, or exceptional drought categories. To stay informed on the evolving 2020 drought season and response resources, please visit the Colorado Water Conservation Board drought website and submit questions on Twitter at @CO_H2O (observations, reports, or images can be tagged with #codrought2020).
Colorado Drought Monitor July 28, 2020.
The 90-day Standardized Precipitation Index (SPI) (April 21 to July 21) continues to show slightly below average moisture for nearly all of Colorado with deeper shortfalls now more prevalent in north central and front range mountains in addition to NE and SW corners.
El Niño Southern Oscillation (ENSO) conditions now show borderline La Niña conditions, with the atmospheric response at weak La Niña or neutral. Sea surface temperature outlooks continue with equal chances neutral/La Niña in the fall and winter.
NOAA’s Climate Prediction Center’s three month outlook maps continue to show very high confidence for above average temperatures July through Sept. and a stronger chance for below average precipitation compared to last month.
The VegDri Index (a satellite derived product that looks at how well plants are photosynthesizing) shows a bullseye of severe drought conditions in the NE (see Aug 2 map to the right).
Reservoir storage, fell 7% over the last month (now 93% of average) with slightly better than average storage in northern CO and below average in southern CO. The Rio Grande basin-wide storage is only 55% of average for this time of year, the lowest in the state.
Several municipal water providers are reporting above average demands (10-30% above avg) and increased concerns around the lack of precipitation.
Piute Farms waterfall. Photo credit: Bureau of Reclamation
From email from Reclamation (Susan Behery):
In response to decreasing flows and a hot and dry forecast weather pattern in the San Juan River Basin, the Bureau of Reclamation has scheduled an increase in the release from Navajo Dam from 600 cubic feet per second (cfs) to 700 cfs on Friday, August 7th, starting at 4:00 AM. Releases are made for the authorized purposes of the Navajo Unit, and to attempt to maintain a target base flow through the endangered fish critical habitat reach of the San Juan River (Farmington to Lake Powell).
The San Juan River Basin Recovery Implementation Program has recommended base flows as close to 500 cfs as possible for the summer of 2020. This is within their normal recommended range of 500 to 1,000 cfs. The target base flow is calculated as the weekly average of gaged flows throughout the critical habitat area from Farmington to Lake Powell.
Black Canyon July 2020. Photo credit: Cari Bischoff
From email from Reclamation (Erik Knight):
Releases from the Aspinall Unit will be increased from 1450 cfs to 1500 cfs on Wednesday, August 5th. Releases are being adjusted to raise flows back to the baseflow target in the lower Gunnison River. The actual April-July runoff volume for Blue Mesa Reservoir came in at 57% of average.
There is a drought rule in the Aspinall Unit Operations EIS which has changed the baseflow target at the Whitewater gage. The rule states that during Dry or Moderately Dry years, when the content of Blue Mesa Reservoir drops below 600,000 AF the baseflow target is reduced from 1050 cfs to 900 cfs. Therefore, the baseflow target for July and August will now be 900 cfs.
Flows in the lower Gunnison River are currently below the baseflow target of 900 cfs. River flows are expected to trend up toward the baseflow target after the release increase has arrived at the Whitewater gage.
Currently, Gunnison Tunnel diversions are 1050 cfs and flows in the Gunnison River through the Black Canyon are around 450 cfs. After this release change Gunnison Tunnel diversions will still be around 1050 cfs and flows in the Gunnison River through the Black Canyon will be around 500 cfs. Current flow information is obtained from provisional data that may undergo revision subsequent to review.
Here’s the release from the Western Governor’s Association:
As the population of the West concentrates in metropolitan areas, rural communities face increasing challenges to provide the services, infrastructure and opportunities needed to thrive. At the same time, opportunity abounds for rural areas to respond to global economic trends and technological innovation.
How do we re-energize rural communities and help them tap into an increasingly technological world? That was the question WGA Chair and North Dakota Gov. Doug Burgum sought to answer when he launched the Reimagining the Rural West Initiative in July 2019. The Initiative has since examined challenges and highlighted opportunities in rural economic development, infrastructure and quality of life organized around three major pillars:
Opportunity: Creating an environment in which everyone has the chance to prosper, whether as a first-time entrepreneur, seasoned business owner, recent graduate starting a career or a midcareer worker looking to learn new skills.
Connectivity: Ensuring that rural communities are connected by high-speed internet and safe efficient transportation networks, so that people in the rural West can plug into the global economy and take advantage of cutting-edge technology.
Community: Supporting community-led efforts to solve local challenges and building smart, healthy, vibrant communities.
The Initiative sought answers through several avenues, including regional workshops that attracted leading experts on rural development. WGA also developed a series of webinars to further explore ideas that arose from the workshops. And when the impact of the COVID-19 pandemic became clear, WGA launched a dedicated webinar series to explore what it meant for the communities at the heart of the Initiative’s work.
The Special Report on the Initiative shares more than a dozen policy recommendations to support vibrant rural communities in the West. Highlights include:
Change the way we do economic development to focus on attracting workforce and building community assets that improve quality of life.
Develop policy and financial solutions that can bring broadband access to all rural communities, enabling them to take advantage of remote work opportunities, distance learning and telehealth, among other things.
Strengthen local leadership with the capacity to develop a shared vision for the future along with their community, and then leverage local resources to achieve it.
The report also includes additional details about the workshops, webinars, participants, and podcast series dedicated to the Initiative.
“This current megadrought began in the mid-1990s. So if you do the calculations, 25 years now,” said Dr. Kevin Murphy, researcher of Hydro-climatology at Arizona State University.
Megadroughts can run 10 to 30 years. Dr. Kevin Murphy from ASU looked at tree ring records and found our current one.
“This has been the most severe megadrought over 1,000 years; that’s what we found by looking at the records,” said Dr. Murphy.
A drought like this can put a significant stress on our water supply.
“The Salt River Project was formed in 1903. It was a direct result of the severe drought that occurred between 1898 and 1905,” said Charlie Ester, Water Manager for SRP. That project has kept the water supply flowing into the Valley ever since…
The Salt and Verde rivers rely on mother nature to keep them replenished, with 75 percent of the water coming from our winter storms.
CSU’s Peter Backlund was part of a team that looked at the U.S. agricultural system and identified climate stresses. Backlund is associate director of the School of Global Environmental Sustainability. Photo: Joe Mendoza/CSU Photography
Here’s the release from Colorado State University (Mary Guiden):
Agricultural production is highly sensitive to weather and climate, which affect when farmers and land managers plant seeds or harvest crops. These conditions also factor into decision-making, when people decide to make capital investments or plant trees in an agroforestry system.
A new report from the U.S. Department of Agriculture focuses on how agricultural systems are impacted by climate change and offers a list of 20 indicators that provide a broad look at what’s happening across the country.
The report, “Climate Indicators for Agriculture,” is co-authored by Colorado State University’s Peter Backlund, associate director of the School of Global Environmental Sustainability.”>Climate Indicators for Agriculture,” is co-authored by Colorado State University’s Peter Backlund, associate director of the School of Global Environmental Sustainability.
Backlund said the research team started with the scientific fact that climate change is underway.
“We looked at the U.S. agricultural system and examined the climate stresses,” he said. “This report outlines data that farmers and land managers can use to understand how climate change is affecting their operations, and, hopefully, guide the development of effective adaptation.”
In the report, the authors outline how the changes taking place in agriculture affect the system that many people make their livelihoods from.
“We want to help farmers, ranchers and land managers adapt better under climate change, which requires understanding what is actually happening on the ground. These indicators offer ways to measure the impacts of change,” said Backlund.
20 climate indicators, based on robust data
The climate indicators described in the report are arranged in five categories, including physical (extreme precipitation and nighttime air temperature), crop and livestock (animal heat stress and leaf wetness duration), biological (insect infestation in crops, crop pathogens), phenological (timing of budbreak in fruit trees, disease vectors in livestock) and socioeconomic (crop insurance payments, heat-related mortality of agricultural workers).
Backlund said the research team chose these indicators based on the strength of their connection to climate change and availability of long-term data, which is needed to identify how impacts are changing over time and whether adaptive actions are having the desired effect.
“We want to help farmers, ranchers and land managers adapt better under climate change,” said Peter Backlund, Associate Director, School of Global Environmental Sustainability, Colorado State University.
“There had to be a measurement of a variable strongly coupled with climate,” he said. “As we go forward, we will better understand the impact of climate change by using these indicators.”
Researchers opted to include nighttime air temperatures as opposed to general temperature because nighttime temperatures have a big effect on the way plants develop.
Some of the indicators have national data, while others are more regional. Heat stress on livestock, a huge issue for feedlot operators, will be of interest to farmers and ranchers in states including Colorado.
“Heat interferes with the rate of reproduction and rate of weight gain,” Backlund said. “This presses on the whole operation; it’s not just that a few more animals will die from getting too hot.”
The crop insurance payment indicator offers insight on the repercussions of climate events.
“You can see if you have a big climate event, like drought, one region will be much more affected than another,” he said. “If farmers have good irrigation, they’ll be much more capable in dealing with periods of low rainfall.”
Backlund said the indicator covering weed range and intensity was also notable. As carbon dioxide concentrations increase, researchers are seeing extreme northern migrations and expanded ranges for weeds.
“Climate Indicators for Agriculture” was produced through a collaboration between the U.S. Department of Agriculture, Colorado State University and the National Center for Atmospheric Research under an Interagency Agreement with the National Science Foundation and Cooperative Agreement #58-0111-18-015.
Nope. It’s a Denver Water canal built in the 1930s and called upon to shuttle water this summer. The post Is that a new waterslide? appeared first on News on TAP.
Denver Water’s Lead Reduction Program replaces more than 1,000 lead lines, distributes 80,000 pitchers/filters out of the gate. The post Tackling lead at its source, the first six months appeared first on News on TAP.
With scientists divided between hope and despair, a new study finds that the model projecting warming of 4.3 degrees Celsius is “actually the best choice.”
The ice front of Thwaites Glacier in West Antarctica. Photo credit: David Vaughan via the British Antarctic Survey.
When scientists in the early 2000s developed a set of standardized scenarios to show how accumulating greenhouse gas concentrations in the atmosphere will affect the climate, they were trying to create a framework for understanding how human decisions will affect the trajectory of global warming.
The scenarios help define the possible effects on climate change—how we can limit the worst impacts by curbing greenhouse gas emissions quickly, or suffer the horrific outcome of unchecked fossil fuel burning.
The scientists probably didn’t think their work would trigger a sometimes polarized discussion in their ranks about the language of climate science, but that’s exactly what happened, and for the last several months, the debate has intensified. Some scientists say the worst-case, high emissions scenario isn’t likely because it overestimates the amount of fossil fuels that will be burned in the next few decades.
But a new study published [August 3, 2020] in the Proceedings of the National Academy of Sciences argues that the high-end projection for greenhouse gas concentrations is still the most realistic for planning purposes through at least 2050, because it comes closest to capturing the effects “of both historical emissions and anticipated outcomes of current global climate policies, tracking within 1 percent of actual emissions.”
The scenarios, called Representative Concentration Pathways (RCPs), roughly show how much warmer the world will be by 2100, depending on how much more fossil fuel is burned, and how the climate responds. The best-case scenario (RCP 2.6) is the basis for the Paris climate agreement and would lead to warming of about 3.2 degrees Fahrenheit (1.8 Celsius) by 2100. In that scenario, about 10 percent of the world’s coral reefs could survive, and 20 percent of Alpine glaciers would remain.
The worst-case pathway (RCP 8.5) would result in warming of more than 8 degrees Fahrenheit (4.3 Celsius) by 2100, probably killing nearly all the world’s reefs and definitely pushing vast areas of polar ice sheets to melt, raising sea level by as much as 3 feet by 2100.
Even though it’s unlikely that coal burning will increase as envisioned in the worst-case pathway, cumulative greenhouse gas concentrations are still racing upward toward a level that will cause extremely dangerous heating, said Phil Duffy, who co-authored the paper with two other scientists at the Woods Hole Research Center.
“For near-term time horizons, we think it’s actually the best choice because it matches cumulative emissions. What happened over the last 15 years has been about exactly right compared to what was projected by RCP 8.5,” Duffy said. “For those reasons, it’s still a plausible scenario.”
That holds especially true for medium-term planning through 2050, Duffy said, explaining that the study grew out of some work his research institution was doing with the McKinsey Global Institute exploring the socioeconomic consequences of global warming out to about 2040 or 2050.
“Those are the time horizons those guys care about because it affects things like home mortgages,” he said. “And what about out to 2100? Part of what I think about that is, we have different scenarios because we don’t know, and we shouldn’t characterize scenarios by saying, this one is right, this one is wrong. I think you have to be very careful about saying a scenario is wrong or misleading.”
Stanford Earth scientist Rob Jackson, chair of the Global Carbon Project, said it’s important to remember that RCP scenarios were always intended as an intermediate step on the path to developing more accurate projections that include not only the physical effects of greenhouse gases, but also how those effects could trigger amplification of warming, for example by thawing more permafrost that could unleash unexpected quantities of methane, a greenhouse gas much more potent than carbon dioxide in the short term.
“RCP 8.5 was never really ‘business as usual’ … though that’s what it’s called. It’s just an aggressive picture of greenhouse gas emissions. Unfortunately, we’re much closer to it today than anyone would have wanted. It remains a useful metric,” Jackson said.
But that usefulness may have been tarnished by widespread characterization of RCP 8.5 as a “business-as-usual” scenario, said Pep Canadell, executive director of the Global Carbon Project. For a while, “business-as-usual” seemed accurate because of a dramatic increase of coal burning in China, he added.
But Canadell said most of the research suggesting a continued rapid increase in coal use is now about 10 years old. In fact, “coal emissions have been coming down since 2013, when China peaked coal emissions. Somehow, people got stuck with papers published a long time ago, which caught the imagination of many,” he said.
Additionally, many scientists published papers about climate impacts like sea level rise and heat waves based on the worst-case outcome because they wanted to show the dramatic effects of extreme warning, he said. But the Intergovernmental Panel on Climate Change’s global climate assessments don’t suggest that carbon-climate feedback loops like increasing emissions of greenhouse gases from permafrost could lead to a worst-case outcome, he said.
On a hopeful note, Canadell added that the rate of carbon dioxide emissions have slowed over the last two decades, didn’t grow at all during the last two years and “won’t grow much over the coming years or longer. Even if we resume some growth, it will be modest,” he said. “We don’t know the future, but we are going to be hovering at stabilization of CO2 emissions for quite a few years, up to a decade, and by then renewable energy will be certainly meeting more than the excess energy demand.”
The discussion about the worst-case scenario may be distracting from more urgent matters, said Fredi Otto, acting director of the Environmental Change Institute at the University of Oxford.
“I think the scenarios are there because we cannot predict the future and thus need to explore a whole range of scenarios. What is not helpful is to choose just one scenario. And what I think is extremely unhelpful is to call it business as usual,” she said.
“All this discussion goes very much away from the scientific understanding we are actually trying to gain and implies every scientist would have to define publicly where they are on the spectrum between denial and doom,” she said, “and that is a very stupid point we seem to have arrived at.”
The country’s second largest potato producing region, is in its 18th year of drought in 2020. The San Luis Valley in Colorado is known for its agriculture yet only has 6-7 inches of rainfall per year. San Luis Valley via National Geographic
Much of Colorado continues to suffer through extreme drought, and nearly all of the state is experiencing drought, according to the latest data released by the U.S Drought Monitor, a collaboration between the National Oceanic and Atmospheric Administration, the U.S. Department of Agriculture and others.
Climate change could make droughts more severe and more common and disrupt the state’s economy. And while this year’s drought isn’t the most severe of the past decade, it will take “years and years of heavy rain to get back up to normal,” drought monitor author Richard Heim said.
The red on the map below represents extreme drought, while orange represents severe drought…
West Drought Monitor July 28, 2020.
A year ago, Colorado was pleasantly, surprisingly moist. The Western corners of the state were “abnormally dry,” shown in yellow, the lowest level of drought classification by the monitor. The rest of the state, shown in white, was drought-free…
West Drought Monitor August 8, 2019.
But conditions deteriorated over the past year, and a combination of short-term dryness and long-term dryness in the state has led to drought. Heim says Colorado has been in a “persistently dry pattern, in general, for most of the state.”
Colorado has also been suffering from relatively warm temperatures and a high propensity for evaporation. When the air is evaporating water at a higher rate, there is lower humidity and less water in the soil, rivers and reservoirs.
The monsoon late last summer was lackluster, which put the state on the trajectory toward drought. The state was dry going into the winter, and a dry and warm spring contributed to the current conditions…
Another important factor in staving off dryness: snow melt. Colorado’s high country snowpack plays a critical role in maintaining moisture in the state. Alpine snow fields serve as a reservoir, and when the snow melts it feeds rivers and streams and percolates into the soil. The unusually dry spring disrupted this process, and the snow melted too quickly to feed water systems downstream.
The past few months have been particularly dry, with vast portions of the state — shown in red in the map below — suffering from precipitation levels well below average…
Credit: The High Plains Regional Climate Center
Though conditions have worsened in the northwestern corner of the state, they have improved in many other places, particularly in the southern portion of the state…
The improvement is explained at least in part by increasing rainfall in a large part of the state. “So far, the early parts of the monsoon season have been promising,” Colorado State Climatologist Russ Schumacher said.
The drought-stricken southern portion of the state has had more rain in recent weeks, which has made a noticeable impact. Precipitation can temporarily lower fire danger and make a dent in dry conditions, but thunderstorms are not enough to lift a region out of drought…
The long-term outlook for Colorado this summer and early fall suggests the drought will persist. NOAA forecasts predict Colorado will be among the driest parts of the country, relative to its normal levels of precipitation. Most of the state, shown in dark brown, has a 40% chance of seeing lower precipitation than normal. Those are the worst odds in the country, the model shows.
Heat, too, will likely exacerbate the likelihood of sustained drought. Much of Colorado has a 60% likelihood of being hotter than normal in the coming months.
“If it remains warmer than average for an extended period, even if you have normal or above-normal precipitation, it doesn’t really end the drought in that situation,” said Schumacher, the state climatologist.
The heat projection shown above reflects recent trends, as much of the Southwest has become increasingly hot during the summer months in recent years. Experts say the western portion of the U.S. has grown hotter and hotter over the years.
The darker the red in the map below, published by the National Oceanic and Atmospheric Administration, the hotter the area has been trending. According to the model, there is a “clear warming trend,” compared to previous summers.
Summer temperatures across the country have been increasingly high compared to historical norms. The trend is most pronounced in the west. Credit: NOAA
Climate change is causing serious concern among scientists who study drought, because it could make droughts more severe and more common. The changing climate could stress systems necessary for staving off drought.
Colorado’s critical snowpack could be severely hit by climate change. The warming temperatures could shorten the snow season, lead to quicker melting and turn wintertime snow into rain. The high altitude of Colorado’s mountains insulates the state from some of those effects, but it’s not immune. As droughts this summer and in years past demonstrate, changes in snowpack can affect the climate year-round.
A warming climate could also lead to less overall precipitation and increase the rate of all-important evaporation.
“Climate change is water change,” Schumacher said.
Because Colorado already has an arid climate, changes in precipitation caused by climate change can have a major impact on the economy and people’s livelihoods. And while drought in Colorado is not a new phenomenon, scientists are increasingly confident that climate change is playing a role.
“What’s happening in the West is attributed to climate change,” said Heim, the drought monitor.
Paonia, a small town in western Colorado with a handful of mesas rising above it, wouldn’t green-up without water diverted from a river or mountain springs. The lively water travels through irrigation ditches for miles to gardens and small farms below. But this summer, irrigation ditches were going dry, and one, the Minnesota Canal and Reservoir Company, stopped sending water down to its 100-plus customers as early as July 13.
Drought was hitting the state and much of the West hard, but a local cause was surprising: Water theft.
Longtime residents who gather inside Paonia’s hub of information trading, Reedy’s Service Station, have a fund of stories about water theft. It’s not unusual, they say, that a rock just happens to dam a ditch, steering water toward a homeowner’s field. Sometimes, says farmer Jim Gillespie, 89, that rock even develops feet and crosses a road.
But this is comparatively minor stuff, says North Fork Water Commissioner Luke Reschke, as stealing ditchwater is a civil offense. Stealing water from a natural waterway, however, is a crime that can bring fines of $500 per day and jail time. That’s why what was happening to people who depend on the Minnesota Canal company for their fields or gardens was serious: Water was being taken from Minnesota Creek before it could be legally diverted for irrigation to paying customers.
Once the ditch company “called” for its water as of June 8, only holders of patented water rights could legally touch the creek. Yet during three trips to the creek’s beginning, starting in mid-June, and then in mid-July, I noticed that two ranches – without water rights — were harvesting bumper crops of hay. How could that have happened unless they’d illegally diverted water to their fields?
At first, no one would talk about the early-drying ditch except to hint broadly that it wasn’t normal. Then one man stepped up: Dick Kendall, a longtime board member of the Minnesota canal company, and manager of its reservoir. “On July 5,” he told me, “I saw water diverted from the creek onto one of the rancher’s land. And I wasn’t quiet about it.”
Kendall reported what he saw to Commissioner Luke Reschke, who oversees the area’s 600 springs, ditches and canals. Reschke dismissed it, he told me, because “The rumor mill is something else on Minnesota Creek. The only people who give me trouble are the new people who don’t know how the system works.” But locals say that four years back, Reschke’s predecessor, Steve Tuck, investigated when locals complained.
Though it may not be neighborly, stopping any illegal diversion is important, said Bob Reedy, owner of Reedy’s Station: “Without water, you’ve got nothing around here.” Annual rainfall is just 15 inches per year, and without water flowing into irrigation canals from the 10,000-foot mountains around town, much of the land would look like the high desert it truly is.
But it’s not just a couple of high-elevation ranchers dipping into the creek. The West Elk Coal Mine runs large pumps that supply water for its methane drilling and venting operations in the Minnesota Creek watershed.
Mine spokesperson Kathy Welt, said the diversion is legal, and that they only take early-season water when the creek water isn’t on call. That early water, however, is what begins to fill the Minnesota ditch’s reservoir.
In other ways, the mine has damaged the watershed by building a sprawling network of roads in the Sunset Roadless Area (Threats at West Elk Mine). A cease and desist order from the State Division of Reclamation, Mining and Safety on June 10, sought by environmental groups, halted the building of an additional 1.6 miles of new roads this spring (Colorado Sun). Satellite images of the road network resemble a vast KOA Campground: Where trees once held back water and shaded snowpack from early melting, their replacement — gravel roads –- shed water and add to early runoff.
For all of Minnesota Ditch’s challenges, warming temperatures brought about by climate change could be the real challenge. Kendall said that this spring, when he plowed out the Minnesota Reservoir road, dust covered the parched ground beneath the snow.
Water — so precious to grow grapes, hay, organic vegetables and grass-fed beef, and to keep the desert at bay — had vanished early on Lamborn Mesa above Paonia. Farmer Gillespie summed it up, “there’s just no low-snow anymore — and it’s not coming back.”
David Marston. Photo credit: Writers on the Range
David Marston is a contributor to Writers on the Range, (writersontherange.com), a nonprofit dedicated to spurring lively conversation about the West. He lives part-time in Colorado.
As millions of people are recovering from COVID-19, an unanswered question is the extent to which the virus can “hide out” in seemingly recovered individuals. If it does, could this explain some of the lingering symptoms of COVID-19 or pose a risk for transmission of infection to others even after recovery?
A chronic or persistent infection continues for months or even years, during which time virus is being continually produced, albeit in many cases at low levels. Frequently these infections occur in a so-called immune privileged site.
What is an immune privileged site?
There are a few places in the body that are less accessible to the immune system and where it is difficult to eradicate all viral infections. These include the central nervous system, the testes and the eye. It is thought that the evolutionary advantage to having an immune privileged region is that it protects a site like the brain, for example, from being damaged by the inflammation that results when the immune system battles an infection.
An immune privileged site not only is difficult for the immune system to enter, it also limits proteins that increase inflammation. The reason is that while inflammation helps kill a pathogen, it can also damage an organ such as the eye, brain or testes. The result is an uneasy truce where inflammation is limited but infection continues to fester.
A latent infection versus a persistent viral infection
But there is another way that a virus can hide in the body and reemerge later.
A latent viral infection occurs when the virus is present within an infected cell but dormant and not multiplying. In a latent virus, the entire viral genome is present, and infectious virus can be produced if latency ends and the infections becomes active. The latent virus may integrate into the human genome – as does HIV, for example – or exist in the nucleus as a self-replicating piece of DNA called an episome.
A latent virus can reactivate and produce infectious viruses, and this can occur months to decades after the initial infection. Perhaps the best example of this is chickenpox, which although seemingly eradicated by the immune system can reactivate and cause herpes zoster decades later. Fortunately, chickenpox and zoster are now prevented by vaccination. To be infected with a virus capable of producing a latent infection is to be infected for the rest of your life.
Latent infection (left) is when a cell is infected and the virus has inserted its genetic code into our human DNA. The immune system cannot detect this cell as being infected. An HIV infection can shift from latent to active if the infected cell is producing new viruses. ttsz / Getty Images
How does a virus become a latent infection?
Herpes viruses are by far the most common viral infections that establish latency.
This is a large family of viruses whose genetic material, or genome, is encoded by DNA (and not RNA such as the new coronavirus). Herpes viruses include not only herpes simplex viruses 1 and 2 – which cause oral and genital herpes – but also chickenpox. Other herpes viruses, such as Epstein Barr virus, the cause of mononucleosis, and cytomegalovirus, which is a particular problem in immunodeficient individuals, can also emerge after latency.
Retroviruses are another common family of viruses that establish latency but by a different mechanism than the herpes viruses. Retroviruses such as HIV, which causes AIDS, can insert a copy of their genome into the human DNA that is part of the human genome. There the virus can exist in a latent state indefinitely in the infected human since the virus genome is copied every time DNA is replicated and a cell divides.
Viruses that establish latency in humans are difficult or impossible for the immune system to eradicate. That is because during latency there can be little or no viral protein production in the infected cell, making the infection invisible to the immune system. Fortunately coronaviruses do not establish a latent infection.
Could you catch SARS-CoV-2 from a male sexual partner who has recovered from COVID-19?
In one small study, the new coronavirus has been detected in semen in a quarter of patients during active infection and in a bit less than 10% of patients who apparently recovered. In this study, viral RNA was what was detected, and it is not yet known if this RNA was from still infectious or dead virus in the semen; and if alive whether the virus can be sexually transmitted. So many important questions remain unanswered.
Ebola is a very different virus from SARS-C0V-2 yet serves as an example of viral persistence in immune privileged sites. In some individuals, Ebola virus survives in immune privileged sites for months after resolution of the acute illness. Survivors of Ebola have been documented with persistent infections in the testes, eyes, placenta and central nervous system.
Could persistent symptoms after COVID-19 be due to viral persistence?
Recovery from COVID-19 is delayed or incomplete in many individuals, with symptoms including cough, shortness of breath and fatigue. It seems unlikely that these constitutional symptoms are due to viral persistence as the symptoms are not coming from immune privileged sites.
Where else could the new coronavirus persist after recovery from COVID-19?
Other sites where coronavirus has been detected include the placenta, intestines, blood and of course the respiratory tract. In women who catch COVID-19 while pregnant, the placenta develops defects in the mother’s blood vessels supplying the placenta. However, the significance of this on fetal health is yet to be determined.
The mounting evidence suggests that SARS-CoV-2 can infect immune privileged sites and, from there, result in chronic persistent – but not latent – infections. It is too early to know the extent to which these persistent infections affect the health of an individual like the pregnant mother, for example, nor the extent to which they contribute to the spread of COVID-19.
Like many things in the pandemic, what is unknown today is known tomorrow, so stay tuned and be cautious so as not to catch the infection or, worse yet, spread it to someone else.
The 2018 Camp Fire north of Sacramento burned everything in its path: cars, power lines, and buildings – and contaminated local drinking water. Justin Sullivan/Getty Images
In recent years wildfires have entered urban areas, causing breathtaking destruction.
The 2018 Camp Fire in Paradise and Butte County, California was the deadliest and most destructive fire in California’s history. It took 86 lives and destroyed more than 18,000 structures in a matter of hours.
Almost two years later, only a fraction of the area’s 40,000-plus population has returned. This disaster followed the 2017 Tubbs Fire, which killed 22 people in California’s Sonoma and Napa counties.
After both fires, drinking water tests revealed a plethora of acutely toxic and carcinogenic pollutants. Water inside homes was not safe to use, or even to treat. Water pipes buried underground and inside of buildings were extensively contaminated.
We are environmentalengineers who help communities affected by disasters, and supported responses to both fires. As we conclude in a recently published study of burned areas, communities need to upgrade building codes to keep wildfires from causing this kind of widespread contamination of drinking water systems.
Survivors left everything to flee the Camp Fire’s path. Andrew Whelton, Purdue University
Wildfires and water
Both the Tubbs and Camp fires destroyed fire hydrants, water pipes and meter boxes. Water leaks and ruptured hydrants were common. The Camp Fire inferno spread at a speed of one football field per second, chasing everyone – including water system operators – out of town.
After the fires passed, testing ultimately revealed widespread hazardous drinking water contamination. Evidence suggests that the toxic chemicals originated from a combination of burning vegetation, structures and plastic materials.
Firefighting can accelerate the spread of contamination. As emergency workers draw hydrant water, they spread contaminated water through the water pipe network.
Metal, concrete and plastic pipes can become contaminated. Many plastics take up these chemicals like sponges. As clean water later passes through the pipes, the toxic substances leach out, rendering the water unsafe.
In the Tubbs and Camp fires, chemicals in the air may have also been sucked into hydrants as water pipes lost pressure. Some water system plastics decomposed and leached chemicals directly into water. Toxic chemicals then spread throughout pipe networks and into buildings.
Limited water testing by state and local agencies showed benzene and naphthalene were present at levels that could cause immediate harm. These, as well as methylene chloride, styrene, toluene and vinyl chloride exceeded longer-term regulated exposure limits. Many of these chemicals cause cancer. All can cause vomiting, diarrhea and nausea after short-term high concentration exposure.
Anyone who drinks the water containing these substances could be harmed. And simply running a faucet could cause chemicals to enter the air. Hot showers and boiling water would vaporize the chemicals and increase the dose a person breathed in. Some of these substances can also be absorbed through the skin.
Dangerous contamination levels
Benzene was found at concentrations of 40,000 parts per billion (ppb) in drinking water after the Tubbs Fire and at more than 2,217 ppb after the Camp Fire. According to the California Office of Environmental Health Hazard Assessment, children exposed to benzene for a single day can suffer harm at levels as low as 26 ppb.
The U.S. Environmental Protection Agency recommends limiting children’s short-term acute exposure to 200 ppb, and long-term exposure to less than 5 ppb. The EPA regulatory level for what constitutes a hazardous waste is 500 ppb.
In early 2019, California conducted contaminated water testing on humans by taking contaminated water from the Paradise Irrigation District and asking persons to smell it. The state found that even when people smelled contaminated water that had less than 200 ppb benzene, at least one person reported nausea and throat irritation. The test also showed that water contained a variety of other benzene-like compounds that first responders had not sampled for.
The officials who carried out this small-scale test did not appear to realize the significance of what they had done, until we asked whether they had had their action approved in advance by an institutional review board. In response, they asserted that such a review was not needed.
In our view, this episode is telling for two reasons. First, one subject reported an adverse health effect after being exposed to water that contained benzene at a level below the EPA’s recommended one-day limit for children. Second, doing this kind of test without proper oversight suggests that officials greatly underestimated the potential for serious contamination of local water supplies and public harm. After the Camp Fire, together with the EPA, we estimated that some plastic pipes needed more than 280 days of flushing to make them safe again.
Plastic pipes can be damaged by heat and fire contact. Andrew Whelton, Purdue University
Building codes could make areas disaster-ready
Our research underscores that community building codes are inadequate to prevent wildfire-caused pollution of drinking water and homes.
Installing one-way valves, called backflow prevention devices, at each water meter can prevent contamination rushing out of the damaged building from flowing into the larger buried pipe network.
Adopting codes that required builders to install fire-resistant meter boxes and place them farther from vegetation would help prevent infrastructure from burning so readily in wildfires. Concrete meter boxes and water meters with minimal plastic components would be less likely to ignite. Some plastics may be practically impossible to make safe again, since all types are susceptible to fire and heat.
Water main shutoff valves and water sampling taps should exist at every water meter box. Sample taps can help responders quickly determine water safety.
Benzene contamination in the water supply slowed rebuilding efforts in Paradise, Calif., after the Camp Fire.
The smell test doesn’t work
Under no circumstance should people be told to smell the water to determine its safety, as was recommended for months after the Camp Fire. Many chemicals have no odor when they are harmful. Only testing can determine safety.
Ordering people to boil their water will not make it safe if it contains toxic chemicals that enter the air. Boiling just transmits those substances into the air faster. “Do not use” orders can keep people safe until agencies can test the water. Before such advisories are lifted or modified, regulators should be required to carry out a full chemical screen of the water systems. Yet, disaster after disaster, government agencies have failed to take this step.
While infrastructure is being repaired, survivors need a safe water supply. Water treatment devices sold for home use, such as refrigerator and faucet water filters, are not approved for extremely contaminated water, although product sales representatives and government officials may mistakenly think the devices can be used for that purpose.
To avoid this kind of confusion, external technical experts should be called in assist local public health departments, which can quickly become overwhelmed after disasters.
Preparing for future fires
The damage that the Tubbs and Camp fires caused to local water systems was preventable. We believe that urban and rural communities, as well as state legislatures, should establish codes and lists of authorized construction materials for high-risk areas. They also should establish rapid methods to assess health, prepare for water testing and decontamination, and set aside emergency water supplies.
Wildfires are coming to urban areas. Protecting drinking water systems, buried underground or in buildings, is one thing communities can do to prepare for that reality.
Screen shot of the new Northern Water website. Click the image to go to the website.
Click here to to the new website. Easy to navigate and find data:
Northern Water is proud to announce the launch of a new organizational website. The website offers a user-friendly experience with improved navigation and functionality.
With a modern, sleek design, the new website uses enhanced functionality, features and content to tell the story of Northern Water and its commitment to delivering water to more than 1 million people and 615,000 acres of irrigated farmland in Northeastern Colorado while protecting water quality on both sides of the Continental Divide.
Key features of the new website include:
Improved navigation that makes content easy to find;
A search engine that captures targeted results for visitors seeking specific information;
Mobile responsive design that allows website access from any device;
A new data portal that provides real-time data, water quality data and more;
A new customized water accounting portal that empowers water users to manage their portfolio, order and transfer water, and view important documents; and
A news blog to inform the public about Northern Water’s projects, programs and activities. New weekly content will ensure the public is kept up to date on the latest happenings.
The new website has been more than a year in the making with a primary goal of creating a user-friendly platform accessible from any device. Specifically, the goal was to make it easier for visitors to learn about the organization and its rich history, receive project updates and discover ways to more efficiently use water in their landscapes and daily lives.
Click here to score a copy of the paper (William J. Raseman, Joseph R. Kasprzyk, R. Scott Summers, Amanda K. Hohner, and Fernando L. Rosario-Ortiz). Here’s the abstract:
This paper introduces a novel decision-making framework for the optimization of water treatment plant operations. Managers at water utilities face increasing tensions between cost, public health risk, public perception, and regulatory compliance. Multi-objective optimization techniques have been developed to generate innovative solutions to environmental problems with competing objectives. By integrating these optimization techniques with water quality scenarios, water treatment modeling, and interactive visualization, our framework enables water managers to choose among an ensemble of optimal treatment operations. By automating the generation of treatment options, this paradigm represents a shift toward exploration and insight discovery in drinking water decision making. To illustrate this framework, we create a disinfection byproduct (DBP) management problem that incorporates the influence of competing risks and cost objectives on decision making. Using data from the Cache la Poudre River—a source water in Colorado with seasonally-varying water quality—and a hypothetical conventional treatment plant, we evaluate the impact of organic carbon increases on the performance of optimal treatment operations. These results suggest that the hypothetical utility should consider infrastructural improvements if organic carbon concentrations increase more than approximately 25% of maximum historical levels. An interactive exploration of the optimization results reveal to what extent there are tradeoffs between solids handling costs, chemical costs, and DBP exposure. A k-means clustering of these data illustrates that the utility can achieve compliance through a variety of treatment strategies depending on decision maker preferences for cost and risk.
FromThe High Country News (Jonathan Thompson) [July 23, 2020]:
By February, the spread of COVID-19 was already eroding the global economy. First, global travel restrictions depressed the oil market. Then, as the virus reached pandemic proportions, it began hurting even the healthiest industries, throwing the global economy into the deepest rut since the Great Depression.
The recession has been hard on clean energy, which was thriving at the end of last year despite unhelpful, even hostile, policies from the Trump administration. Between 2009 and 2019, solar and wind generation on the U.S. electrical grid shot up by 400%, even as overall electricity consumption remained fairly flat. Renewable facility construction outpaced all other electricity sources, but the disease’s effects have since rippled through the sector, wiping out much of its previous growth.
Graphic credit: The High Country News
Global supply chains for everything from solar panels to electric car components were the earliest victims, as governments shut down factories, first in China, then worldwide, to prevent transmission of the disease. Restrictions on construction further delayed utility-scalesolar and wind installations and hampered rooftop solar installations and energy efficiency projects. The setbacks are especially hard on the wind industry, because new wind farms must be up and running by the end of the year to take advantage of federal tax credits. Meanwhile, the general economic slowdown is diminishing financing for new renewable energy projects.
Graphic credit: The High Country News
Clean energy, which has shed more than 600,000 jobs since the pandemic’s onset, is only one of the many economic sectors that are hurting. In just three months, COVID-19 wiped out more than twice as many jobs as were lost during the entire Great Recession of 2008. The impacts have reverberated throughout the Western U.S., from coal mines to tourist towns, and from casinos to dairy farms. Some industries, including clean energy, bounced back slightly in June, as stay-at-home orders were dropped and businesses, factories and supply chains opened back up. But a full recovery — if it happens — will largely depend on government stimulus programs and could take years.
Graphic credit: The High Country News
In just three months, COVID-19 wiped out more than twice as many jobs as were lost during the entire Great Recession of 2008.
Contracted workers clean mirrors at the Ivanpah Solar Project in Nipton, California. In 2017, the facility employed over 65 workers and created 2,600 jobs during it’s three year construction period. Dennis Schroeder/National Renewable Energy Laboratory via The High Country News
Infographic design by Luna Anna Archey; Graphics by Minus Plus; Sources: Solar Energy Industries Association, BW Research Partnership, U.S. Bureau of Labor Statistics, U.S. Energy Information Administration, Taxpayers for Common Sense, Opportunity Insights Economic Tracker, Wyoming Department of Workforce Services, New Mexico Workforce Connection, Utah Department of Workforce Services.
Jonathan Thompson is a contributing editor at High Country News. He is the author of River of Lost Souls: The Science, Politics and Greed Behind the Gold King Mine Disaster. Email him at jonathan@hcn.org.
A dense floating mat of algae is seen on the Susquehanna Flats near Treasure Island and Havre de Grace, Md., on Aug. 2, 2019. Photo: Will Parson/Chesapeake Bay Program (CC BY-NC 2.0)
More frequent, longer-lasting blooms can harm both wildlife and human health — and even kill. Can we learn to predict and prevent them?
From the fall of 2017 to the beginning of 2019, Florida endured a persistent and damaging algal bloom caused by the algae Karenia brevis, also known as red tide. The blooms formed in both Gulf and Atlantic waters, sickening people, killing birds, fish, dolphins, manatees and other marine animals, and driving visitors away from beach towns.
Scientists say it’s a problem that’s going to get worse — and not just in Florida. Harmful algal blooms, which can occur in both fresh and marine waters, are becoming more frequent, lasting longer, and occurring in more places. In recent weeks news reports have warned residents in western New York, Utah and California to stay out of rivers and lakes clouded with these microscopic organisms that can sometimes be fatal to people, pets and wildlife.
To be clear, not all algae are dangerous. In fact the vast majority are beneficial to ecosystems. They’re the base of the marine and aquatic food webs, providing nutrients for fish and shellfish, which in turn feed other animals — including people. They also produce half of our oxygen.
“But a small handful of these organisms are harmful,” says phytoplankton ecologist Pat Glibert of the University of Maryland Center for Environmental Science.
We spoke with Glibert about this tiny — but dangerous group — of algae, why they’re becoming more problematic, and what we can do to protect people and ecosystems.
When algae are deemed to be harmful, what is it that they’re harming and how?
University of Maryland phytoplankton ecologist Pat Glibert. Photo: Courtesy of Pat Glibert via The Revelator
Some algae can grow to levels that just create a nuisance. They can overwhelm the system and when they die, their decomposition uses up oxygen, causing dead zones in the sea or fresh waters.
In the case of red tides — named because they visibly color the water a red or sometimes brownish color — their growth reduces the light penetration in the water. So the organisms that live near the bottom, such as sea grasses, are harmed, and the organisms that depend on that bed of grass in the water are also harmed.
But some of these species actually make toxins that can cause fish kills or harm to other marine organisms. And they can also cause harm for humans when we consume the fish or shellfish that has consumed these organisms.
These harmful algal blooms can occur all over. What are the regional differences in the kind of algae and their potential harm?
In marine waters we are primarily concerned with a group of organisms called dinoflagellates. And in fresh waters, the major organisms of concern fall in a category called cyanobacteria. They make very different toxins and have very different effects both environmentally as well as with regard to human health.
The freshwater toxins are concerning for a number of reasons. On initial exposure one may have a skin rash or something uncomfortable that’s relatively mild. But they can get into drinking water and, over a long period of exposure, they are tumor promoters. We know liver cancer is associated with these toxins, and there’s increasing evidence that the freshwater toxins can also be associated with neurological diseases such as Alzheimer’s, Parkinson’s or ALS. There’s a lot of work going in right now to understand that relationship.
In marine waters we’re typically exposed to toxins through shellfish. The shellfish themselves are not affected by these toxins because a lot of them affect the nervous system and shellfish don’t have a nervous system. But shellfish can accumulate the toxin. One of the diseases that we are very concerned about comes from saxitoxin, which is most common if one is eating mussels. It’s from the dinoflagellate Alexandrium and it can cause paralytic shellfish poisoning. It results in respiratory paralysis. With a high enough dose people do die.
A different toxin is the Florida red tide. That toxin can become aerosolized. If people breathe that sea spray at the beach it can cause respiratory distress, including coughing. Many people can end up going to the hospital, but people aren’t likely to die from it. The other thing that many of the toxins cause is an upset stomach that may take a couple of days to get over, but people do recover.
What about the effects on wildlife?
That depends on the species of algae. But some things like Karenia brevis in Florida are indiscriminate killers. Fish, turtles, manatees are all affected.
Dead fish on the shore of Padre Island as a result of a harmful algal bloom. Photo: Terry Ross, (CC BY-SA 2.0)
In California there’s a toxic diatom species, Pseudo-nitzschia, and it seems to affect sea lions and other large marine organisms. They tend to show symptoms very similar to epilepsy and disorientation. Death is one end point, but there are many other impacts on these organisms as well.
What’s driving the growth of these harmful algal blooms?
We certainly know that blooms are increasing in frequency, in geographic extent, and in duration in many parts of the United States and the world. A lot of this is due to the fact that we are polluting these waters with nutrients — nitrogen and phosphorus runoff from the land.
Nutrient pollution can come from wastewater, whether it’s discharged from municipal sewage treatment plants or from septic systems. We don’t always do an adequate job, in many places, of removing those nutrients.
That’s one source. A second is runoff from fertilizer application, particularly from agricultural use, but we use a lot of these fertilizers on our lawns, golf courses and gardens as well.
And then there’s the waste from concentrated animal feeding operations, whether it’s chickens or pigs or dairy. A lot of that waste is either held in lagoons and ultimately spread on land. Or it goes into the atmosphere and then comes down with rain. So these operations themselves are highly concentrated sources of pollution that end up in waterways.
The other issue is that the climate is changing. Waters are getting warmer. Many organisms grow better when waters are warmer. That’s true for some of these [algae] species.
But because of climate change we’re also seeing changes in precipitation. We’re having more storms in some areas, more hurricanes, and because the atmosphere is now warmer, when those hurricanes do develop, they are often holding more moisture. So hurricanes become wetter. That means that the rain that comes with these storms washes more of these nutrients into the sea.
What can we do to reduce these blooms?
This is a very difficult problem to solve. The ultimate solution is to try to reduce nutrients that are winding their way into our fresh and marine waters.
At a personal level, we can reduce the amount of nutrient fertilizer we put on our own lawns, but the pollution that comes from the concentrated animal operations, from municipal sewage and from crop agriculture are the big issues that we have to solve. And they’re going to be very difficult to solve because we have to continue to grow our food.
There are approaches that people are taking to try to address blooms at the time that they occur, methods to apply various products to reduce the bloom. There is some success in applying clay to the surface of the water that causes the dinoflagellates to fall to the bottom of the bay or estuary. But those are very localized solutions.
Aerial photo of an algal bloom in Virginia’s James River near the Monitor-Merrimack Bridge. Photo: Wolfgang K. Vogelbein, (CC BY-NC-ND 2.0)
The other approach that we are taking is to build mathematical models of when and why and where a bloom may occur and use that as an early warning system. So we may not be able to solve the problem, but at least we can protect human health or seafood resources before a problem occurs.
There are also a number of exciting areas of research. One is my own, which focuses on understanding these organisms from their physiology — how they obtain their nutrients, how they make toxins, why they make toxins. How is nutrient pollution related to not only growth of the algae but production of their toxin?
Also the other area that I think is so exciting is really pulling all of these factors together in building predictive models and using models to ask questions of “what if we did this, what would it show”? Or “what if we did that, what would be that effect”? We’re making great progress, but the problem is still a very large one.
Has our response to the problem matched the scale of what’s needed and the urgency of the issue?
It always seems to be in the forefront at the time there’s a bloom. And then as soon as that bloom subsides, the public interest and the interest in solving the problem go away.
Clearly we need more money to address issues of nutrient pollution. We need to upgrade sewage treatment plants. We need to address the fact that so much of the country still depends on septic systems or very small “package plant” [treatment systems] that do nothing to reduce nutrients.
The issue of concentrated animal waste is enormous because the animal waste isn’t treated and does make its way into the environment by land or sea or atmosphere, and ultimately gets discharged into waterways.
We need more attention on those issues. We need more attention on developing preventative measures. We need to have more approaches to protect human health from these events because they are going to be increasing.
The outlook is for more blooms and longer blooms in more places if we don’t address all of these problems of nutrient pollution and climate change collectively.
Tara Lohan is deputy editor of The Revelator and has worked for more than a decade as a digital editor and environmental journalist focused on the intersections of energy, water and climate. Her work has been published by The Nation, American Prospect, High Country News, Grist, Pacific Standard and others. She is the editor of two books on the global water crisis.
Andy Rossi now manages the conservation district following more than a decadelong tenure with the group. The change comes after the retirement of former manager Kevin McBride, who managed the district since 2009.
Rossi joined the group that same year as its district engineer. His knowledge of the district’s facilities and operations near the headwaters of the Yampa River, namely Yamcolo and Stagecoach reservoirs, was a major factor in the board’s decision to promote him, according to a news release. Before that, he worked at multiple consulting firms specializing in water resources…
Rossi also will oversee the implementation of the district’s new strategic plan. Among the plan’s goals include developing long-term financial sustainability, protecting local water from out-of-district transfers and improving watershed management.
With regards to that last goal, Rossi noted a need to utilize new technology and scientific-based studies for water management. For example, one of the panelists at a recent Yampa Basin Rendezvous discussion, snowpack researcher Dr. Jeffrey Deems, described his work with the Airborne Snow Observatory.
The observatory uses specialized aircraft equipped with sensors to collect data on snowmelt across entire regions of mountains and their waterways. The data has helped communities to better manage their water supplies.
According to Deems, the Kings River Water Association in California was able to avoid a flood declaration in 2019, which led to savings of $100 million, by basing its dam release policy on forecasts from the Airborne Snow Observatory instead of traditional measurements.
Rossi said he would like to incorporate some of the observatory’s data next year on a trial basis, which also would help the researchers receive feedback on the new technology…
These efforts have the overarching goal of preserving the health of the Yampa River for the people, plants and creatures that depend upon it. Rossi described the river as the most important natural resource in the area.
“It is the natural resource that defines this valley,” he said.
To that end, Rossi aims to maintain the district’s existing facilities, such as the dam at Stagecoach Reservoir, which not only helps to meet water demands for a growing community but also generates hydroelectric power.
The Upper Yampa Water Conservancy District formed in 1966 following the passage of the Water Conservancy Act of the state of Colorado. Its mission has been conserving, developing and stabilizing supplies of water for irrigation, power generation, manufacturing and other uses.
Stagecoach Reservoir. Photo credit Upper Yampa River Water Conservancy District.
Here’s the release from the Environmental Protection Agency:
New grant program continues implementation of…Administration’s Federal Action Plan to Reduce Childhood Lead Exposure
(July 30, 2020) — Today, the U.S. Environmental Protection Agency (EPA) announced a new grant program to help protect children in tribal communities from lead in drinking water at schools and childcare facilities. With this action, the agency is continuing to make meaningful progress under the Trump Administration’s Federal Action Plan to Reduce Childhood Lead Exposures by engaging with tribes and working to protect childrens’ health in these underserved communities.
“Protecting children in tribal communities from lead in drinking water is a priority for the Trump Administration and EPA,” said U.S. EPA Administrator Andrew Wheeler. “This new funding helps tribes further reduce lead in drinking water by boosting testing for lead in schools and childcare centers. This, in turn, will increase the health and wellbeing of the coming generation.”
Authorized by the Water Infrastructure Improvements of the Nation (WIIN) Act, EPA is making $4.3 million available to support the Lead Testing in School and Child Care Program Drinking Water Tribal Grant Program. Grantees will use the EPA’s 3Ts for Reducing Lead in Drinking Water guidance to implement lead testing programs and develop monitoring, maintenance and/or sampling plans that protect children from lead exposure now and in the future. Beneficiaries of the program must be members of a federally-recognized tribe. EPA will host a webinar in August to provide more information about the 3Ts toolkit and an overview of the grant and its scope.
While the U.S. has made tremendous progress in lowering children’s blood lead levels, some children are still exposed to high levels of lead. In December 2018, EPA with other federal partners announced the Federal Action Plan to Reduce Childhood Lead Exposures. Today’s announcement continues the agency’s significant progress in implementing this plan.
Most of the West has been experiencing drought this year. Bart Miller, with the environmental group Western Resource Advocates, said that the water levels we are seeing this year are nothing new.
“It’s kind of slightly below average for Wyoming and even more below average for the rest of the Colorado River Basin states,” he said. “We’re part of a trend, or at least if you look over the last 20 years, there’s been consistent below average stream flow, snowpack and just water to work with.”
Miller said areas in Colorado and other more southern states are much drier this year compared to Wyoming.
This winter had an average snowpack, but that it melted fairly early or evaporated quickly, he said. The inflow into Lake Powell from states including Wyoming, Colorado and Utah is projected to be 61 percent of average this year…
“Much of the state, at least half the state, is in one form of drought or another. That’s having some impact, certainly on folks irrigating but also on folks who like to fish and recreate in the outdoors,” he said. “As stream flows get low and as we get more and more years of drought, we’re seeing some of those benefits and attributes becoming more challenging.”
Recent rains from a plume of monsoon moisture have led to drought improvements across southern Colorado according to the latest report from the National Drought Mitigation Center.
Extreme drought – the second worst category – receded in Montezuma and Dolores counties. Extreme conditions also fully retreated from Otero County, and nearly disappeared from Bent and Prowers counties. Northern and eastern Baca County also saw improvements extreme drought. In each of the areas, severe drought replaced extreme conditions.
Colorado Drought Monitor July 28, 2020.
Northwest Colorado saw moderate drought overtake abnormally dry conditions in northern Moffat County, along with all of Routt and Jackson and most of Grand and Summit counties. The remainder of Eagle County also moved from abnormally dry to moderate drought, as did northwest Larimer County.
In northeast Colorado, severe drought reached northeast Logan and northwest Sedgwick counties, while slipping back to moderate drought elsewhere in the two counties. Severe conditions all but disappeared from Phillips County and much of eastern Yuma County. Northeast Cheyenne County in east central Colorado moved from severe conditions to moderate drought.
This week’s crop progress and condition report noted that non-irrigated crop and pasture areas continued to decline in the face of drought, with some spring crops about to fail without rain.
A drought-free area in Larimer, Weld, Boulder, Broomfield, Jefferson and Gilpin counties turned abnormally dry, while northeast Weld County became drought-free.
Many of the improved areas saw an inch or more of rain over the past week. In some cases, heavy rains caused flash flooding. Despite the improvements, the U.S. Monthly Drought Outlook for August paints a grim picture for the state. Existing drought is expected to persist across Colorado, while remaining abnormally dry areas are predicted to move into drought conditions over the course of the month. Drought improvements are not forecast anywhere in Colorado. Above-normal temperatures are also expected throughout August.
August 2020 Drought Outlook via the Climate Prediction Center
Overall, just one percent of Colorado is drought-free, down from 3 percent last week. Abnormally dry conditions cover 16 percent of the state compared to 23 percent in the previous report. Moderate drought moved up 11 percent to 25, while severe drought also increased three percent to 32. Extreme drought shrank to 27 percent from 32 percent.
Moderate to extreme drought conditions cover 84 percent of the state. The total exceeds 100 percent due to rounding.
Submerged houses after floods in bangladesh. Photo: Bangladesh Department of Disaster Management
Here’s an in-depth look at the current flooding disaster in Bangladesh from SominiSengupta and Julfikar Ali Manik that’s running in The New York Times. Click through and read the whole article. Here’s an excerpt:
The country’s latest calamity illustrates a striking inequity of our time: The people least responsible for climate change are among those most hurt by its consequences.
Torrential rains have submerged at least a quarter of Bangladesh, washing away the few things that count as assets for some of the world’s poorest people — their goats and chickens, houses of mud and tin, sacks of rice stored for the lean season.
It is the latest calamity to strike the delta nation of 165 million people. Only two months ago, a cyclone pummeled the country’s southwest. Along the coast, a rising sea has swallowed entire villages. And while it’s too soon to ascertain what role climate change has played in these latest floods, Bangladesh is already witnessing a pattern of more severe and more frequent river flooding than in the past along the mighty Brahmaputra River, scientists say, and that is projected to worsen in the years ahead as climate change intensifies the rains.
By Blacki Migliozzi·Source: Institute of Water and Flood Management, Bangladesh University of Engineering and Technology
This is one of the most striking inequities of the modern era. Those who are least responsible for polluting Earth’s atmosphere are among those most hurt by its consequences. The average American is responsible for 33 times more planet-warming carbon dioxide than the average Bangladeshi.
This chasm has bedeviled climate diplomacy for a generation, and it is once again in stark relief as the coronavirus pandemic upends the global economy and threatens to push the world’s most vulnerable people deeper into ruin.
An estimated 24 to 37 percent of the country’s landmass is submerged, according to government estimates and satellite data By Tuesday, according to the most recent figures available, nearly a million homes were inundated and 4.7 million people were affected. At least 54 have died, most of them children.
The current floods, which are a result of intense rains upstream on the Brahmaputra, could last through the middle of August…
Poor countries have long sought a kind of reparations for what they call loss and damage from climate change. Rich countries, led by the United States and European Union, have resisted, mainly out of concern that they could be saddled with liability claims for climate damage.
It doesn’t help that the rich world has failed to deliver on a $100 billion aid package to help poor countries cope, promised as part of the 2015 Paris accord.
Here’s the release from the Colorado River District (Jim Pokrandt):
In the fight over Colorado River water, senior water rights dictate which direction the river flows: west on its natural route from the Continental Divide or east through tunnels to the Front Range. On the mainstem of the Colorado, the most heavily diverted of the river’s basins, two historic structures have much to say about providing water security for Western Colorado: the Shoshone Hydropower Plant in Glenwood Canyon and the Grand Valley Diversion Dam
in DeBeque Canyon.
The next program in the Colorado River District’s “Water With Your Lunch” webinar series on Zoom will explore the importance of Shoshone and the Grand Valley Roller Dam to all West Slope water users. The webinar is set for noon, Wednesday, Aug. 5.
Panelists for the discussion include Andy Mueller, general manager for the Colorado River District; Mark Harris, manager of the Grand Valley Water Users Association in Grand Junction; Fay Hartman, conservation director, Colorado River Basin Program at American Rivers and Jim Pokrandt, community affairs director of the Colorado River District.
The Shoshone Hydropower Plant holds the oldest, major water right on the mainstem of the river, 1,250 cubic feet a second dated 1902. When river flows ebb after the spring runoff, Shoshone contributes most of the Colorado River’s water in Glenwood Canyon. In turn, those flows support year-round recreation opportunities and the economic benefits that come with them on the mainstem of the Colorado. The Roller Dam is where most of a suite of old water rights called the “Cameo call,” are diverted. Much of this water today provides water for both abundant agriculture and municipal water users along the mainstem of the river.
Both structures command the river, pulling water downstream that might otherwise be diverted to the Front Range through transmountain diversion tunnels. Shoshone and Cameo water rights are filled before these diversions under the prior appropriation system. When either or both rights are calling, junior diverters must cease or replace the water they take out of priority, keeping our West Slope water flowing west and benefitting water users, recreation and ecosystems along the way, from Grand County to the Grand Valley.
“The Colorado River District was created in 1937 to protect West Slope water and keep water on the Western Slope,” says Andy Mueller, General Manager for the Colorado River District. “The Shoshone and Cameo calls play a vital role in that effort to keep our rivers flowing and our crops growing.”
The Shoshone hydro plant in Glenwood Canyon, captured here in June 2018, uses water diverted from the Colorado River to make power, and it controls a key water right on the Western Slope. Photo credit: Brent Gardner-Smith/Aspen Journalism
Number of days the Shoshone outage protocol, or ShOP, was in effect, and stages of the agreement.
The penstocks feeding the Shoshone hydropower plant on the Colorado River in Glenwood Canyon. Photo credit: Brent Gardner-Smith/Aspen Journalism
Xcel truck at Shoshone plant. Photo credit: Brent Gardner-Smith/Aspen Journalism
The blown-out penstock in 2007 at the Shoshone plant. Photo credit: Brent Gardner-Smith/Aspen Journalism
Shoshone Hydroelectric Plant back in the days before I-70 via Aspen Journalism
Shoshone Falls hydroelectric generation station via USGenWeb
Shoshone hydroelectric generation plant Glenwood Canyon via the Colorado River District
In response to decreasing flows and a dry forecast weather pattern in the San Juan River Basin, the Bureau of Reclamation has scheduled an increase in the release from Navajo Dam from 500 cubic feet per second (cfs) to 600 cfs on Monday, August 3rd, starting at 4:00 AM. Releases are made for the authorized purposes of the Navajo Unit, and to attempt to maintain a target base flow through the endangered fish critical habitat reach of the San Juan River (Farmington to Lake Powell).
The San Juan River Basin Recovery Implementation Program has recommended base flows as close to 500 cfs as possible for the summer of 2020. This is within their normal recommended range of 500 to 1,000 cfs. The target base flow is calculated as the weekly average of gaged flows throughout the critical habitat area from Farmington to Lake Powell.
A boater, John Dufficy, makes his way down the lower end of the San Juan River toward the take-out, in 2014. Photo Credit: Aspen Journalism/Brent Gardner-Smith
Colorado begins conversation about how to crimp natural gas use in new buildings
Colorado has started talking about how to curtail natural gas in new buildings necessary to achieve the dramatic reductions in greenhouse gas emissions during the next 10 to 30 years as specified by state law.
Agreement has been reached among several state agencies and the four distribution companies regulated by the state’s Public Utilities Commission to conduct discussions about future plans for pipelines and other infrastructure projects of more than $15 million. The agreement proposes to take a long view of 10 to 20 years when considering natural gas infrastructure for use in heating, cooking and hot-water heating.
The four utilities—Xcel Energy, Black Hills Colorado, Atmos Energy, and Colorado Natural Gas—altogether deliver gas to 1.73 million customers, both residential and business.
Unlike a toaster or even a kitchen stove, which you can replace with relative ease and cost, gas infrastructure comes with an enormous price tag—and expectation of a long, long time of use. For example, it would have cost $30,000 per unit to install natural gas pipes at Basalt Vista, an affordable housing project in the Roaring Fork Valley. Alternative technology is being used there.
Gas infrastructure is difficult to replace in buildings where it exists. As such the conversation getting underway is primarily about how to limit additional gas infrastructure.
“Given the long useful lives of natural gas infrastructure investments, the (Colorado Energy Office) suggests that this type of forward-looking assessment should include any significant upgrades to existing natural gas infrastructure or expansion of the gas delivery system to new residential developments,” the state agency said in a June 8 filling.
This is adapted from the July 23, 2020, issue of Big Pivots. Subscribe for free to the e-magazine by going to Big Pivots.
Meanwhile, the three Public Utility Commission plans one or more informational session later this year to learn about expectations of owners of natural gas distribution systems by Colorado’s decarbonization goals and the implications for the capital investments.
HB 19-1261, a Colorado law adopted in May 2019, charged state agencies with using regulatory tools to shrink greenhouse gas emissions from Colorado’s economy 50% by 2030 and 90% by 2050.
Utilities in Colorado have said they intend to close most of the coal plants now operating no later than 2030. The coal generation will be replaced primarily by renewables. That alone will not be nearly enough to meet the state’s ambitious decarbonization goals. Carbon emissions must also be squeezed from transportation—already the state’s leading source of carbon dioxide— buildings, and other sectors.
“No single strategy or sector will deliver the economy-wide greenhouse gas reductions Colorado needs to meet its science-based goals, but natural gas system planning is part of the silver buckshot that can get us there,” said Keith Hay, director of policy at the Colorado Energy Office in a statement.
“When it comes to gas planning, CEO is focused on opportunities to meet customers’ needs that will lead to a more efficient system, reduce overall costs, and reduce greenhouse gas pollution.”
Roughly 70% of Coloradans use natural gas for heating.
While gas utilities cannot refuse gas to customers, several real estate developers from Arvada to Pueblo and beyond have started crafting homes and other buildings that do not require natural gas. Instead, they can use electricity, passive solar, and a technology called air-source heat pumps to meet heating, cooling and other needs. Heat pumps provide a key enabling technology.
A glimpse of this low-carbon future can be seen at Basalt Vista, a housing project in Pitkin County for employees of the Roaring Fork School District and other local jurisdictions. The concept employed there and elsewhere is called beneficial electrification.
In setting out to ramp down growth in natural gas consumption, Colorado ranks among the front-tier of states, lagging only slightly work already underway in California, Minnesota and New York.
Community bans
In the background of these discussions are rising tensions. In California, Berkeley a year ago banned natural gas infrastructure in new developments, and several dozen other cities and counties followed suite across the country.
Protect Colorado, an arm of the oil-and-gas industry, had been collecting signatures to put Initiative 284 on the ballot, to prevent restrictions on natural gas in new buildings. The group confirmed to Colorado Public Radio that it was withdrawing that and other proposals after negotiations convened by Gov. Jared Polis and environmental groups.
Emissions of methane—the primary constituent of natural gas and one with high but short-lived heat-trapping properties—can occur at several places along the natural gas supply chain beginning with extraction. Colorado ranked 6th in the nation in natural gas production in 2018, according to the U.S. Energy Information Agency.
Hydrocarbon processing in the Wattenberg Field east of Fort Lupton, Colo., on July 2, 2020. Photo/Allen Best
In 2017, according to the Environmental Protection Agency, 4% of all greenhouse gas emissions in the United States were the result of extraction, transmission, and distribution of natural gas. However, several studies have concluded that the EPA estimate skews low. One 2018 study 2018 estimated that methane emissions from the oil and gas supply chain could be as much as 60% higher than the EPA estimates.
Greenhouse gas emissions also occur when natural gas is burned in houses and other buildings, creating carbon dioxide. An inventory released in December 2019 concluded that combustion of natural gas in houses was responsible for 7.7% of Colorado’s energy-related greenhouse gas emissions.
Just how the shift from natural gas to electricity will affect utilities depends upon the company. For Atmos Energy, a company with 120,000 customers in Colorado, from Greeley to Craig, from Salida to Cortez, gas is just about everything.
Xcel’s talking points
Xcel Energy, the state’s largest utility, sells both gas and electricity. In theory, it will come out whole. But it has been leery about moving too rapidly. Technology advances and costs declines have not yet arrived in the natural gas sector, observed, Jeff Lyng, director of energy and environmental policy for Xcel, in a June 8 filing with the PUC.
Still, Xcel is willing to have the conversation. Lyng pointed to efforts by Xcel to improve efficiency of natural gas use. The company is also participating in industry programs, including One Future, which are trying to limit methane emissions from the natural gas supply chain to less than 1%. For Xcel, he explained, that includes replacing older pipes with new materials that result in fewer emissions. It also means using the company’s purchasing power to push best practices that minimize emissions.
The company intends to offer options to customer, including incentives for electric water heaters programmed to take advantage of renewable energy when it is most readily available. That tends to be at night.
Xcel sees an opportunity to work with builders and developers to design all-electric new building developments to avoid the cost of installing natural gas infrastructure.
“This may require high-performance building envelope design, specifying certain appliances and, especially load management,” Lyng wrote in the filing. “Load management is key to ensuring these new electric devices interact with the power grid and are programmed to operate as much as possible during times when there is excess renewable energy or the lowest cost electricity on the system.”
Not least, Xcel conceded a role for air-source heat pumps, the crucial piece of technology employed in most places to avoid natural gas hookups. Heat pumps can be used to extract both cool and warm air from outdoor air as needed. Xcel sees the technology being an option when customers upgrade air conditioning units with spillover benefits for heating.
“Through this option, given the cooling and heating capacity of air source heat pumps, some portion of customer heating load can be offset through electrification, while maintaining their natural gas furnace or boiler as a back-up.”
Others think air-source heat pumps can have even broader application, especially in warmer areas of the state.
Short-term costs may be higher for electrified buildings. “This will improve over time as electric technologies decline in cost and as the electric system becomes cleaner,” Lyng said. Xcel, he added, favors a voluntary approach: pilot programs that expand.
Lyng, in his testimony, warned against trying to ramp up electrification too quickly. In 2019, he pointed out, the maximum daily demand for natural gas had the energy equivalent of 26,000 megawatts of electricity—more than three times the company’s electrical peak demand.
An unintended consequence may be adverse impacts to people of low income. The thinking is that as the demand for natural gas declines, the cost will actually go up per individual consumer.
“As a smaller and smaller pool of customers is left to pay for infrastructure costs, the large the cost impact will be for each remaining customer,” explained Dr. Scott England, from the state’s Office of Consumer Counsel, in a filing.
Social cost of methane?
Xcel has also explored the opportunities with renewable natural gas. At its most basic level, renewable natural gas involves harvesting biogas from wastewater treatment plants, landfills and dairies. In its first such venture in Colorado, Xcel last fall began getting 500,000 cubic-feet per day of methane from the treatment plant serving Englewood, Littleton and smaller jurisdictions along the South Platte River in metropolitan Denver.
A bill introduced in Colorado’s covid-shortened legislative proposed to create a renewable gas standard, similar to that first specified by voters in 2004 for electricity. SB-150 proposed targets of 5%, 10% and 15% for regulated utilities, encouraging greater use of biogas from landfills, dairies and other sources.
The sponsor, Sen. Chris Hansen, D-Denver, said he plans to reintroduce the bill the next session,
Hansen said he may also introduce a bill that would require the PUC to apply the filter of a social cost of methane to its decisions when evaluating alternatives. This would be similar to the cost of carbon, currently at $46 a ton, now applied to resource generating alternatives.
Longer term, Xcel wants to explore opportunities to produce hydrogen from renewable energy to blend into the natural gas distribution system at low levels or converted back to synthetic gas.
The Sierra Club may push back on efforts to convert to synthetic gas. The organization recently released a report that found significant problems with renewable natural gas, a phrase that is now being used by some companies—not necessarily Xcel—to include far more than the biogas from landfills. The Sierra Club estimates that there’s enough “natural” biogas to meet 1% of the nation’s current needs for natural gas. Other estimates put it far higher.
There will be implications left and right from this transition from gas to electricity. Lyng pointed out that solar energy will have lower value, because of its inability to replace natural gas on winter nights.
For the testimony of Jeff Lyng and Keith Hayes and a few dozen more, as well as the filings as of July 29, go to the Colorado PUC website and look up case 20AL-0049G.
Here’s the release from the Colorado State Forest Service:
[On July 28, 2020], The Conservation Fund, Colorado State Forest Service and USDA Forest Service announced the permanent protection of the 16,723-acre Banded Peak Ranch in Colorado’s southern San Juan Mountains. The protected land will connect a largely undisturbed forest landscape, prevent development in critical wildlife corridors and conserve an essential watershed that provides water to Colorado and New Mexico communities downstream. The federal Land and Water Conservation Fund played a critical role to permanently safeguard these private forestlands from the threat of development.
Banded Peak Ranch. Photo credit: Christine Quinlan via the Colorado State Forest Service
The completion of a conservation easement on Banded Peak Ranch is the final phase of a 30-year effort by The Conservation Fund in the Navajo River Watershed – protecting a total of 65,000 acres that connect wilderness ranches in the upper reaches of the watershed to conserved working ranches at lower elevations on the Navajo, Little Navajo and East Fork of the San Juan rivers. Permanent protection of these lands is the product of public-private partnerships involving 10 different ranches. Over the years, the Navajo River watershed project area has attracted $37 million from federal, state and private partners, including private foundations, Great Outdoors Colorado (GOCO), the federal Forest Legacy Program, which is managed in Colorado by the Colorado State Forest Service, and private landowner donations.
These privately owned lands are surrounded by some of the most remote, expansive and undisturbed national forest and wilderness lands in Colorado. As the last, large unprotected property in the upper Navajo River watershed, Banded Peak Ranch completes the protection of a wilderness watershed and preserves one of the most important wildlife migration corridors for mule deer and elk in the Rocky Mountain region.
“The headwaters of the Navajo River is one of the wildest and most pristine landscapes we have protected in Colorado. It is a majestic place that has inspired many others to join us in the effort,” said Tom Macy, Western Representative of The Conservation Fund. “If we are going to see grizzlies return to Colorado, it is likely to be here.”
Critical Water Supply, Wildlife Habitat, Working Forests
San Juan River Basin. Graphic credit Wikipedia.
The watershed has critically important benefits for downstream users in Colorado and New Mexico, providing irrigation and drinking water for 1 million people in New Mexico, including 90 percent of Albuquerque’s surface water supply. Protecting Banded Peak safeguards 33 miles of streams on the ranch, including a 5-mile stretch of the Navajo River, along with 850 acres of riparian and wetland habitat.
Banded Peak Ranch – roughly 20 miles southeast of Pagosa Springs – hosts a premier deer and elk hunting program that provides stimulus to the regional economy, while the carefully managed timber operation supports regional wood processing mills. The ranch has been an active participant in the Colorado State Forest Service’s Forest Ag program for two decades and manages its forests with the guidance of a management plan written in conjunction with the agency.
“Our family has been dedicated to land conservation and land stewardship in Colorado and elsewhere for many years,” said Karin Griscom, the family’s representative. “We were privileged to partner with The Conservation Fund, which has diligently worked with us to protect strategic lands and wildlife corridors in the Upper Navajo River watershed over the last 20 years. We also greatly appreciate the help of the U.S. Forest Service and the Colorado State Forest Service, elected officials and especially the Wyss Foundation that were all instrumental in the protection of this legacy ranch.”
‘Myriad of Ecological Values’
Navajo River Watershed map via the Colorado State Forest Service
The Continental Divide National Scenic Trail runs along the eastern border of the family’s properties for approximately 10 miles. Almost completely surrounded by 3.75 million acres of the San Juan National Forest, South San Juan Wilderness and Rio Grande National Forest, protection of the Banded Peak Ranch enhances the adjacent public lands by maintaining healthy forests, critical wetland and riparian areas, and crucial wildlife corridors. Fire modeling shows this ranch is the first line of defense in the watershed for reducing the risk and cost of wildfire.
The conservation easement on Banded Peak Ranch will be held by the Colorado State Forest Service. The two adjacent ranches – Catspaw and Navajo Headwaters – are owned by members of the same family and protected through a series of conservation easements held by the Colorado State Forest Service and Colorado Open Lands. These perpetual easements ensure that the natural richness and ruggedness of these lands will remain largely undisturbed, allowing ranch operations to continue while eliminating future subdivision for residential or commercial development.
“We’re proud to partner with The Conservation Fund, USDA Forest Service and owners of Banded Peak Ranch to conserve the myriad of ecological values on the ranch,” said Mike Lester, State Forester and director of the Colorado State Forest Service. “By protecting Banded Peak and its forests from future development, we’re ensuring the public benefits that these forests provide – from clean air and water to habitat for our iconic wildlife – persist in Colorado for generations to come.”
Support from Colorado’s Congressional Delegation
The protection of Banded Peak Ranch was made possible by $7 million from the USDA Forest Service’s Forest Legacy Program, which is funded by the Land and Water Conservation Fund (LWCF). LWCF uses offshore drilling revenue – not taxpayer dollars – to fund conservation projects across the country. The Great American Outdoors Act, a bill that has passed both the House and Senate and is on its way to the President’s desk for signature, provides full and permanent funding for LWCF and future conservation victories like this one. Colorado’s Congressional delegation, led by U.S. Senators Michael Bennet and Cory Gardner and U.S. Representative Scott Tipton, is united in its support for this program and for the protection of the Banded Peak Ranch.
“The conservation of Banded Peak Ranch is excellent news for southwestern Colorado and a testament to the work of local leaders and landowners, The Conservation Fund, the Colorado State Forest Service and the U.S. Forest Service. Thanks to this decades-long effort, the Navajo River Watershed, and its valuable wildlife habitat, will now be protected for future generations,” said U.S. Senator Michael Bennet. “Without the Land and Water Conservation Fund, projects like this simply wouldn’t be possible. I’m glad to have supported this project throughout the process, and to have secured full funding for LWCF, so that Colorado can continue to invest in public lands, wildlife habitat and our economy.”
“The Land and Water Conservation Fund is the crown jewel of conservation programs and has played a critical role in protecting public lands in Colorado and across the nation,” said U.S. Senator Cory Gardner. “Protecting the Banded Peak Ranch completes 65,000 acres of protected wilderness and watershed which will help wildlife in the area flourish. Additionally, preserving the streams at Banded Peak Ranch ensures that communities downstream, including areas in southwest Colorado, have access to clean water for drinking and irrigation.”
“The addition of the Banded Peak Conservation Easement is a welcome expansion to safeguard critical wildlife habitats in southwestern Colorado,” said U.S. Representative Scott Tipton. “I am proud to have worked to permanently authorize the Land and Water Conservation Fund so that important projects like this will continue benefitting communities in Colorado for years to come.”
Iconic Wildlife
Realizing the opportunity to protect this last piece of the headwaters of the Navajo River, the Wyss Foundation has played an essential role in the Banded Peak Ranch project, providing funds to match the LWCF dollars.
“Thanks to the determination of The Conservation Fund and support from Coloradans demanding more protections for their lands and waters, Banded Peak Ranch will be preserved forever,” said Wyss Foundation President Molly McUsic. “Collectively we must continue taking every opportunity to accelerate our conservation efforts, to safeguard imperiled wildlife and to ameliorate the worst impacts of a changing climate.”
Most of the wildlife species found along southern Colorado’s Continental Divide inhabit the Banded Peak Ranch. Elk, black bear, mountain lion, peregrine falcon, bald eagles, bighorn sheep and many others thrive in the area. Federally threatened Canada lynx also live on the property. The streams on Banded Peak Ranch support the recovery of the San Juan strain of the Colorado cutthroat trout, which was presumed extinct for 100 years, until it was rediscovered on the ranch in 2018. Grizzly bears were once present in this remote wilderness area until the late 1970s. In fact, this was the last place in Colorado to host the iconic and threatened species. Two books were written about the grizzly bears’ presence in this watershed, including Ghost Grizzlies: Does the Great Bear Still Haunt Colorado by David Petersen, and The Lost Grizzlies: A Search for Survivors in the Wilderness of Colorado by Rick Bass.
From the Douglas Creek Conservation District via The Rio Blanco Herald-Times:
Did you learn the definition of an alluvium this weekend? Or what estoppel means? If you attended the Douglas Creek Conservation District’s “Water Law in a Nutshell” class this weekend, presented by Mr. Aaron Clay, you now know the answers to both questions.
The Water Law in a Nutshell class covered numerous water topics pertinent to Rio Blanco County residents. Twenty-four individuals were able to take advantage of the class in-person or by Zoom.
Primary topics included water terminology, measurements of water, Prior Appropriation Doctrine, practical application of water law, and interstate compacts. Excellent questions and engagement from the 25 participants helped everyone have a much better understanding of Colorado water law and how it affects them directly.
One of many examples of valuable information is learning about “domestic preference” in the Prior Appropriations system. While domestic water use has preference over any other purpose, including agriculture and manufacturing, a Colorado Supreme Court case decided that provision does not alter the priority system. “However, it does give municipalities the power to condemn water rights, if the owners of those water rights are paid just compensation.”1
Another example is how important it is to verify water rights when purchasing property with water. If the water right is stock in a ditch company, the purchaser should verify with the ditch company that the stock certificate is recorded in the current landowner’s name and the amount. If not stock in a ditch company, it is important to verify the water right at the clerk and recorders’ office.
The seven-hour Water Law in a Nutshell class was recorded. If you are interested in viewing the class please contact the District office at whiterivercd@gmail.com or 970-878-9838 to make arrangements.
A new report shows extreme drought throughout the Bighorn Mountains.
The latest data from the University of Nebraska’s National Drought Mitigation Center shows most of Wyoming is experiencing some level of drought. That ranges from moderate drought in the south and some eastern parts of the state to severe drought in the central region.
Interim Director of the Wyoming Water Resources Data System and State Climate Office Tony Bergantino said there is extreme drought in Sheridan, Johnson, Natrona, Washakie and Hot Springs counties.
“Precipitation pretty much just turned off. We had high winds and warm temperatures that just got things going dry really quick. Reports of soil moisture being really depleted up there,” Bergantino said of the factors that contributed to the drought.
Bergantino said that extreme drought is the highest level the state has seen since October 2018. According to the Drought Monitor, the impacts of D3, or extreme drought, is inadequate surface water for ranching and farming and a poor snow pack.
Bergantino said one of the first fires of the season occurred in Johnson County and there have been subsequent fires in the area. The snowpack had looked good early in the year and into May, but the weather shifted.
Even if rain does pick back up, it won’t be enough to reverse the damage, he said…
He said the agriculture industry will be the most impacted by the drought. The west and northwestern parts of the state are the only areas showing no signs of drought, and Bergantino said that’s because of precipitation they had early on.
US Drought Monitor one week change map ending July 28, 2020.
The Nature Conservancy’s CEO Jennifer Morris shares why it’s time for radical collaboration on climate change & biodiversity loss—now more than ever.
As a lifelong conservationist and now CEO of The Nature Conservancy, I am an impatient optimist. I hear the clock ticking on climate change. I see the threats to biodiversity and loss of nature with clear eyes. I listen to the stories from vulnerable populations most directly and immediately affected by droughts, intense storms, and other increasingly severe natural disasters.
And yet, I am optimistic. I believe that the global community can come together and enact the right policies, shift industries toward a more sustainable path, and empower local communities to protect the resources that sustain them, for one, simple reason: I believe in the power of humanity to act.
The health and economic wellbeing of people is tied to the health of our local environment. To better our lives we must protect nature. Photo credit: CU Boulder News
The nature crisis is a human crisis
I’ve always been a nature lover. Even as a kid, I would spend my summers exploring the small forest near my family’s home in Atlanta, Georgia, scribbling in my notebook the species names of birds and trees I could identify. But, twenty-seven years ago, as an English teacher in a small rural community in Northern Namibia, I began to fully understand our capacity for building a better future by protecting nature.
After a day of helping women collect firewood and digging boreholes to access fresh water from the aquifer, my friend Ria and I sat outside under a full moon to look at pictures from her youth. She shared photos of her community surrounded by lush forests and told stories about fishing and harvesting fresh corn.
Her life as a grown woman was much different: her home was surrounded by drought-stricken fields, and she spent much of her day traveling far distances to collect water and firewood for her family—distances that continued to grow due to deforestation. These long journeys came with increased risk of violence, less time at home, fewer hours studying in my class, and no chance to find a paying job.
That night I began to understand on a deeper level how connected our health and economic wellbeing are to the health of our local environment. From that moment, I set out to devote my career to protecting nature and bettering the lives of all who depend on it.
And I can’t imagine a more urgent time to be wholly dedicated to this work than now.
Climate change and biodiversity loss pose enormous risks for communities and economies around the world. Failure to act is to be complicit in challenges that have persisted for generations. Quiver tree forest. By Bjørn Christian Tørrissen – Own work by uploader, http://bjornfree.com/, CC BY-SA 4.0, https://commons.wikimedia.org/w/index.php?curid=45152535
Climate change and biodiversity loss are two of the greatest threats the world faces. These twin crises pose enormous risks for communities and economies around the world. A failure to act on them is to be complicit in exacerbating the challenges we face as a result of the current COVID-19 pandemic, not to mention global conflict, income inequality, and other hardships that have persisted for generations. Action is not only a moral obligation, it is an existential imperative. And all paths to a better world depend on our ability to protect the lands and waters that provide us all with clean air and water, healthy food and a stable climate.
Collaboration is our strongest lever for change
Change at a meaningful scale cannot be achieved by any one organization alone. It cannot even be achieved by many likeminded organizations. Scientists, Indigenous peoples, and environmentalists have been shouting from the rooftops about the degradation to our ecosystems and changes to our climate for decades. We were warned about severe impacts to future generations. Well, those future generations are here now. And our efforts to date, while important and meaningful, have been insufficient to achieve systemic change.
For tangible, lasting results we need to engage in radical collaboration—across sectors, across beliefs, across knowledge bases.
This spirit of collaboration is part of The Nature Conservancy’s DNA—and a big reason why I was drawn to lead this great organization. For 69 years, TNC has rallied people together around a shared vision to protect and care for nature. As our impact grew across all 50 states and 79 countries and territories, we brought even more partners to the table. TNC’s science-first, nonpartisan approach to working with government leaders helps drive policies that incentivize the protection of nature while balancing the economic and health needs of communities. Through corporate partnerships, we engage with large, influential companies, and leverage scientific insights to influence change up and down supply chains and across industries. And together with investors and lenders, we are unlocking new sources of capital to extend the impact of our conservation work.
Just as critical to the success of our work, and the health of our planet, is engaging and supporting Indigenous peoples and local communities who have stewarded their lands since time immemorial. Strengthening their agency and helping them manage natural territories in a way that enhances livelihoods will also drive conservation outcomes for a quarter of the world’s lands—areas rich in biodiversity that also store an immense 17% of the planet’s forest carbon.
Science-based conservation for a changing world
Underpinning these collaborations is rigorous science and innovation to keep pace with an ever-changing world—from launching world-class spatial mapping that helps monitor protected areas and study migration patterns, to leveraging our financial and deal-making expertise that drives private investment in nature, to scaling up the protection and restoration of forests, grasslands and wetlands that sequester carbon from the atmosphere. Our science-based, collaborative approach helps us identify where to work, how to do it, and who we need on board to get it done.
The current pandemic has made considerable impacts to our conservation efforts and the people we work with around the world. We’ve had to pause important field projects, like clearing invasive plants to avoid water loss and protect biodiversity in the watersheds of Greater Cape Town, South Africa—a job that provided income to more than 120 local people. In places like India, we are rethinking how we can support rural communities, as hundreds of thousands of migrants return to their villages after leaving locked-down cities. And what we had hoped would be the “Super Year for Nature” is now in flux, as major international forums, where we intended to push for big policy changes, have been postponed.
We can’t ignore these setbacks, but we can do everything in our power to focus on the long-term health of our organization, our communities, and our planet. That’s why we will be doubling down on the areas where we know we can have the greatest impact—protecting the planet’s lands, oceans, and freshwater and addressing climate change. Given the urgency of our mission we must increase our focus on these key areas, direct our resources to them to ensure results, and—in this data-rich era—strengthen our ability to measure our impact. And, just as important, we will hold ourselves accountable to our values in all we do, conducting ourselves with integrity beyond reproach and treating all of our colleagues, volunteers, and partners with dignity and respect.
The next decade of conservation will look different as society focuses on rebuilding our economies and communities in the wake of the pandemic, and this period ahead will be critical for determining the trajectory of our planet’s health. As we chart a new course forward, nature will matter more than ever—and we have the opportunity to highlight its crucial role in sustaining our health, our livelihoods and our well-being. At The Nature Conservancy, we will be shining a spotlight on nature-based solutions that are key to addressing climate change, filtering and cleaning air and water, protecting coastal communities from increasingly severe storms and sustaining local economies.
These are uncertain times, but around the world we are seeing now how quickly we are capable of responding to a global crisis when we work together. It’s a real source of hope. And it is this focus and scale of action that our other longer-term crises demand in order to create a more sustainable world for future generations.
This role is more than just a job for me—it is a calling. And I know I’m not alone. I’m surrounded by thousands of colleagues, supporters, volunteer leaders, and partners who have dedicated their life’s work to protecting and restoring natural places. I am so excited to join them, and all of you. Only together can we act on the level our planet demands.

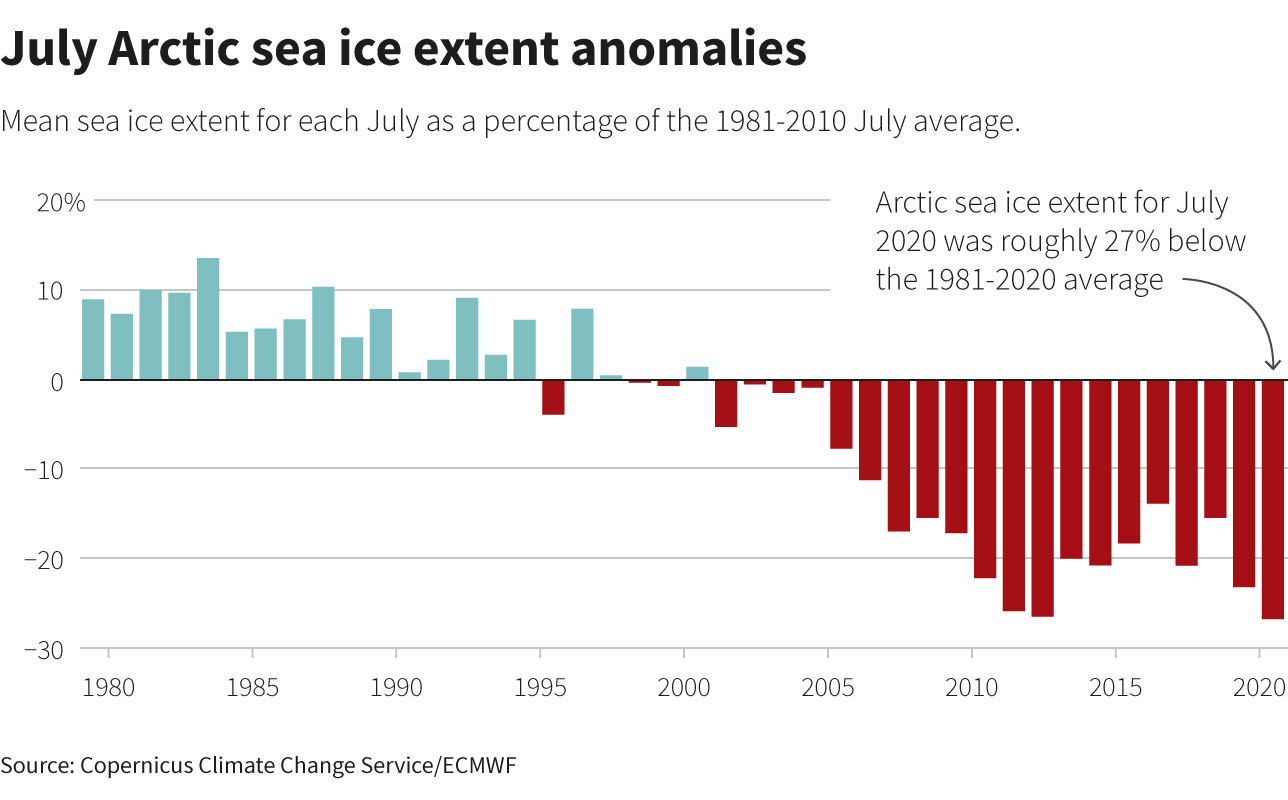
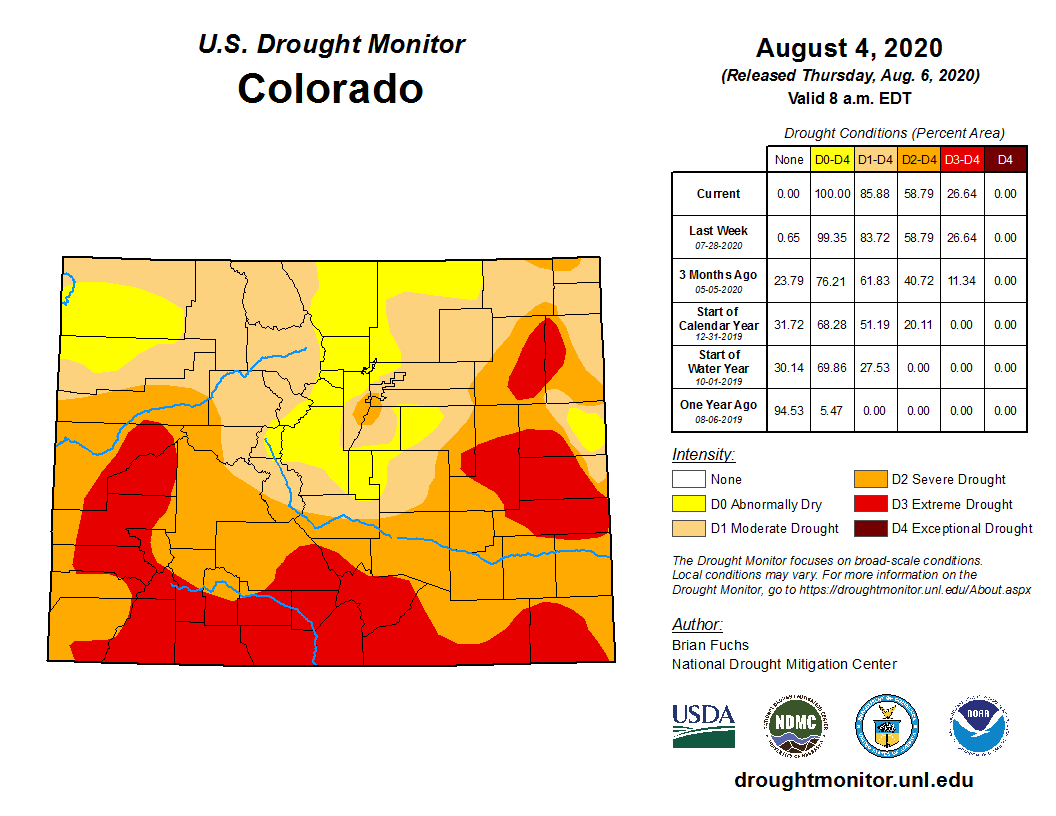

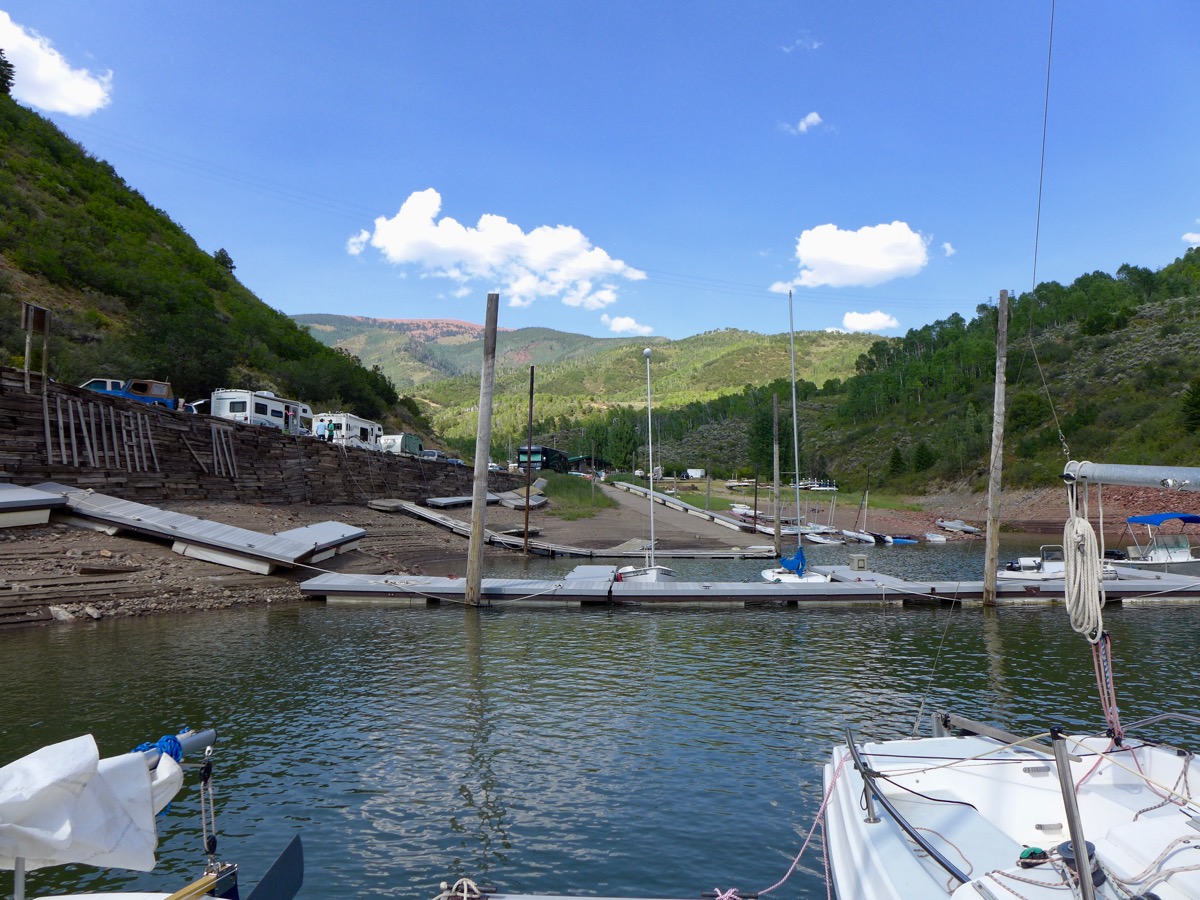


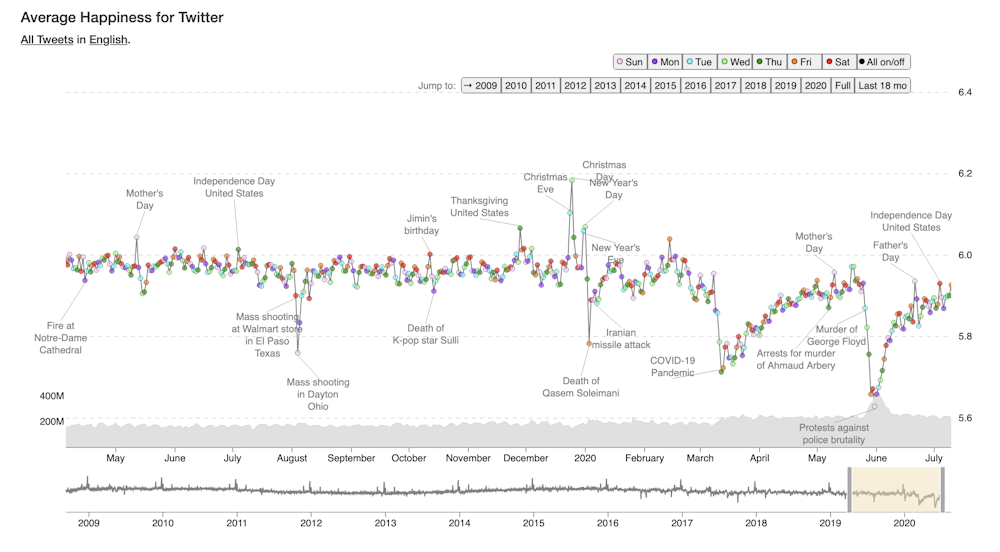
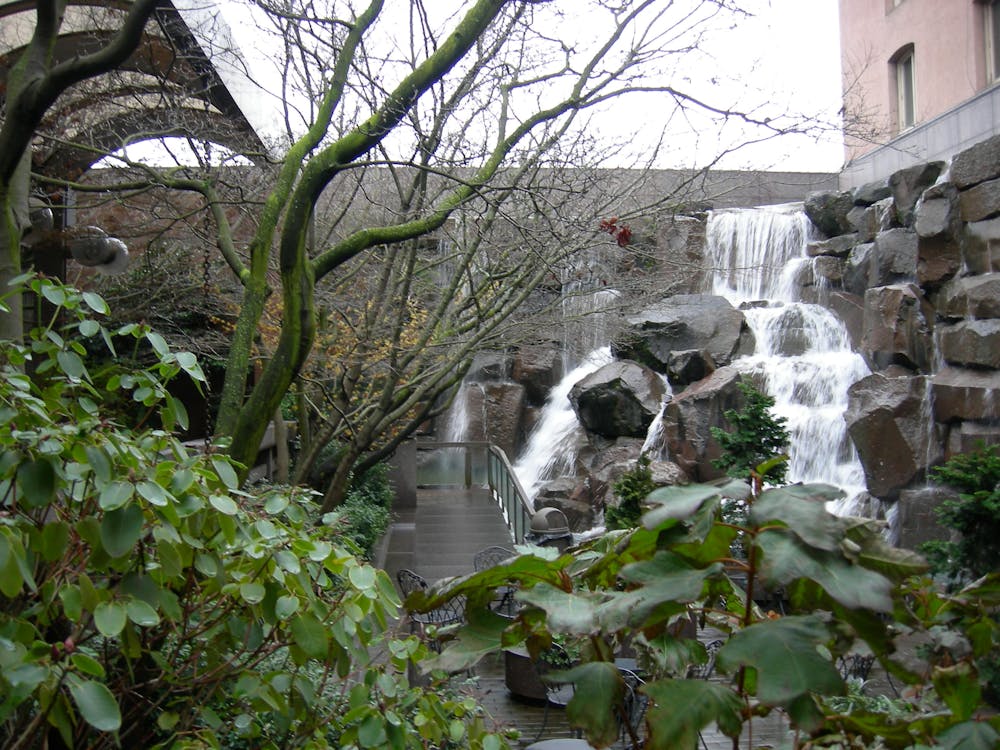
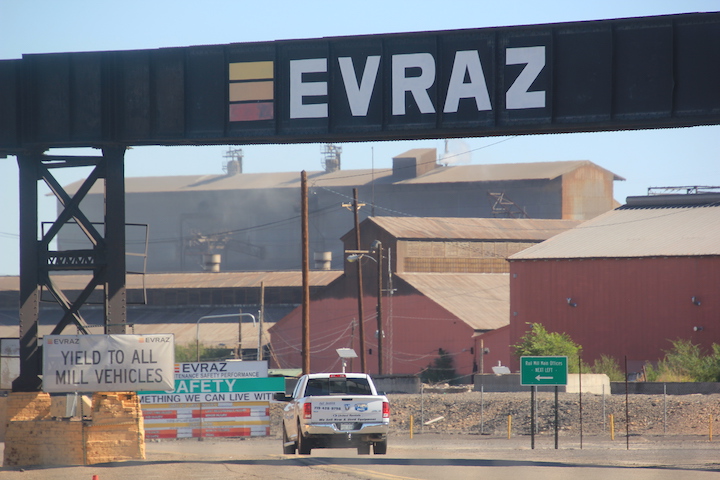
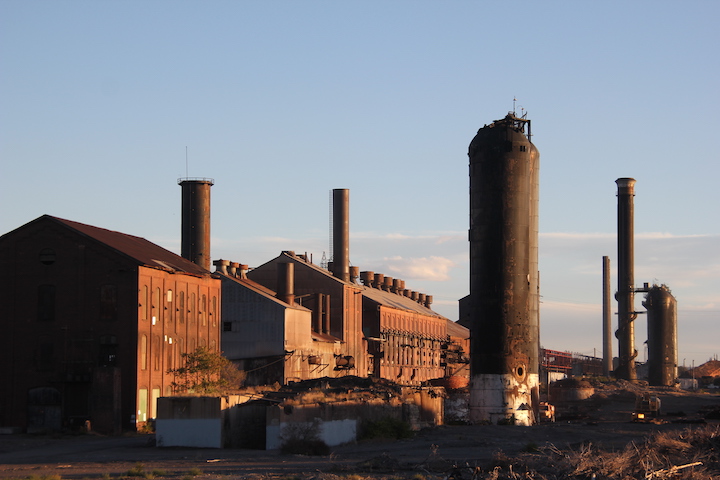
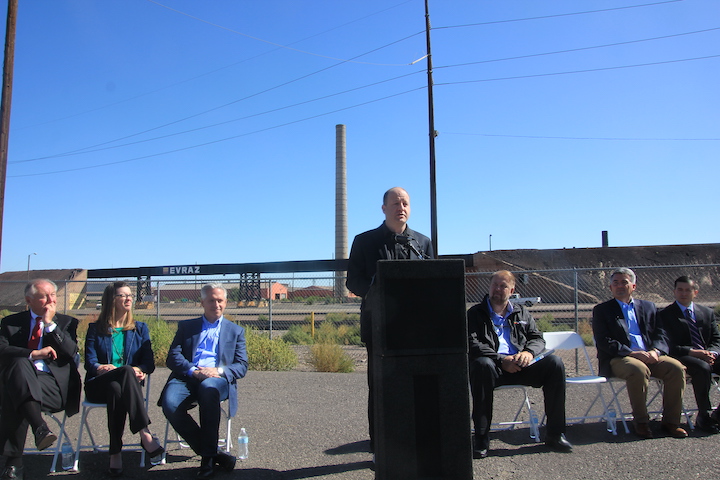


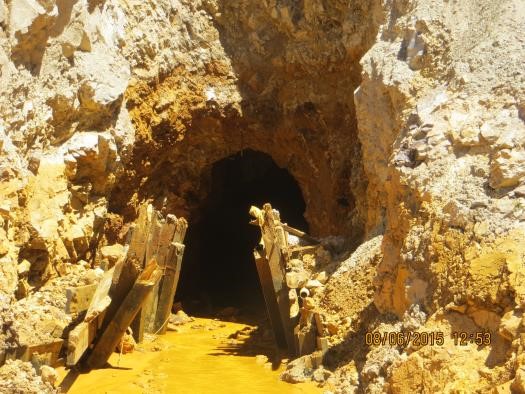

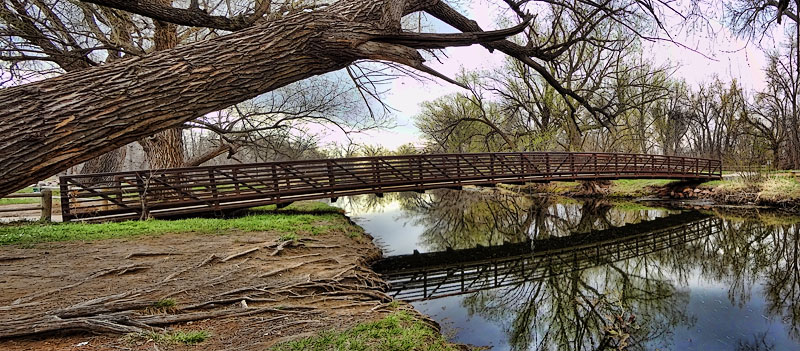


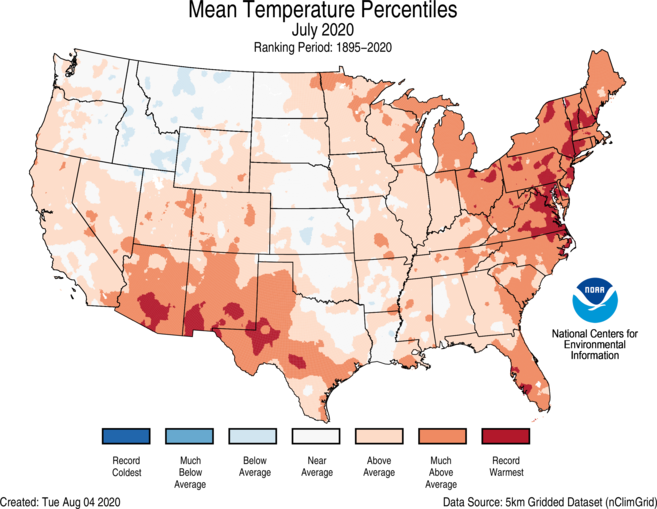

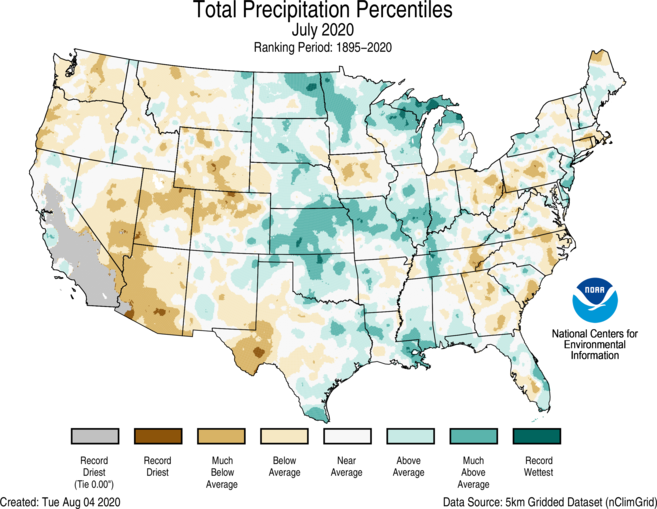
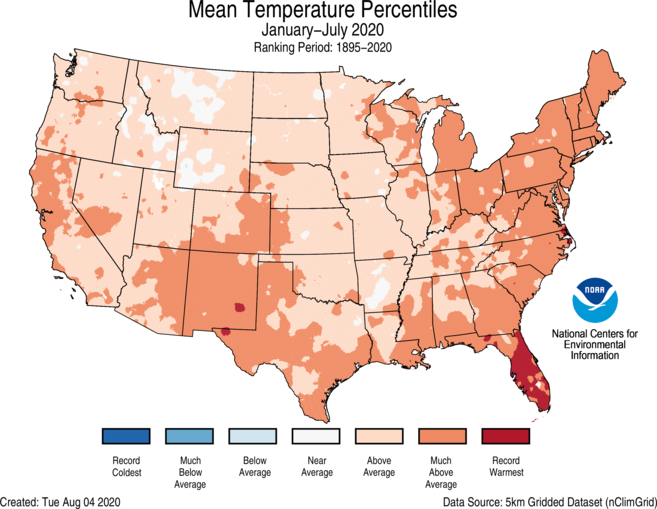
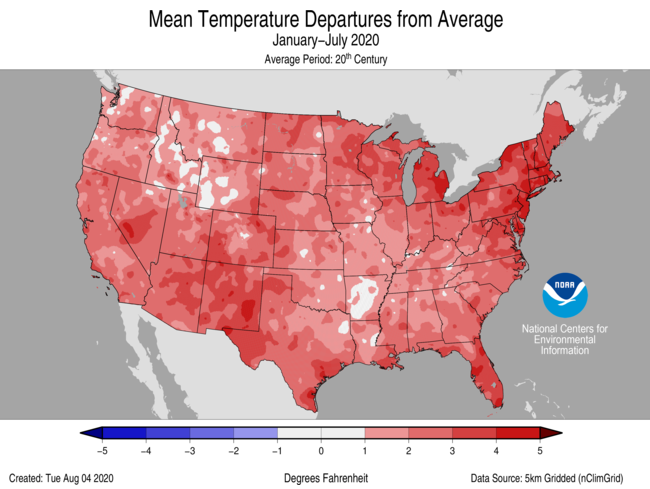


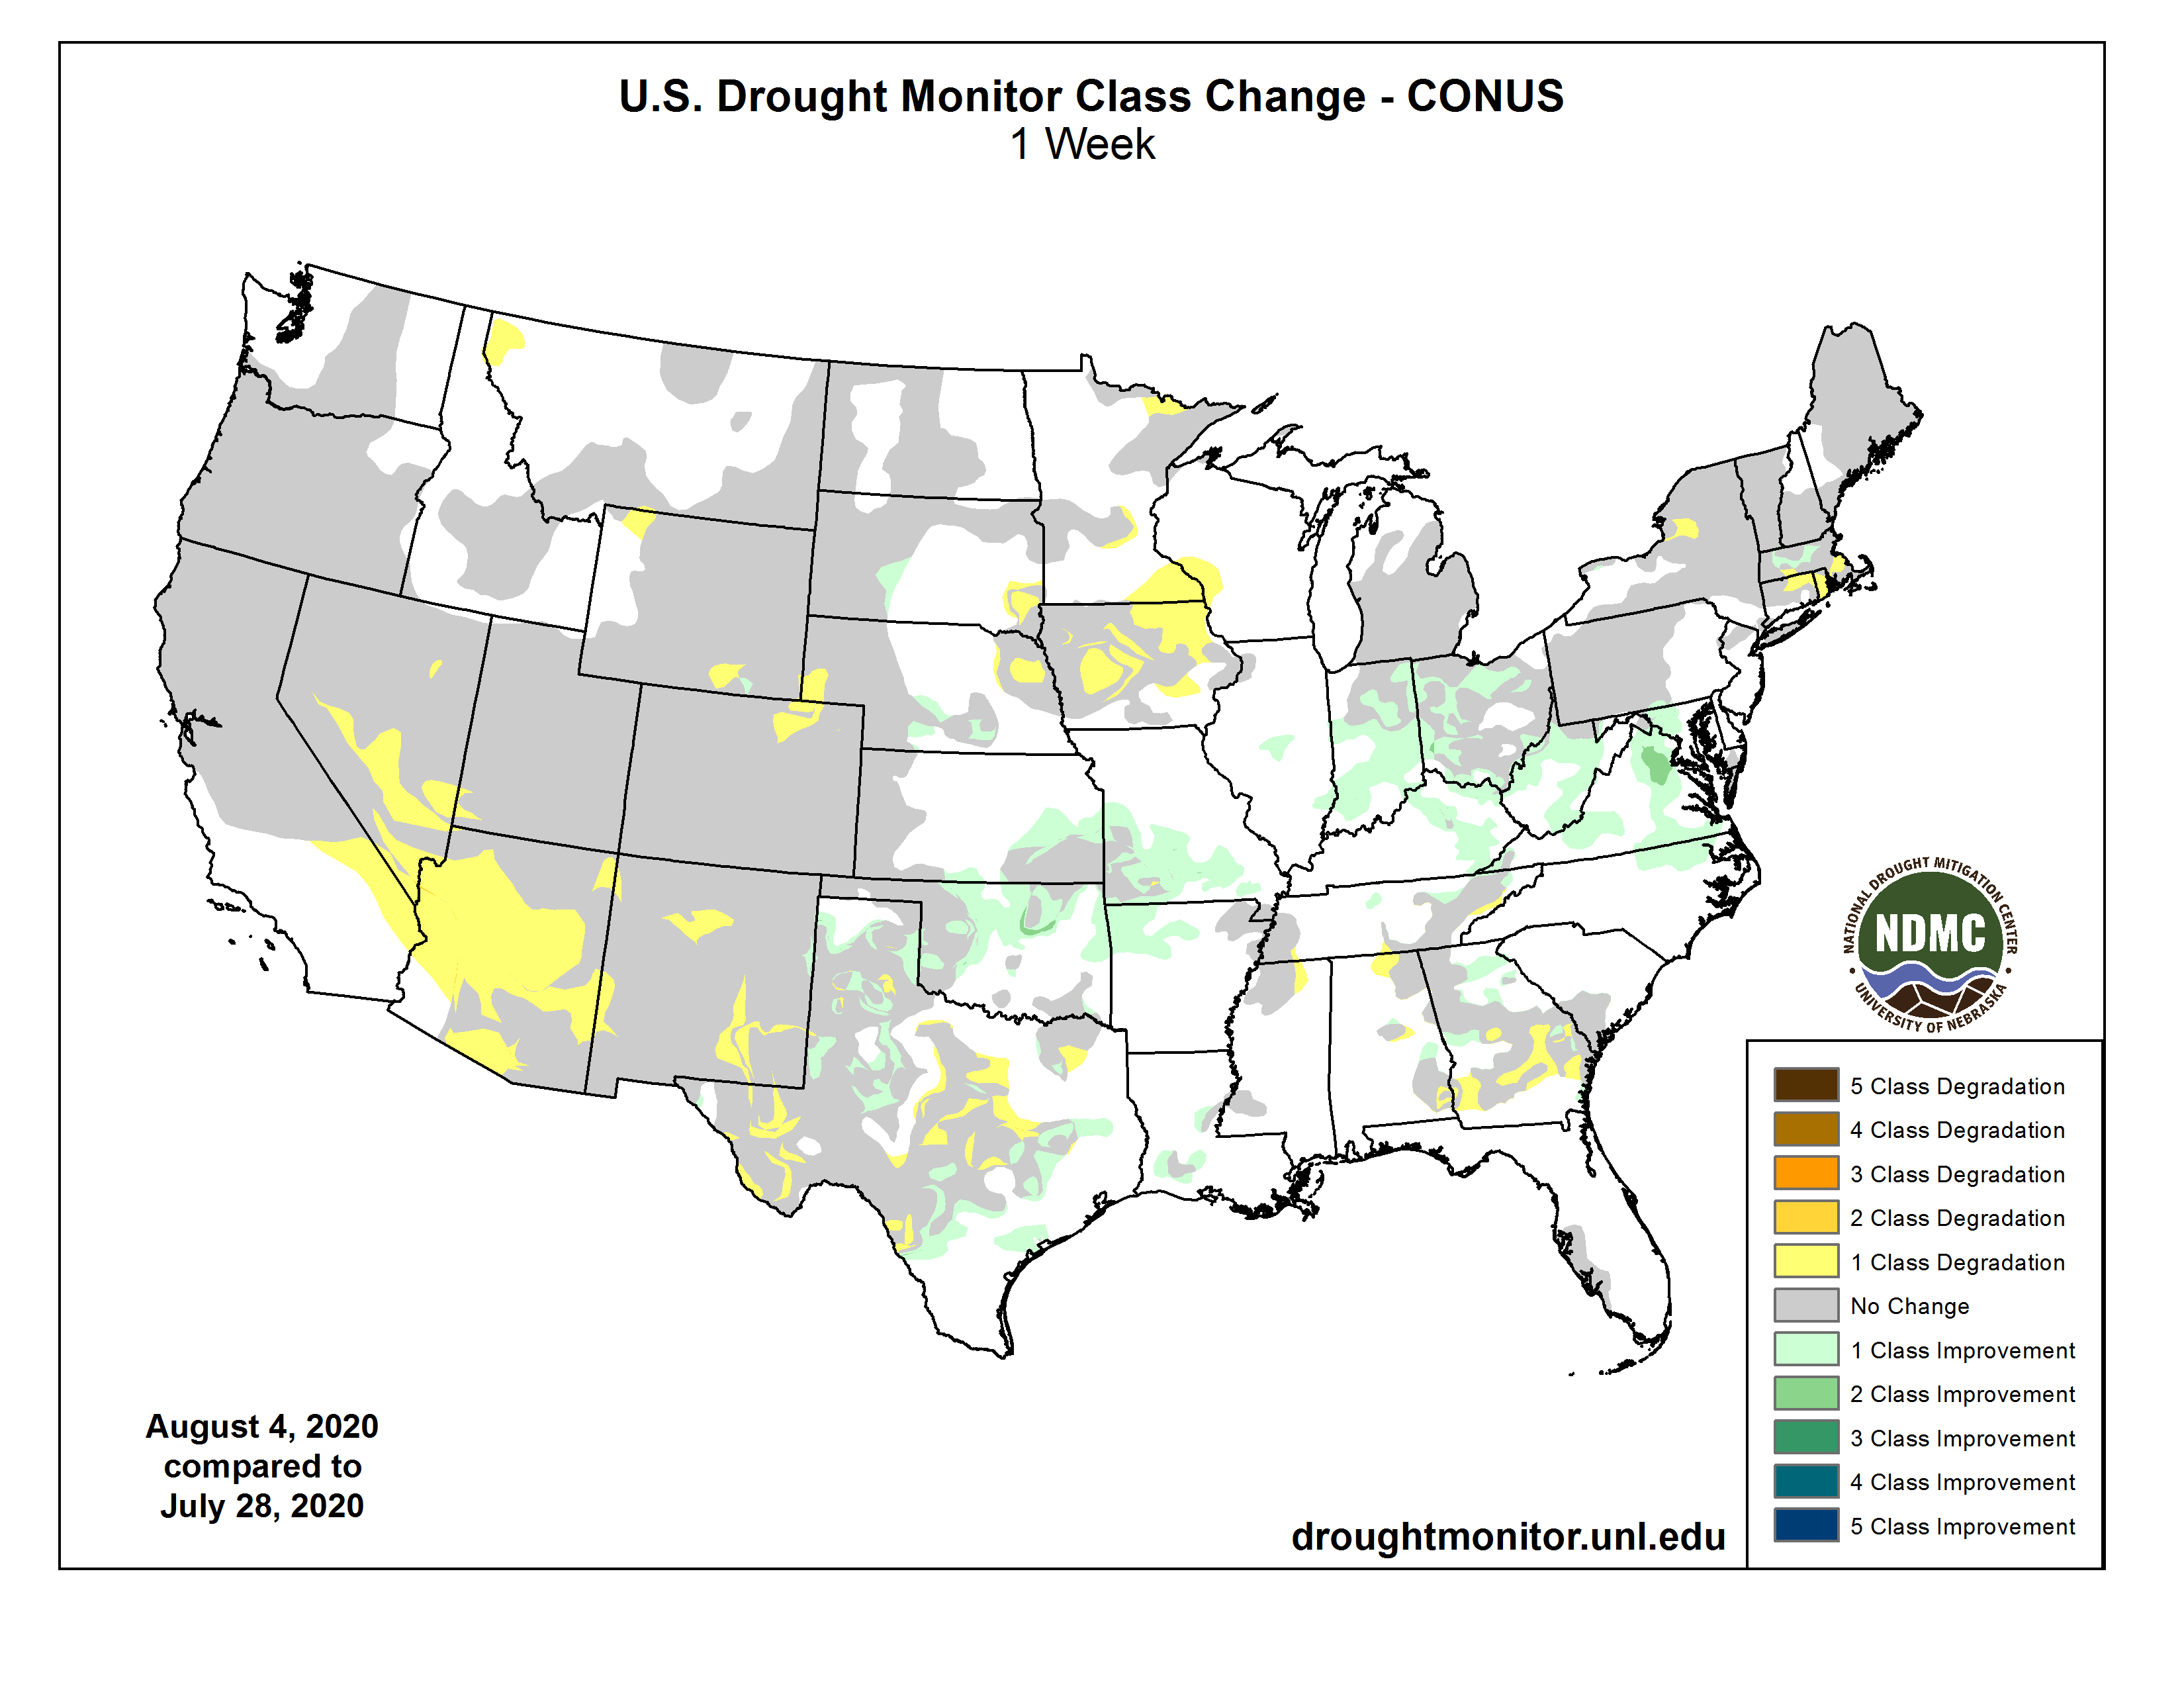


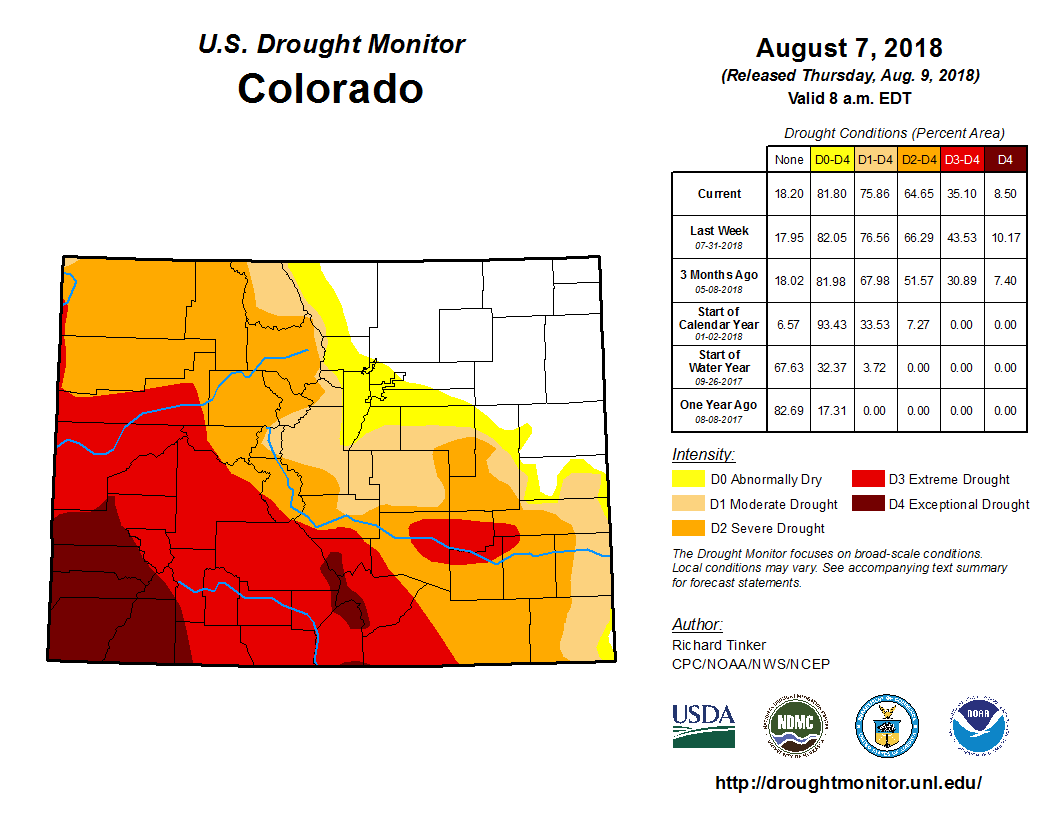


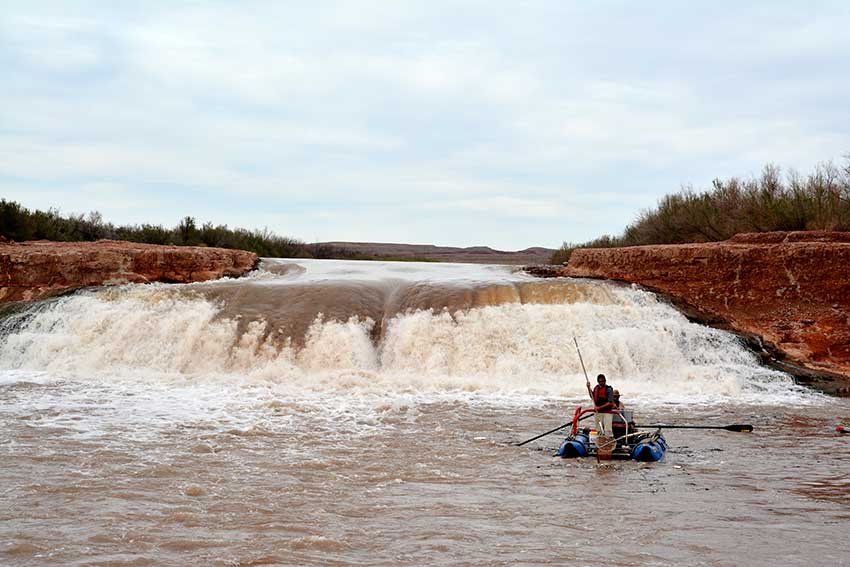
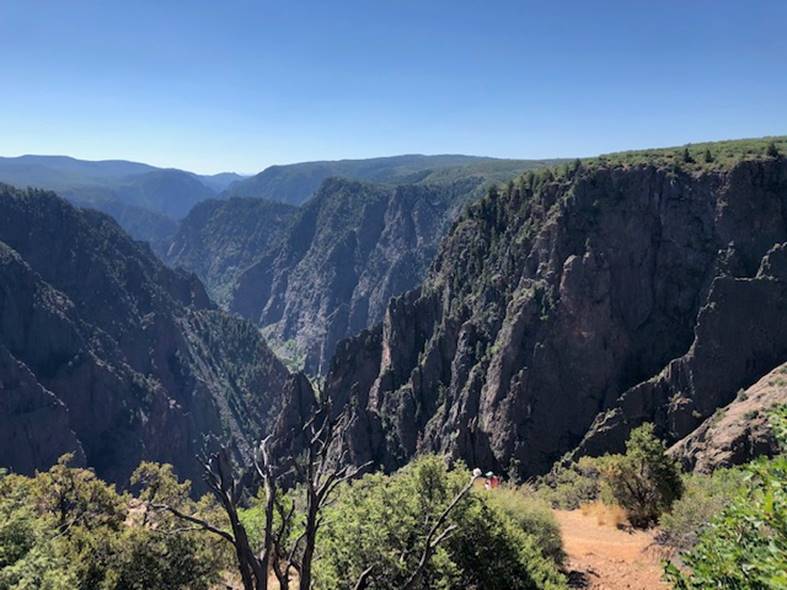


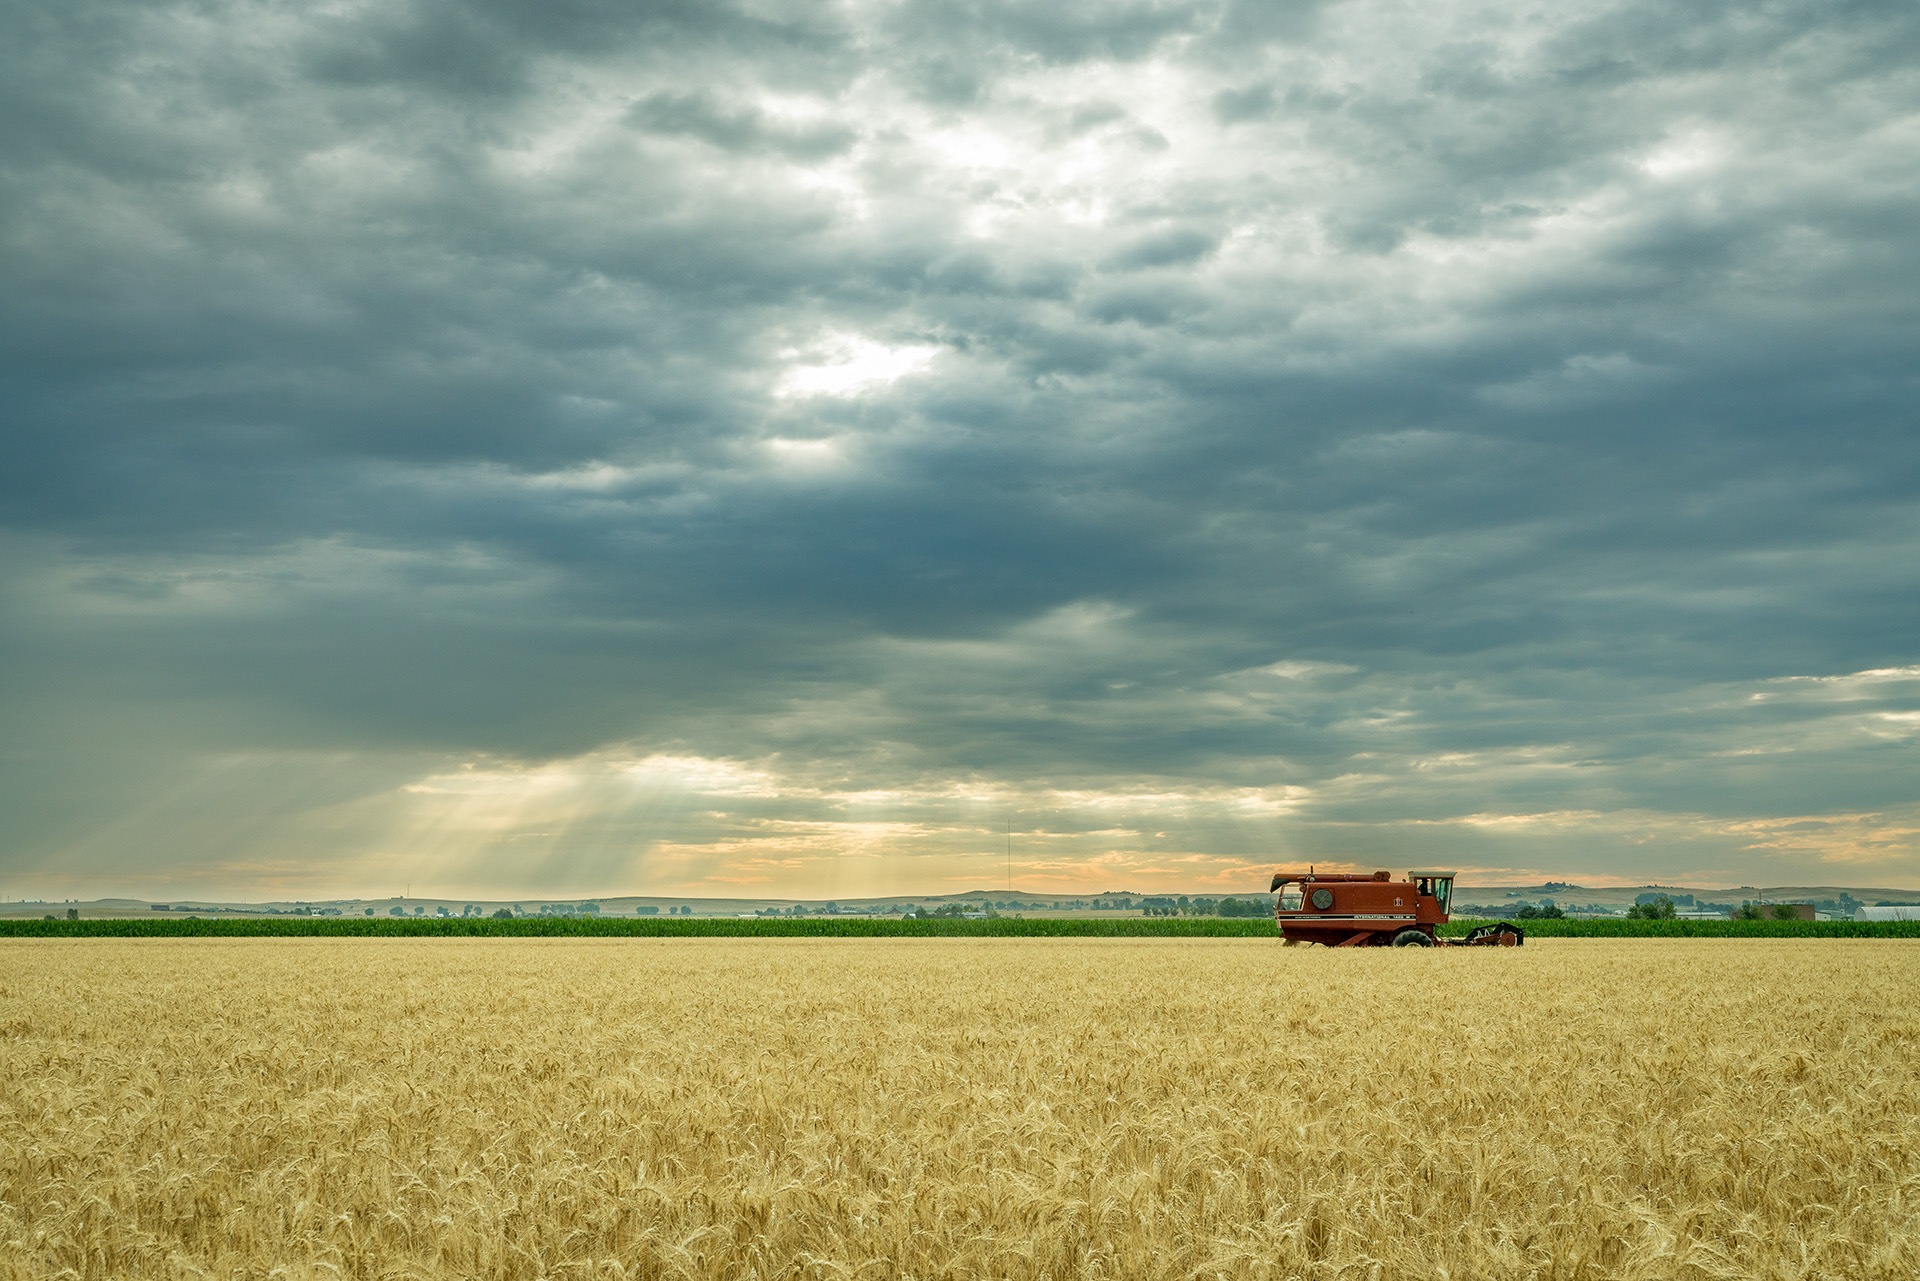

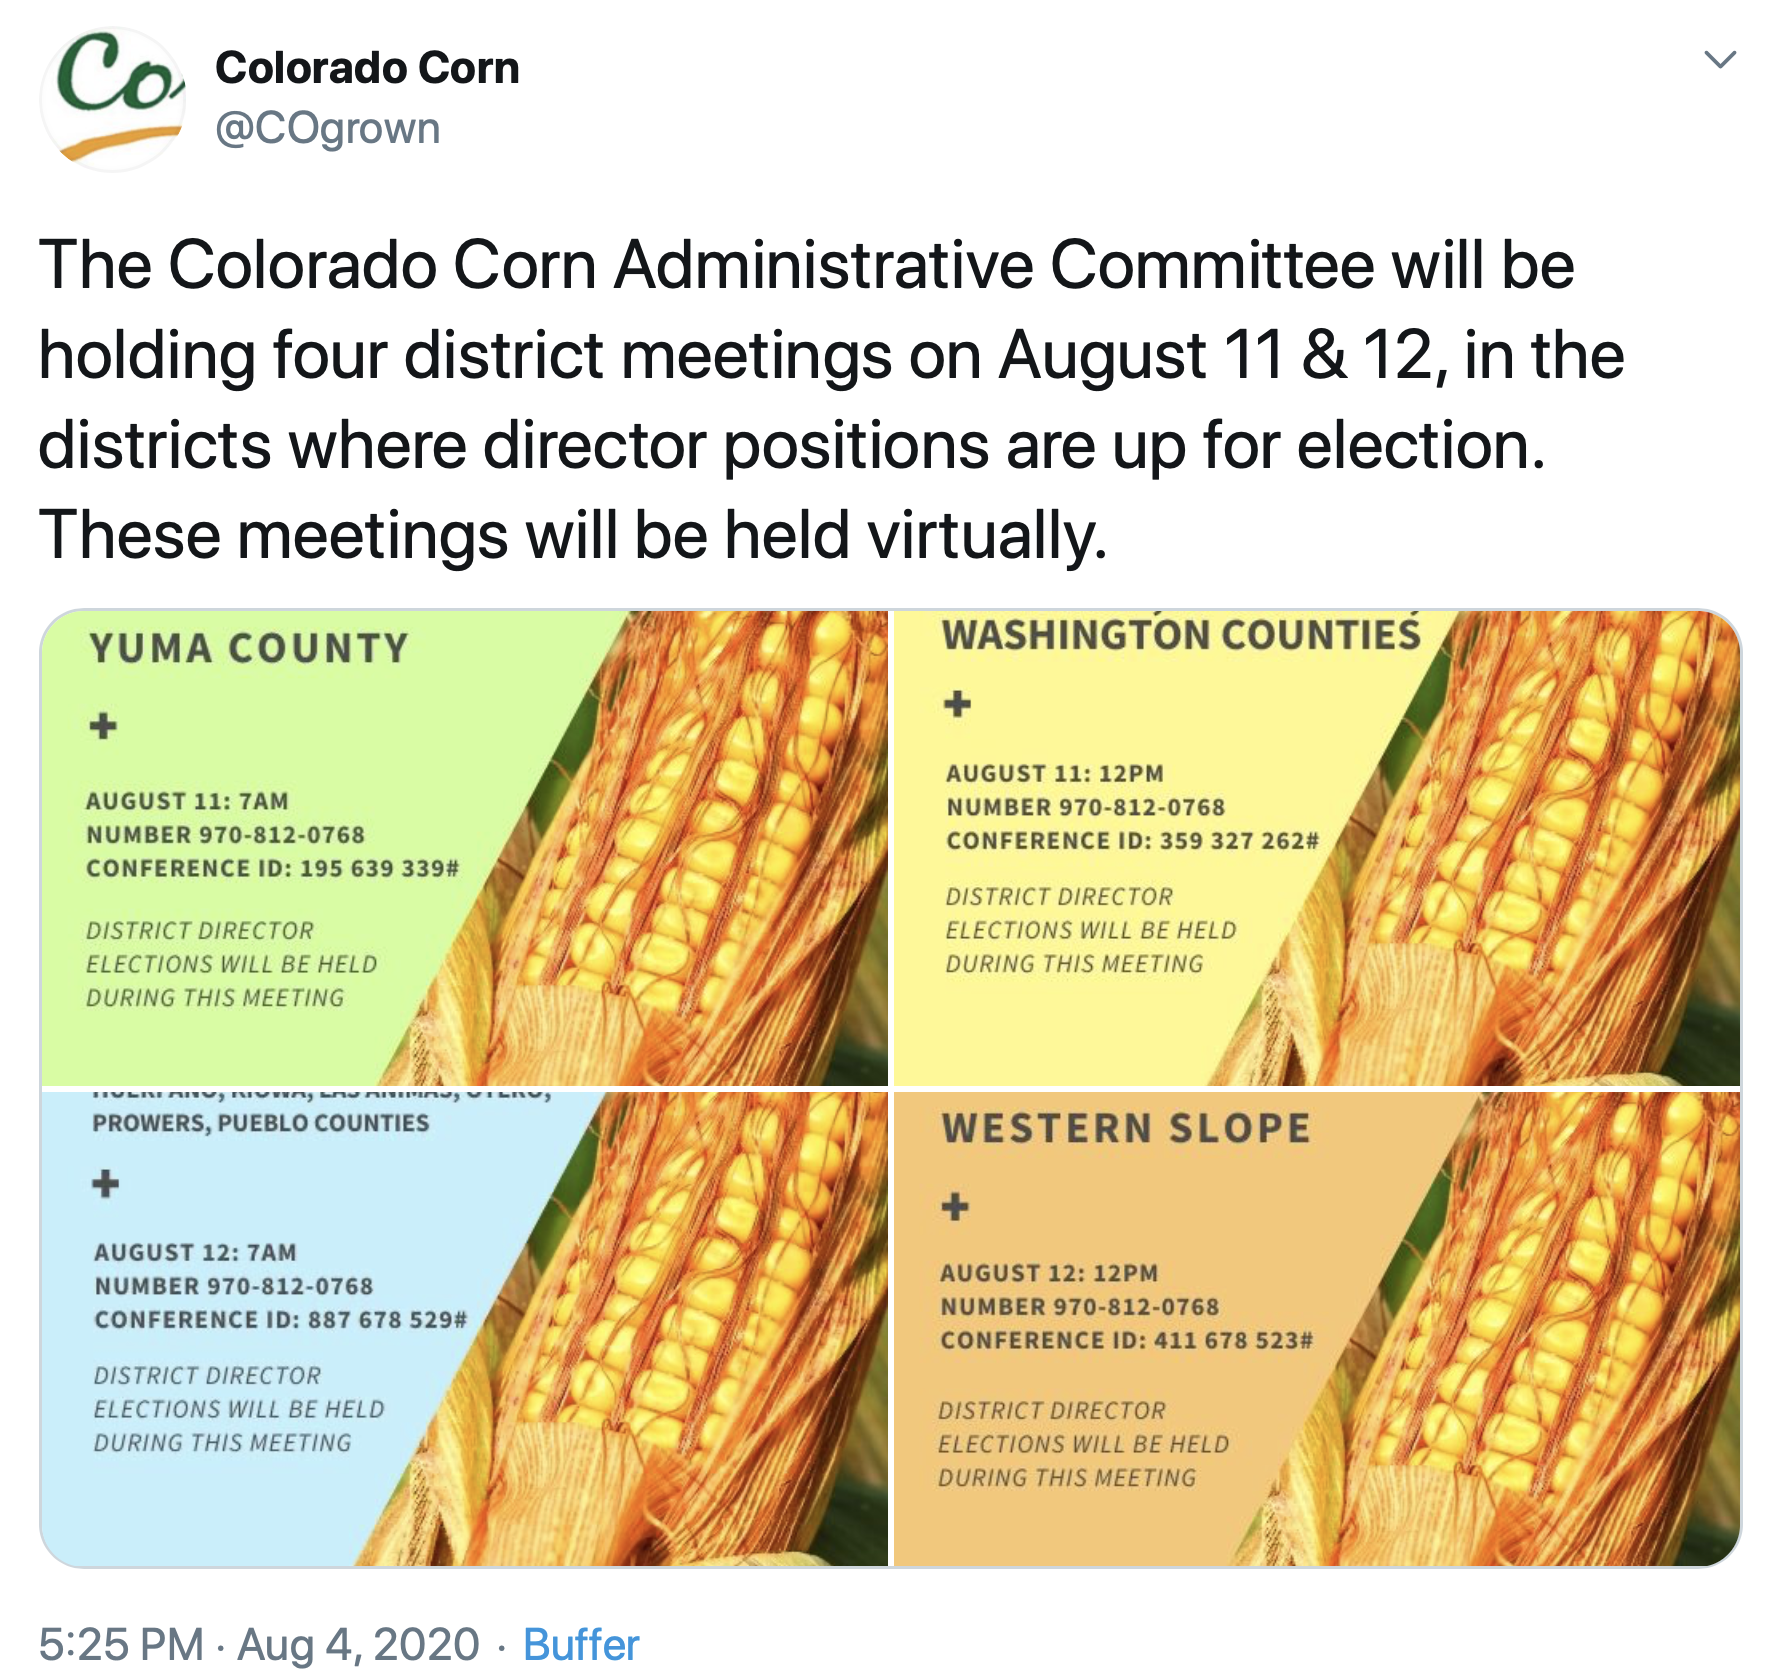
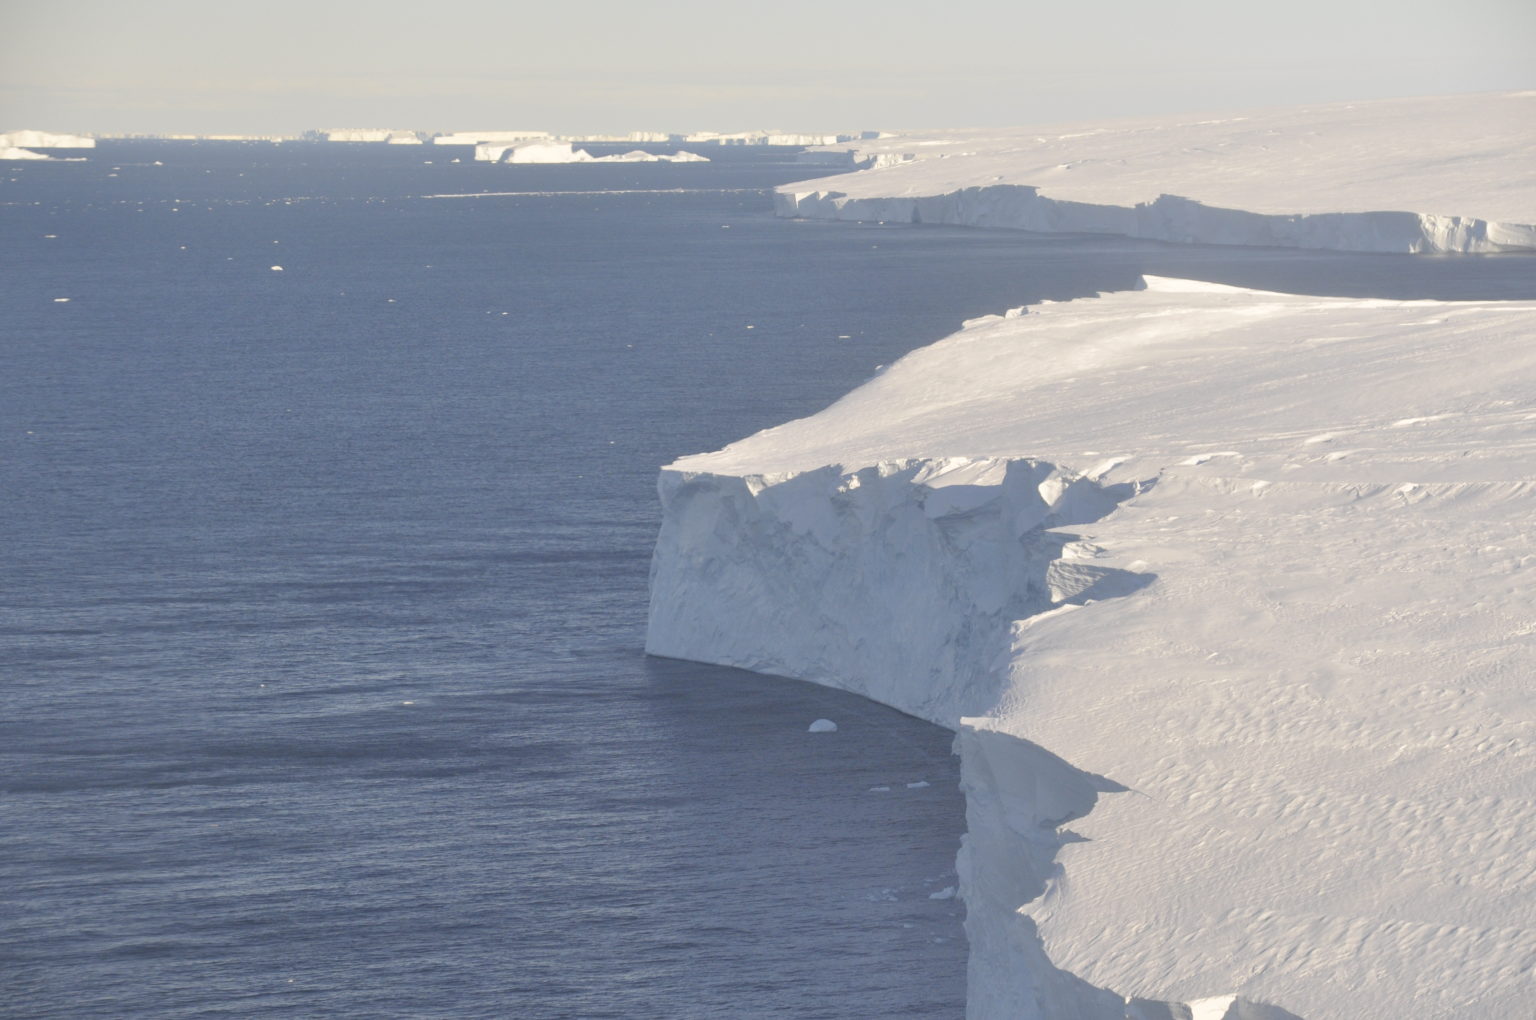
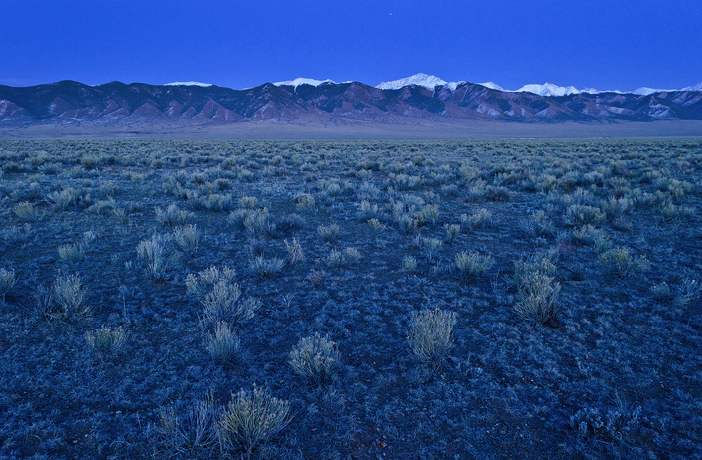
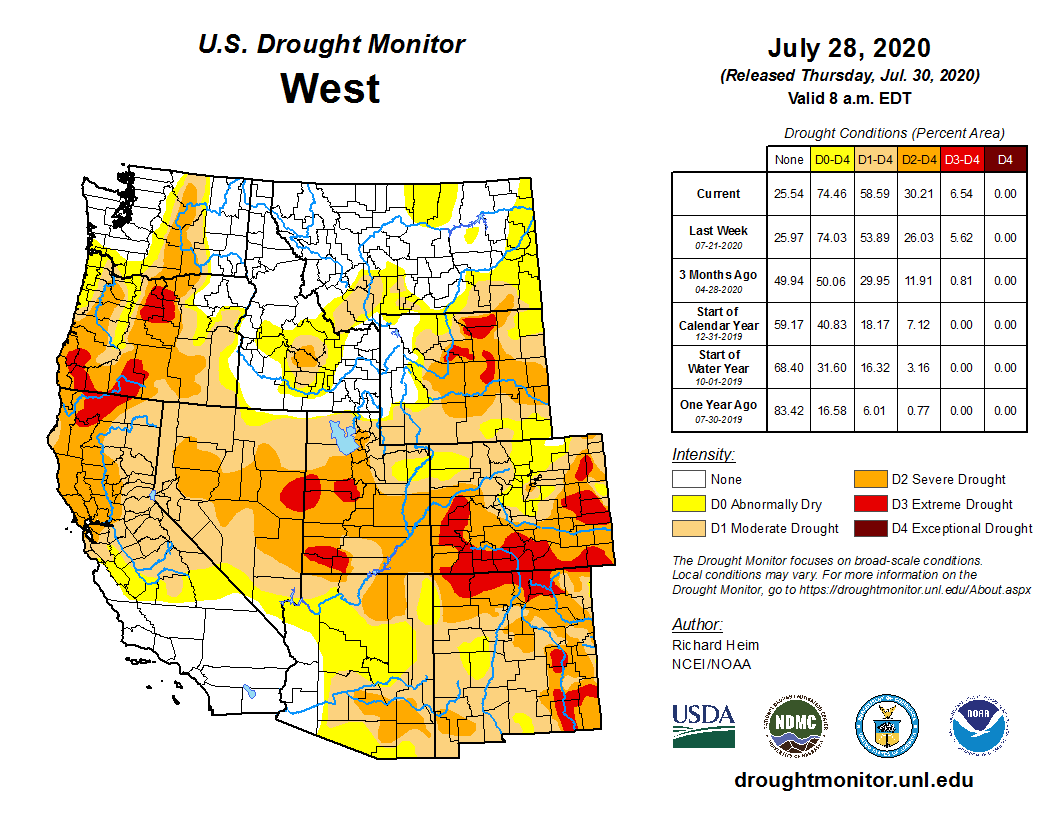
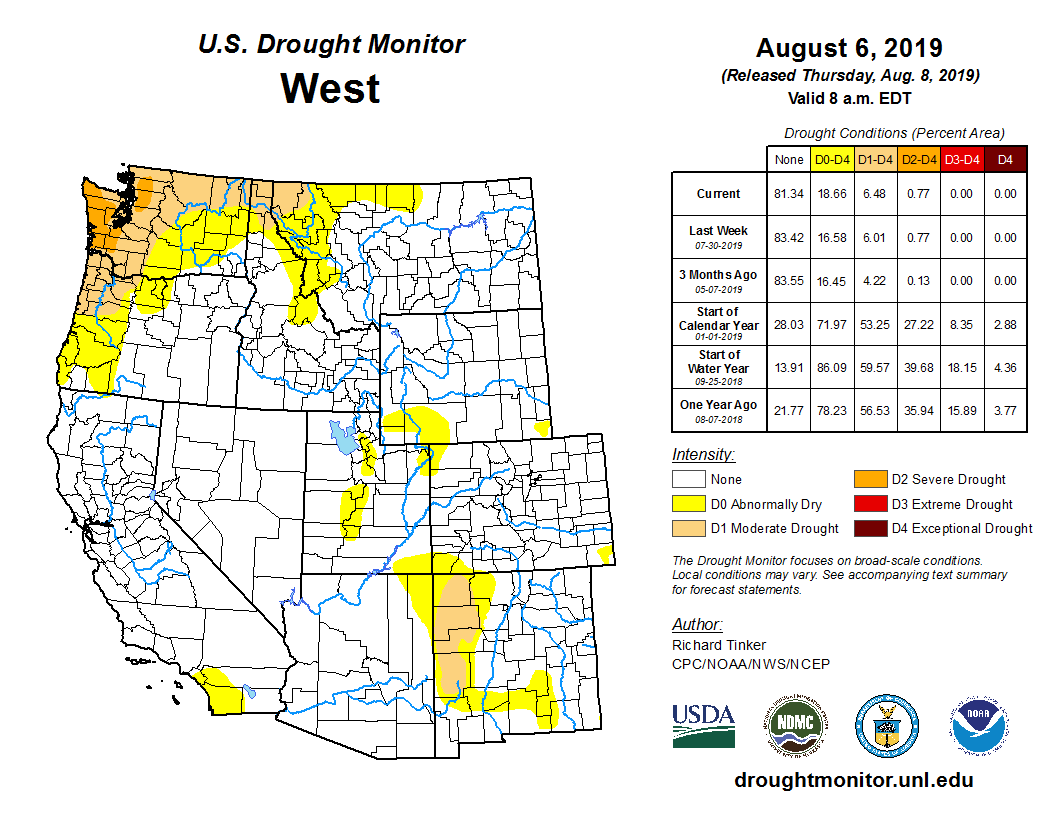
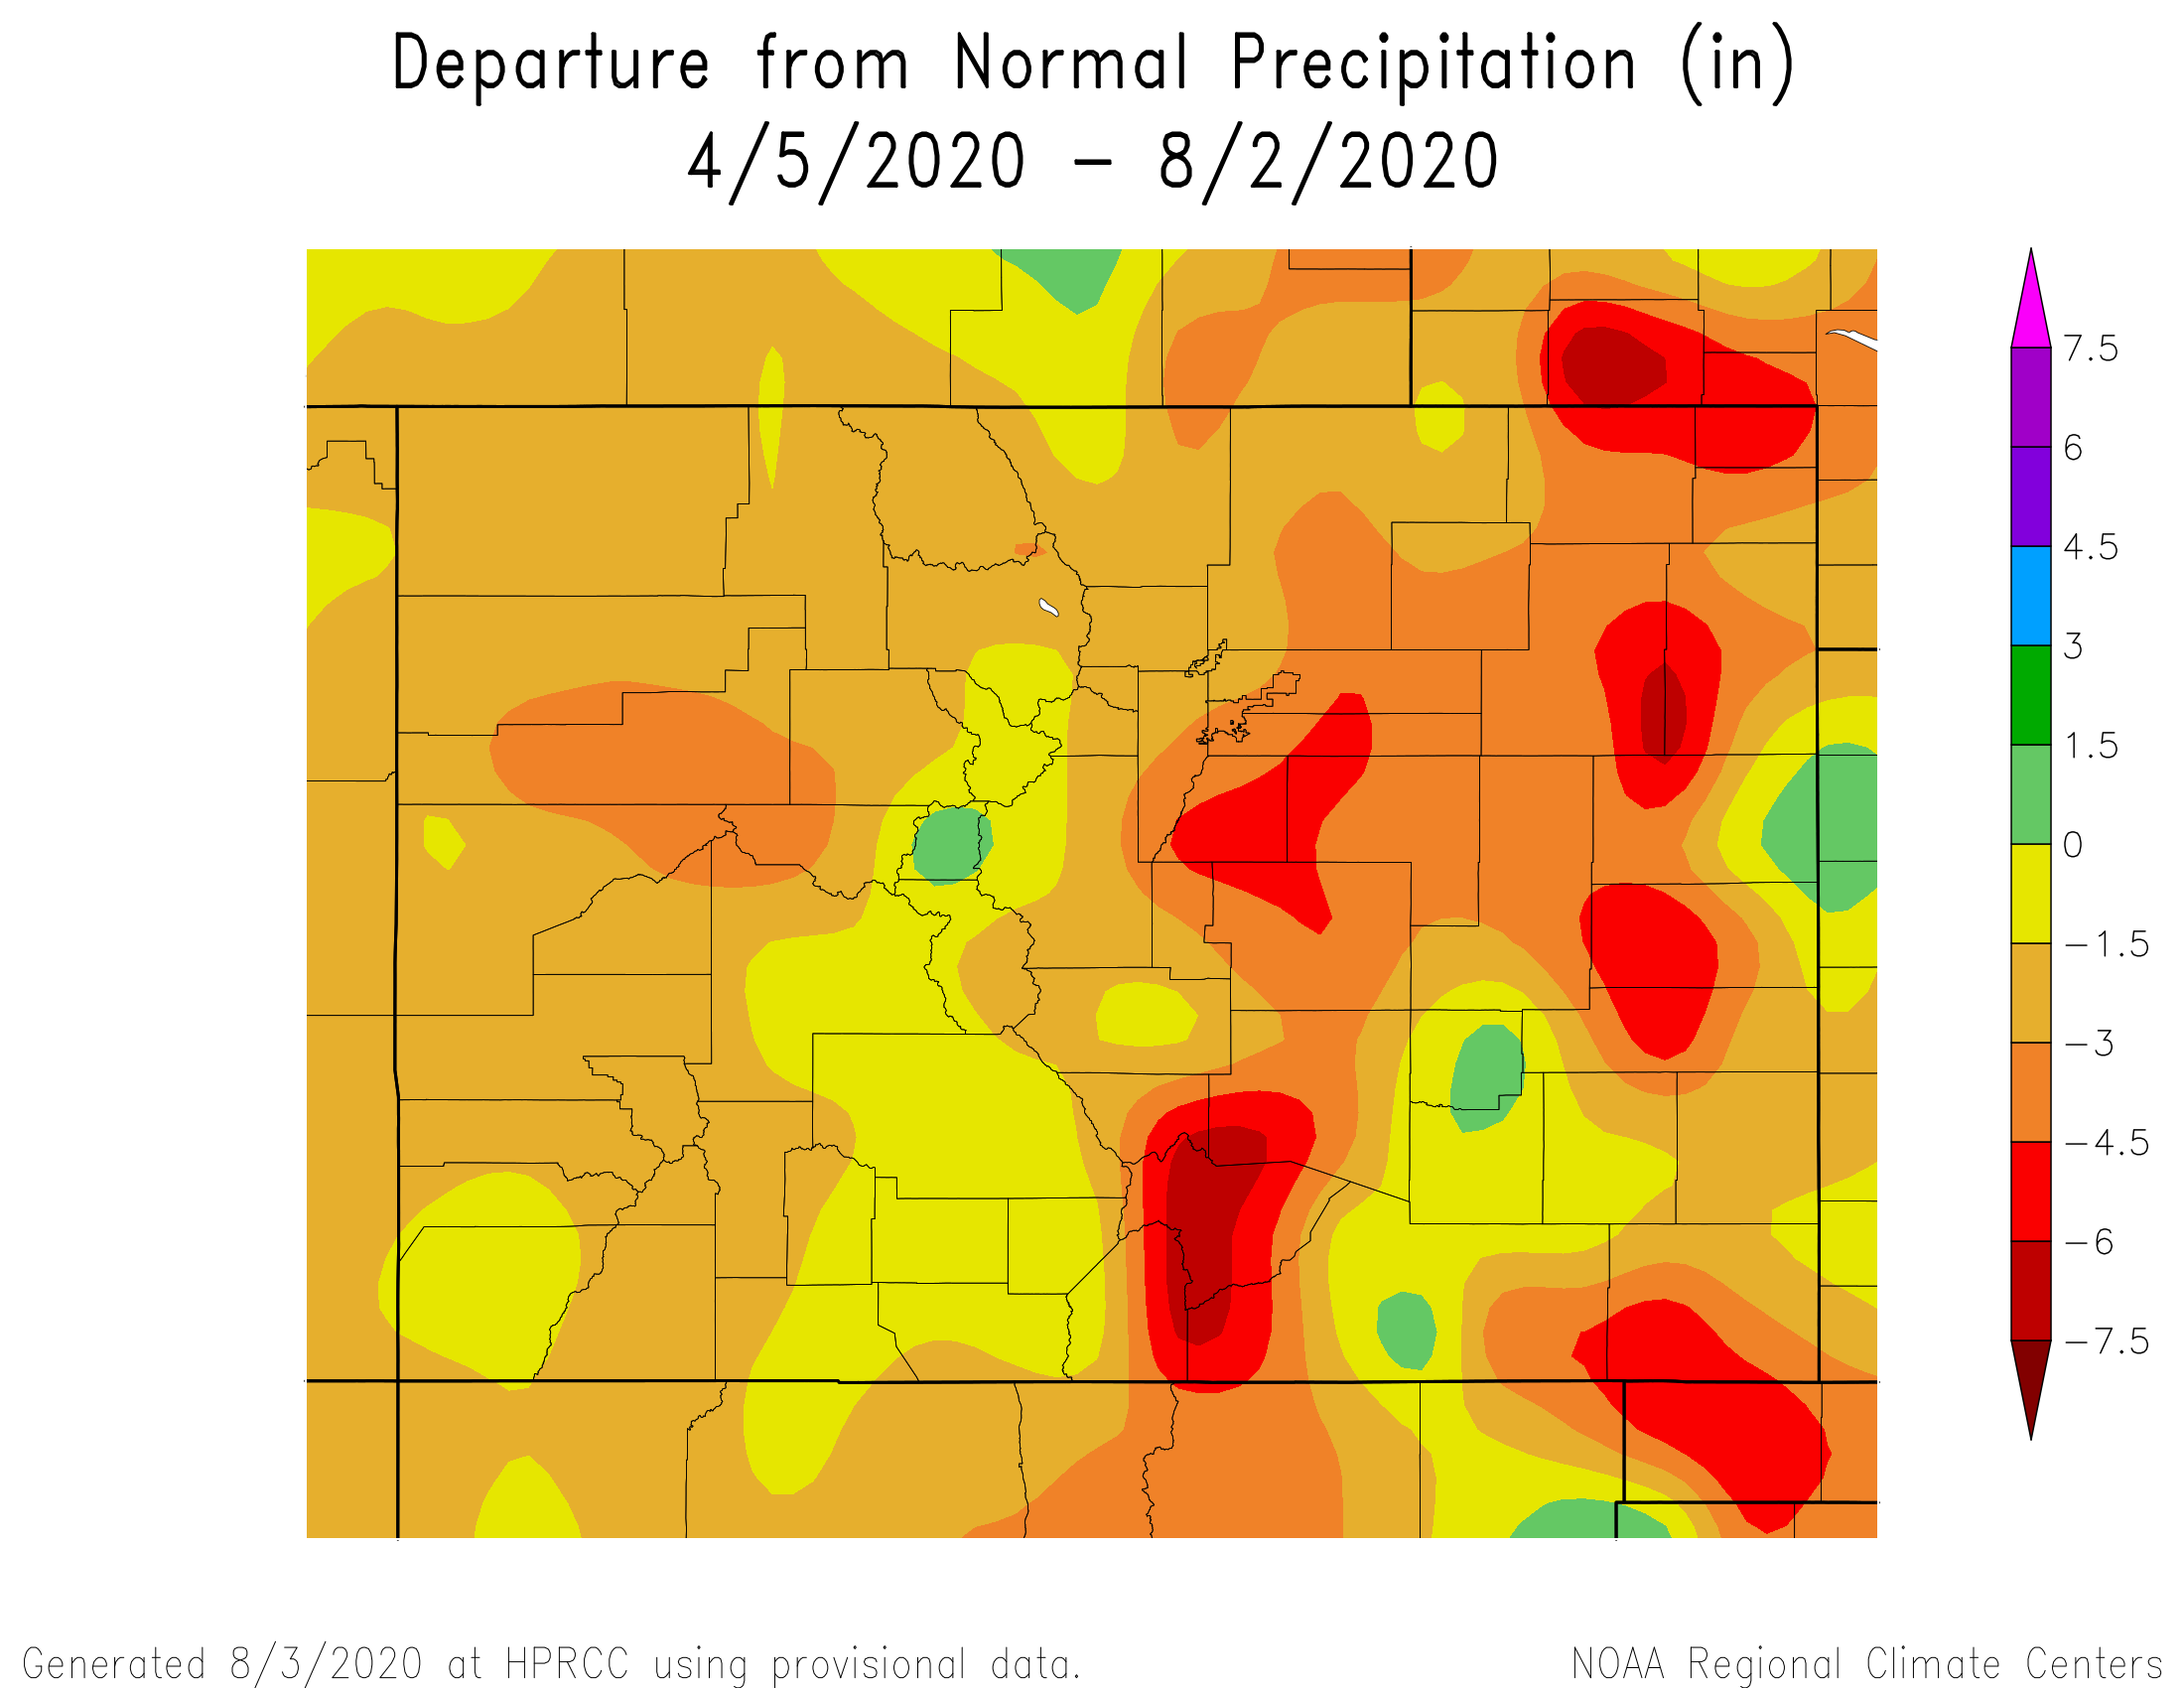
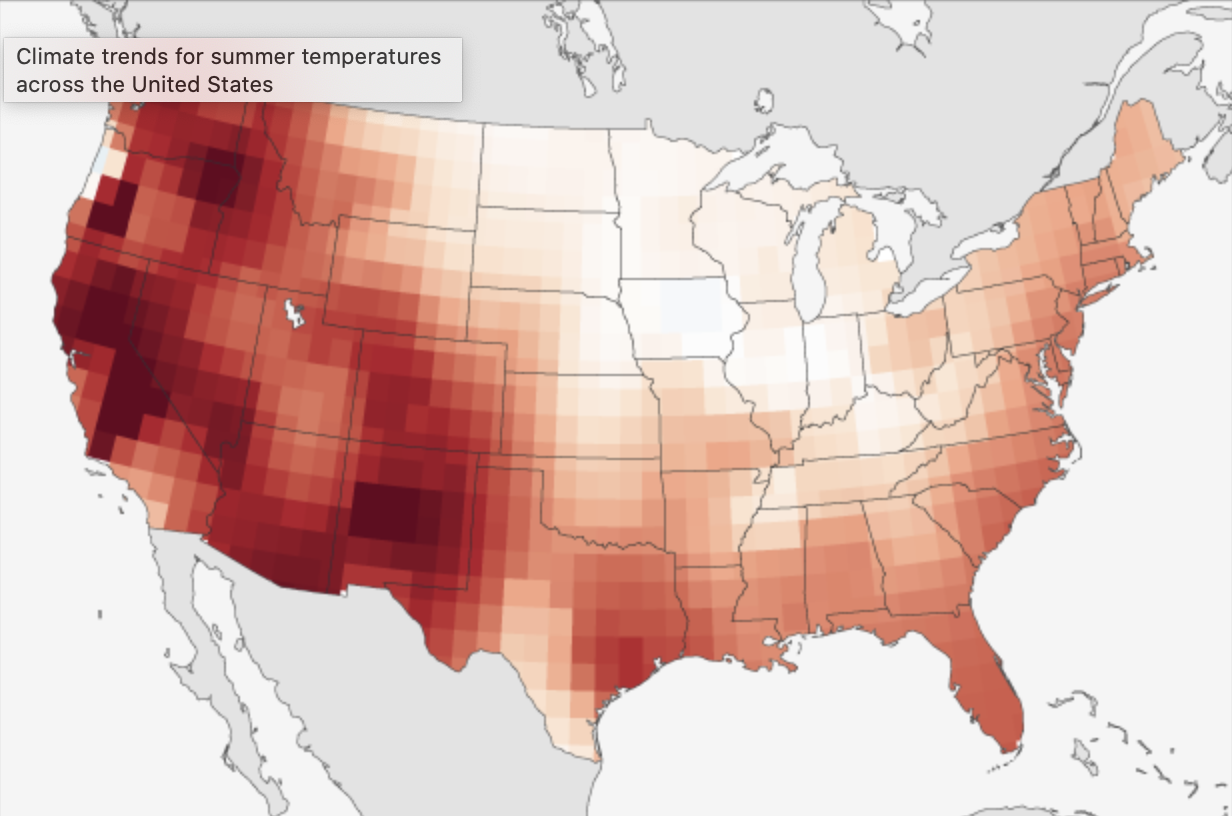
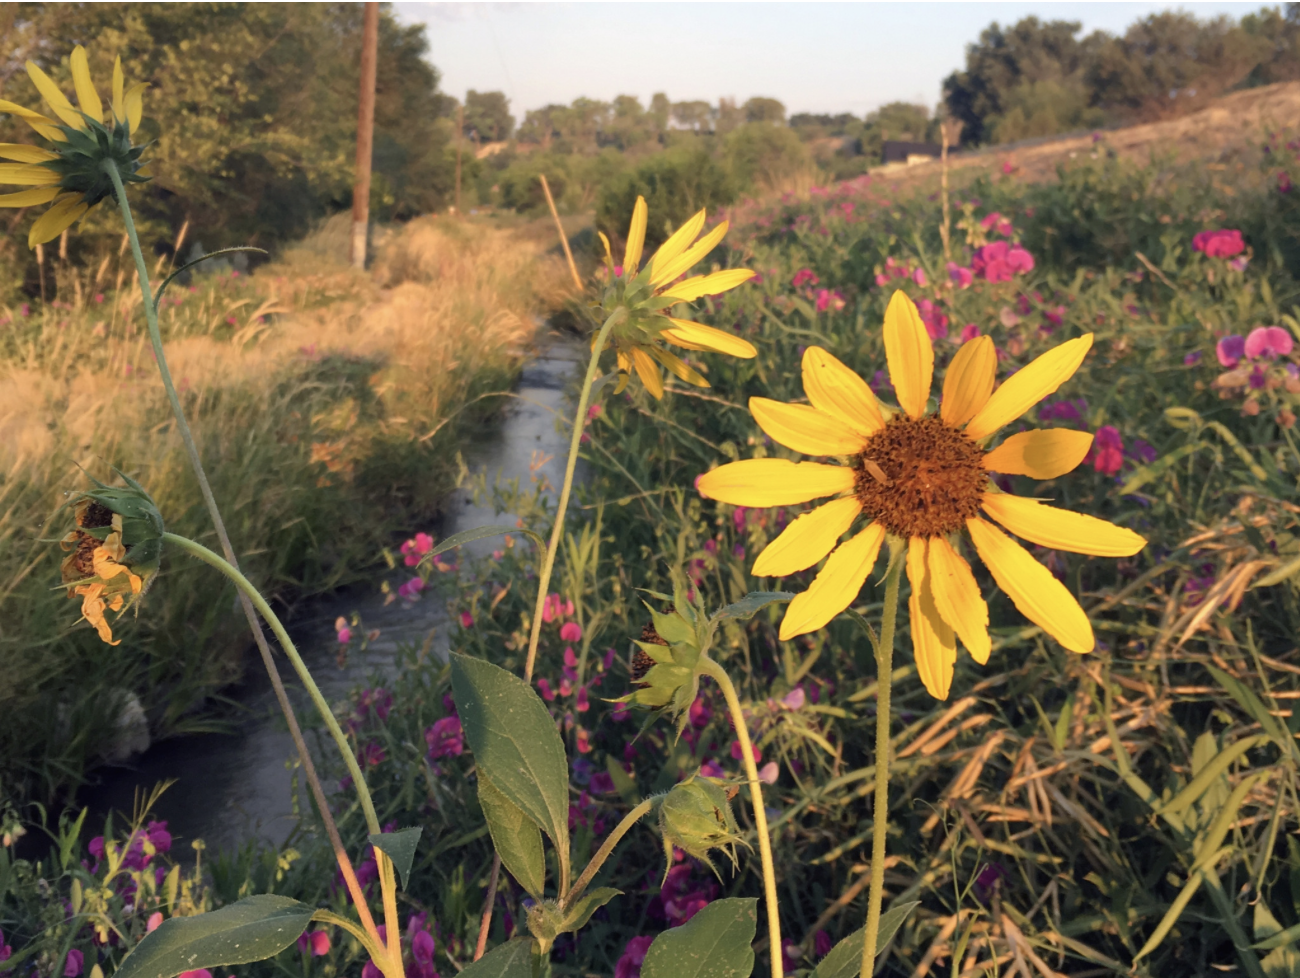


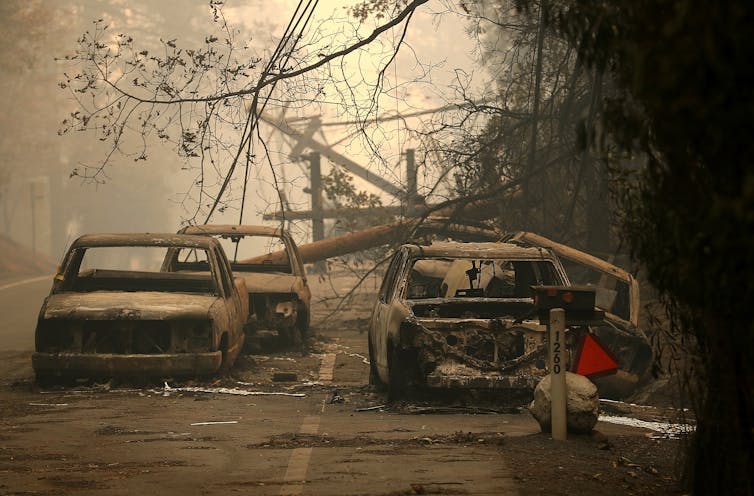
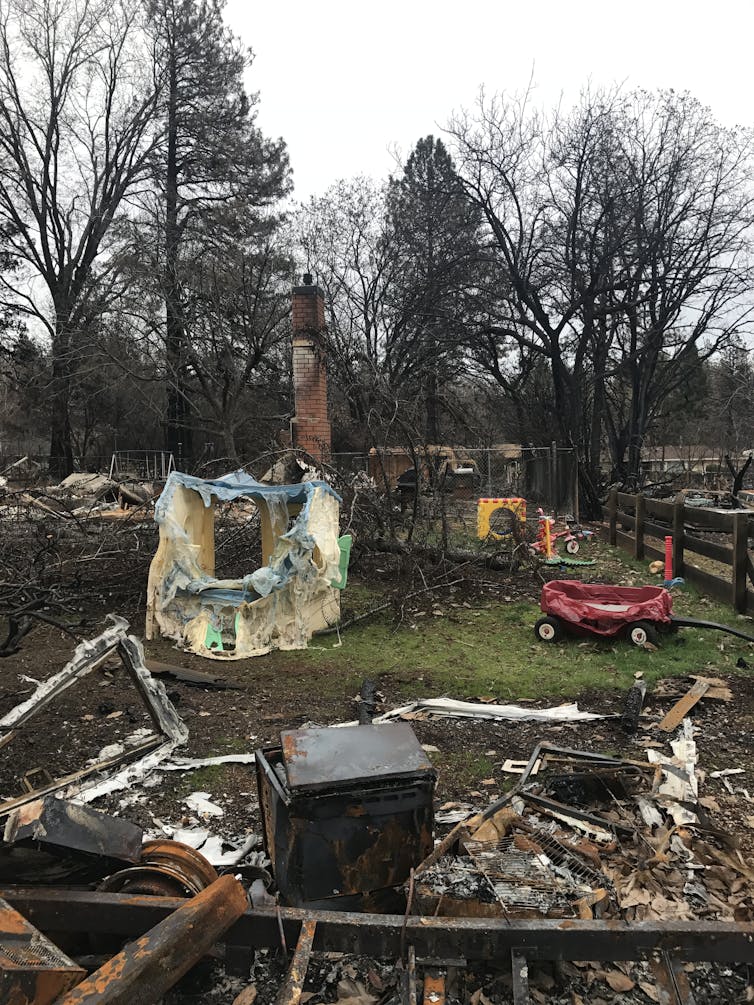
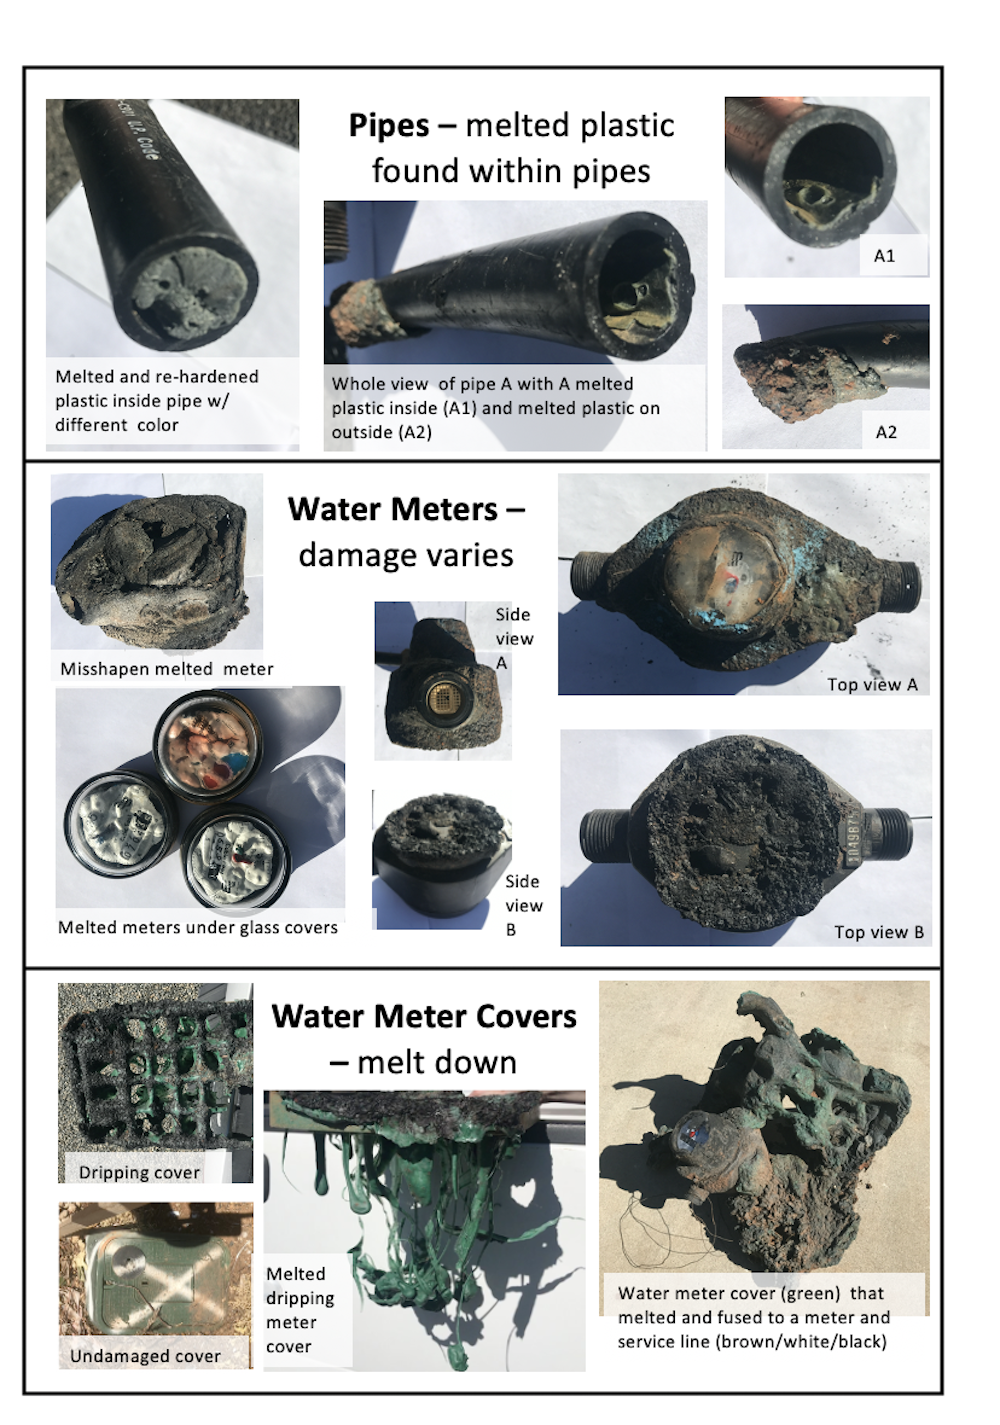
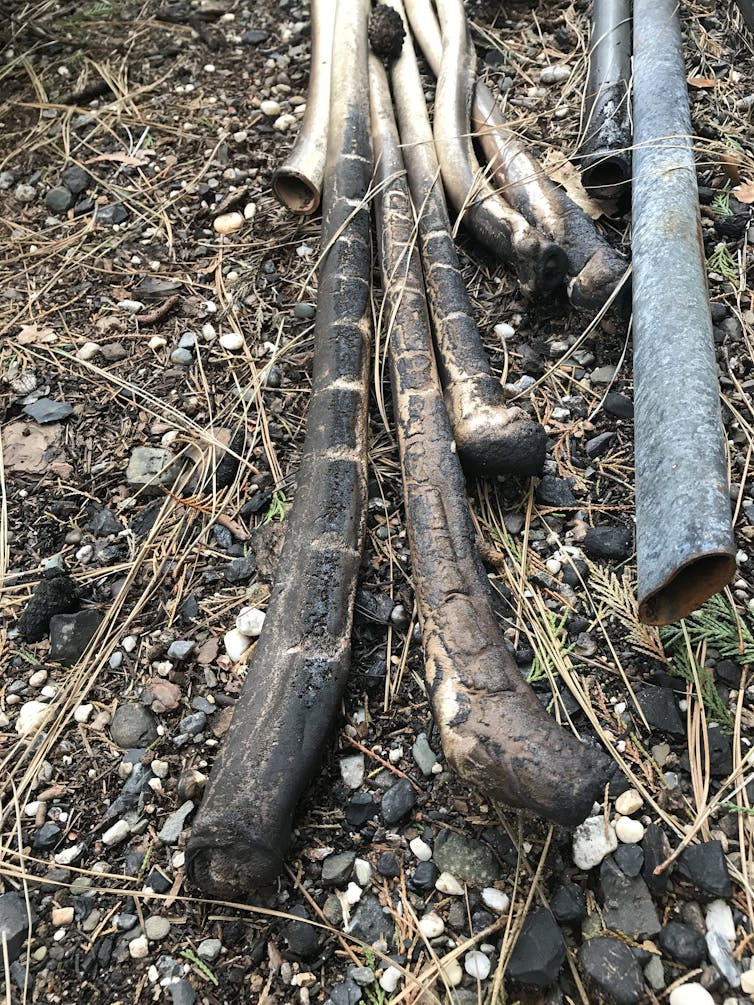

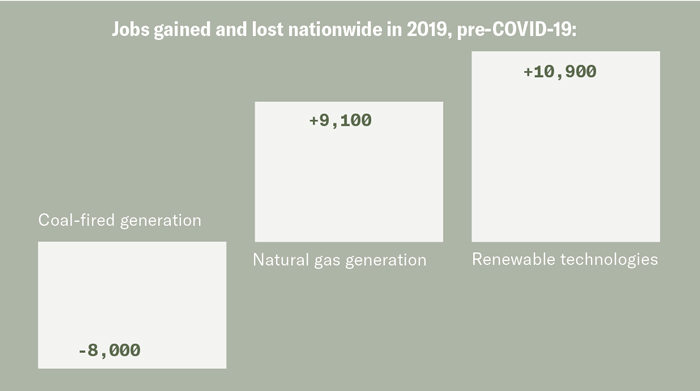
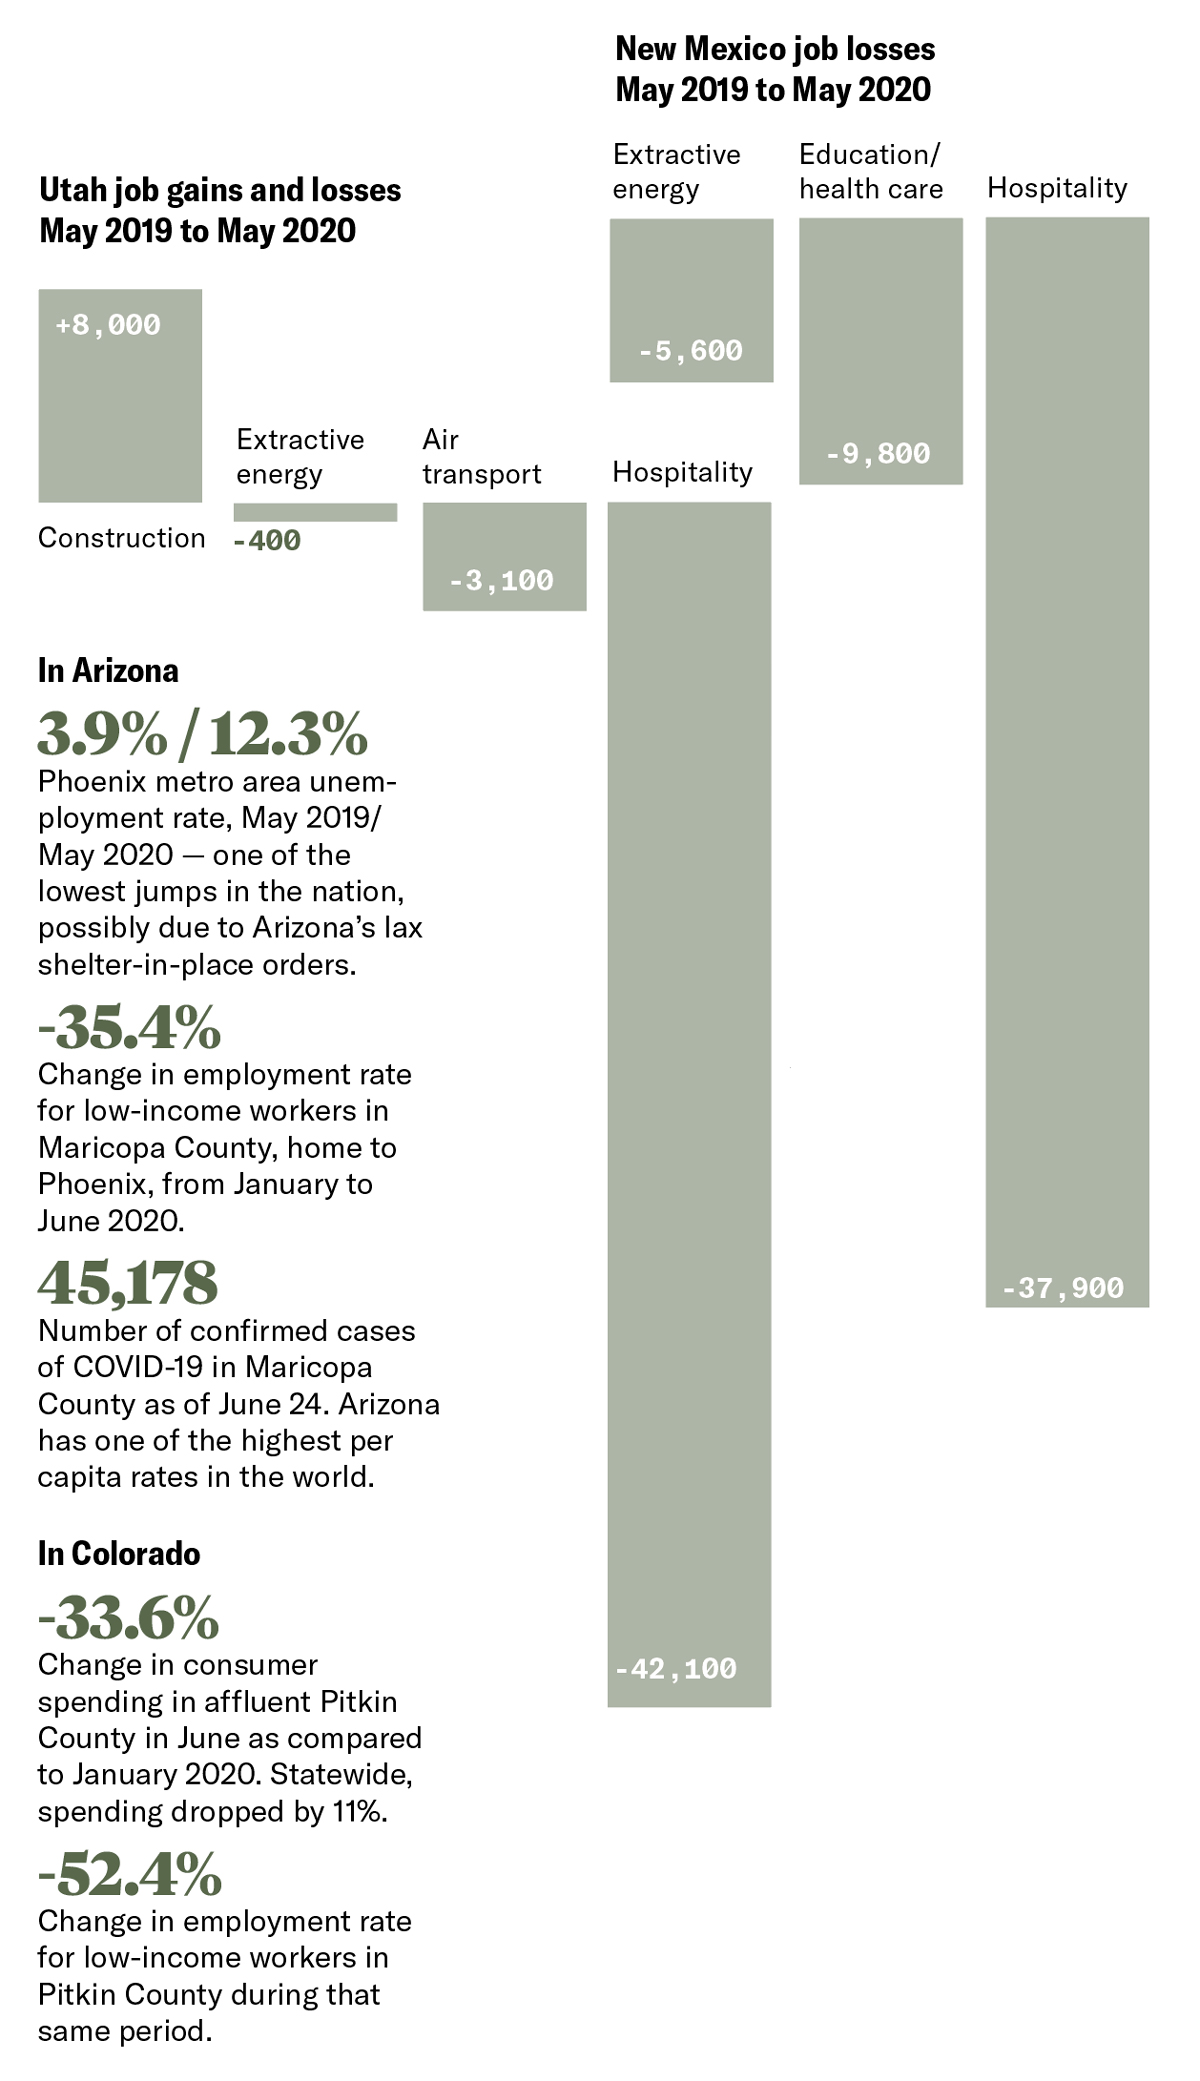

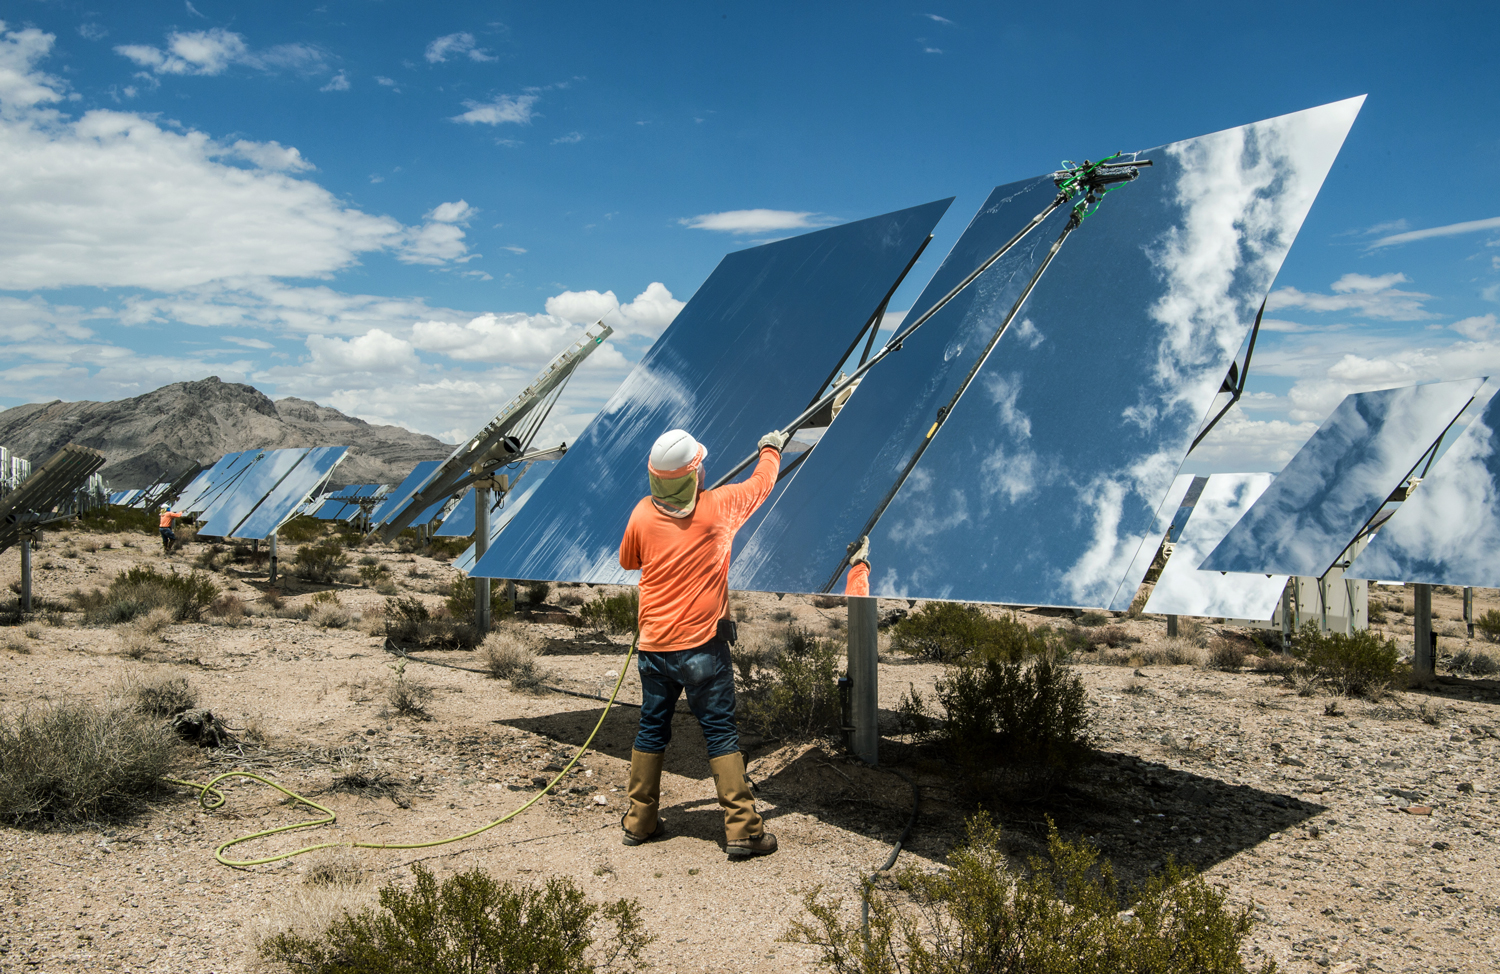
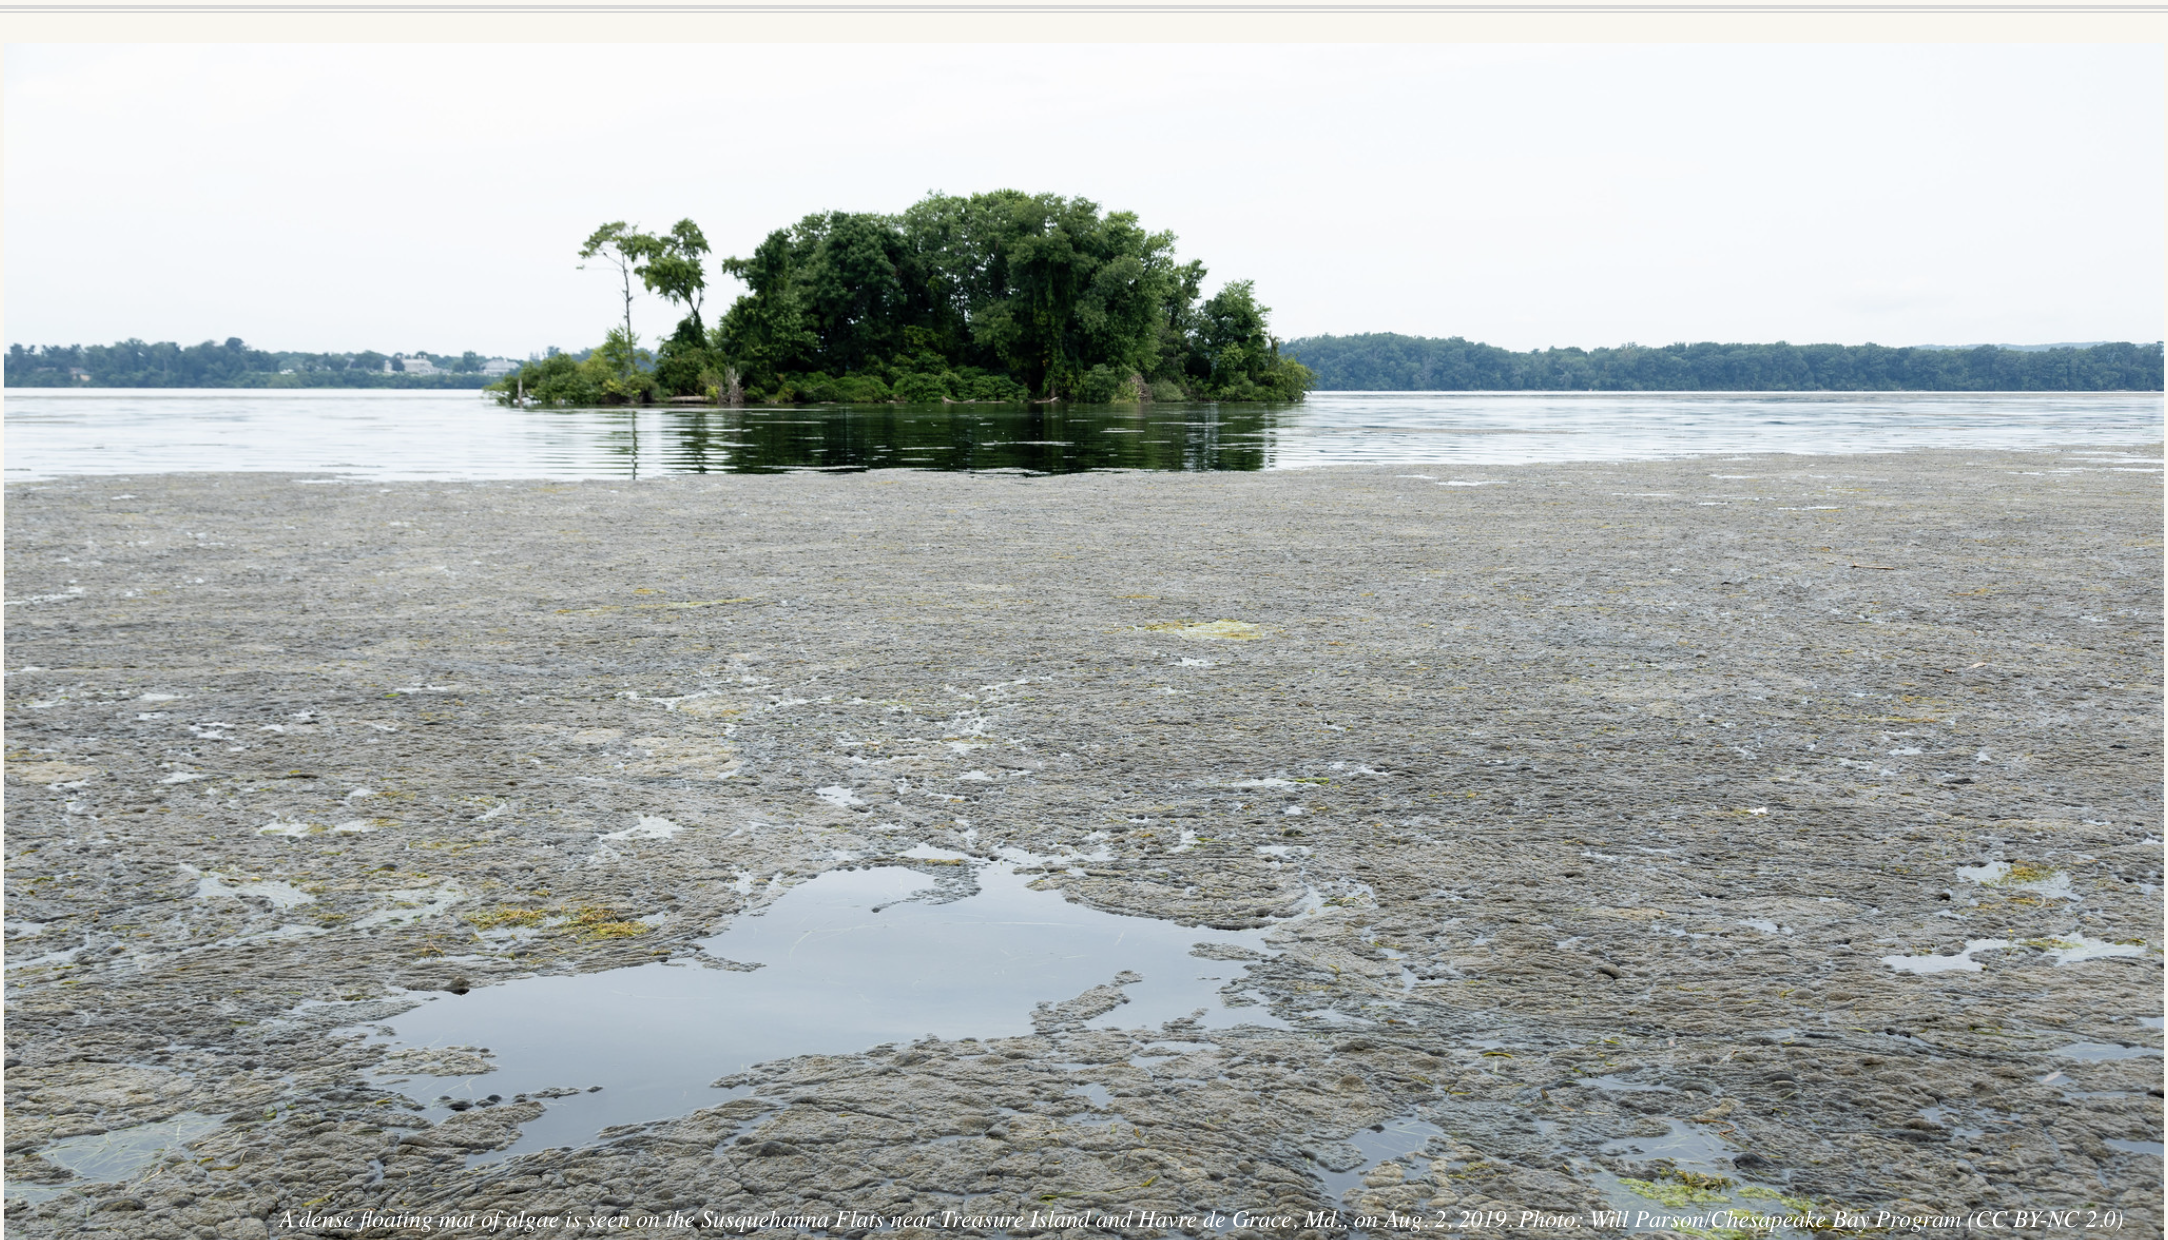
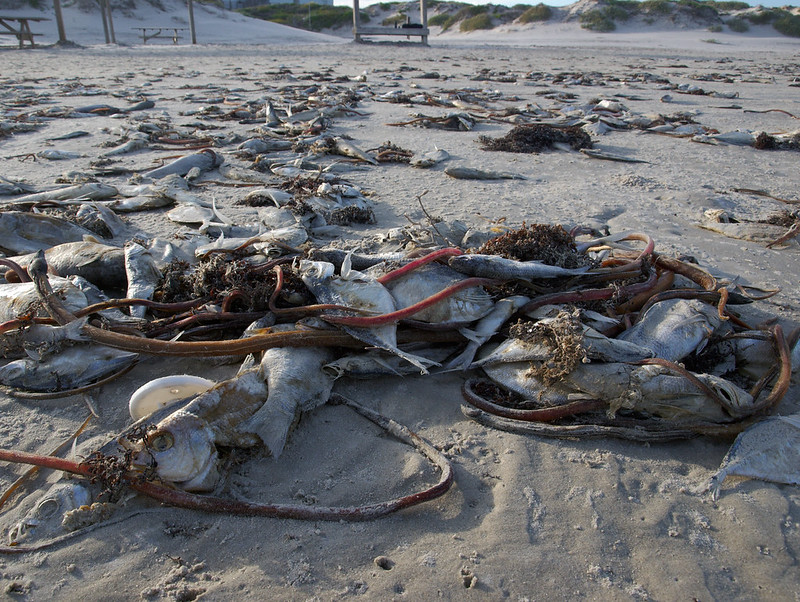
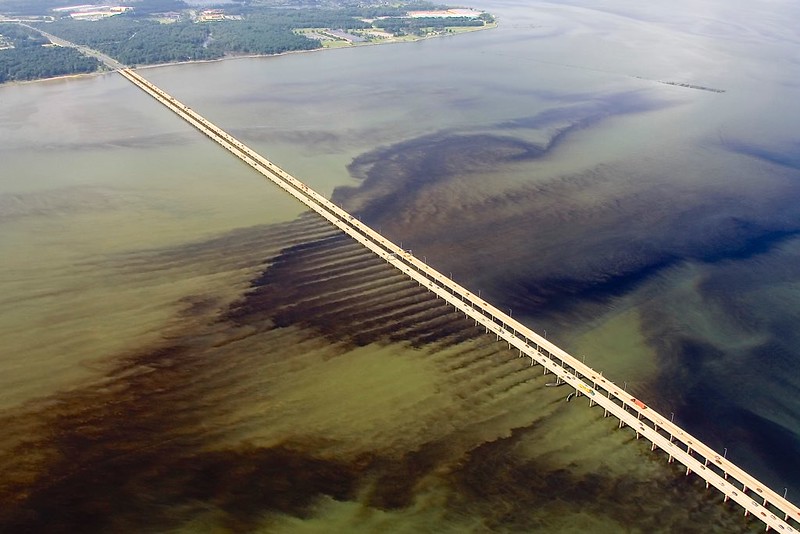
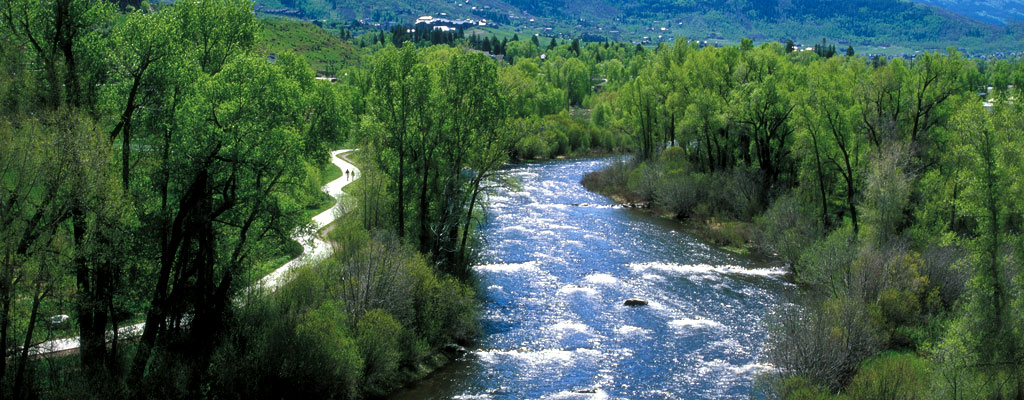
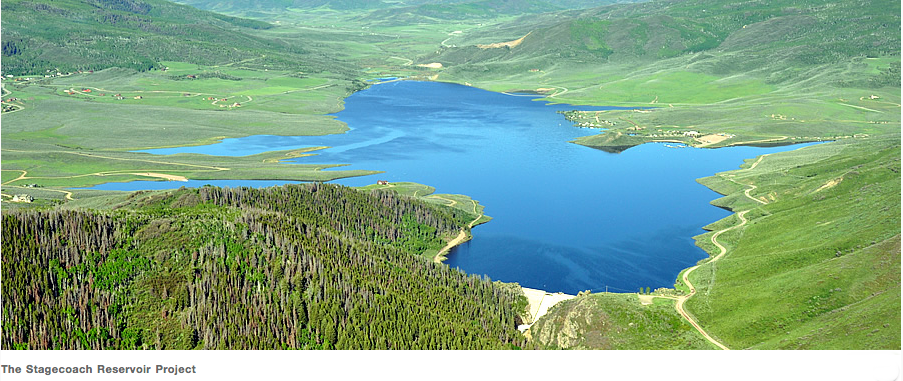

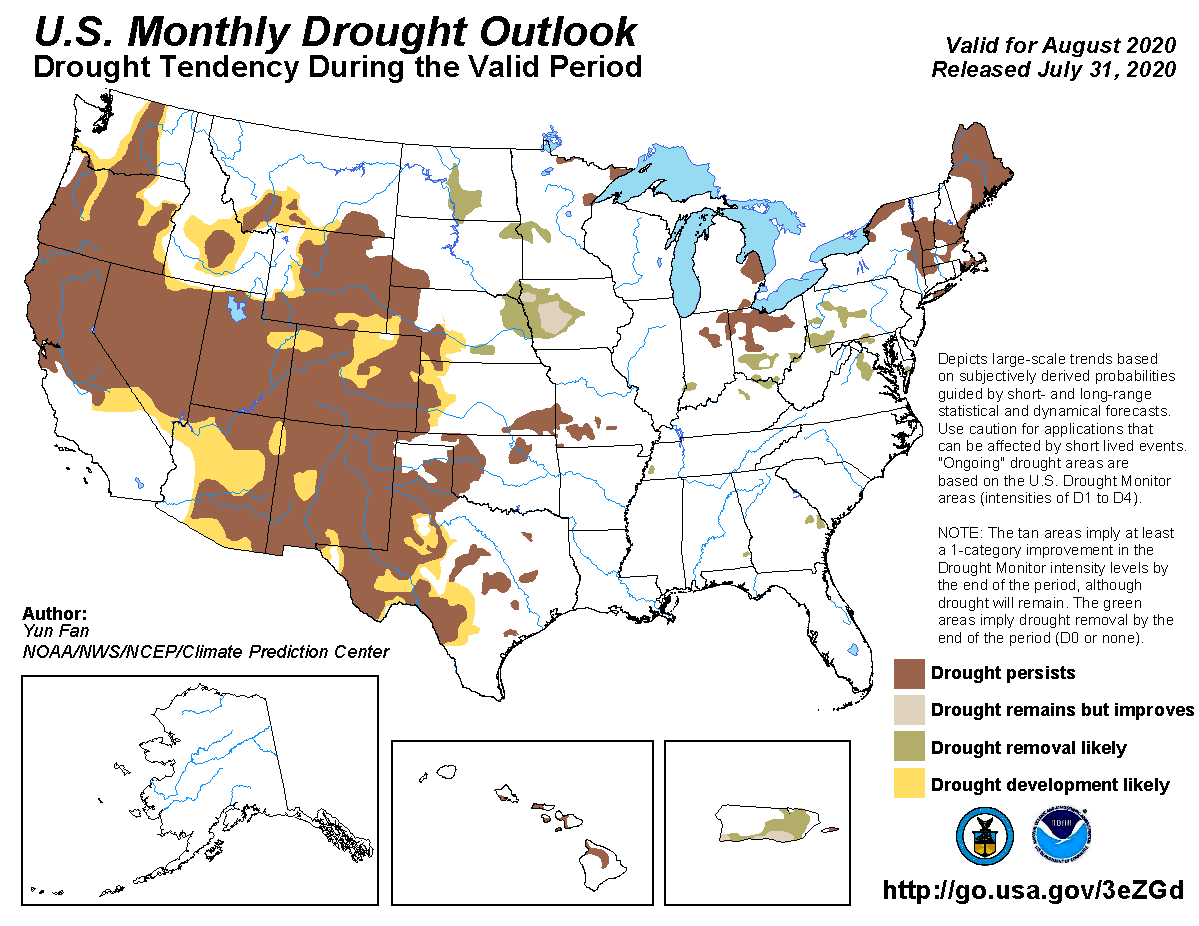
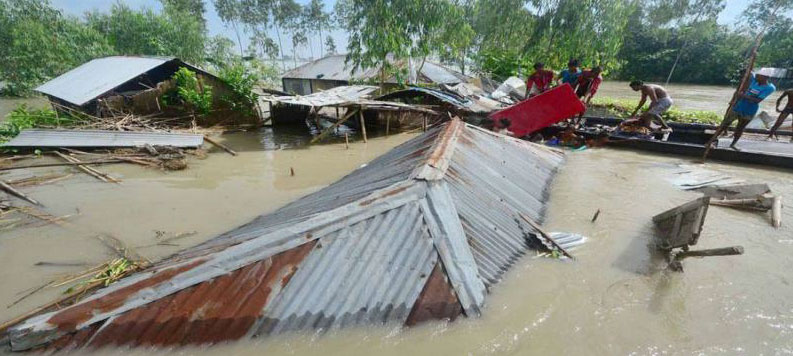
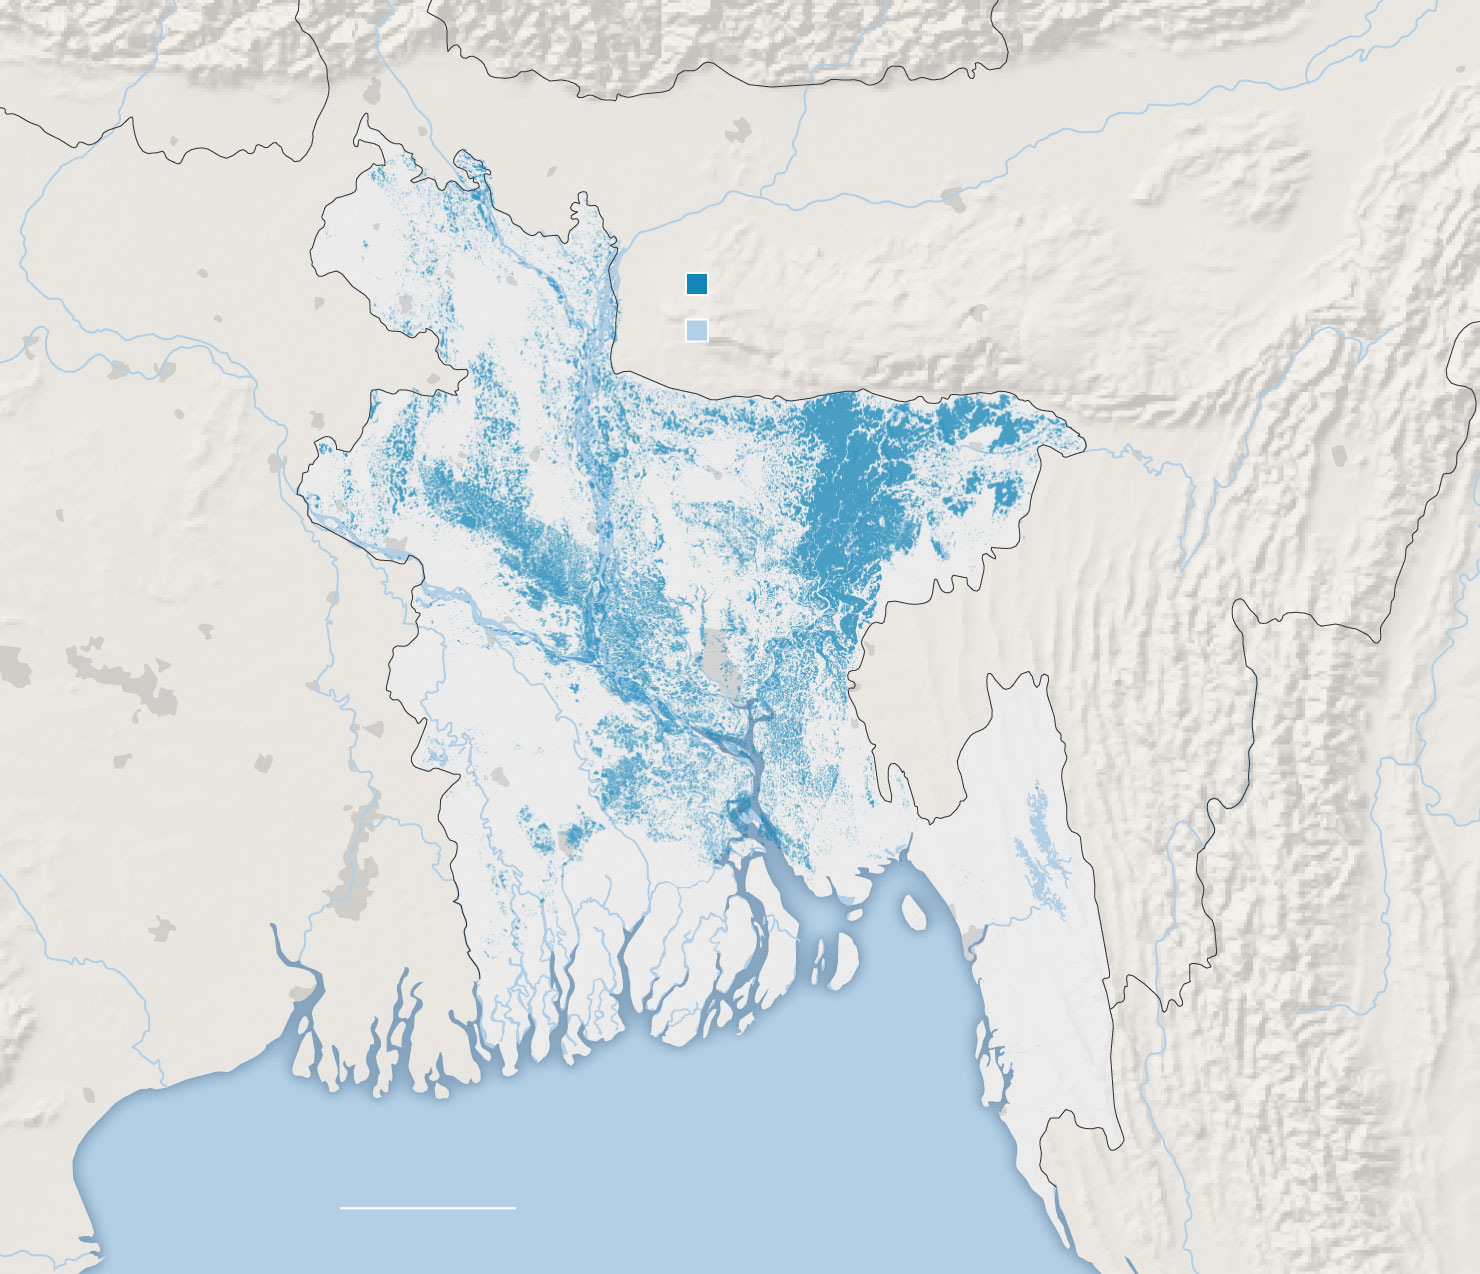
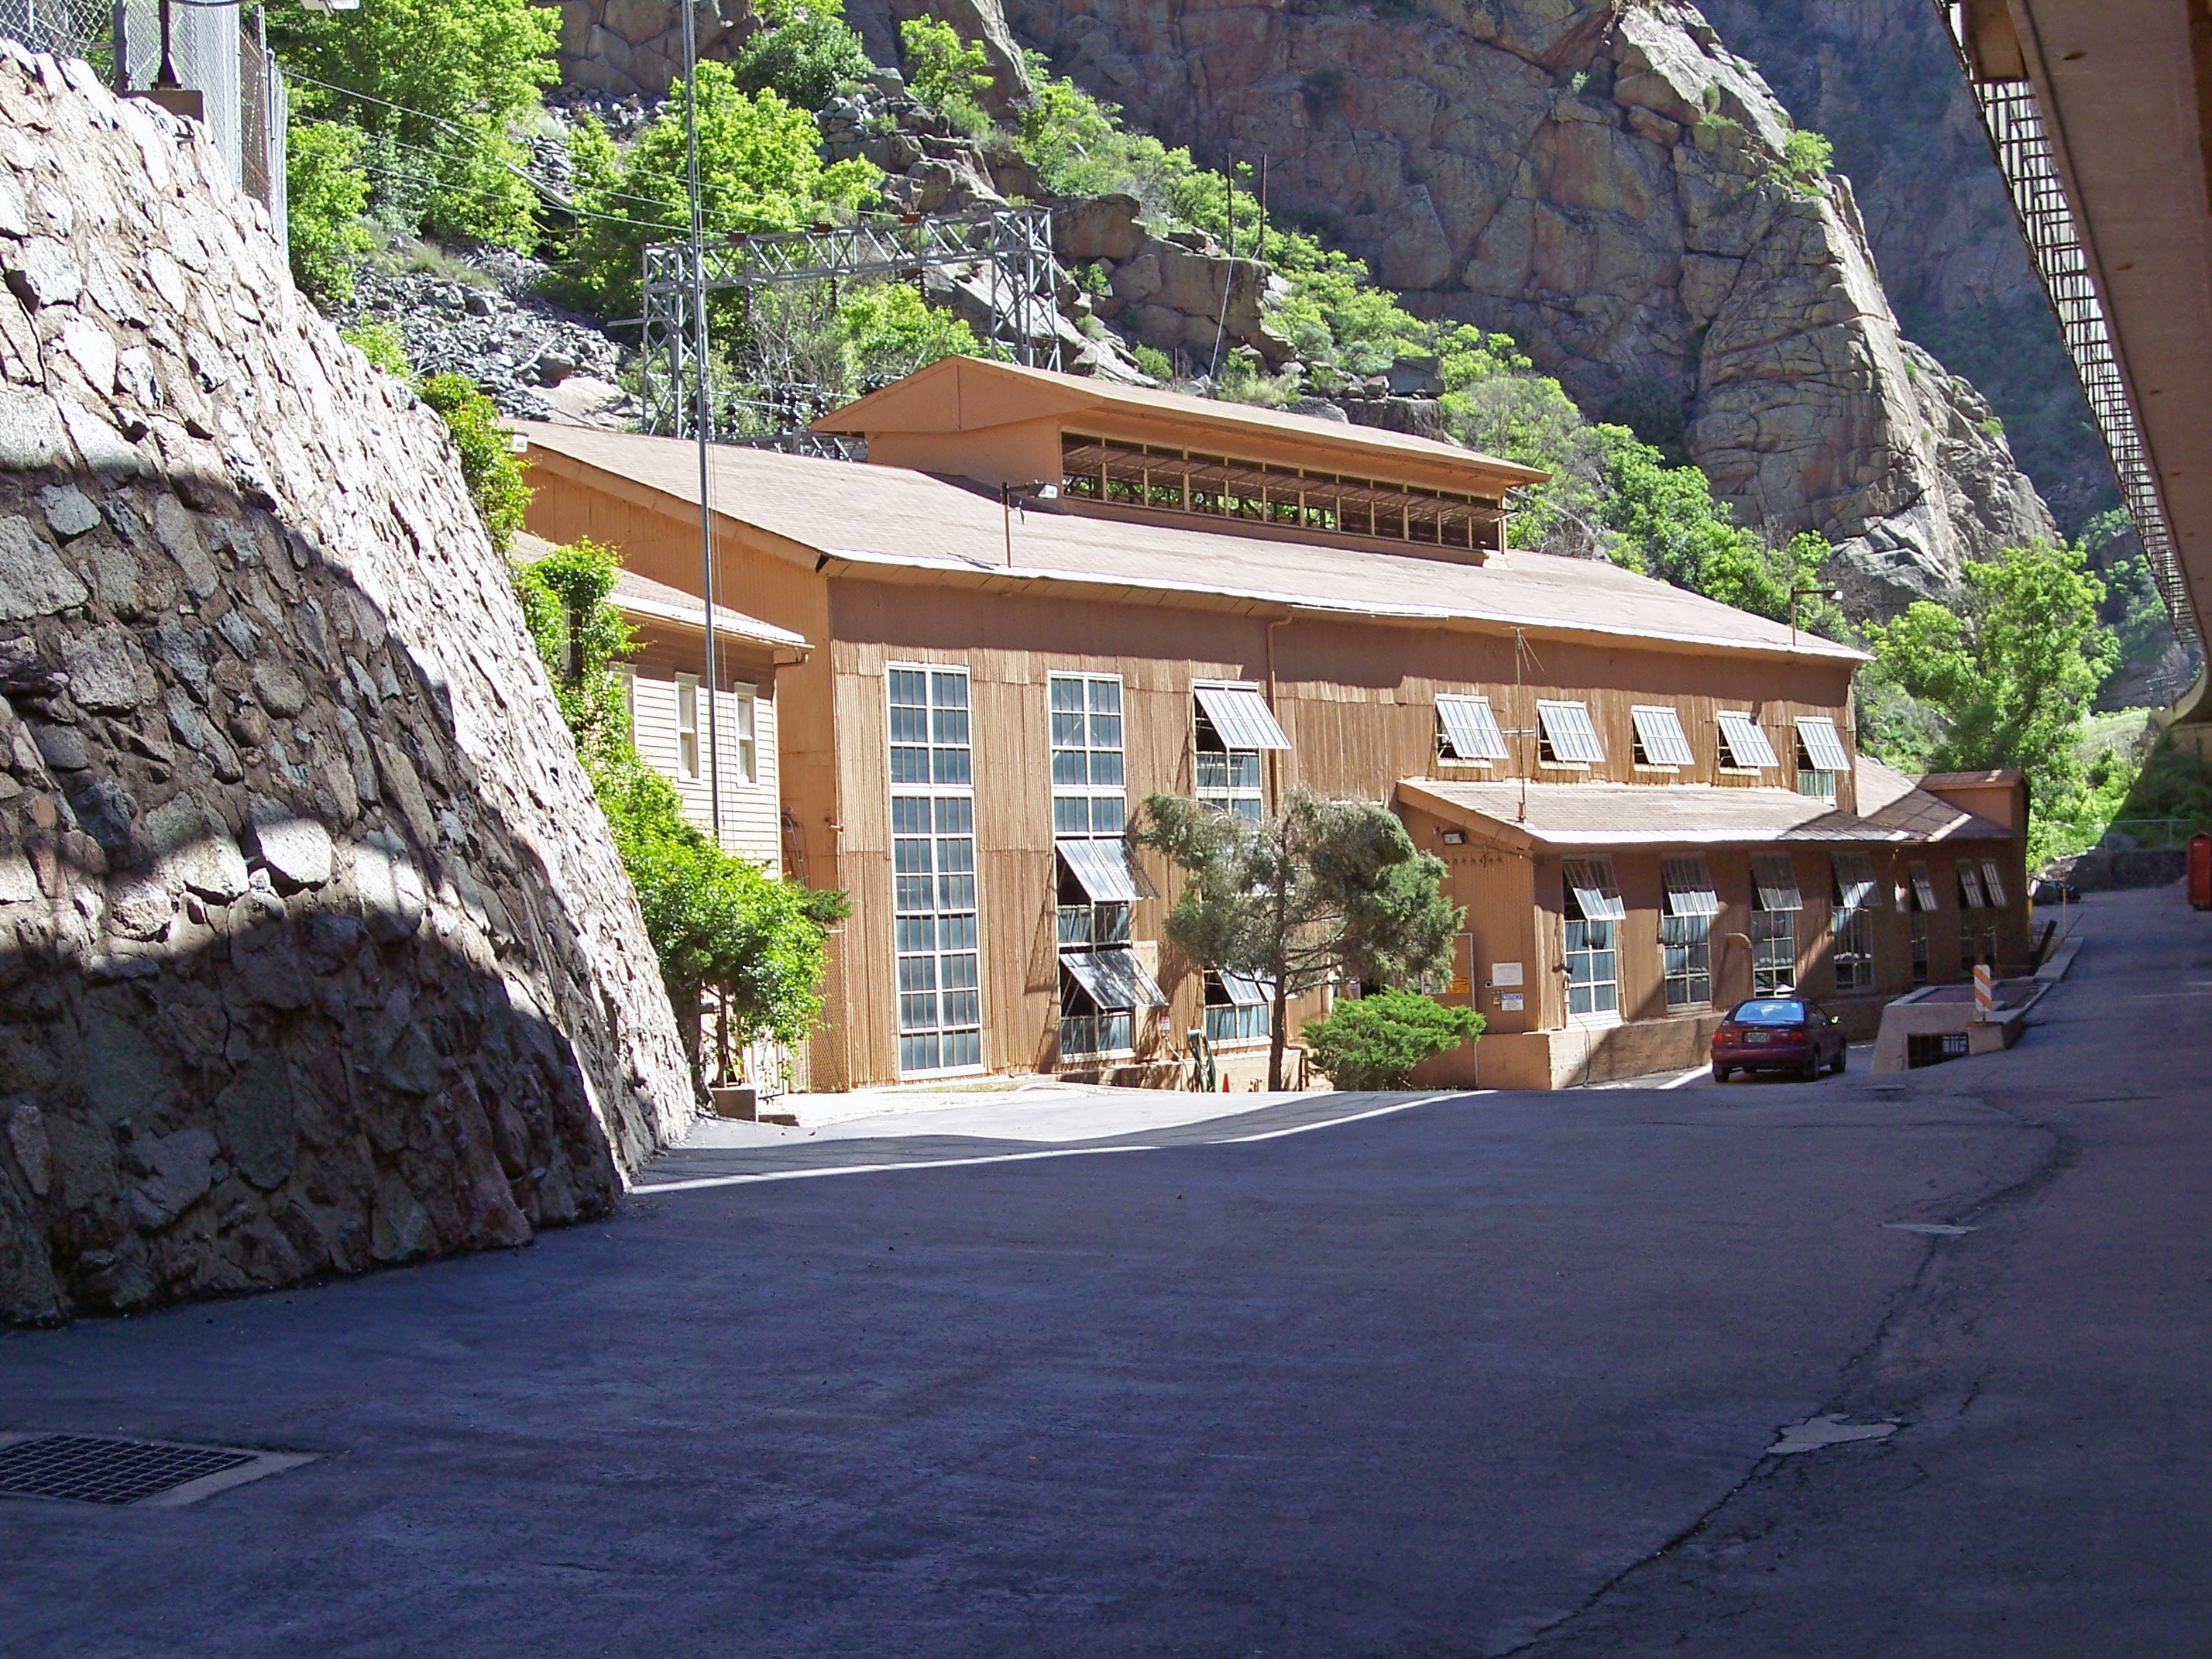


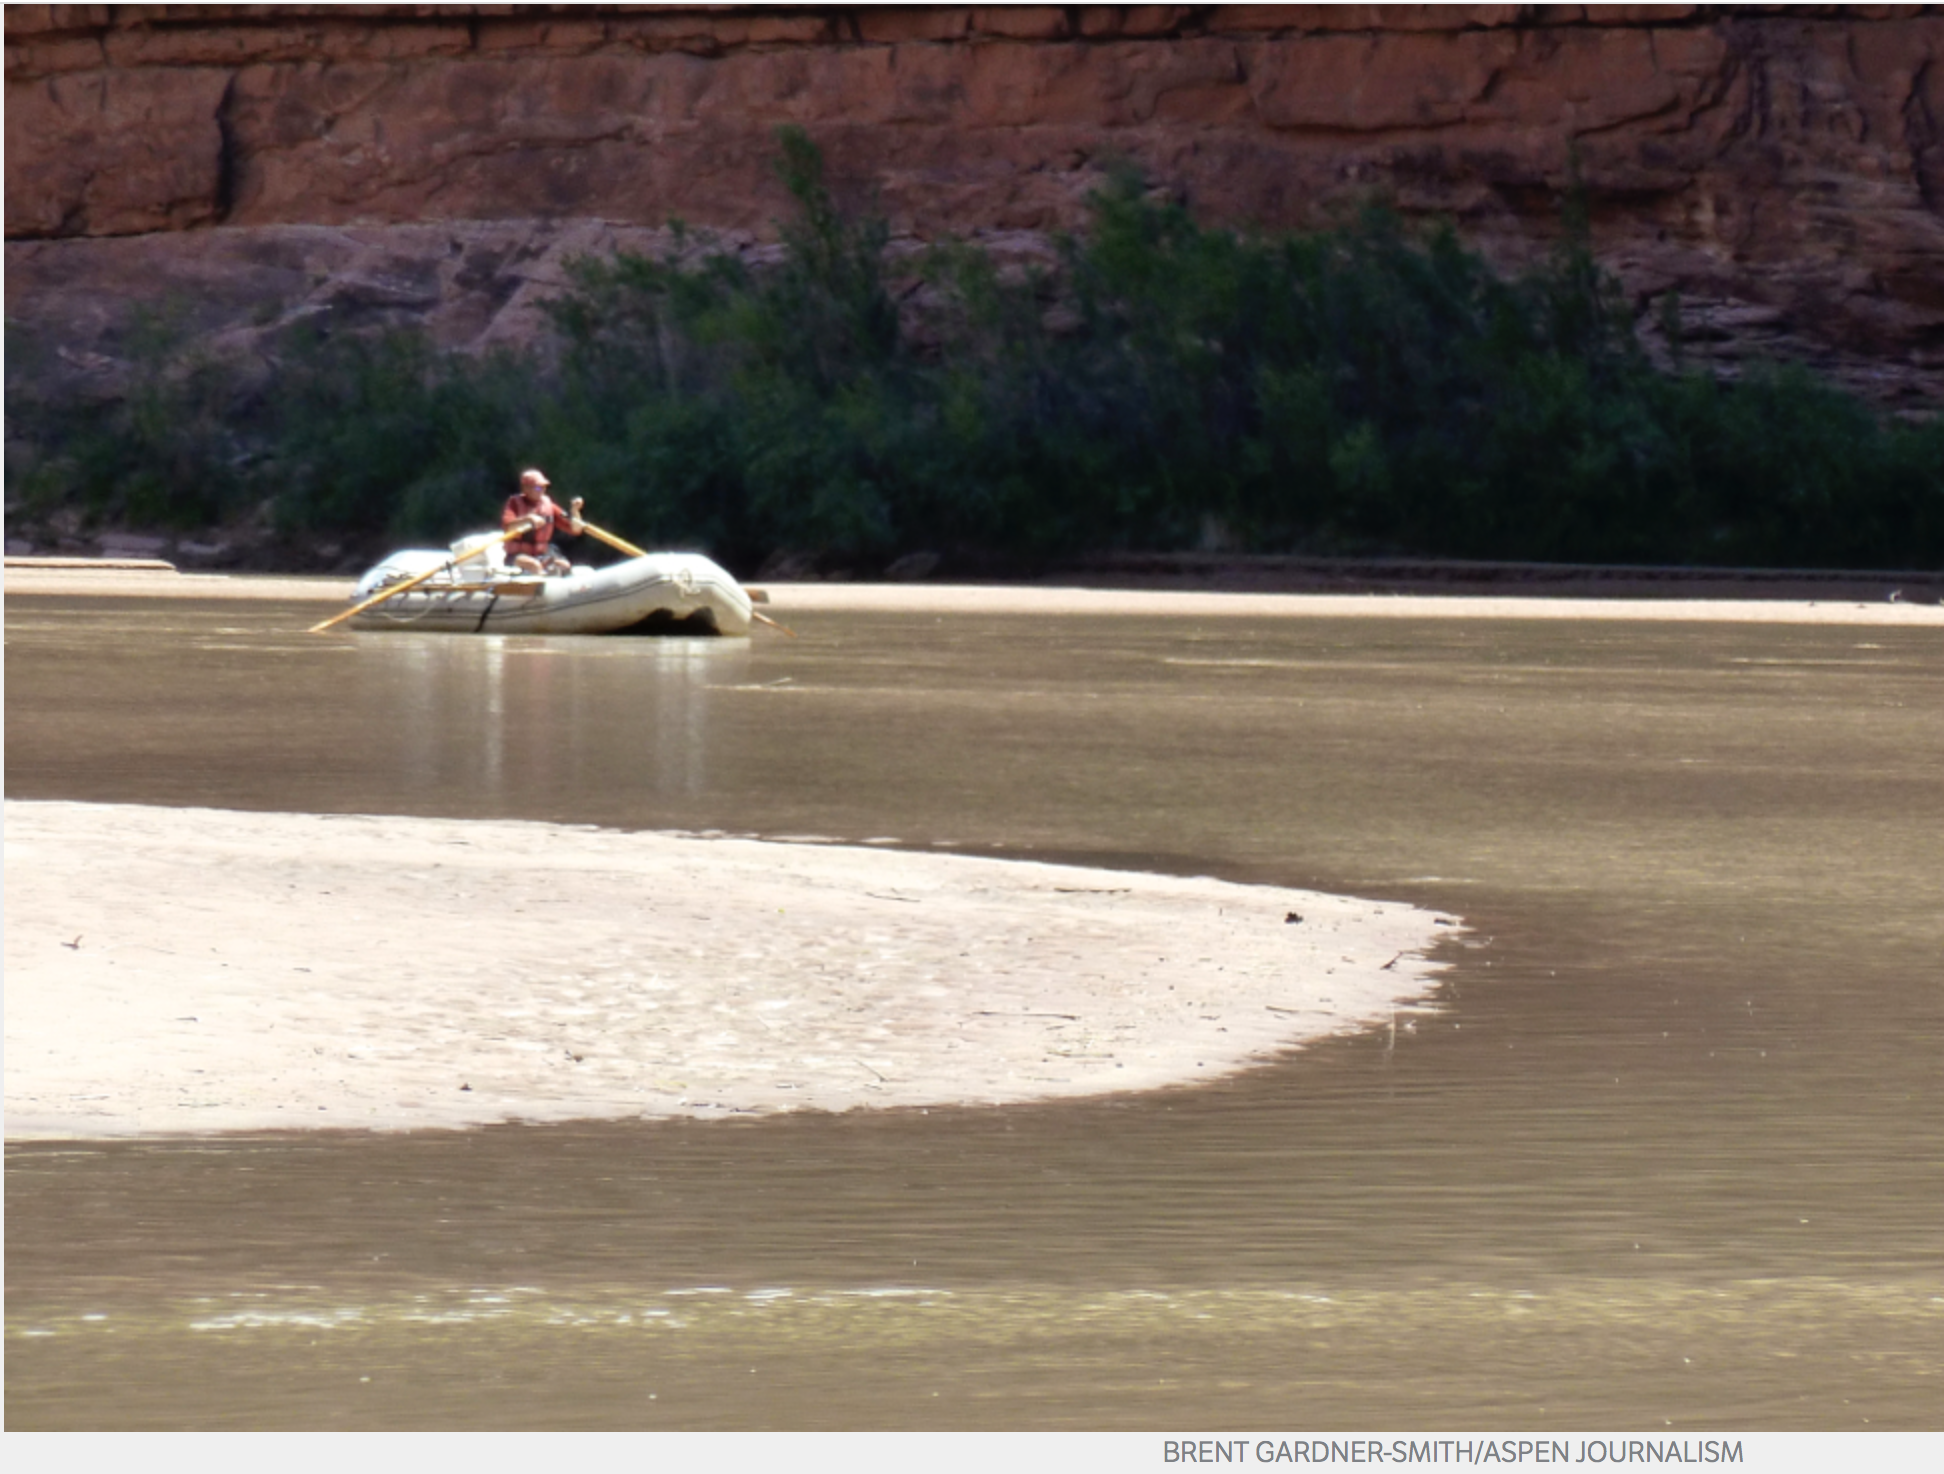
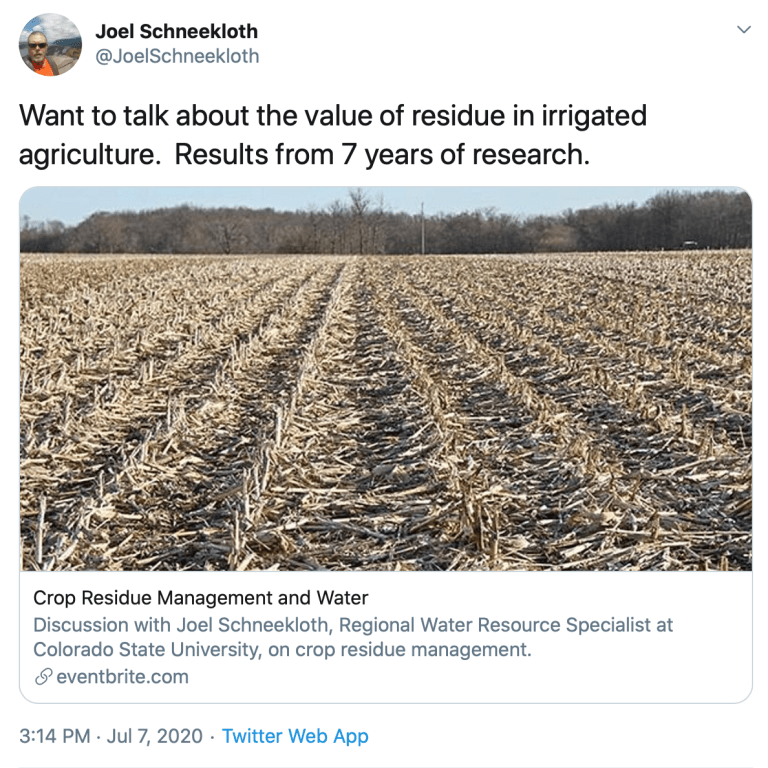
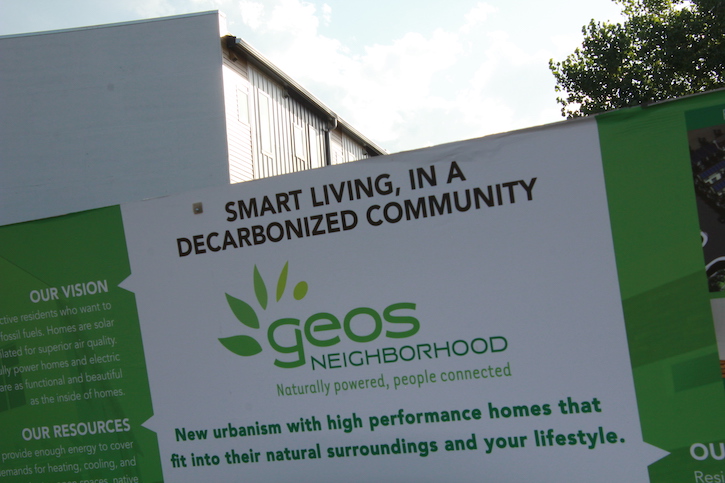
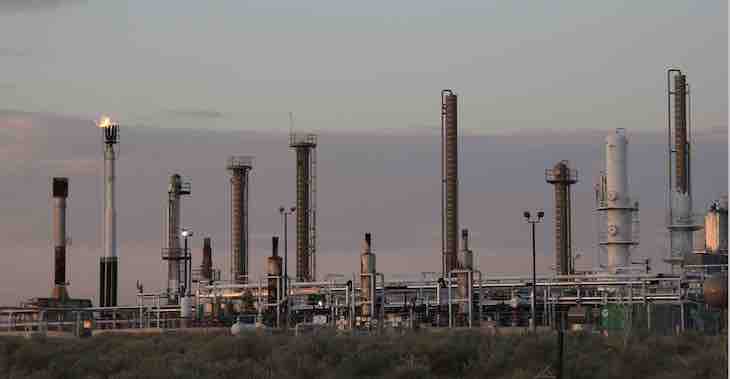

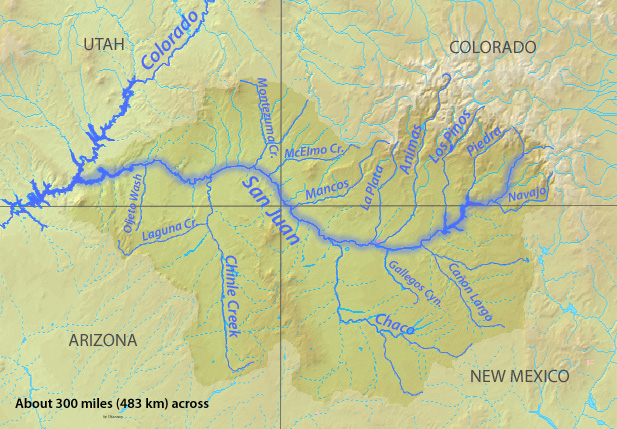
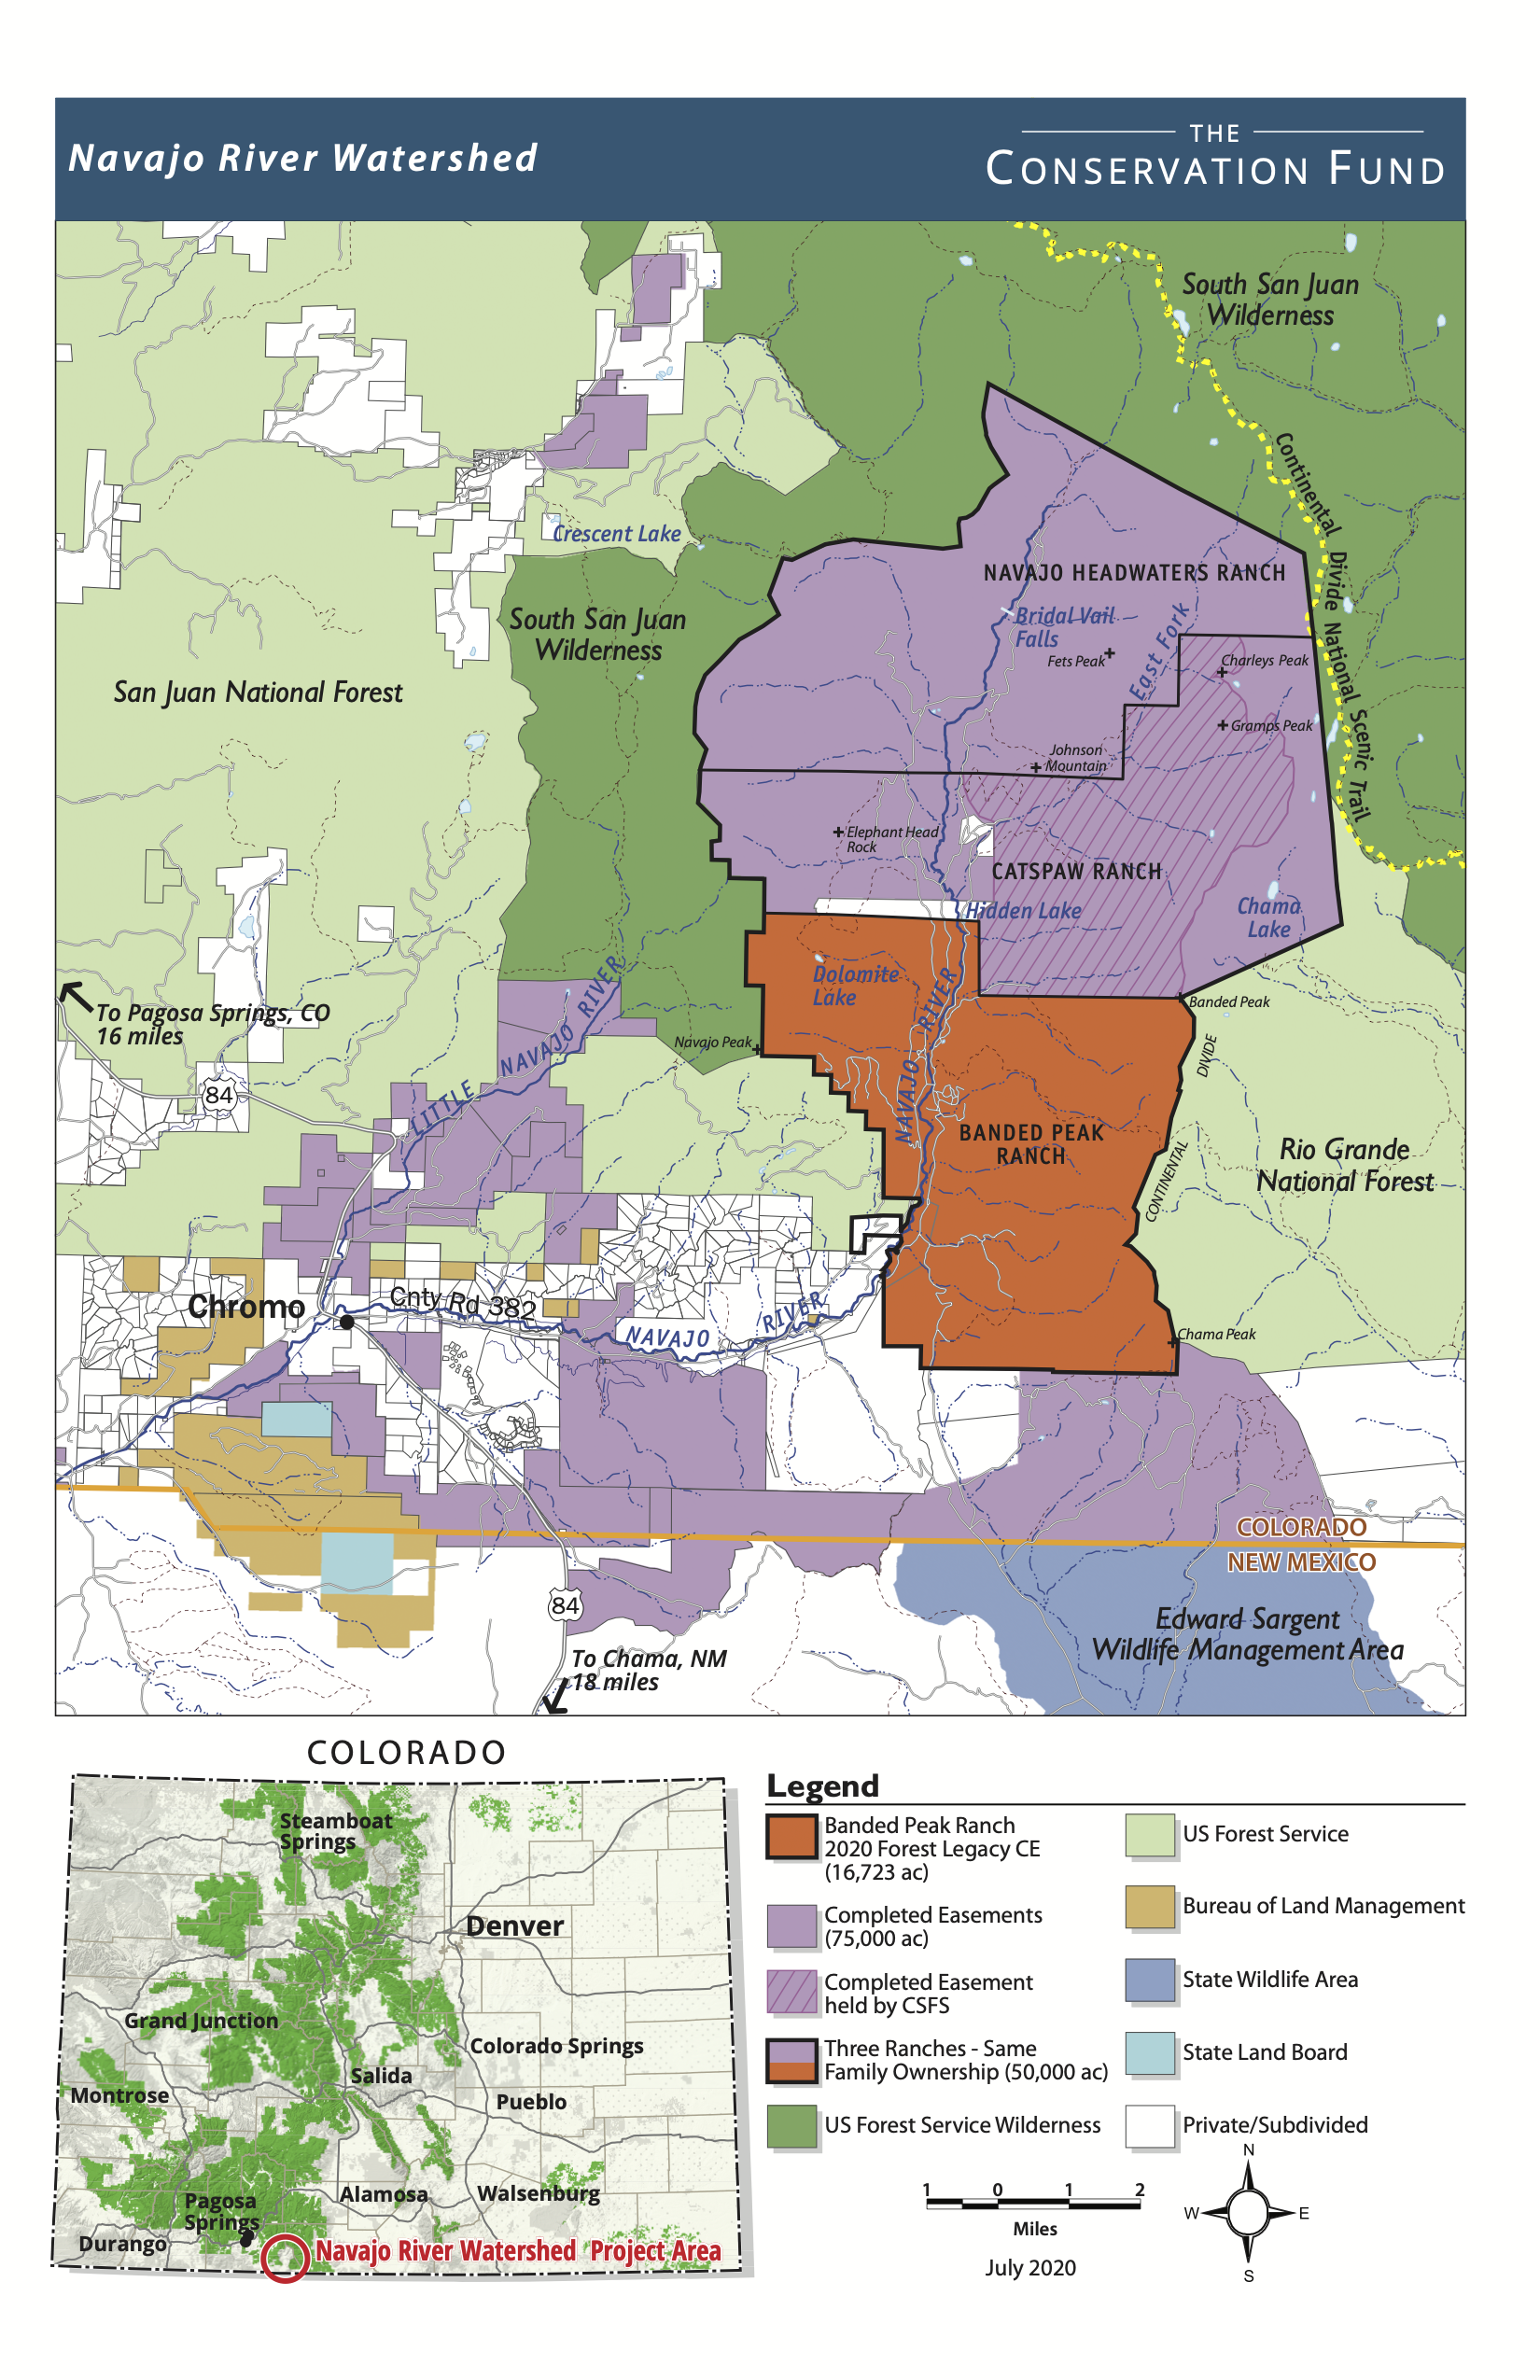

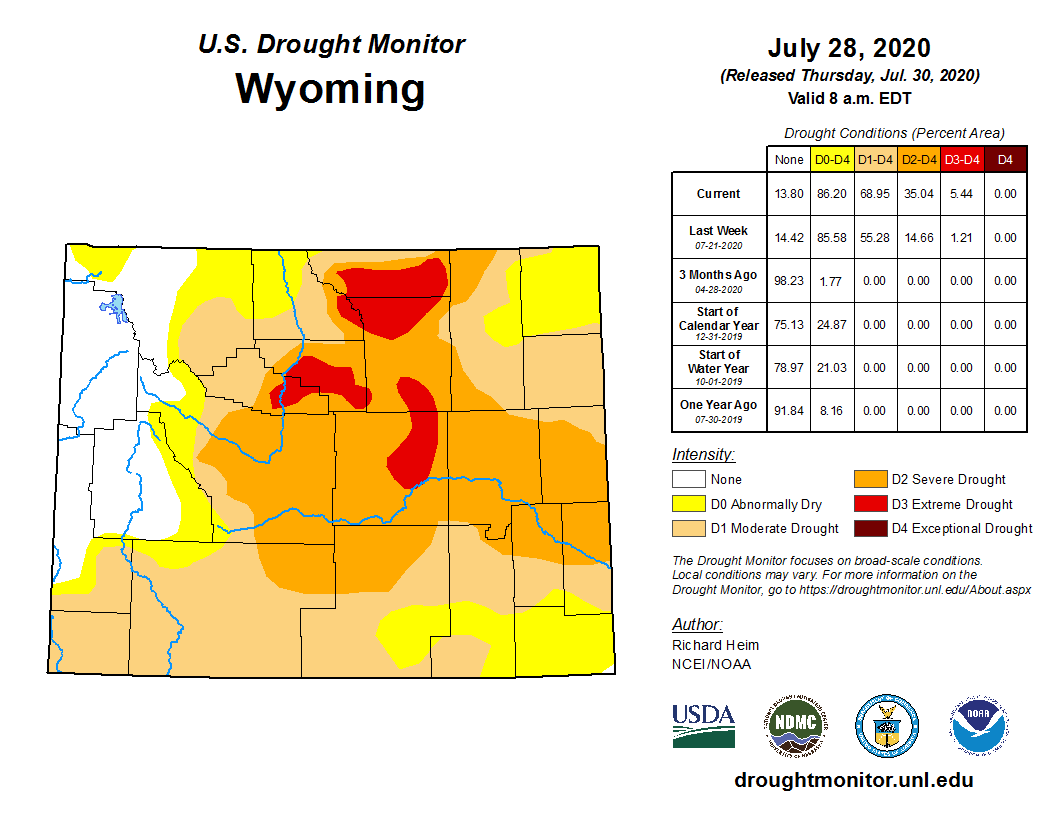
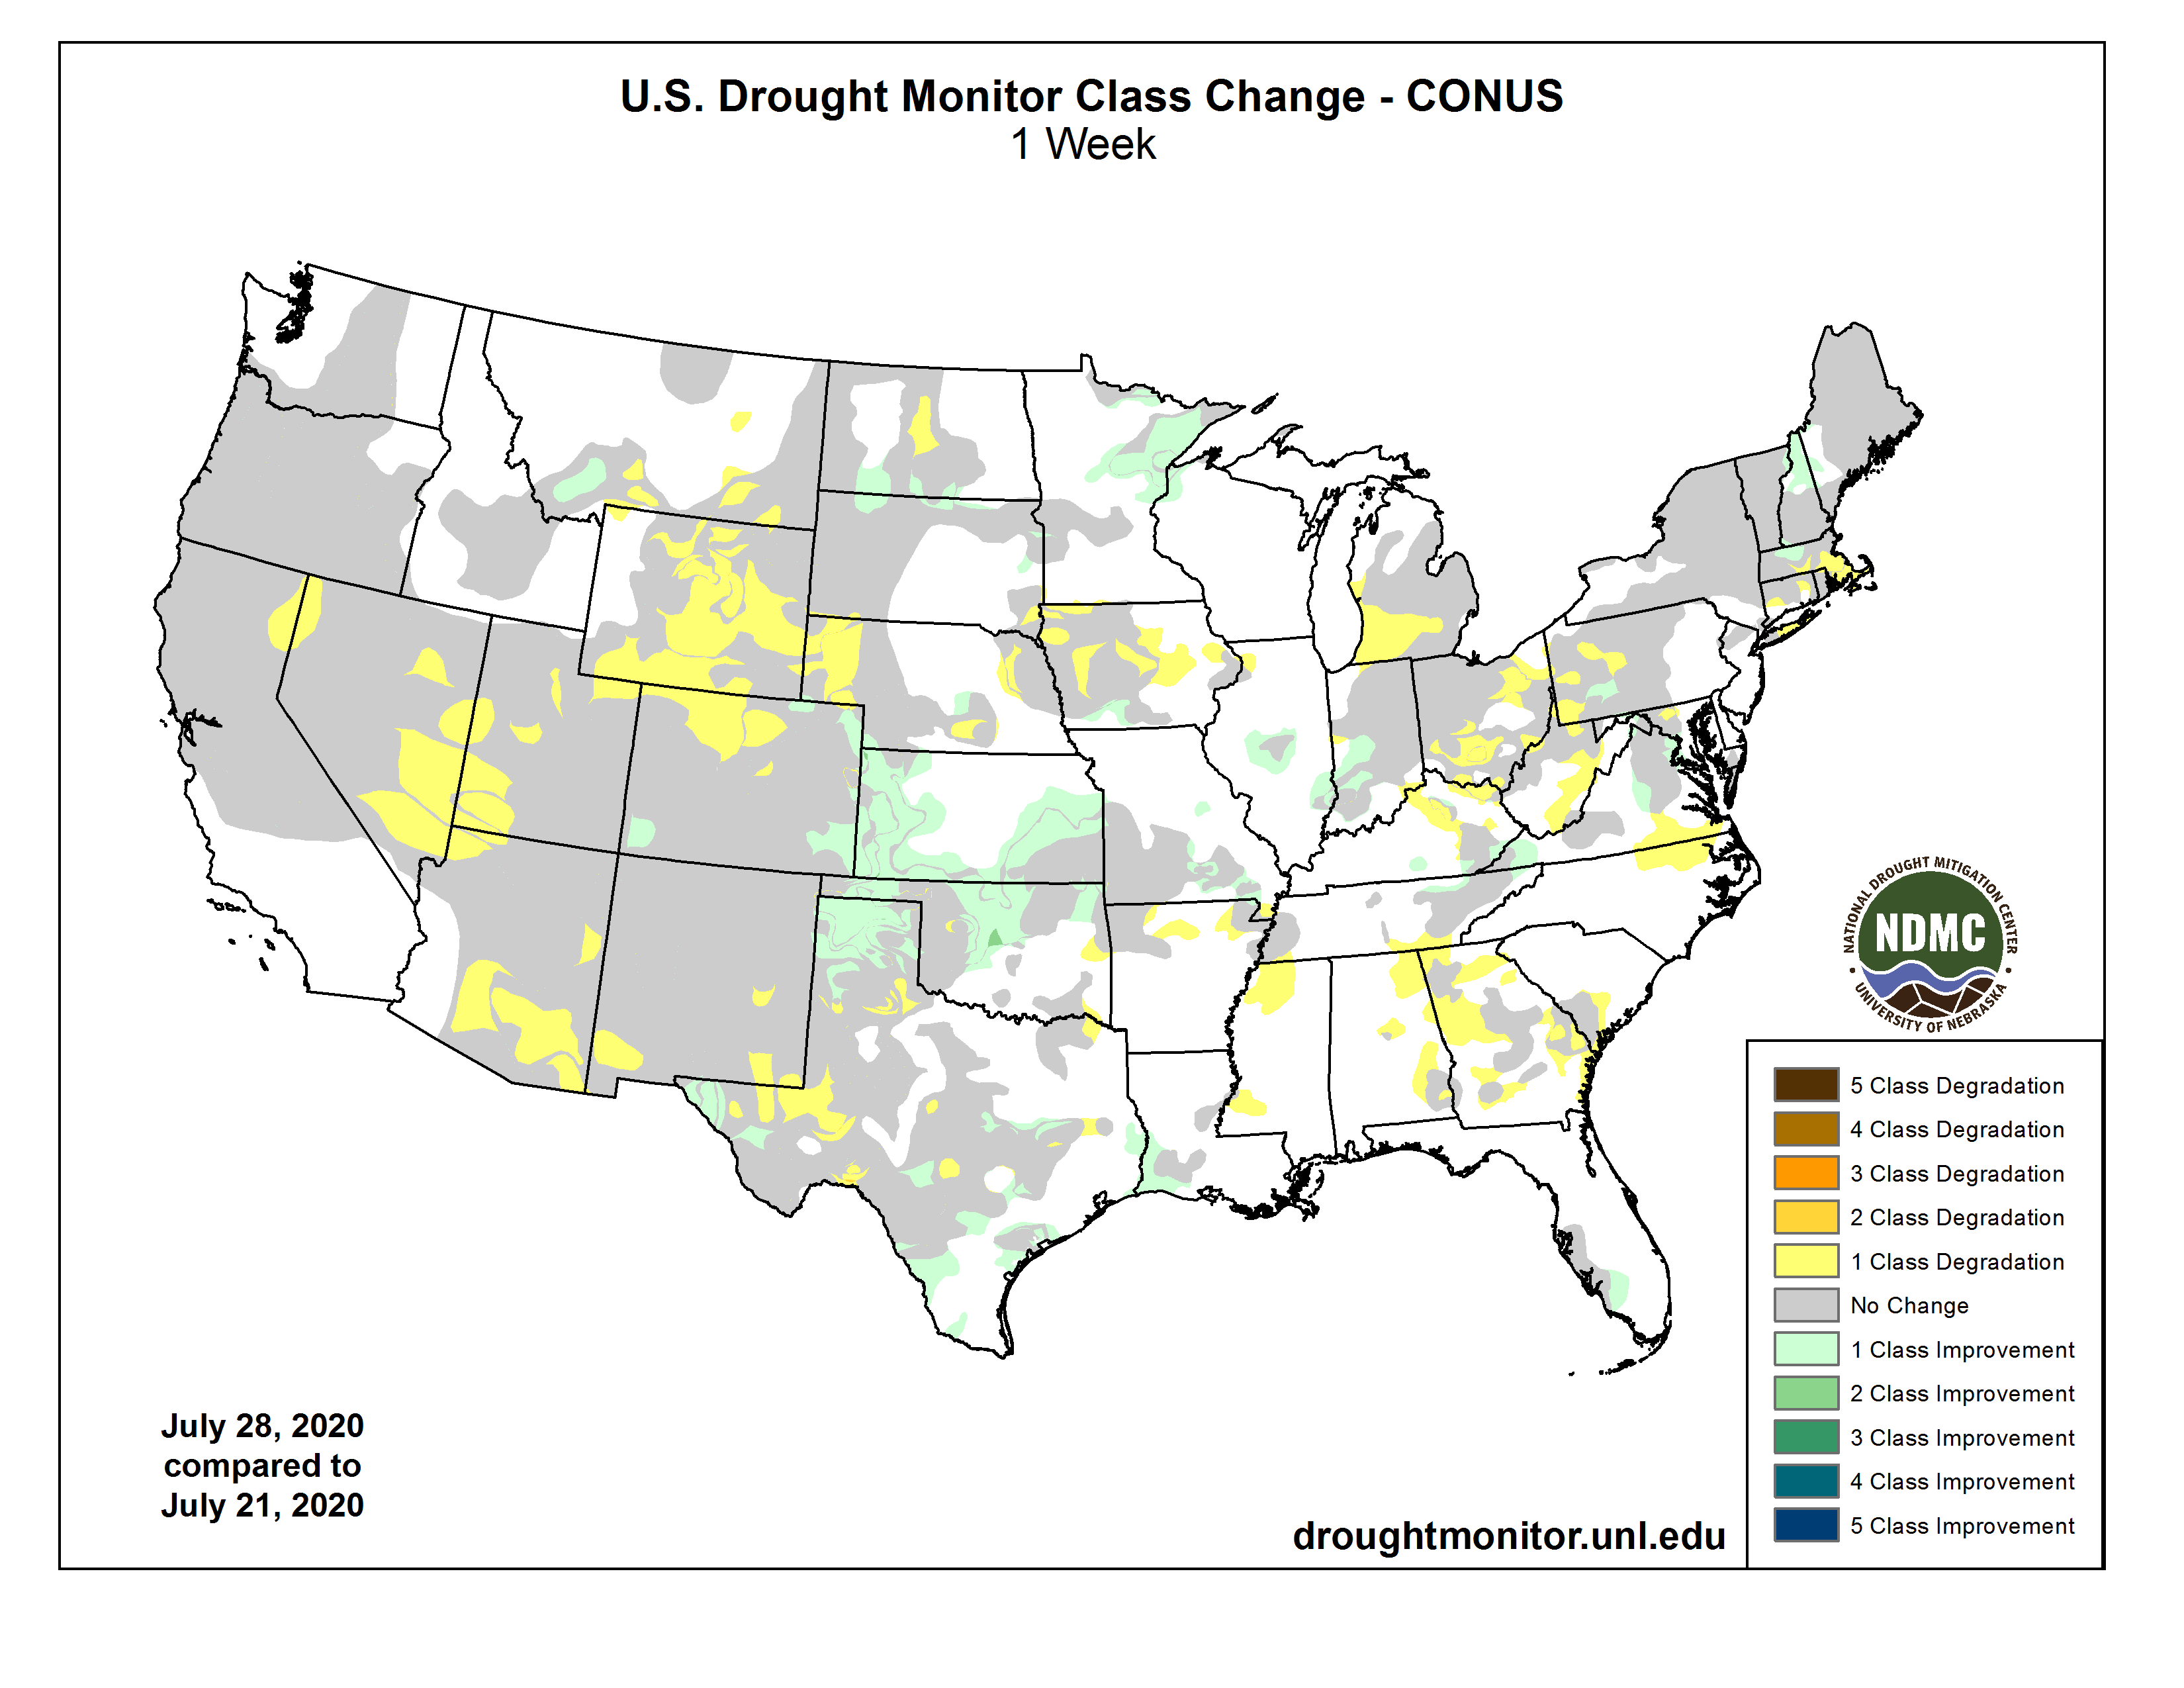

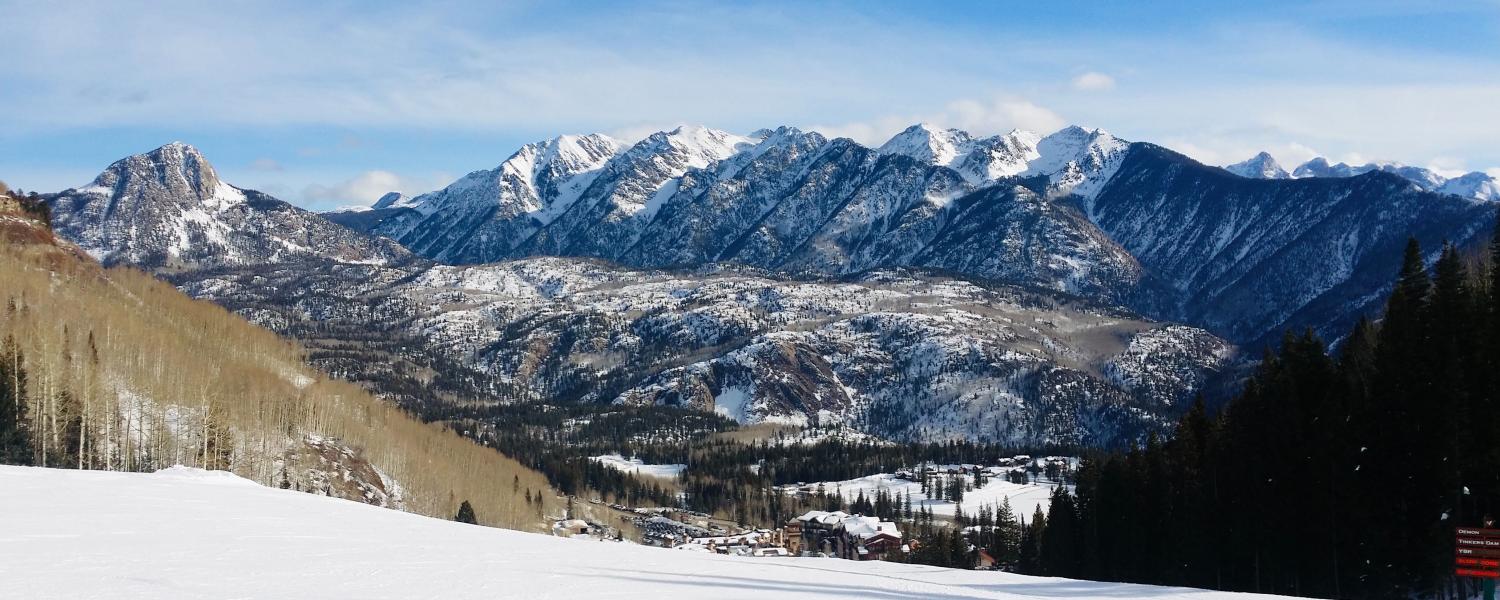
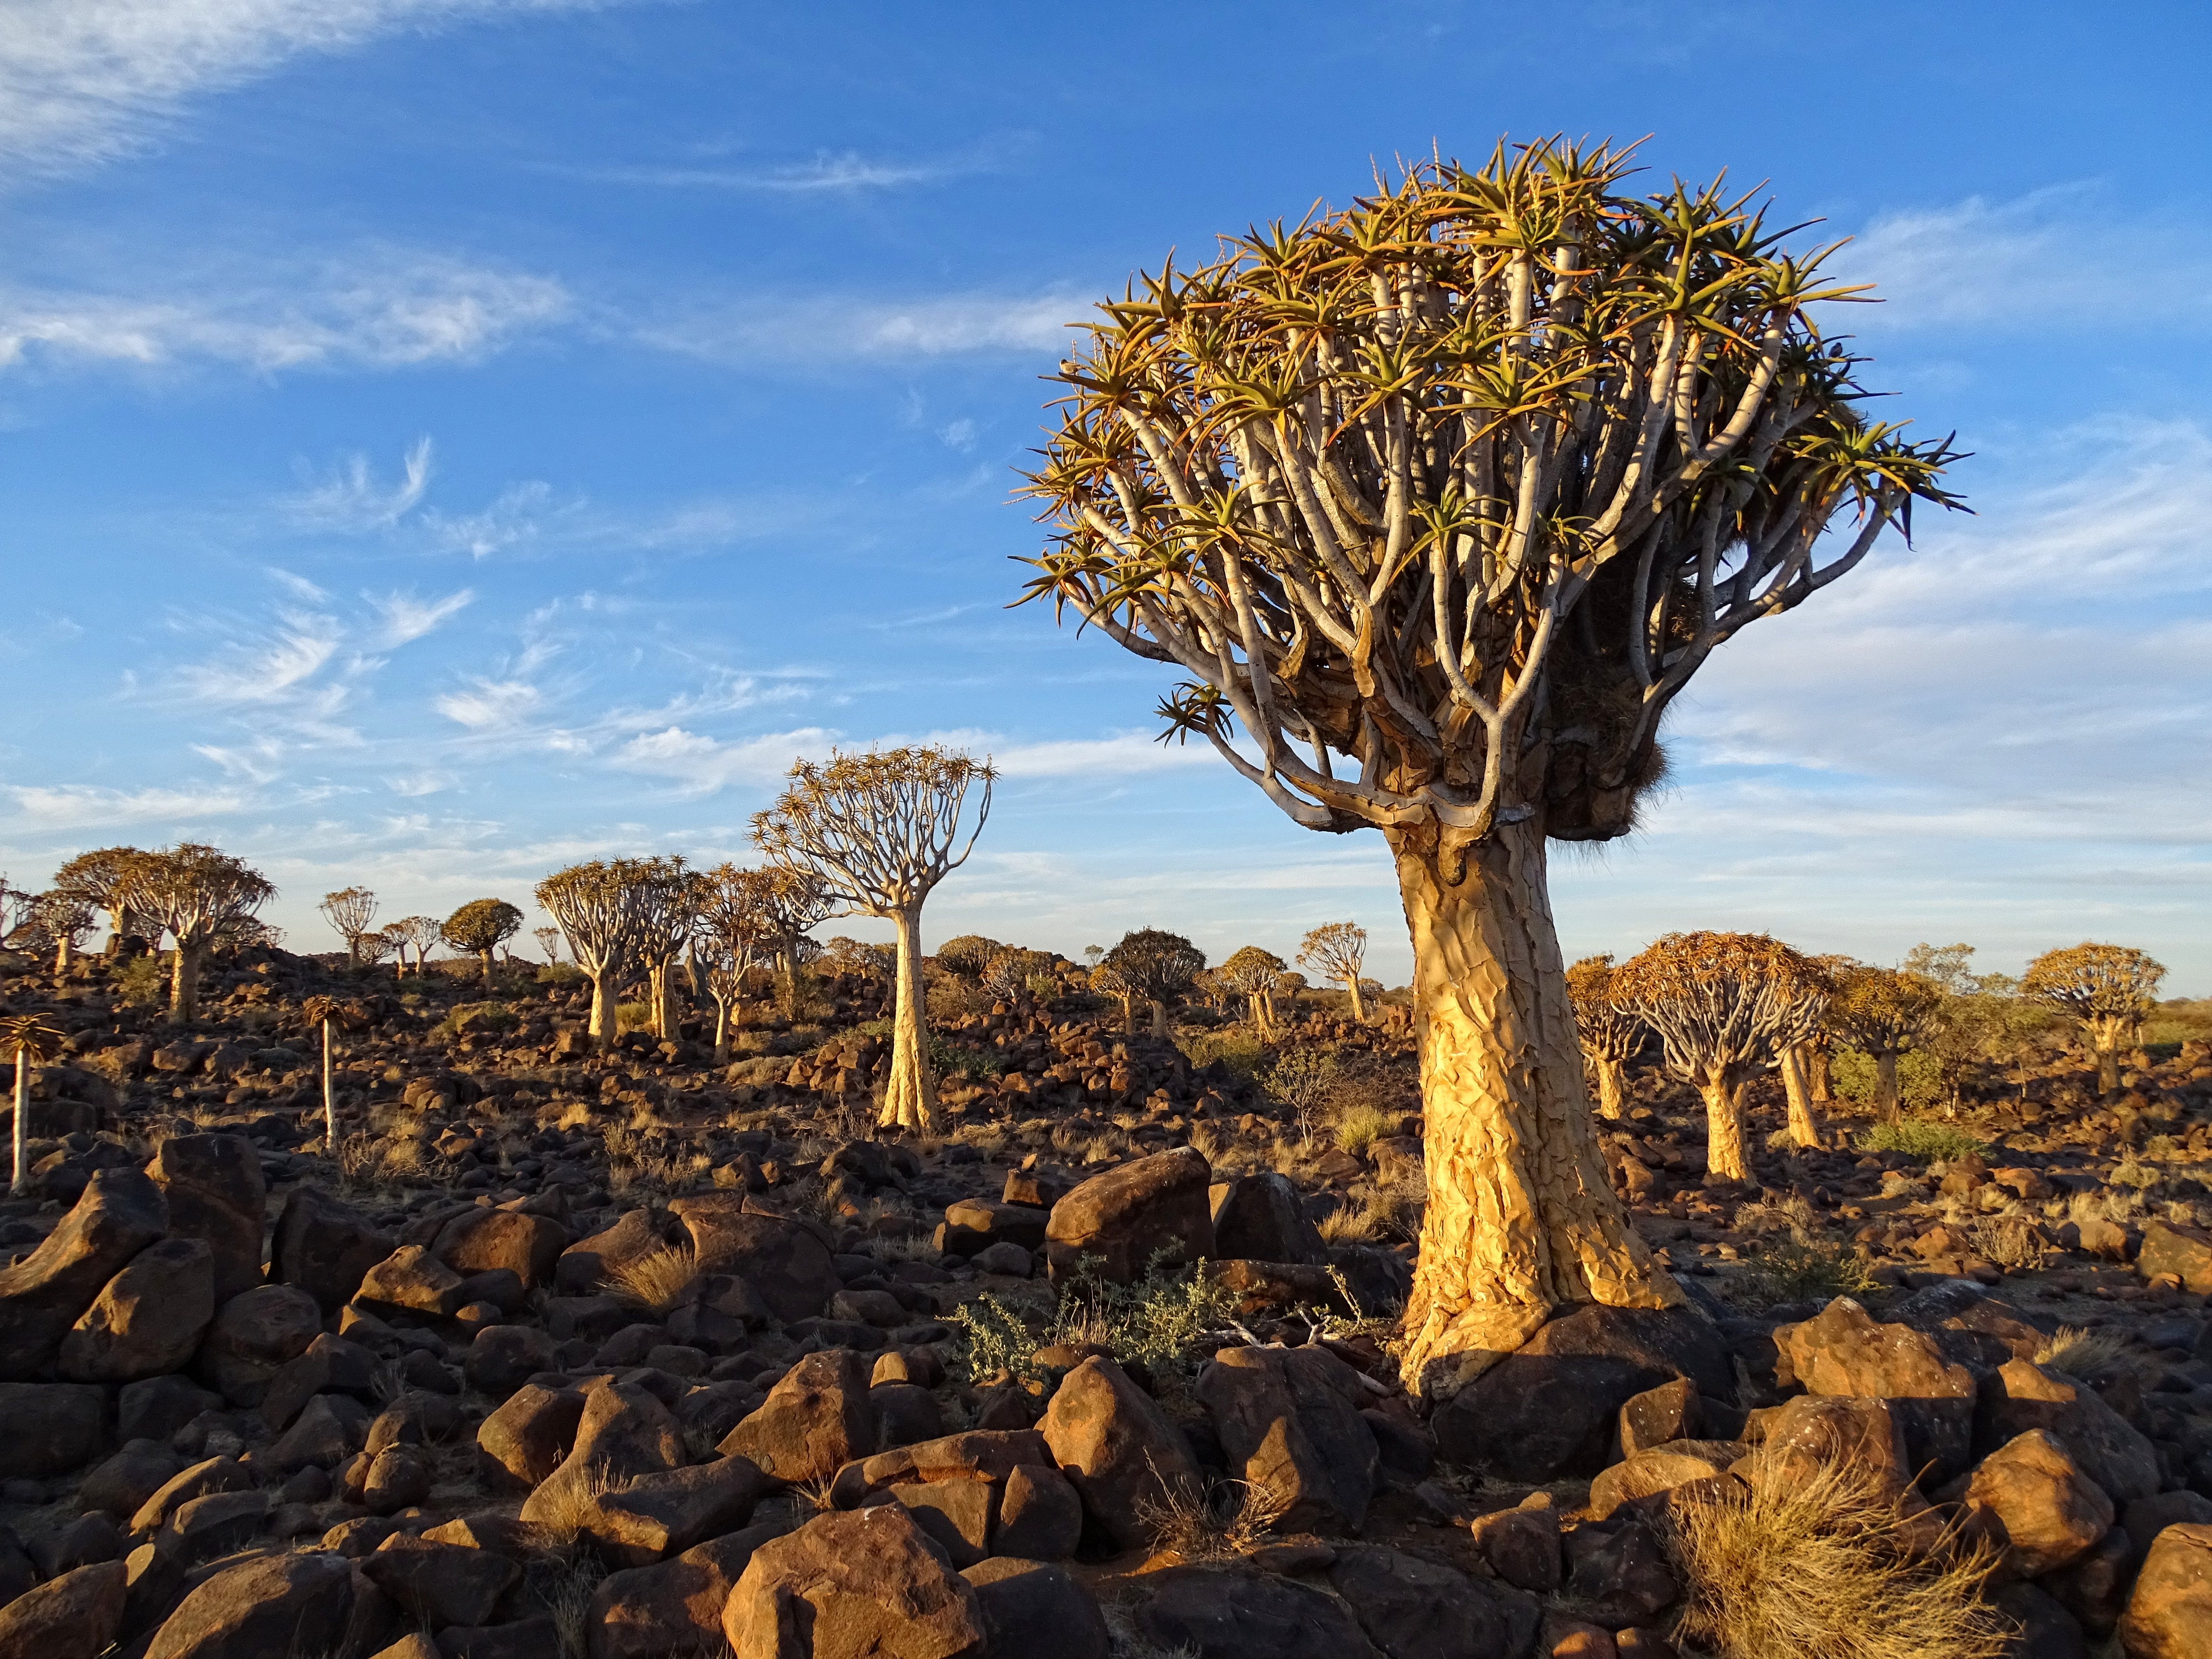