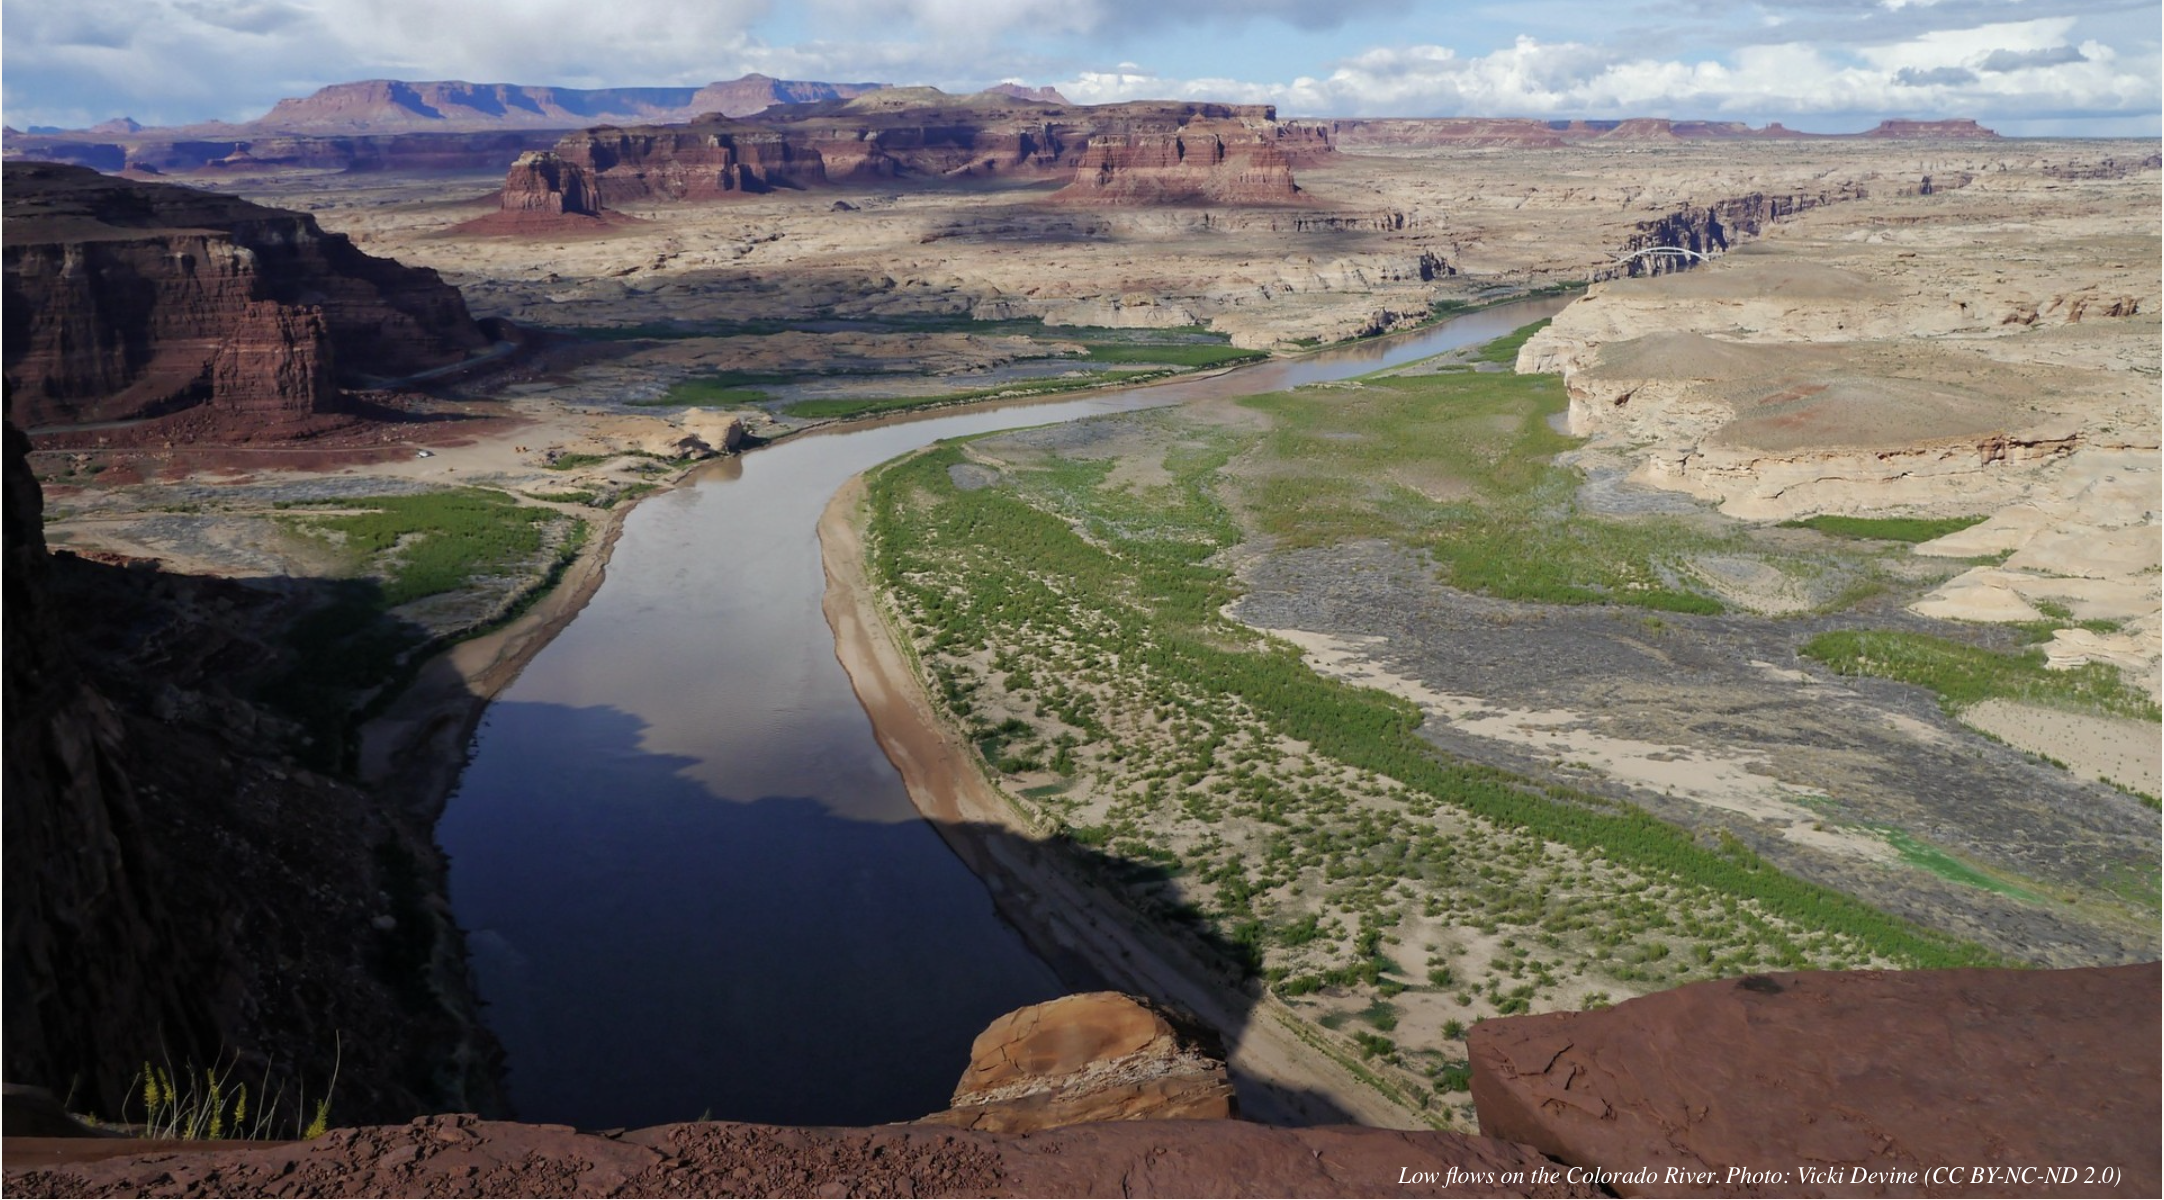
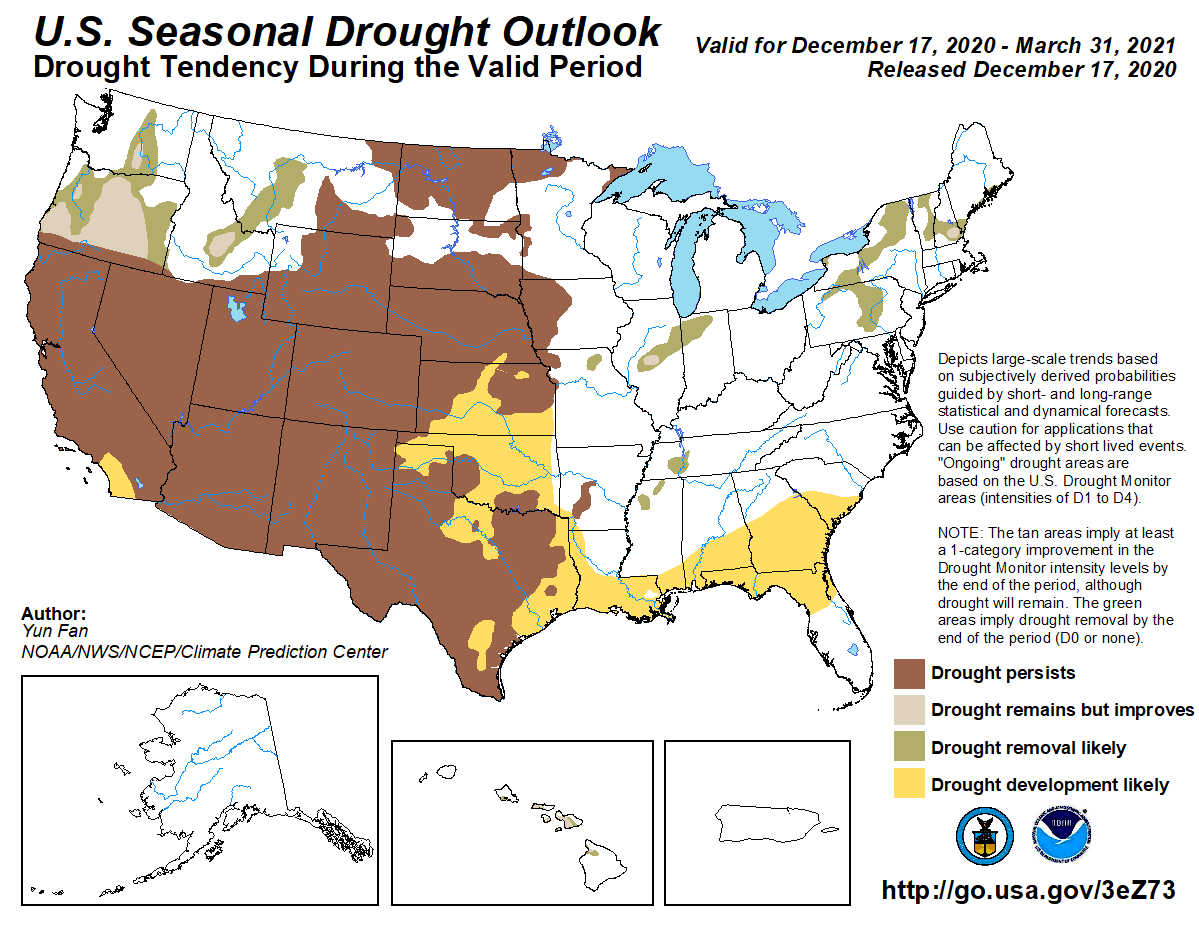
All signs are pointing to a dry start to 2021 across much of the Colorado River watershed, which provides water to about 40 million people in the Western U.S.
A lack of precipitation from April to October made this spring, summer and fall one of the region’s driest six-month periods on record. And with a dry start to winter, river forecasters feel more pessimistic about the chances for a drought recovery in the early part of 2021.
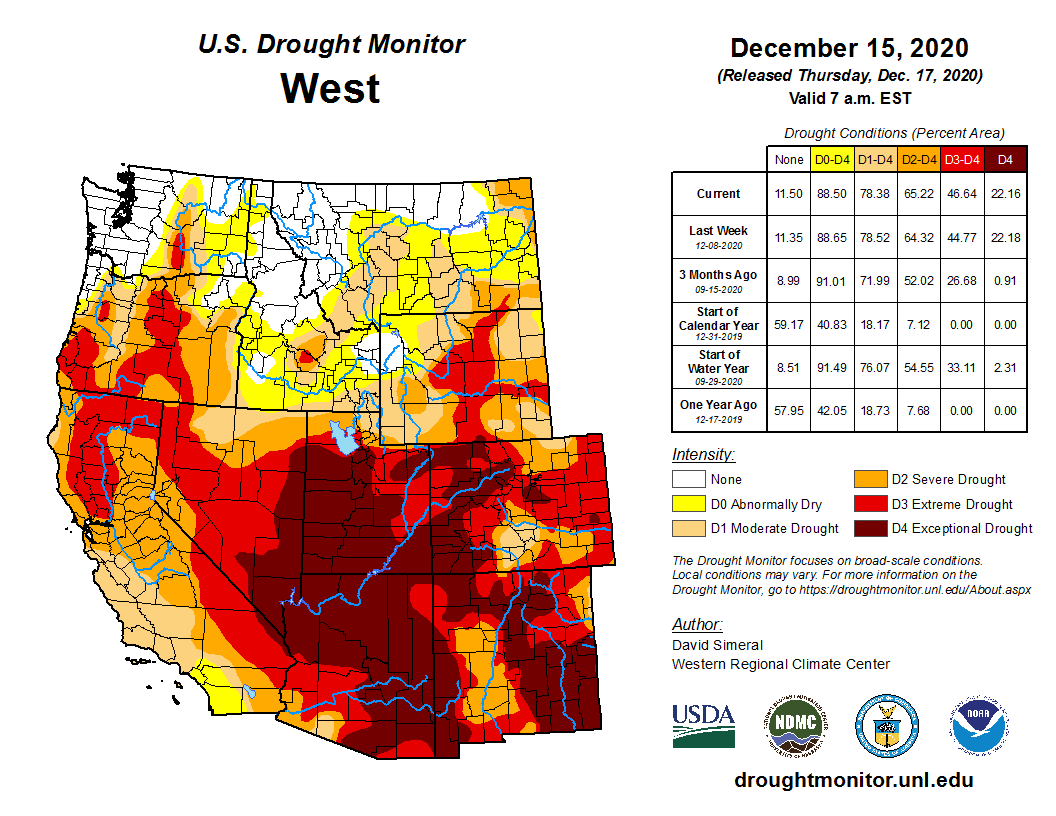
West Drought Monitor December 15, 2020.
“We’re starting off water year 2021 with widespread much below-average soil moisture conditions and snow water equivalent conditions,” said Cody Moser, a hydrologist with the Utah-based Colorado Basin River Forecast Center.
Some weather stations in Colorado, Utah, Arizona and Nevada have recorded their driest years on record, Moser said. There doesn’t seem to be much relief in sight. Short-term and long-term weather forecasts all point to above-average temperatures and below-average precipitation for the foreseeable future.
Exceptional drought conditions have expanded across 65% of the Colorado River watershed. Low soil moisture heading into winter will also play a role in how snowpack accumulates this season, and how much water will flow into streams and reservoirs during spring runoff, adding pressure to large-scale water users like municipalities and farmers.
Most major rivers in the basin are projected to flow well below normal levels next year due to extremely low soil moisture conditions, though Moser said there’s significant uncertainty about water supply forecasts so early in the season.
But given the dry conditions heading into winter, an average snowpack won’t be enough to provide significant relief, Moser said…
A recent forecast from the Bureau of Reclamation, the federal agency that operates Western water infrastructure, showed the Colorado River’s largest reservoirs are likely to drop next year if demands stay the same.
Without a high snowpack this winter, the agency forecasts the Colorado River system’s biggest reservoirs will be reduced to a combined 44% of their total capacity by fall 2021.
Click on a thumbnail graphic to view a gallery of drought data from the US Drought Monitor.
US Drought Monitor December 15, 2020.
West Drought Monitor December 15, 2020.
Colorado Drought Monitor December 15, 2020.
Click here to go to the US Drought Monitor website. Here’s an excerpt:
This Week’s Drought Summary
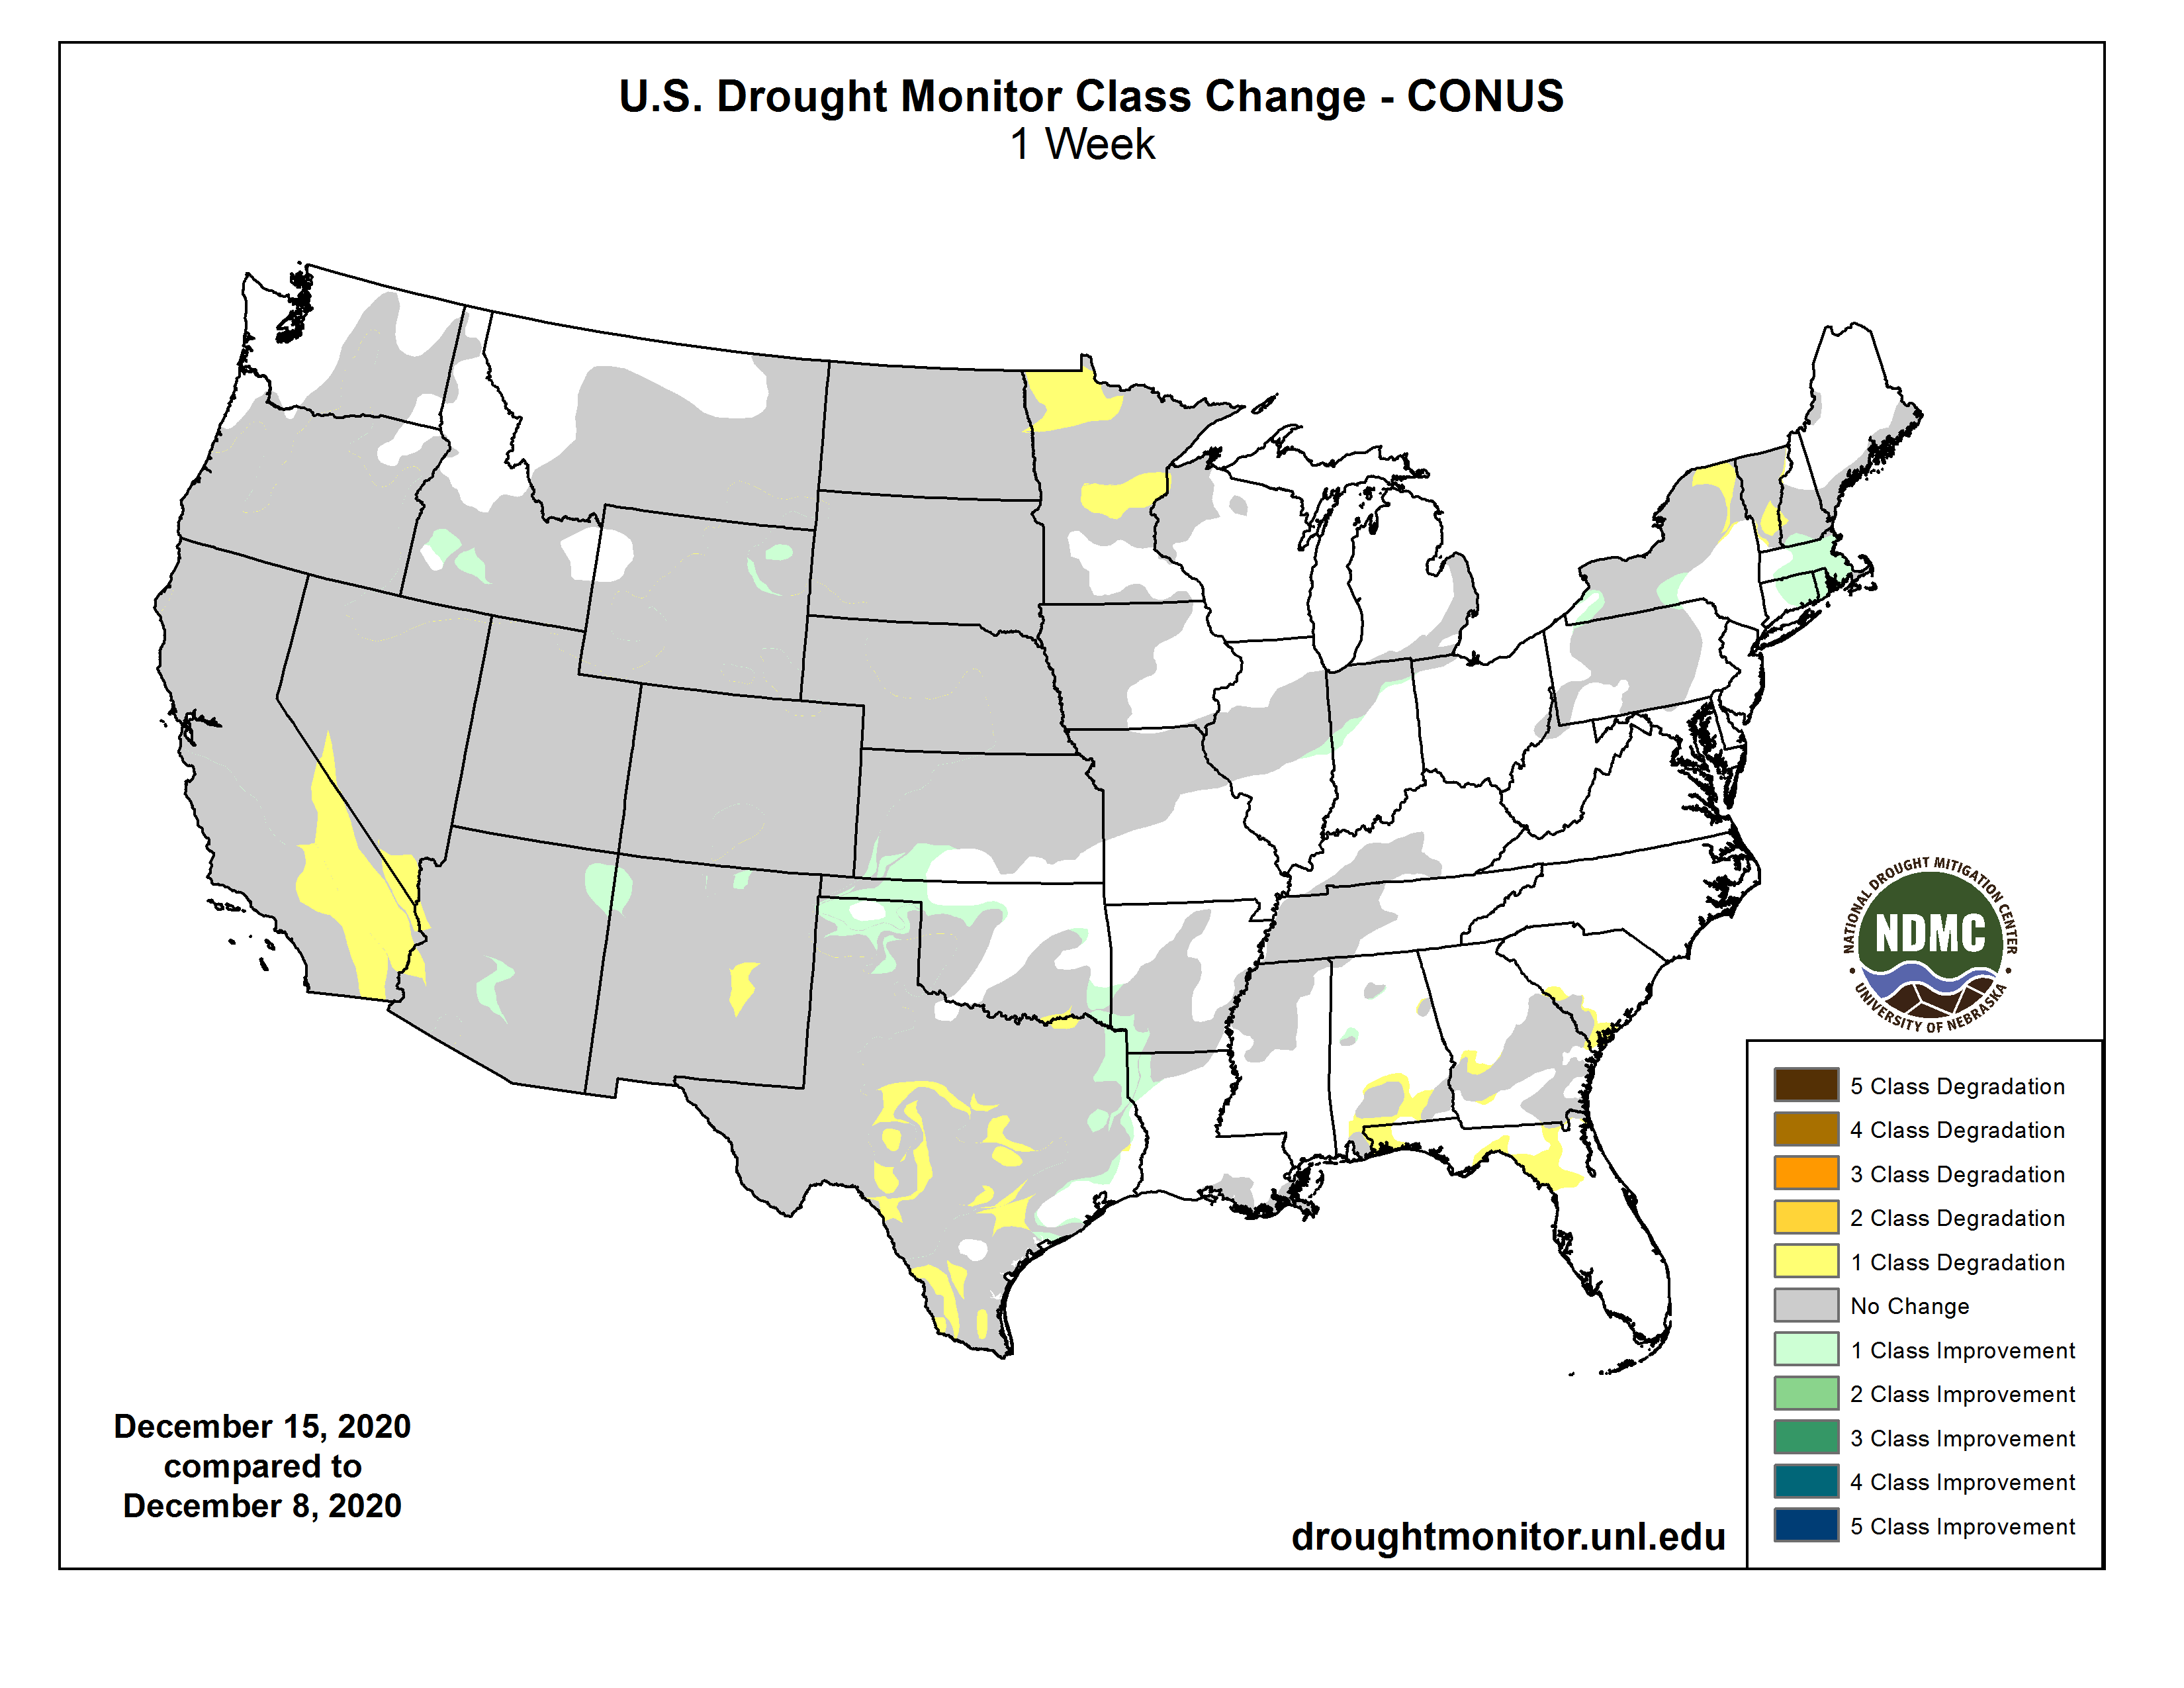
This U.S. Drought Monitor week saw some modest improvements in drought conditions across portions of the Southwest, southern Great Plains, South, lower Midwest, and portions of the Northeast. Drought-related conditions deteriorated in southern California, the southern Great Basin, Texas, Minnesota, and parts of New England. In California, storm activity during the weekend delivered beneficial rain and snow to areas of central and northern California; however, the southern part of the state remained dry. Since January 1, areas of California—including portions of the eastern Sierra and Sacramento Valley—have received less than 25% of normal precipitation. The impact of both short- and long-term dryness in parts of California has been affecting the cattle ranching industry with numerous drought impact reports describing severe impacts to pasture and rangeland conditions as well as reports of ranchers having to sell livestock. Fortunately, another round of storms is expected to impact northern California this week bringing valley rains and mountain snows to the region. In the southern Great Basin, record dryness during the past 6-month period led to expansion of areas of Exceptional Drought (D4) in the eastern Sierra Nevada and southern Nevada. In the Southwest, both Arizona and New Mexico received light rains across parts of the lower deserts as well as some mountain snowfall in northern Arizona and northern New Mexico, providing a much-needed boost to soil moisture levels. Elsewhere, above-normal precipitation during the past 30-to-60-day period and snowfall this week in northern portions of the Texas Panhandle and Oklahoma Panhandle, led to removal of areas of drought. Further to the south in the Hill Country and South Texas Plains, drought intensified in response to persistent warm and dry conditions as well as mounting precipitation deficits ranging from 2-to-8+ inches during the past 90-day period. Conversely, areas along the coastal plains of northeastern Texas received 1-to-2+ inch accumulations during the past week leading to widespread improvements on the map. In the Midwest, wetter-than-normal conditions during the past 30-to-60-day period led to minor improvements on the map in central Illinois and northern Indiana. Likewise, portions of western New York saw improvement on the map in response to recent storm activity…
On this week’s map, areas of the region—including southwestern Kansas and northeastern Wyoming—saw modest improvements including reduction in areas of Severe Drought (D2) in Wyoming and areas of Moderate Drought (D1) in southwestern Kansas where recent snowfalls have helped to improve local conditions. Average temperatures for the week were near to slightly above normal across most of the region with eastern portions of the region observing the greatest positive temperature anomalies ranging from 3-to-12 deg F above normal. According to the NOAA NOHRSC, the Upper Midwest Region was only 16.4% covered in snow (a reduction from 30.3% last month) with an average depth of 0.2 inches and a maximum depth of 30.5 inches. Field reports from the USDA NASS North Dakota Crop Progress and Condition Report (Nov. 30) yielded winter wheat conditions rated as 4% very poor, 5% poor, 50% fair, 39% good, and 2% excellent…
During the past week, areas of the West received much needed rain and snow over the weekend with mountain snow observed in the Cascades, Sierra Nevada, ranges of central/eastern Nevada, the Uinta Mountains, and across areas of the Rockies from Montana to New Mexico. Snowfall accumulations ranged from 6-to-24+ inches in the higher elevations. In the California mountains, the current statewide soil water equivalent (SWE) for the date (Dec. 14) is 47% of normal—up 11% since last week. The current regional breakdown (percentage of normal SWE) is as follows: Northern Sierra/Trinity–46%, Central Sierra–53%, and Southern Sierra–29%. In other areas of the West, the drainage basins (6-Digit HUCs) across the Four Corners states continued to observe well below-normal SWE except for the Rio Grande Headwaters (115% of normal) and the Upper Arkansas (103% of normal) basins of Colorado. In the Pacific Northwest and northern Rockies, basins across the Cascades of Oregon/Washington as well as central/eastern Montana are near normal to above normal. On the map, areas of Severe Drought (D2) and Extreme Drought (D3) expanded in southern California where precipitation during the past 90-day period has generally been <25% of normal. These areas largely have missed recent storm events that have impacted central and northern portions of the state. In southern Nevada, areas of Exceptional Drought (D4) expanded in Clark County where McCarran International Airport (through Dec. 1) logged its driest 6-month period (June 1 to November 30) on record with only a trace of precipitation observed for the period. In Arizona, areas of Extreme Drought (D3) expanded in southwestern Arizona where Parker, Arizona along the lower Colorado River has observed no precipitation since June 1—making it the driest 6-month (June 1 to November 30) on record. Elsewhere in the state, some minor improvements were made in central Arizona and northeastern Arizona on the Navajo Nation where precipitation during the past week brought some minor improvements in soil moisture. In northern New Mexico, some minor improvements were made on the map in the Sangre de Cristo Range near Taos where soil moisture levels improved (according to NASA SPoRT) and snowfall during the past week bumped a few SNOTEL stations (Gallegos Peak, Tolby) above normal levels for the date. In southeastern Idaho, areas of Moderate Drought (D1) were reduced in response to several SNOTEL sites (Prairie, Camas Creek Divide) reporting above-normal SWE…
On this week’s map, areas of drought intensified and expanded in the Hill Country and South Texas Plains where warm and dry conditions continued this week. In these areas, 90-day precipitation deficits ranged from 2-to-8 inches, and current soil moisture levels were below normal according to the NASA SPoRT soil moisture monitoring products. According to Water Data for Texas (Dec. 16), monitored water supply reservoirs are currently 79.9% full—with reservoirs in the eastern half of the state ~80–90% full while reservoirs in the western half of the state were generally <40% full. In the far northern portions of the Texas Panhandle and Oklahoma Panhandle, conditions improved on the map in response to short-term precipitation including snowfall observed during the past week with accumulations ranging from 1-to-8+, according to NOAA NOHRSC. In eastern portions of Texas, northwestern Louisiana, and southeastern Oklahoma, precipitation during the past week (1-to-3 inches) led to improvements in areas of Moderate Drought (D1). Average temperatures for the week were below normal (1-to-4 deg F) in the northern Texas Panhandle, Oklahoma Panhandle, and central Oklahoma while other areas in the region were 2-to-10+ deg F above normal…
Looking Ahead
The NWS WPC 7-Day Quantitative Precipitation Forecast (QPF) calls for light-to-moderate liquid accumulations ranging from 1 to 2+ inches across portions of the South with the heaviest totals expected along the Gulf Coast of Louisiana and the Florida Panhandle. Likewise, similar accumulations are expected in the Mid-Atlantic and across southeastern portions of New England where a major winter storm is expected to impact the region starting on Wednesday with a wintry mix of rain, freezing rain, and snow. Areas from Pennsylvania to Massachusetts are expected to receive significant snowfall accumulations ranging from 6 to 20+ inches with New York City and Boston potentially receiving more than a foot of snow. Across much of the Midwest, the Plains, Texas, the Southwest, and southern portions of California and the Great Basin, dry condition are forecasted. Elsewhere in the West, a series of storms is expected to impact an area from Washington state through northern California and eastward through the northern Great Basin and central/northern Rockies. Coastal areas are expecting heavy rainfall accumulations while further inland snowfall accumulations in the higher elevations of the Cascades and northern Rockies of Idaho and northwestern Montana could see 1-to-2 feet of snow. The CPC 6–10-day Outlook calls for a moderate probability of above-normal precipitation across most of the eastern tier of the conterminous U.S., the Upper Midwest, and across much of Alaska where probabilities are higher. Elsewhere, the outlooks call for a low-to-moderate probability of below-normal precipitation across much of the conterminous U.S.—including much of the Midwest and Plains states, the Four Corners states, and California. In terms of temperature, there is a moderate-to-high probability of above-normal temperatures across nearly the entire conterminous U.S. except for the Southeast where normal temperatures are expected…
US Drought Monitor one week change map ending December 15, 2020.Westwide SNOTEL basin-filled map December 17, 2020 via the NRCS.
Oh no! The Water Desk has created a map index of their photos and other multimedia. Be careful clicking the link since browsing cool photos and such is probably not part of your written job description.
President-elect Joe Biden’s choice of Jennifer Granholm to be his energy secretary is a sign the president-elect’s team will try to spur automakers to sell cars that need little to no gasoline.
The relationship that Granholm, the former two-term governor of Michigan, has with Detroit automakers may prove crucial to the incoming administration’s effort to cut climate-warming emissions spewing from the millions of cars and trucks on American roads.
Biden intends to nominate Granholm to run the sprawling department also responsible for overseeing the nuclear weapons arsenal and managing radioactive waste, Will Englund, Juliet Eilperin and I report.
Cleaning up the transportation sector, now the largest source of greenhouse gas pollution in the United States, will be critical to meeting Biden’s lofty goal of net-zero emissions by the middle of the century.
Biden, the son of a car salesman, pitched no- and low-emissions vehicles not only as a way to combat climate change, but also to create domestic manufacturing jobs. To preserve Michigan’s industrial base undercut by foreign competition, Granholm has also become a vocal proponent of building electric vehicles at home…
The Transportation Department – which under Biden will be run by former South Bend. Ind., mayor Pete Buttigieg, our colleagues Michael Laris, Ian Duncan and Seung Min Kim also reported Tuesday – has “transportation” in its name.
But it is the Energy Department that is the main funder of research into the battery technology responsible for a potential transition to electric vehicles…
During the campaign, Biden promised to install 500,000 electric vehicle charging stations by 2030, provide bigger tax breaks to those who purchase electric vehicles and to tighten fuel-efficiency standards on new cars and trucks…
Today, electric vehicles make up less than 2 percent of new cars and SUVs sold each year domestically. But GM, Ford and other automakers have told investors they plan to build out their fleets of electric vehicles in coming years.
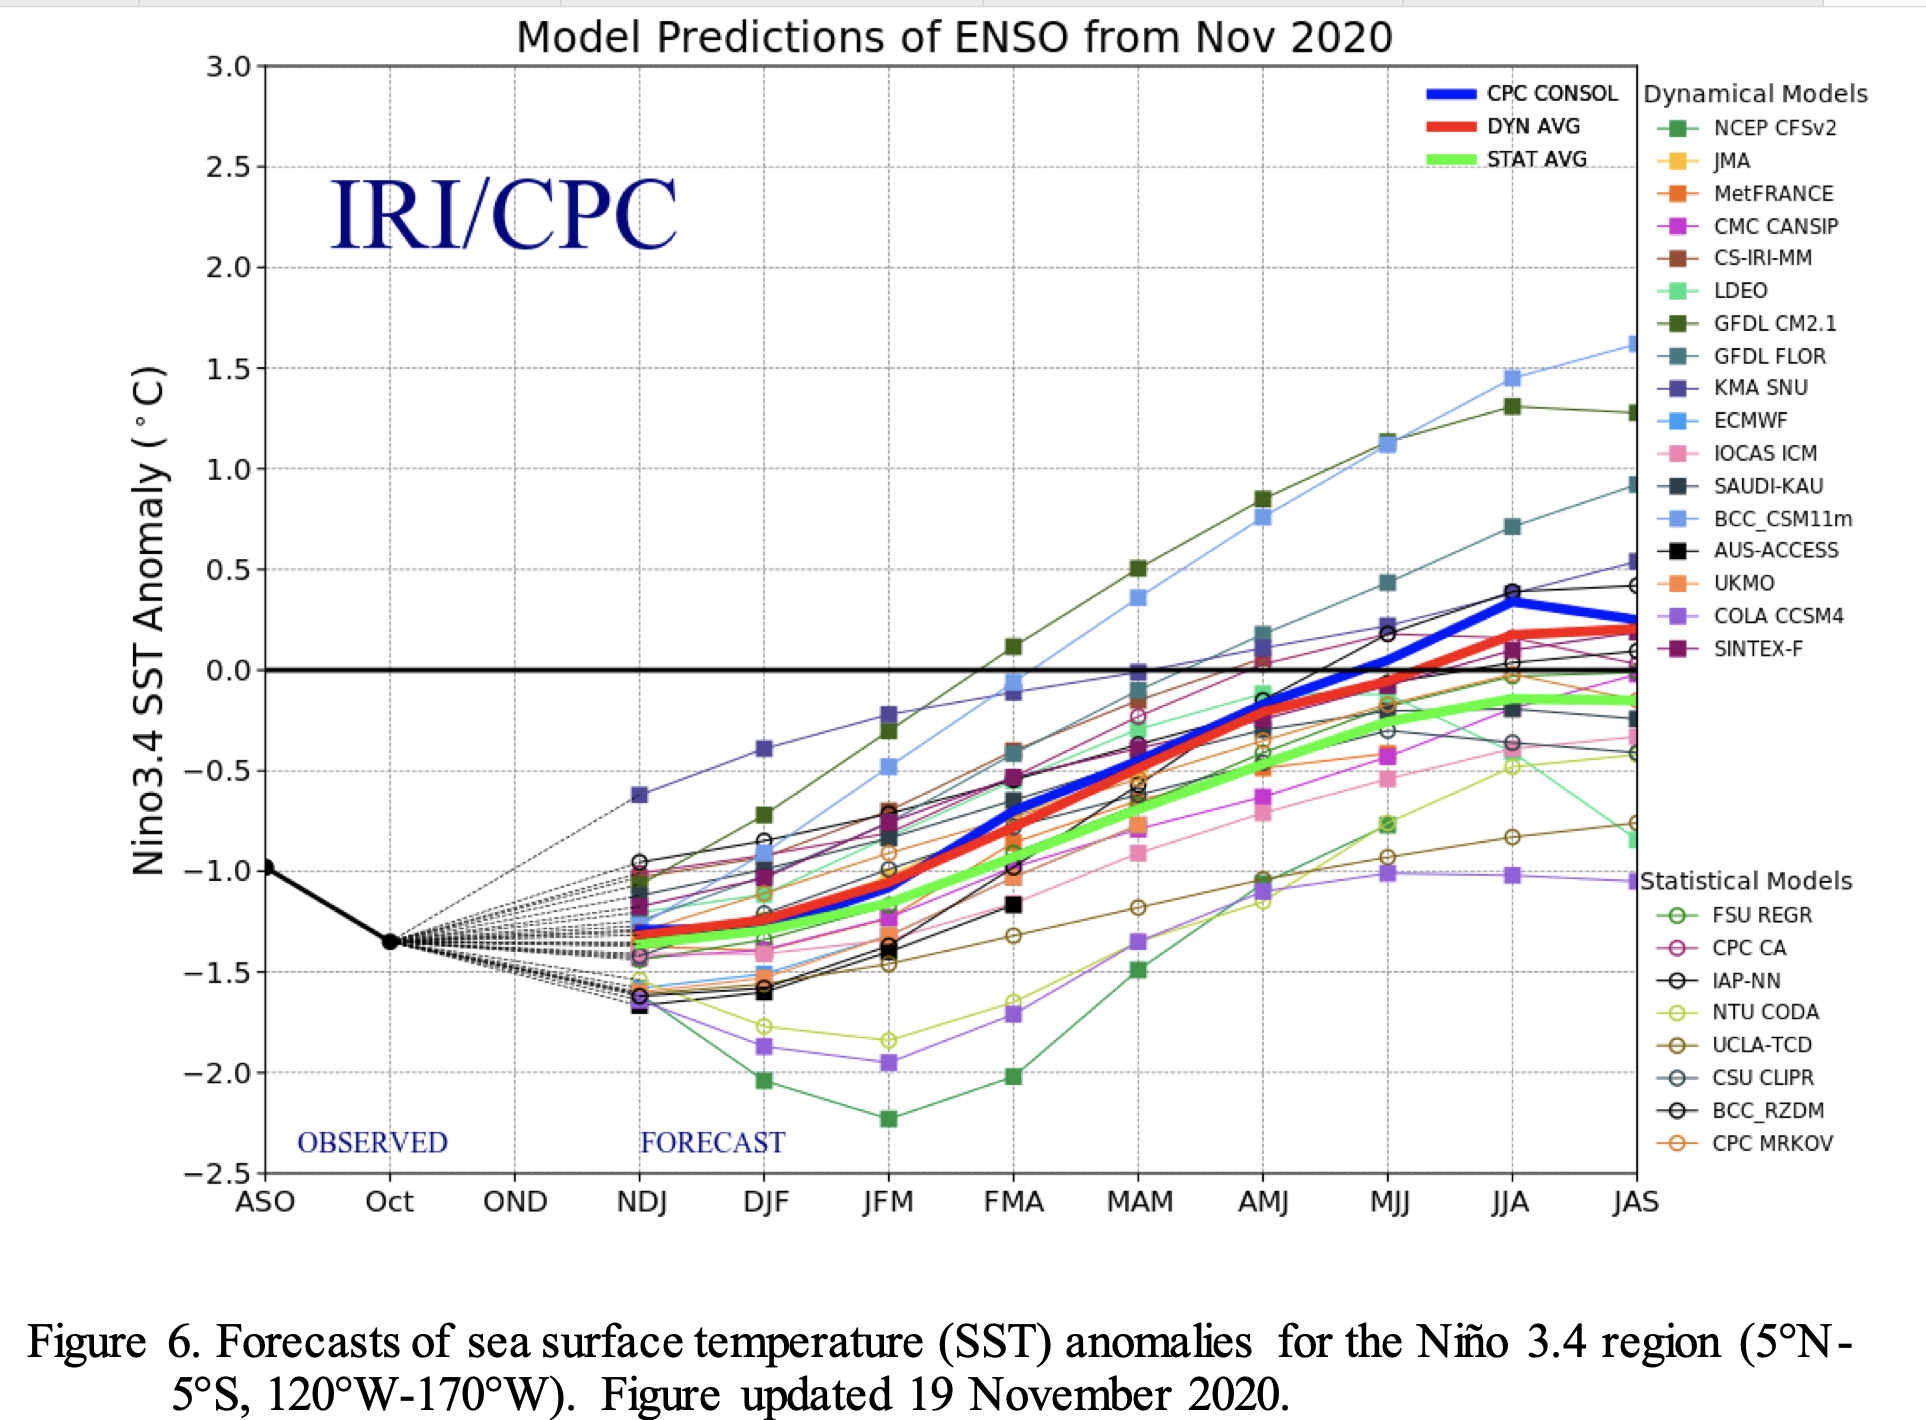
From the International Research Institute for Climate and Society:
The SST forecast is for La Nina conditions to continue through boreal winter, weakening through the spring and early summer. The eastern Indian Ocean is presently warm but is forecast to relax towards climatological temperatures in the spring.
Precipitation forecasts for the coming season are consistent with expected La Niña teleconnections: In Jan-Mar, strongly enhanced probabilities of below normal precipitation are forecast for northwest Mexico and the Southern US, and moderately enhanced probabilities of below normal precipitation are forecast in Southwest Asia. The probabilities in Mexico, the US, and southwest Asia all persist through Apr-Jun; In Apr-Jun enhanced probabilities of below normal precipitation are forecast for Chile and southern India.
Enhanced probabilities of above normal precipitation are forecast for northern South America and Central America, the Philippines, parts of the Maritime Continent, northwest US, and western Australia. Probabilities of above normal precipitation persist in northern South America through Feb-Apr and in the Philippines through Apr-Jun. In Apr-Jun an enhanced probability of above normal precipitation is forecast to northeast India and southeast Asia.
A strongly enhanced probability of above normal temperatures accompanies the probability of below normal precipitation in the Southwest United States from Jan-Mar through Apr-Jun. In Jan-Mar there is also an enhanced probability of above normal temperatures in central Russia.
An enhanced probability of below normal temperatures is forecast for the U.S. Midwest for Jan-Mar, for Alaska, western Canada, Greenland, and northern South America from Jan-Mar to Mar-May.
La Niña continued to gain strength in November as we approach the normal peak for these events in the Northern Hemisphere winter—usually November–January. Forecasters estimate at least a 95% chance that La Niña will last through the winter, with a potential transition to ENSO-Neutral during spring 2021 (~50% chance).
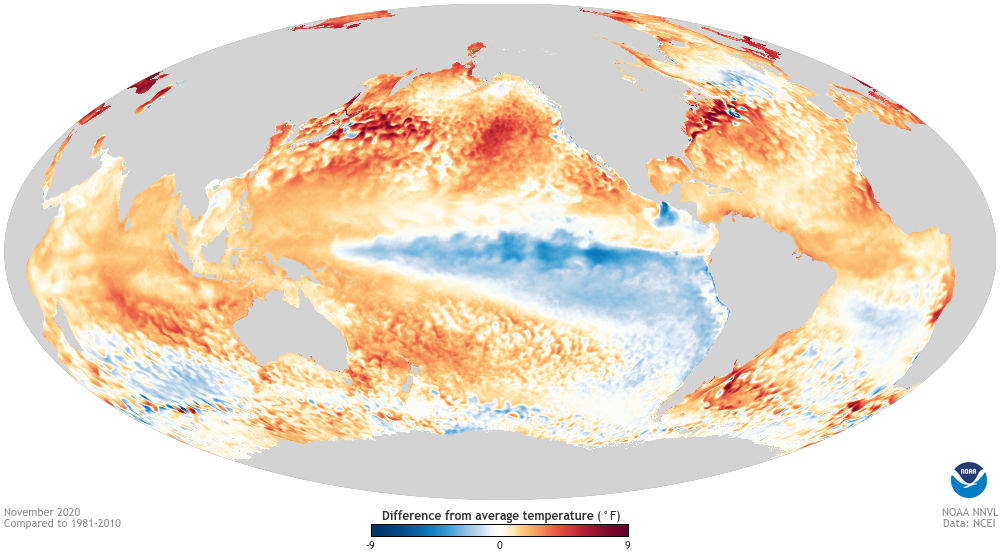
La Niña sticks out like a sore thumb when taking a gander at a map of sea surface temperature anomalies (the difference from the long-term average) over the Pacific Ocean. The Niño3.4 region of the tropical Pacific (the area we look at for determining ENSO status) was much cooler than the La Niña threshold of -0.5°C, at -1.4°C below average for November according to the ERSSTv5 dataset. In fact, the Niño3.4 region surface temperature anomaly has been lower than -1.0°C for the last two months, and the November anomaly was the seventh lowest of all Novembers going back to 1950.
November 2020 sea surface temperature departure from the 1981-2010 average. Cool water at the equator in the Pacific represents La Niña, while waters elsewhere are warmer than average. Image from Data Snapshots on Climate.gov.
In the Tropical Pacific Ocean Lane, the Ocean-Atmosphere is glistening
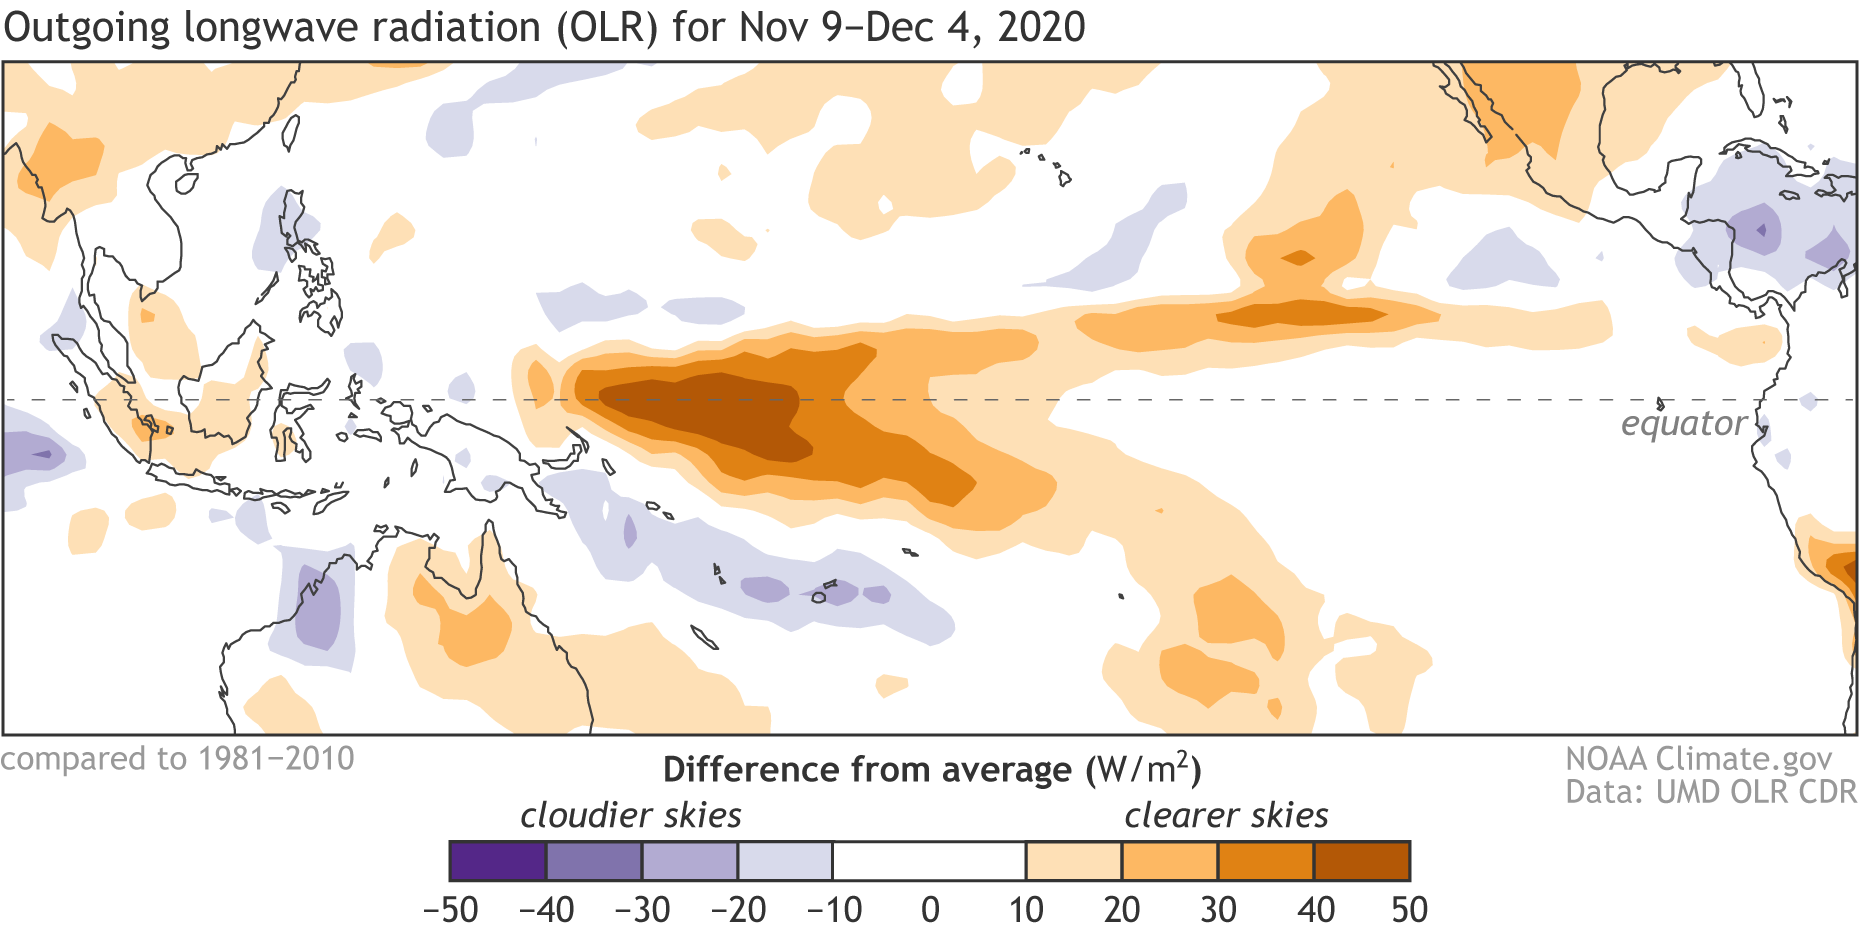
As always, if we want to see if this La Niña is humming along, we’ll need to take stock of how well our oceans and atmosphere are working together. During La Niña, the expectation is that there will be less rain than average over the central Tropical Pacific Ocean and more rain over the Maritime Continent in Indonesia and the Philippines. This pattern can be seen in looking at changes in the amount of radiation leaving Earth into outer space, which can be detected by satellites.
Clear skies let outgoing longwave radiation (OLR) escape into space. But clouds act like a bouncer, blocking the energy from entering Club Outer Space and telling it to go home. Less OLR reaching the satellite means more clouds and more rain. More OLR means the opposite, sunnier skies and less rain. During November, we saw less rain over the Date Line, but the Maritime Continent rainfall was largely near average (we aren’t sure why, but the expected enhanced rainfall has had trouble sticking around during this event).
Outgoing long-wave radiation anomaly from November 9 – December 4, 2020. Regions with more clouds and rain than average are shown in blue; areas with fewer clouds and less rain are shown in brown. Climate.gov image from CPC data.
Another key signal to how well La Niña is doing lies in the wind. ENSO events disrupt the Walker Circulation, the normal atmospheric wind pattern that blows across the tropics.
La Niñas tend to rev up the existing Walker Circulation. The trade winds, which blow east to west across the Pacific Ocean, blow a little harder, while winds higher up in the atmosphere blow to the east a little bit harder. During November, that is exactly what happened. (For more information on how this is part of a feedback mechanism that gets La Niña going, check out Michelle’s recent post.)
Simply put, this is my long way of saying that this La Niña is looking like a La Niña.
In the Pacific meadow, we can build a forecast
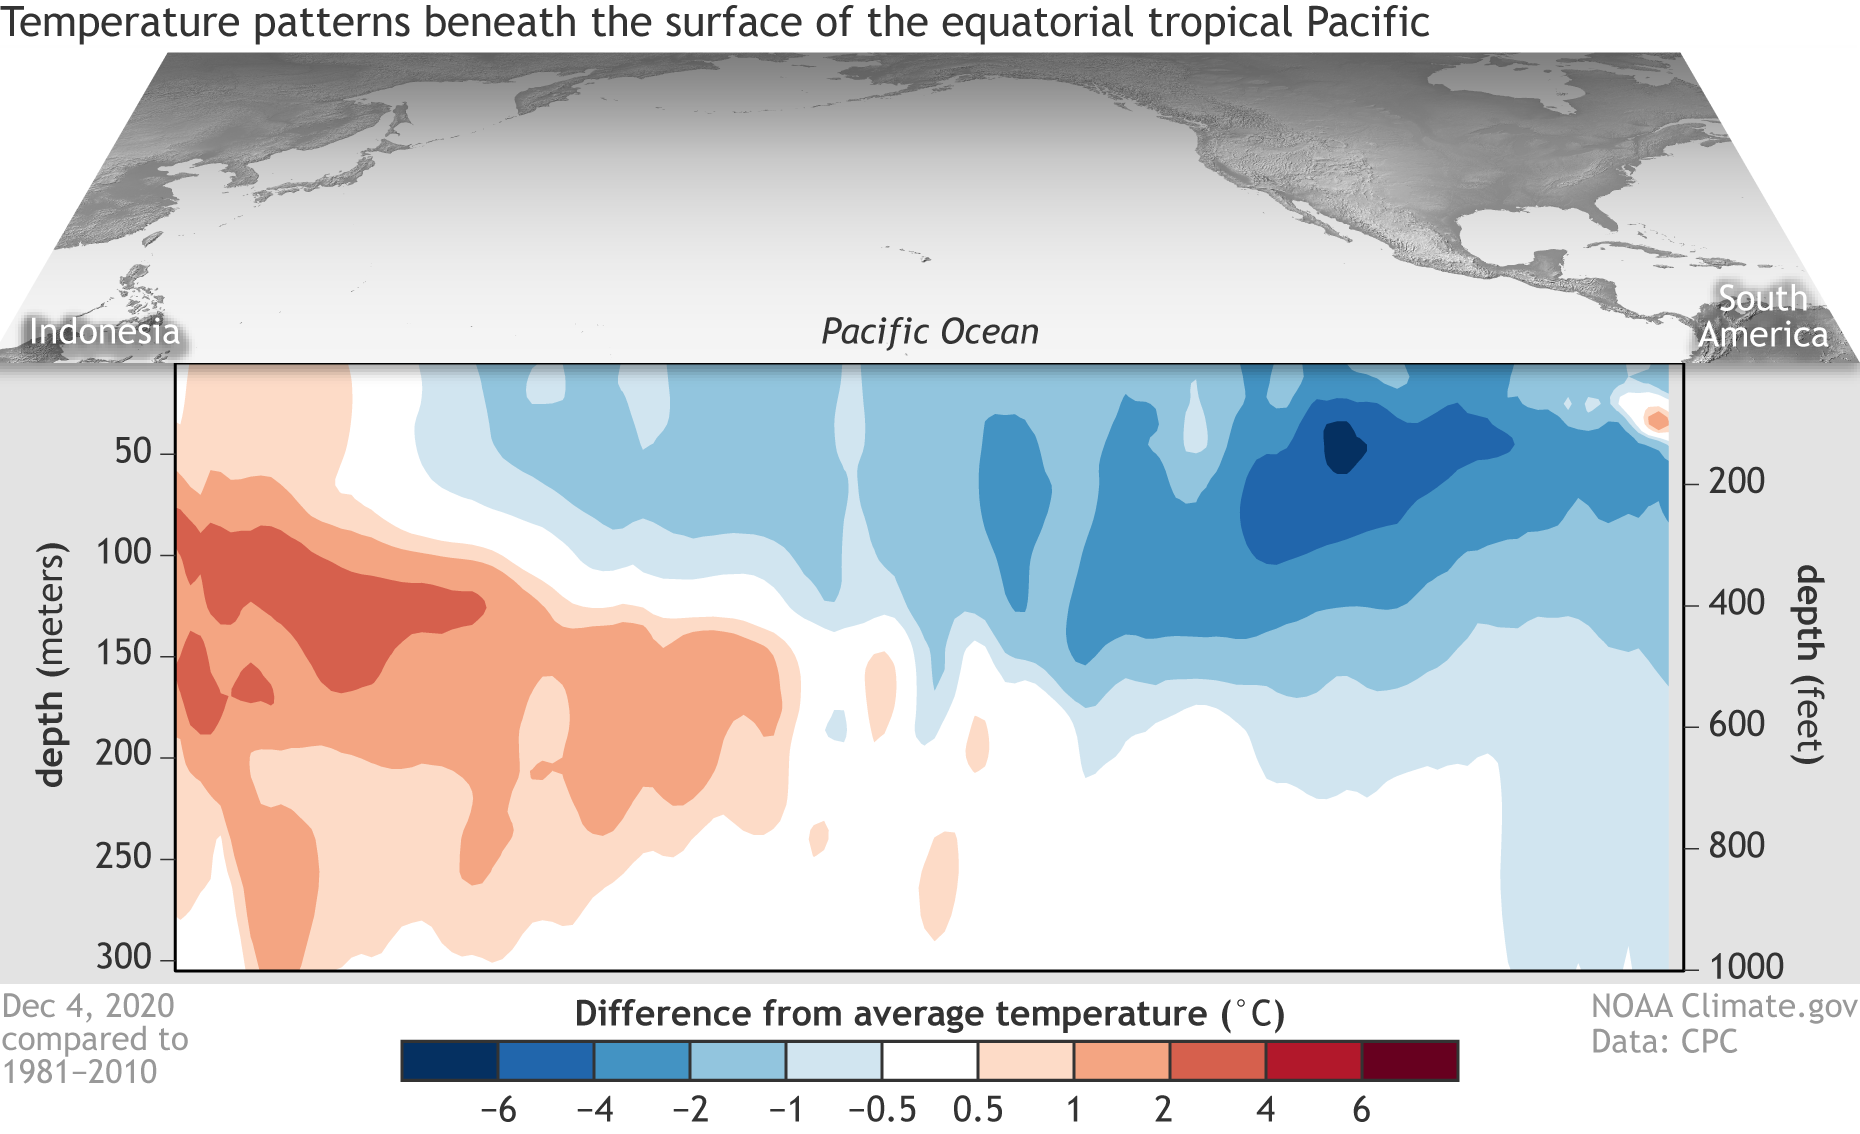
The big question now is how long this La Niña will last. And while we’ve looked a lot at the atmosphere and the ocean surface, to answer that question it’s useful to take a look under the surface of the Tropical Pacific Ocean.
Difference from average (1981-2010) temperatures in the upper 300 meters (980 feet) of the tropical Pacific Ocean for the 5-day period centered on December 4, 2020. The vertical axis is depth below the surface (meters) and the horizontal axis is longitude, from the western to eastern tropical Pacific. This cross-section is right along the equator. Climate.gov figure from CPC data.
There you’ll find plenty of cooler-than-average water across the central and eastern Pacific Ocean. This fount of coolness is (1) a sign of the atmospheric/ocean coupling that I described above and (2) plenty big and strong enough to provide a source for cooler than average water at the surface over the next several months. Although, it is important to note that this fount of cooler than average anomalies in the subsurface ocean has weakened slightly over the last month compared to October.
That small weakening might be a harbinger for the future of this event. Most of the computer models we use as well as the forecasters predict La Niña to last through winter (greater than a 95% chance). But, forecasters do not expect much more strengthening, with the event peaking between -1.0°C to -1.5°C for the seasonal average Niño3.4 surface temperature anomaly (often referred to as “moderate”). After which, the forecast is for La Niña to weaken throughout the spring (~50% chance of ENSO-Neutral during April-June).
As with any forecast six months into the future, there is still plenty of uncertainty as to the eventual path this La Niña takes. But don’t worry, because as those computer model ENSO Bells ring, we’ll be listening. (Is that taking this month’s Winter Wonderland theme too far? No? It’s a beautiful sight? You’re happy tonight? I’ll stop now.)
In general, the warmest year of any decade will be an El Niño year, the coldest a La Niña one. This graph shows annual average surface temperatures (gray bars), grouped by decade, from 1950 to 2017. The warmest and coldest years of each decade are topped with circles: red for El Niño years and blue for La Niña years. El Niño/La Niña labels are based on the December-February anomaly of the Oceanic Niño Index. Only two decades seem to violate the general rule: the 1960s and the 1990s. By our definition, 1963 did not qualify as El Niño year because the December–February ONI value was neutral. However, El Niño did emerge later in the year, and it persisted for 7 months. The bigger surprise was 1992, which was the coldest year of the 1990s despite being an El Niño year. The 1991 eruption of Mount Pinatubo was likely to blame. Graphic by NOAA Climate.gov, based on data from NCEI.
Gone away are the blue colors (cold anomalies). Here to stay are the red colors (warm anomalies) La Niña isn’t the only thing happening across our planet, even though it really sticks out on a map of ocean temperature anomalies. Of course, one reason for why it sticks out is that everywhere else is so much warmer than average. Because even as La Niña formed this year, on a whole, 2020 has been sizzling hot.
Usually, years with La Niñas are cooler than years without due to the huge amount of cooler than average ocean water exposed across the equatorial Pacific. On the flip side, years with El Niños tend to fall on the warm side. For instance, the warmest year on record is 2016 when one of the strongest El Niños since 1950 occurred. Meanwhile, the coolest years of most decades coincides with a La Niña.
And that got me thinking. How does this year’s global temperatures compare to global temperatures in similar years when a La Niña developed in the summer/fall after lukewarm conditions during the preceding winter?
Going back to 1950, there have been only seven cases that sort of matched—1954, 1964, 1970, 1988, 1995, 2007, 2010—and of those, four (bolded) were the closest matches. Comparing the closest matches, 2020 is on track to be almost 0.5°F warmer than the next warmest (2010) and 1.6°F than the coolest year. While that doesn’t seem like much, it is the difference between being ranked as the first or second warmest year on record (2020) or the seventh (2010) or #59 (1970). Clearly, the warming trend due to human-caused climate change is helped to bump up global temperatures over time. And 2020 is no exception. But even then, 2020 has certainly been something else.
Emily will be back later this month with the last ENSO Blog post of 2020, but don’t worry—we’ll still be here in 2021, giving you all the latest news on ENSO.
Scott Hummer, water commissioner for District 58 in the Yampa River basin, checks out a recently installed Parshall flume on an irrigation ditch. Hummer said most water users in the Yampa are complying with a state order issued nearly a year ago that requires measuring devices. Photo credit: Heather Sackett/Aspen Journalism
Here’s a guest column that’s running in the Steamboat Pilot & Today (Gena Hinkemeyer):
Did you know that Colorado’s Water Plan calls for 80% of locally prioritized rivers to be covered by a stream management plan by 2030? Yes, that includes our Yampa River Basin.
The Yampa White Green Basin Roundtable is one of nine grassroots water policy roundtables throughout Colorado working to develop locally driven collaborative solutions to water supply challenges. The roundtable’s Integrated Water Management Plan will combine community input with science and engineering assessments to identify actions that protect existing and future water uses and support healthy river ecosystems in the face of growing populations, changing land uses and climate uncertainty.
So where do we begin with the IWMP process? Why not start with the biggest users of water here in the basin, our agricultural stakeholders. Stakeholders have been clear that agricultural infrastructure is in need of improvement, but there is limited documentation about specific needs. Stakeholder engagement is the most important factor to successful IWMPs. That’s where I come into play.
As a segment coordinator for the project, I am reaching out to our agricultural users to listen and learn from them about their use of water and riverside lands, plus their management concerns and opportunities they may see for improvements. I wasn’t really sure what my job would entail. I had visions of field work and lots of interaction with ranchers. Our work was delayed by COVID-19 restrictions, but we were able to roll with the punches and conduct our interviews over the phone.
Virus or not, ranchers still had to irrigate their fields, so we found a way to continue our work. As it turns out, I learned more about irrigation and the effects irrigation has on our community than I ever thought possible. From the headgates of the Yampa all the way down to the confluence of the Green River, our team chose 50 water diversion structures for assessment.
What does a diversion assessment entail, you might ask? A technical team, J-U-B Engineering out of Grand Junction, conducted site visits on the 50 river structures. The site visit included a field inspection of the river headgate, ditch conditions, inventory and assessment of control structures, measurement devices and level of functionality, overall structural integrity and diversion functionality, along with the ability of the structure to divert a wide range of flows.
The results of the diversion assessment will benefit irrigators by providing a technical evaluation of their structure, including suggestions of ways to improve or modify the structure, if needed. The roundtable will use the information along with a combination of other studies regarding river health and recreation to select future priorities and action planning.
As the work of the IWMP continues, the assessments will also support regional decision making regarding multi-benefit projects — those that overlap agriculture, environment and recreation. Working on the IWMP has opened my eyes to how important agriculture and water are to this community. It’s our livelihood and our heritage.
For more information on the IWMP project, visit yampawhitegreen.com/iwmp.
Gena Hinkemeyer is segment coordinator for the Yampa White Green Basin Roundtable Integrated Water Management Plan.
FromThe High Country News [December 14, 2020] (Graham Lee Brewer and Anna V. Smith):
Representation is important, and so are policy decisions impacting tribes on the ground.
President-elect Joe Biden has pledged to make his administration the most diverse in history, a promise that so far he has fulfilled with several key appointments. For weeks now, momentum has been building behind a push for the Department of the Interior to be run by an Indigenous person for the first time in history. Dozens of tribal leaders have called upon Biden to appoint U.S. Rep. Deb Haaland, D-N.M, an enrolled tribal member of the Laguna Pueblo.
Beyond the obvious symbolic importance of having an Indigenous person lead Interior, a department with a long history of defying the best interests of tribal nations, the possibilities such a position would bring for tribal administrations and citizens alike are endless. Native leaders and advocates are hoping that a Haaland appointment would result in improved tribal consultation on everything from land protections to how agencies like the Environmental Protection Agency, interact with tribal communities. As the country awaits Biden’s decision, Native communities are bracing for what could prove a seismic change in the way the federal government treats the interests of Indian Country.
Dozens of tribal leaders have called upon Biden to appoint U.S. Rep. Deb Haaland, D-N.M, an enrolled tribal member of the Laguna Pueblo. Photo credit: Bridget Badore via High Country News
“It will be a moment to exhale for tribal leaders,” said Judith Le Blanc, a citizen of the Caddo Tribe of Oklahoma and director of the Native Organizers Alliance, a national Native training and organizing network. An Indigenous person leading Interior, she said, would mean having someone who understands the legal and inherent rights of Indigenous peoples to govern their own lands.
“We’re the only peoples in this country who have a collectively owned land base that has been self-governed since the beginning of time,” Le Blanc said. “To have someone who understands that historic fact and therefore the rights and responsibilities to consult and to discuss before a decision is made that will affect treaty lands will be amazing. It creates opportunities and possibilities that tribal leaders will have to step into.”
The possibility of an Indigenous person leading Interior comes after an election in which Indigenous voters supported the Biden/Harris ticket in critical states like Arizona, Nevada and Wisconsin. As IllumiNatives — a nonprofit working to increase Native visibility — put it in a social media post, “Joe, Native people showed up for you. Now, show up for them.” If Haaland — or someone like Michael Connor, a member of Taos Pueblo and former deputy Interior director, whose name has also been floated as a possible nominee — were to run the department, it would have a significant impact on Indian Country policy for the next several years not only for department policies and representation, but also for on-the-ground realities.
Under the Trump administration, environmental laws were significantly weakened, protections of places like the Tongass National Forest were rolled back and large-scale, high-impact projects like the Keystone XL and Dakota Access pipelines were expedited. Many of those policies included a rushed — or, in the case of the U.S.-Mexico border wall, nonexistent — tribal consultation process. While all bureaucracies have flaws, both Haaland and Connor understand that including tribal nations in a government-to-government consultation process is non-negotiable. They could also reverse some of the Trump administration’s controversial decisions. Whoever is chosen, the stakes are high.
The Yurok Tribe was one of a host of tribes to sign a letter to President-elect Joe Biden, urging him to choose Haaland. The tribe has had a protracted battle with the federal government over keeping enough water in the Klamath River to support their lifeways and the river’s salmon population. In 2001, a government decision caused the largest fish kill in Yurok and U.S. history. Vice Chairman Frankie Myers says the representation and experience that would come with Haaland as an Indigenous person and lawmaker would be a welcome change: “Ensuring that Indigenous voices are at the highest level of government, specifically when it comes to resources, is critical for us moving this country in a better, more positive way.”
Bernadette Demientieff, executive director of the Gwich’in Steering Committee, agrees. In November, the Trump administration announced that it would auction off oil and gas leases in the Arctic National Wildlife Refuge just two weeks before Biden takes office. The refuge, which lies within the ancestral lands of the Gwich’in, supports the sensitive populations of Porcupine caribou, polar bears and walruses. The Gwich’in Steering Committee has filed numerous lawsuits to stop the sale. “This current administration has done nothing but disrespect and violate the rights of our people,” Demientieff wrote in a statement to High Country News. As for an Indigenous leader of Interior, “I can’t believe it has taken this long. We have never been included in decisions that will affect our future.”
While Native voters tend to lean left, Indian Country issues on the Hill have typically found support with both Republicans and Democrats. The six Indigenous people who will join the next Congress are split evenly between the parties. And even though the political atmosphere has been considerably polarized under the Trump administration, the prevailing sentiment is that Haaland’s ability to work across the aisle will keep Indian Country policy from becoming a politically divisive issue.
“There’s a reason why people like (Republican U.S. Reps.) Don Young and Tom Cole have publicly spoken out in very positive ways regarding Deb,” said Keith Harper, a member of the Cherokee Nation and an Obama appointee who was the first Indigenous person to represent the U.S. on the United Nations Human Rights Council. “Because they’ve worked with her and know she’s willing to put the party politics aside and get pragmatic about challenges.”
“Because we understand that Native American issues are not a matter of conservative versus liberal, we have accomplished a great deal together,” said Rep. Cole. Out of all representatives in the House, Haaland’s bills have had the most bicameral support, and often bipartisan. And the political allies and partners she’s made in Congress have some predicting that this would translate to consensus building across the government on issues affecting Native people.
“Oftentimes, Interior is looked as the agency that handles Indian affairs,” said Kim Teehee, the Cherokee Nation’s congressional delegate. “We have HUD (Housing and Urban Development) that handles Indian housing, we have the FCC (Federal Communications Commission) that handles broadband, education, the USDA (Department of Agriculture). There is such a cross-cutting nature of Indian Country issues, and I think she has the unique ability as a Cabinet secretary to convene the agencies.”
One non-Native whose name has been floated for the position is retiring Sen. Tom Udall, a Democrat from New Mexico, who has long been a champion of Indigenous affairs in Congress. His father, Stewart Udall, was secretary of Interior from 1961-1969 under presidents John F. Kennedy and Lyndon B. Johnson. A number of progressive Native-led organizations have called on him to remove his name from consideration. When asked what it could mean for an Indigenous person to lead Interior, Udall told High Country News that “Native Americans should be in high positions throughout government in the White House and various agencies – it’s not just about the Interior Department,” adding that the next secretary must prioritize tribal nation’s needs with inclusive consultation, and put in “the hard work to make sure Native voices are front and center throughout the department.”
Graham Lee Brewer is an associate editor at High Country News and a member of the Cherokee Nation. Email him at grahamb@hcn.org.
Anna V. Smith is an assistant editor for High Country News. Follow @annavtoriasmith.
This story was originally published at High Country News (hcn.org) on December 14, 2020.
In 2020, Oregon experienced some of its driest conditions on record. And yet, despite the overall lack of precipitation, the state’s mountains received more or less normal amounts of snow.
However, above-average spring temperatures melted mountain snow several weeks earlier than normal in several Oregon basins. This led to water flushing through local rivers and streams before it could be used for irrigation during the late spring and summer growing seasons. As temperatures continued to rise throughout the summer, water shortages and drought declarations followed.
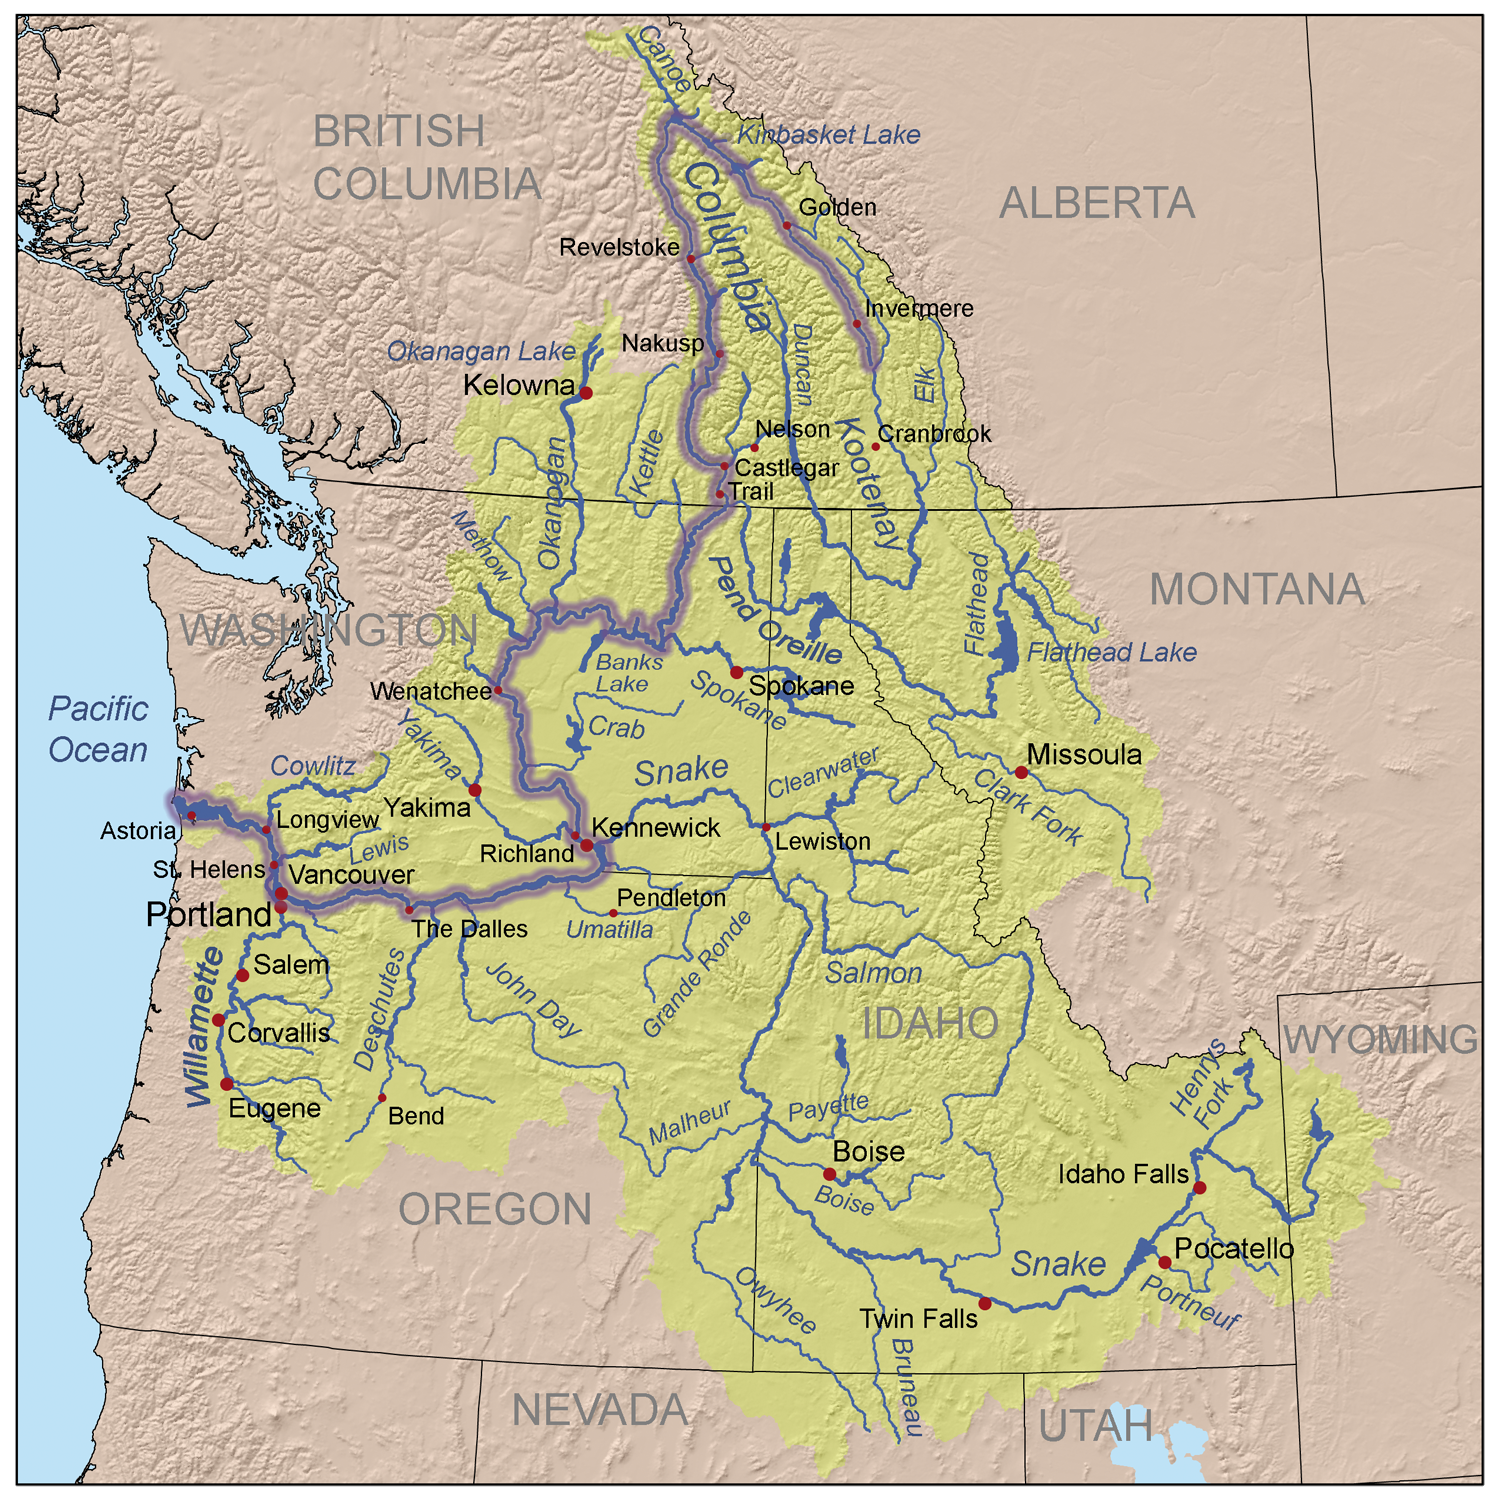
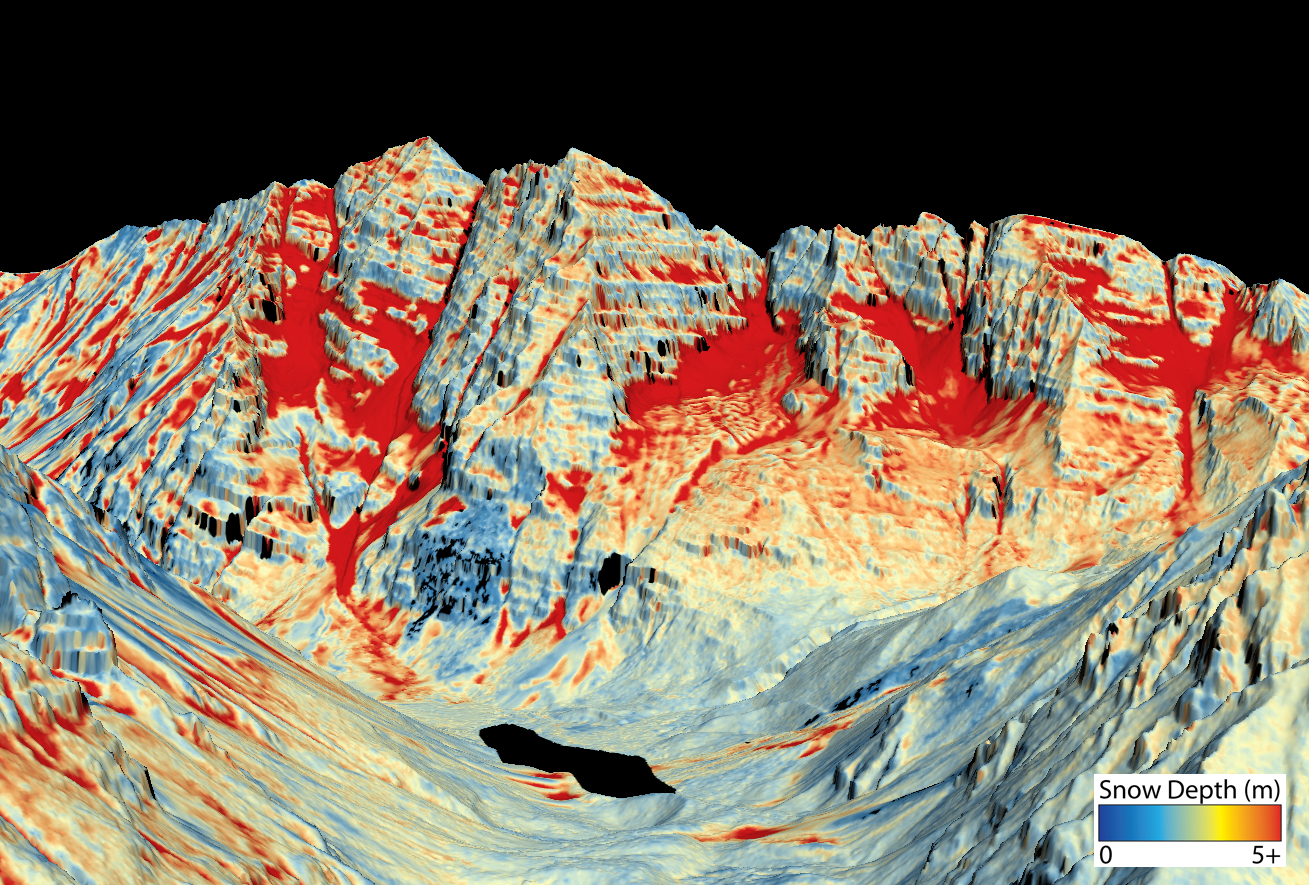
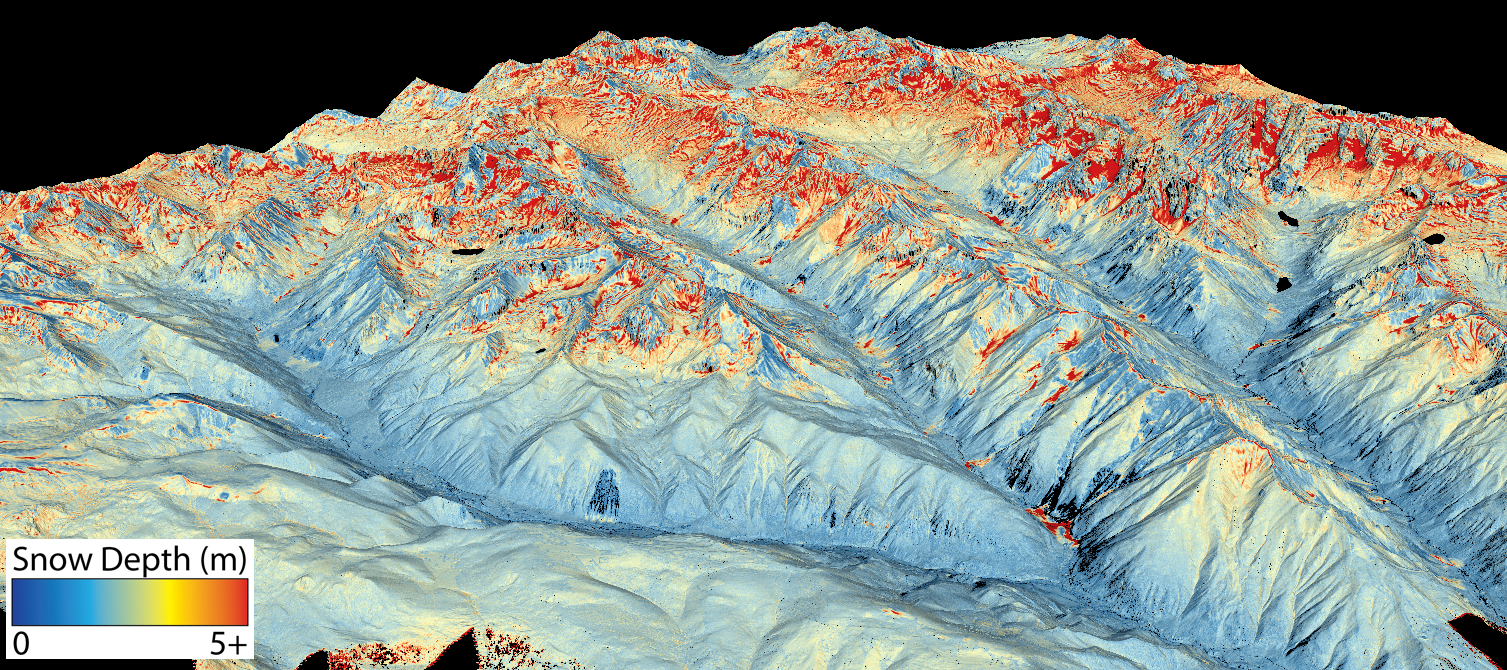
Around the same time Oregon farmers were watching their water drain away, a May 2020 study published in the UK-based scientific journal Nature Climate Change literally put the Columbia River Basin on the world map as a watershed whose dependence on snow for irrigation places it on the losing side of climate change.
Here, too, the reason had to do with rising temperatures and melting snow, and here, too, the point was hammered home. The study concluded that under future warming, the Columbia River Basin, the Pacific Northwest’s largest hydrologic basin, is likely to lose so much mountain snow it will experience about the same degree of water scarcity as the Middle East basin containing the Tigris River and Euphrates River. In fact, the Columbia River Basin actually comes out looking a little worse off than the Tigris/Euphrates Basin, according to the study.
Less snow, more problems
Titled “Agricultural risks from changing snowmelt,” the study outlines two ways rising temperatures are expected to lead to water shortages in the future.
In the first condition, snow will accumulate more or less as normal, but melt early due to abnormally warm temperatures, as happened this year in some Oregon basins.
In the second condition, especially warm temperatures will cause precipitation to fall mostly as rain rather than as snow, as happened region-wide during the Northwest’s “snow drought” of 2015.
Study co-author John Abatzoglou, a University of California Merced associate professor in Management of Complex Systems, says more rain and less snow is going to be the new normal as our regional climate warms…
As you’d expect, all basins experienced some degree of snowpack loss under both warming scenarios. But 4 degrees Celsius of warming proved far more detrimental than 2 degrees Celsius of warming…
In the case of the Columbia River Basin, the study’s three-pronged approach — examining current dependence, projected snowpack losses and how much water each basin would need to make up for that lost snowpack — is revealing.
While the Columbia scored better than the San Joaquin and Colorado River Basins in terms of the amount of snowpack it’s expected to lose, the basin’s reliance on snowpack and its need to find new sources of water makes it far more vulnerable than it might at first appear.
Abatzoglou says it’s unlikely the basin can build enough new storage to make up for the natural storage snow provides. But, he stresses, storage is only part of the story. To fully understand the study’s conclusions, you need to look at timing…
For most of the 20th century and into the early years of this century, lack of precipitation during the growing season didn’t present a problem for farming because farmers could irrigate with water from snow that reliably melted during the growing season and reliably accumulated during the off season. But warming temperatures mean not only less snowpack, but also a change in the seasonal timing of that water, which adversely affects irrigation.
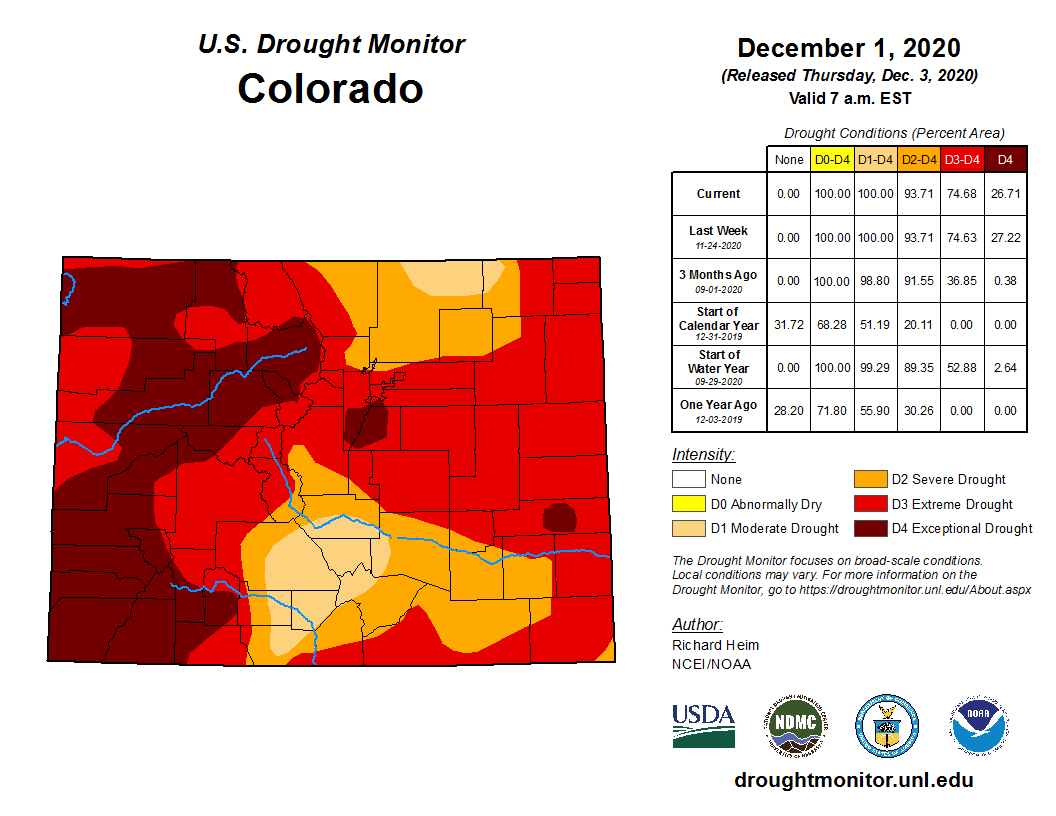
Despite some snowfall in the past week, Colorado’s drought continues to wear on.
The U.S. Drought Monitor places the southern half of the county in extreme drought while the northern half is in exceptional drought, the worst level on the scale.
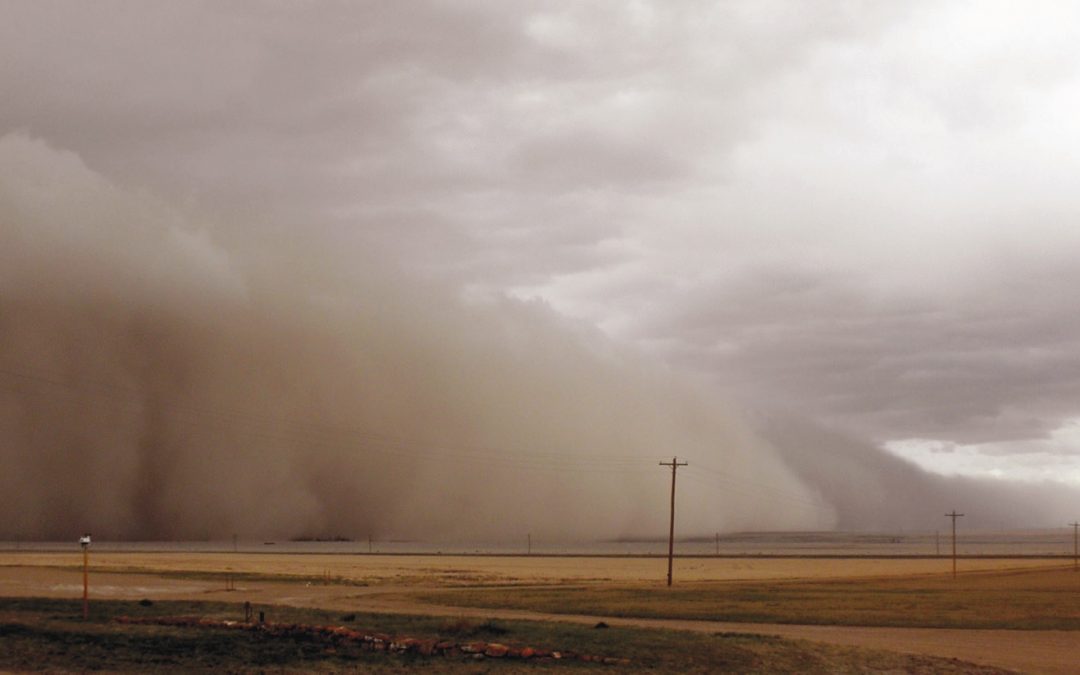
The Drought Monitor lists large fires, extremely low reservoirs, increased water temperatures and worsening pasture conditions as impacts of an extreme drought. For exceptional drought, the anticipated impacts include widespread dust storms and topsoil removal as well as large agricultural and recreational economic losses.
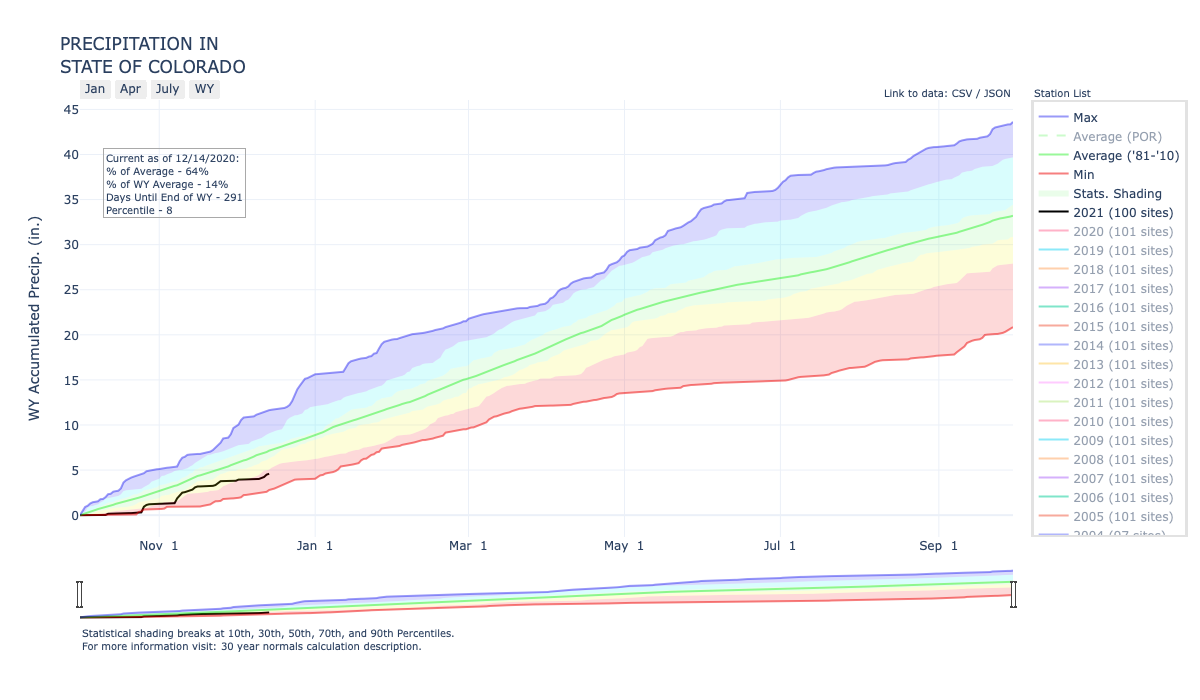
Statewide precipitation water year 2021 through December 14, 2020 via the NRCS.
Precipitation has been below normal in Colorado since Oct. 1, and drought conditions have “expanded where long-term precipitation deficits continued to mount,” according to a Drought Monitor summary for Dec. 8. Statewide reservoir storage is below normal, and in the past six months, the southwest region of the country, which includes Colorado, experienced its hottest and driest June to November on record.
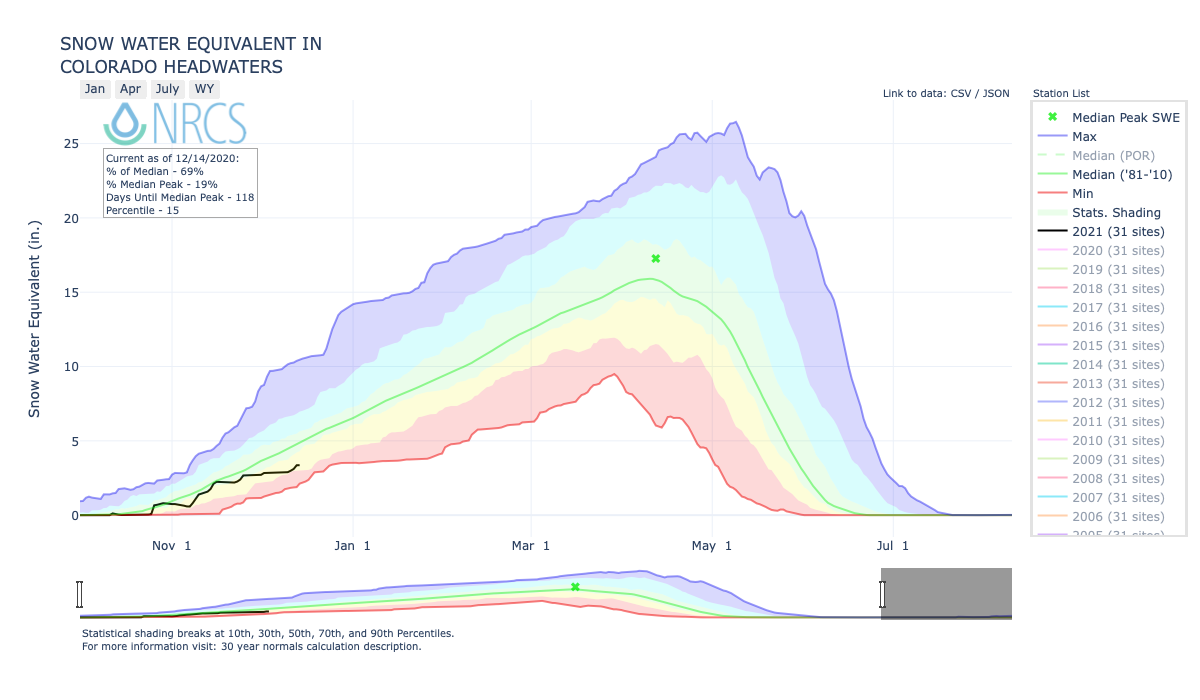
Upper Colorado River Basin snowpack December 14, 2020 via the NRCS.
Paul Schlatter, a meteorologist at the National Weather Service office in Boulder, said Summit County has seen only 50% of its normal snowfall for this point in December.
Looking back to November, precipitation totals were on opposite ends of the spectrum depending location in the county, Schlatter wrote in an email. The northwest part of Summit County along the Blue River saw 25% to 33% of normal November precipitation while a whopping 125% of normal precipitation fell to the southwest. Precipitation was around normal along the Interstate 70 corridor, Schlatter said.
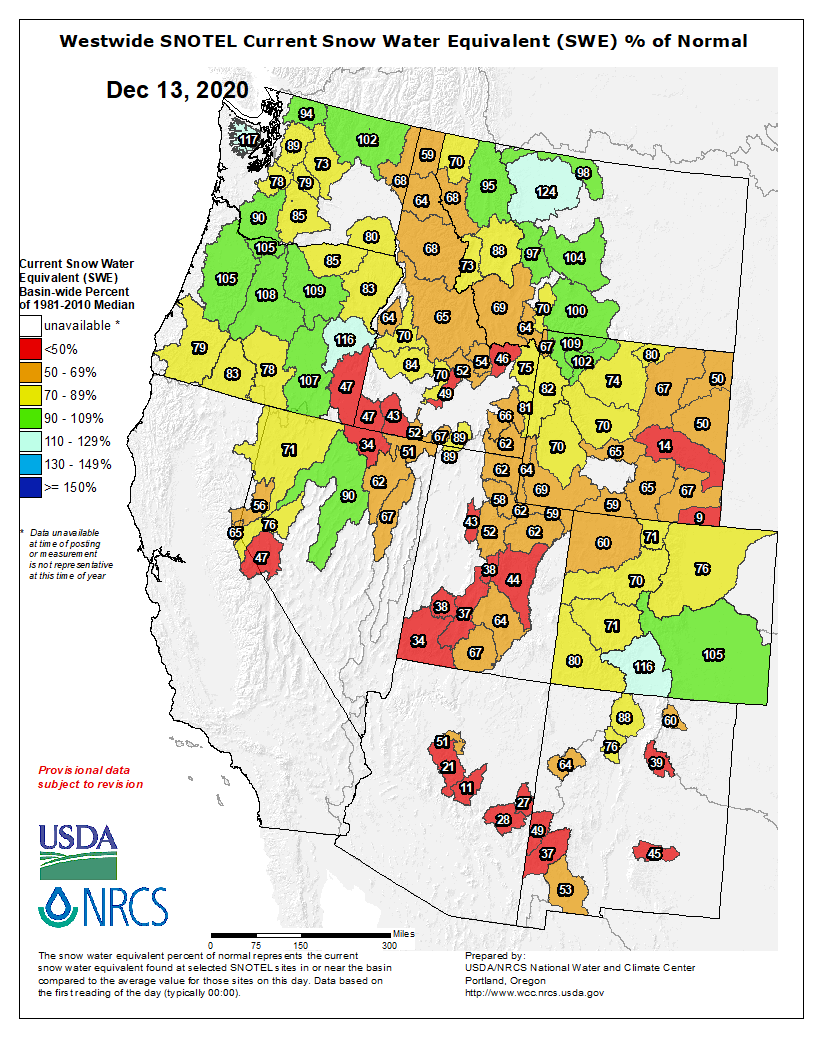
Westwide SNOTEL December 13, 2020 via the NRCS.
Breckenridge has recorded 54 inches of snowfall this season as of Monday, Dec. 14. By the same date in 2019, the resort had recorded 68 inches, according to On the Snow data. At Arapahoe Basin Ski Area, 35 more inches of snow was recorded by Dec. 14, 2019, compared with this year. Ski areas don’t begin recording their seasonlong snowfall totals until they are open, so lower totals this year also could be attributed to delayed openings. Breckenridge opened five days later this year than in 2019. A-Basin opened 29 days later than last year, in part due to a water shortage that impacted its ability to make snow.
A change in the weather pattern brought as much as a foot of snow to Summit County ski areas over the weekend, and more snow is on the way.
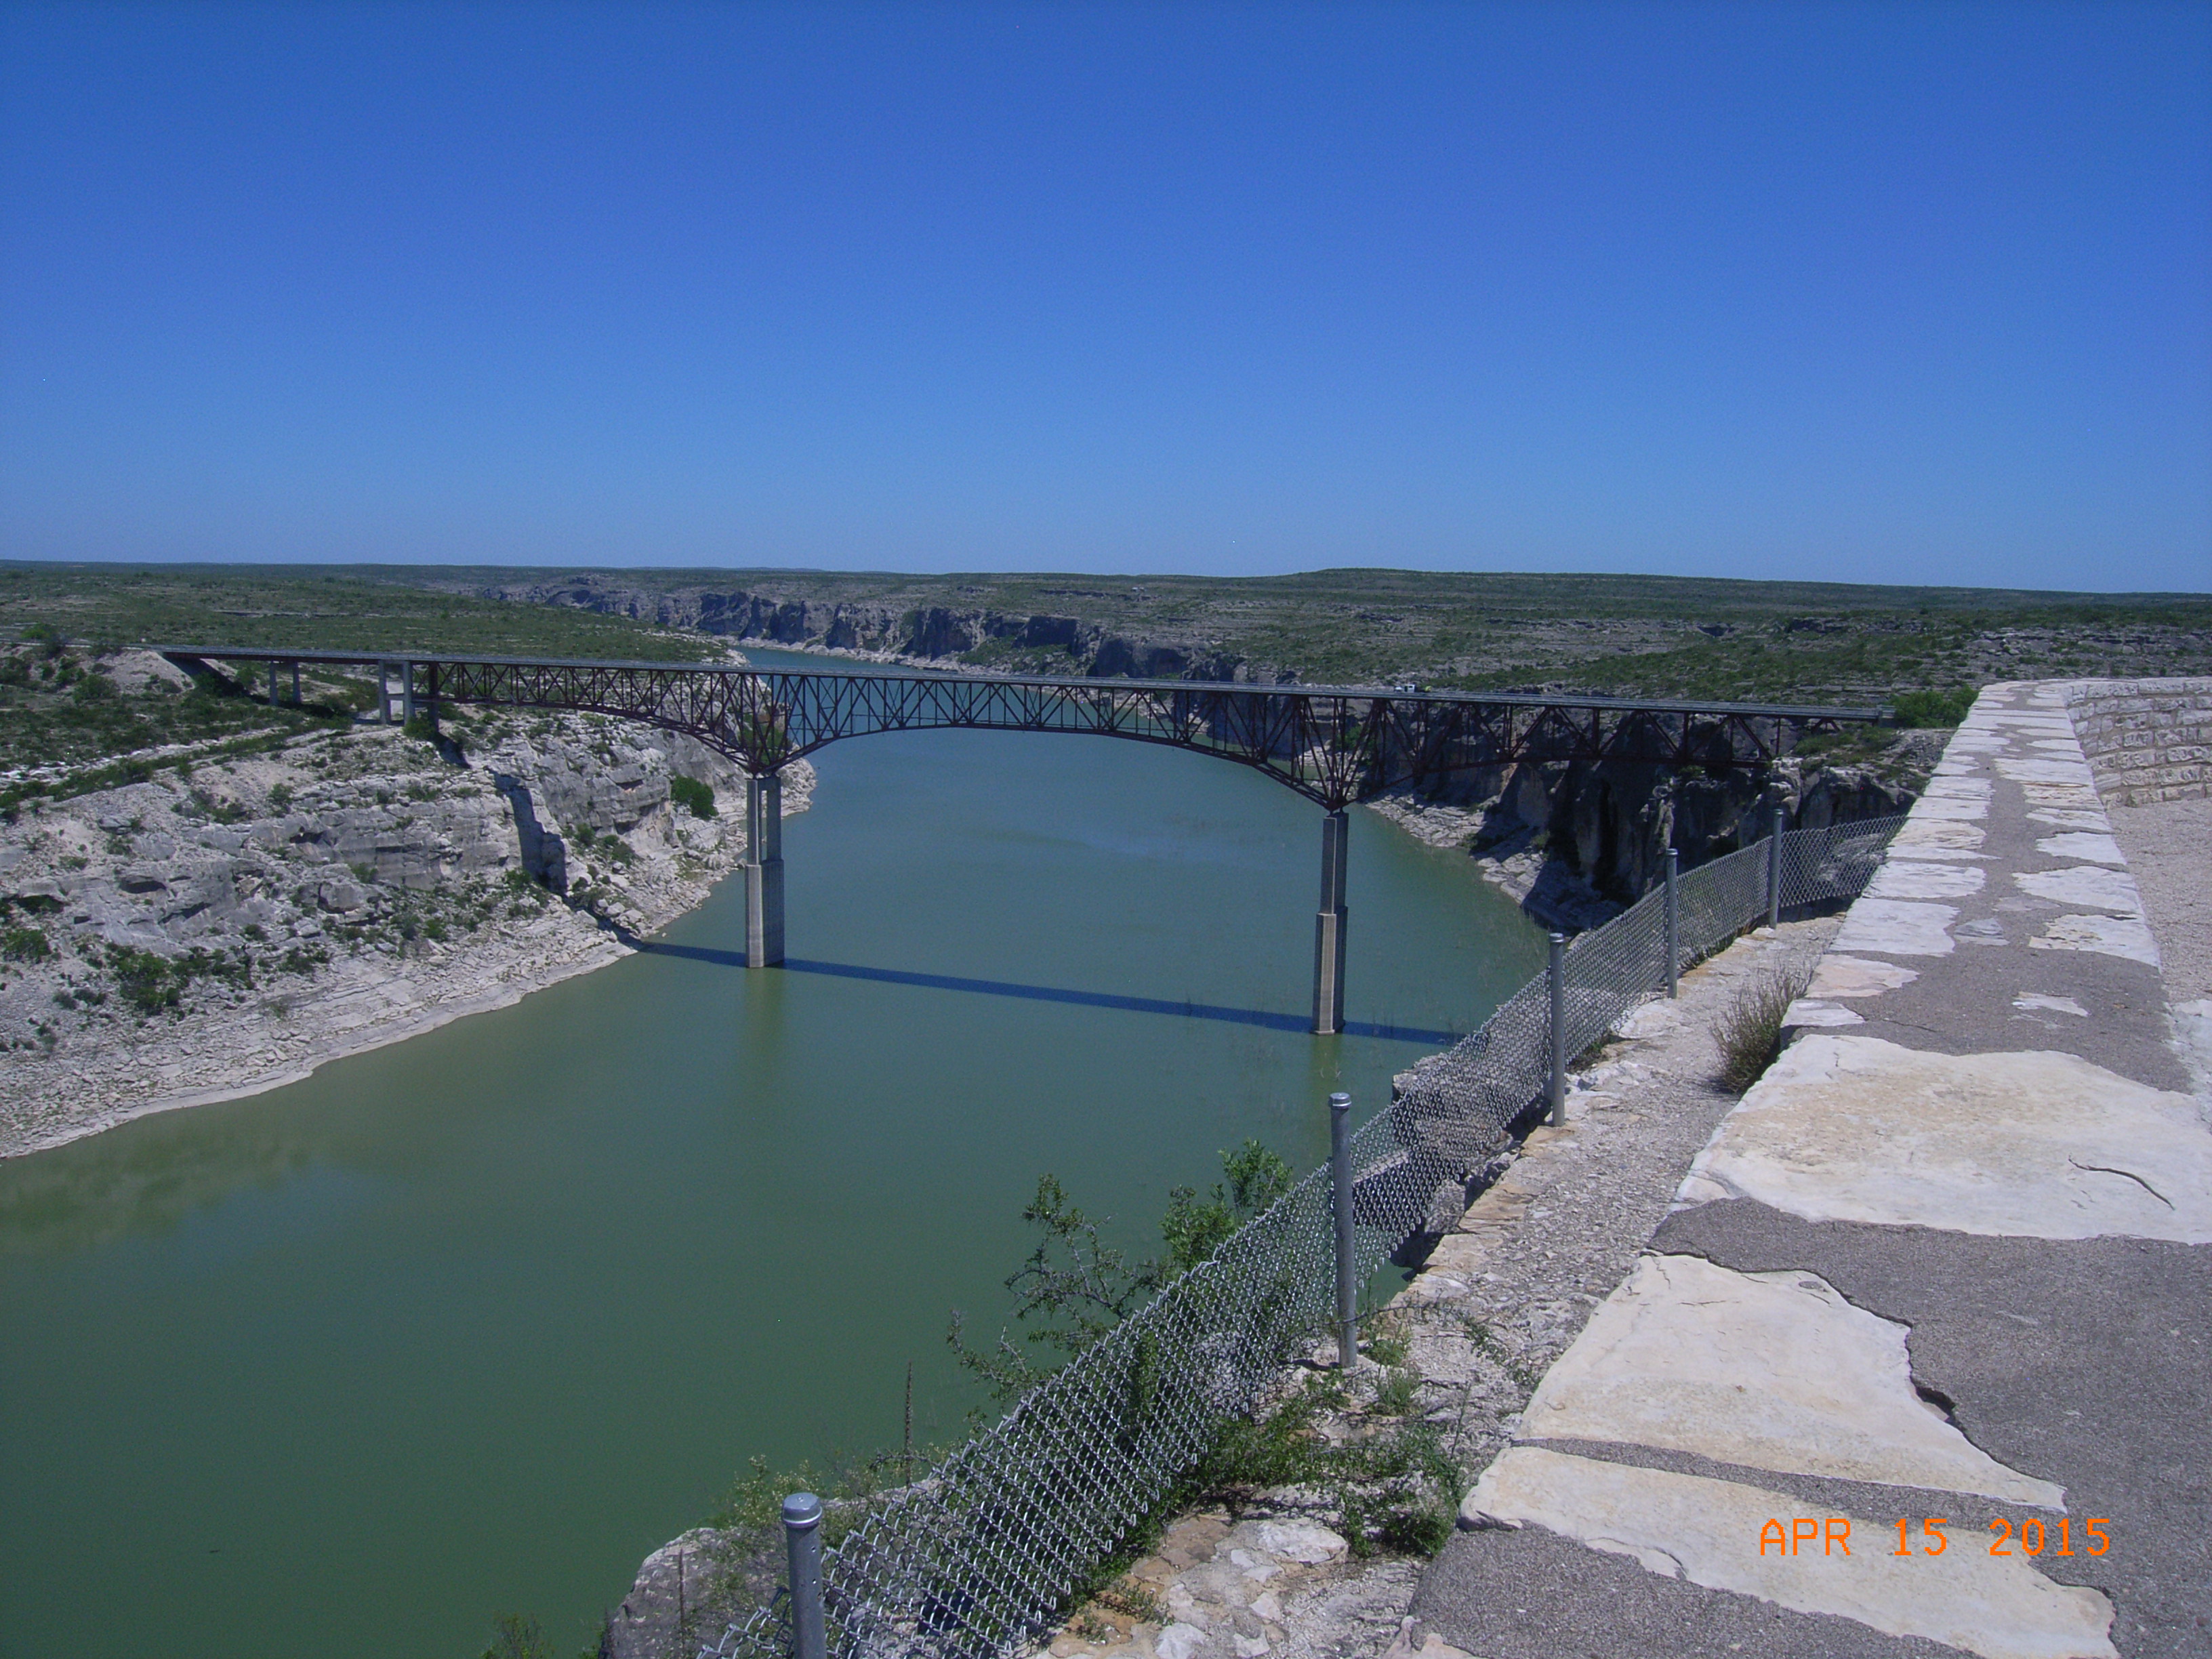
On Monday, the Supreme Court said a river master overseeing the Pecos River compact between the two states correctly decided New Mexico should receive credit for floodwater it stored for Texas after Tropical Storm Odile dropped significant amounts of rainfall into the Pecos River Basin in 2014.
Some of the water had evaporated while in storage by the time Texas was ready to receive it, prompting that state to claim New Mexico failed to meet its obligations. The river master granted New Mexico delivery credits in 2018.
Texas challenged that decision and asked the Supreme Court to review the case.
“The question presented is straightforward: Under the Pecos River compact, does New Mexico receive delivery credit for the evaporated water even though that water was not delivered to Texas? The answer is yes,” wrote Justice Brett Kavanaugh in delivering the opinion of the court.
The Pecos River, which begins east of Santa Fe at the base of the Sangre de Cristos and runs through Eastern New Mexico, is used by irrigators and cities in both states and is the subject of a 1949 compact.
Critical to the case, Kavanaugh wrote, was an email between Texas’ Pecos River commissioner, in which he asked his New Mexico counterpart to hold Texas’ portion of the flow until it could be utilized at Red Bluff Reservoir on the Texas side of the border south of Carlsbad.
New Mexico agreed, but reminded Texas the water belonged to that state and would have been released downstream if not for the request.
New Mexico, Kavanaugh wrote, “also added (correctly as it turns out) the [e]vaporative losses … should be borne by Texas.”
“The text … and the record evidence of the States’ correspondence establish that New Mexico is entitled to delivery credit for the water that evaporated while New Mexico was storing the water at Texas’ request,” the justice wrote.
D’Antonio said New Mexico has a credit of about 166,000 acre-feet under the Pecos compact. That includes the 16,000 acre-feet that were in play in Monday’s case.
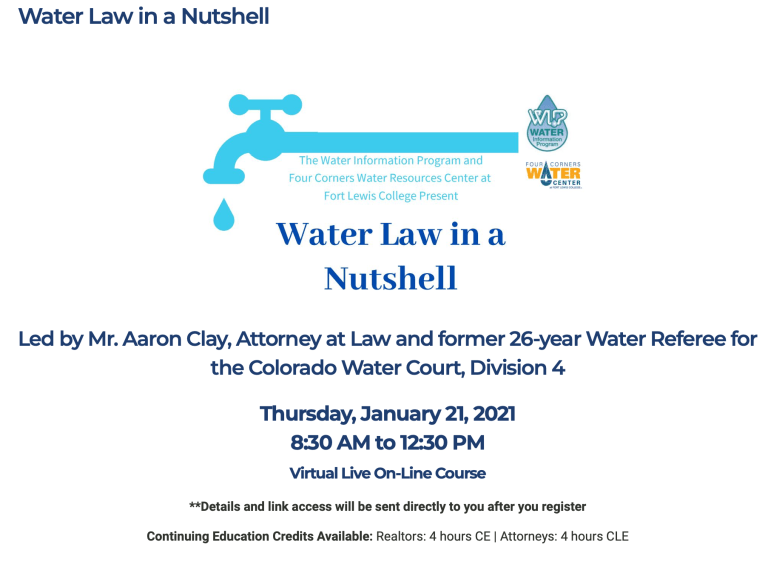
Don’t miss this rare and unique opportunity with Aaron Clay in an online setting to learn more about all aspects of the law related to water rights and ditch rights as applied in Colorado. Subject matter includes the appropriation, perfection, use, limitations, attributes, abandonment and enforcement of various types of water rights. Additional subject matter will include special rules for groundwater, public rights in appropriated water, interstate compacts and more.
From his 26 years as a water referee at the Colorado Water Court, Clay brings his wealth of knowledge that earned him a reputation as one of the top experts in water law to this “Water in a Nutshell” course.
We welcome EVERYONE in Colorado, including landowners, realtors, lawyers, water district employees, and anyone else interested in water law.
Registration is $35.00, which includes a hard copy of the Citizen’s Guide to Colorado Water Law, Citizens Guide to Interstate Compacts ($20.00 value) and course materials all mailed directly to you. **$55.00 if you wish to receive Continuing Education Credits. Includes Registration, all course materials and CE or CLE’s.
Pre-registration is required! Register early as this workshop is sure to sell out.
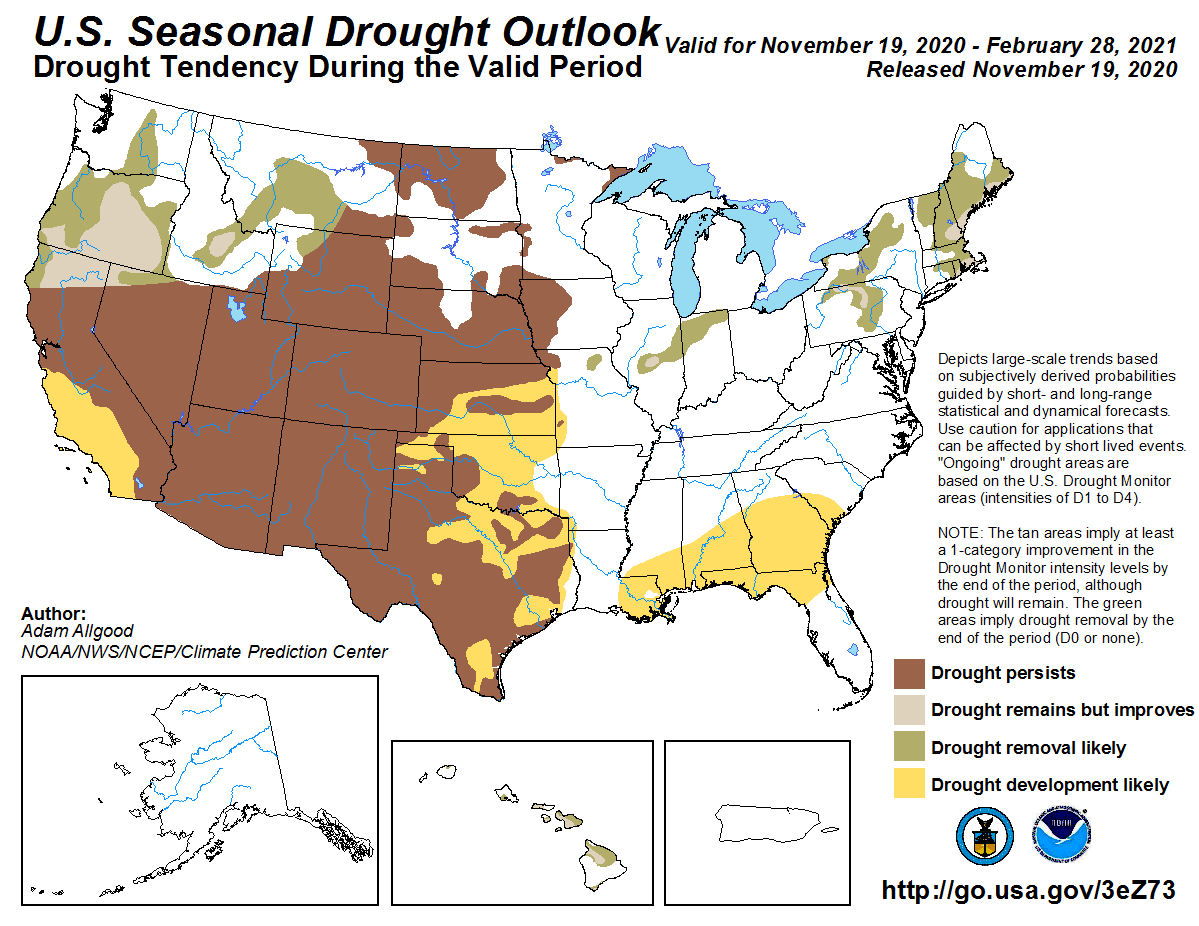
The National Oceanic and Atmospheric Administration is calling for drought conditions across the state to persist and possibly worsen into next year as a La Niña weather pattern brings above-normal temperatures and dry conditions to the southwestern U.S., said David Miskus, a meteorologist with the Climate Prediction Center.
US Drought Monitor December 8, 2020.
The entire state is already seeing drought conditions, with more than two-thirds in extreme or exceptional drought. Most of El Paso County is in extreme drought, according to the U.S. Drought Monitor.
To help prepare, Colorado has activated its municipal emergency drought plan for only the second time in history as several cities say they need to prepare for what is almost certainly going to be a dangerously dry 2021.
For Colorado Springs Utilities, activating the drought plan means increasing its communication between other major water users about water storage, future water supplies, and operational plans, said Patrick Wells, general manager with Colorado Springs Utilities Water Resources and Demand Management…
Planning for drought and water supply in the state is becoming harder as supply becomes increasingly variable, Wells and other experts said…
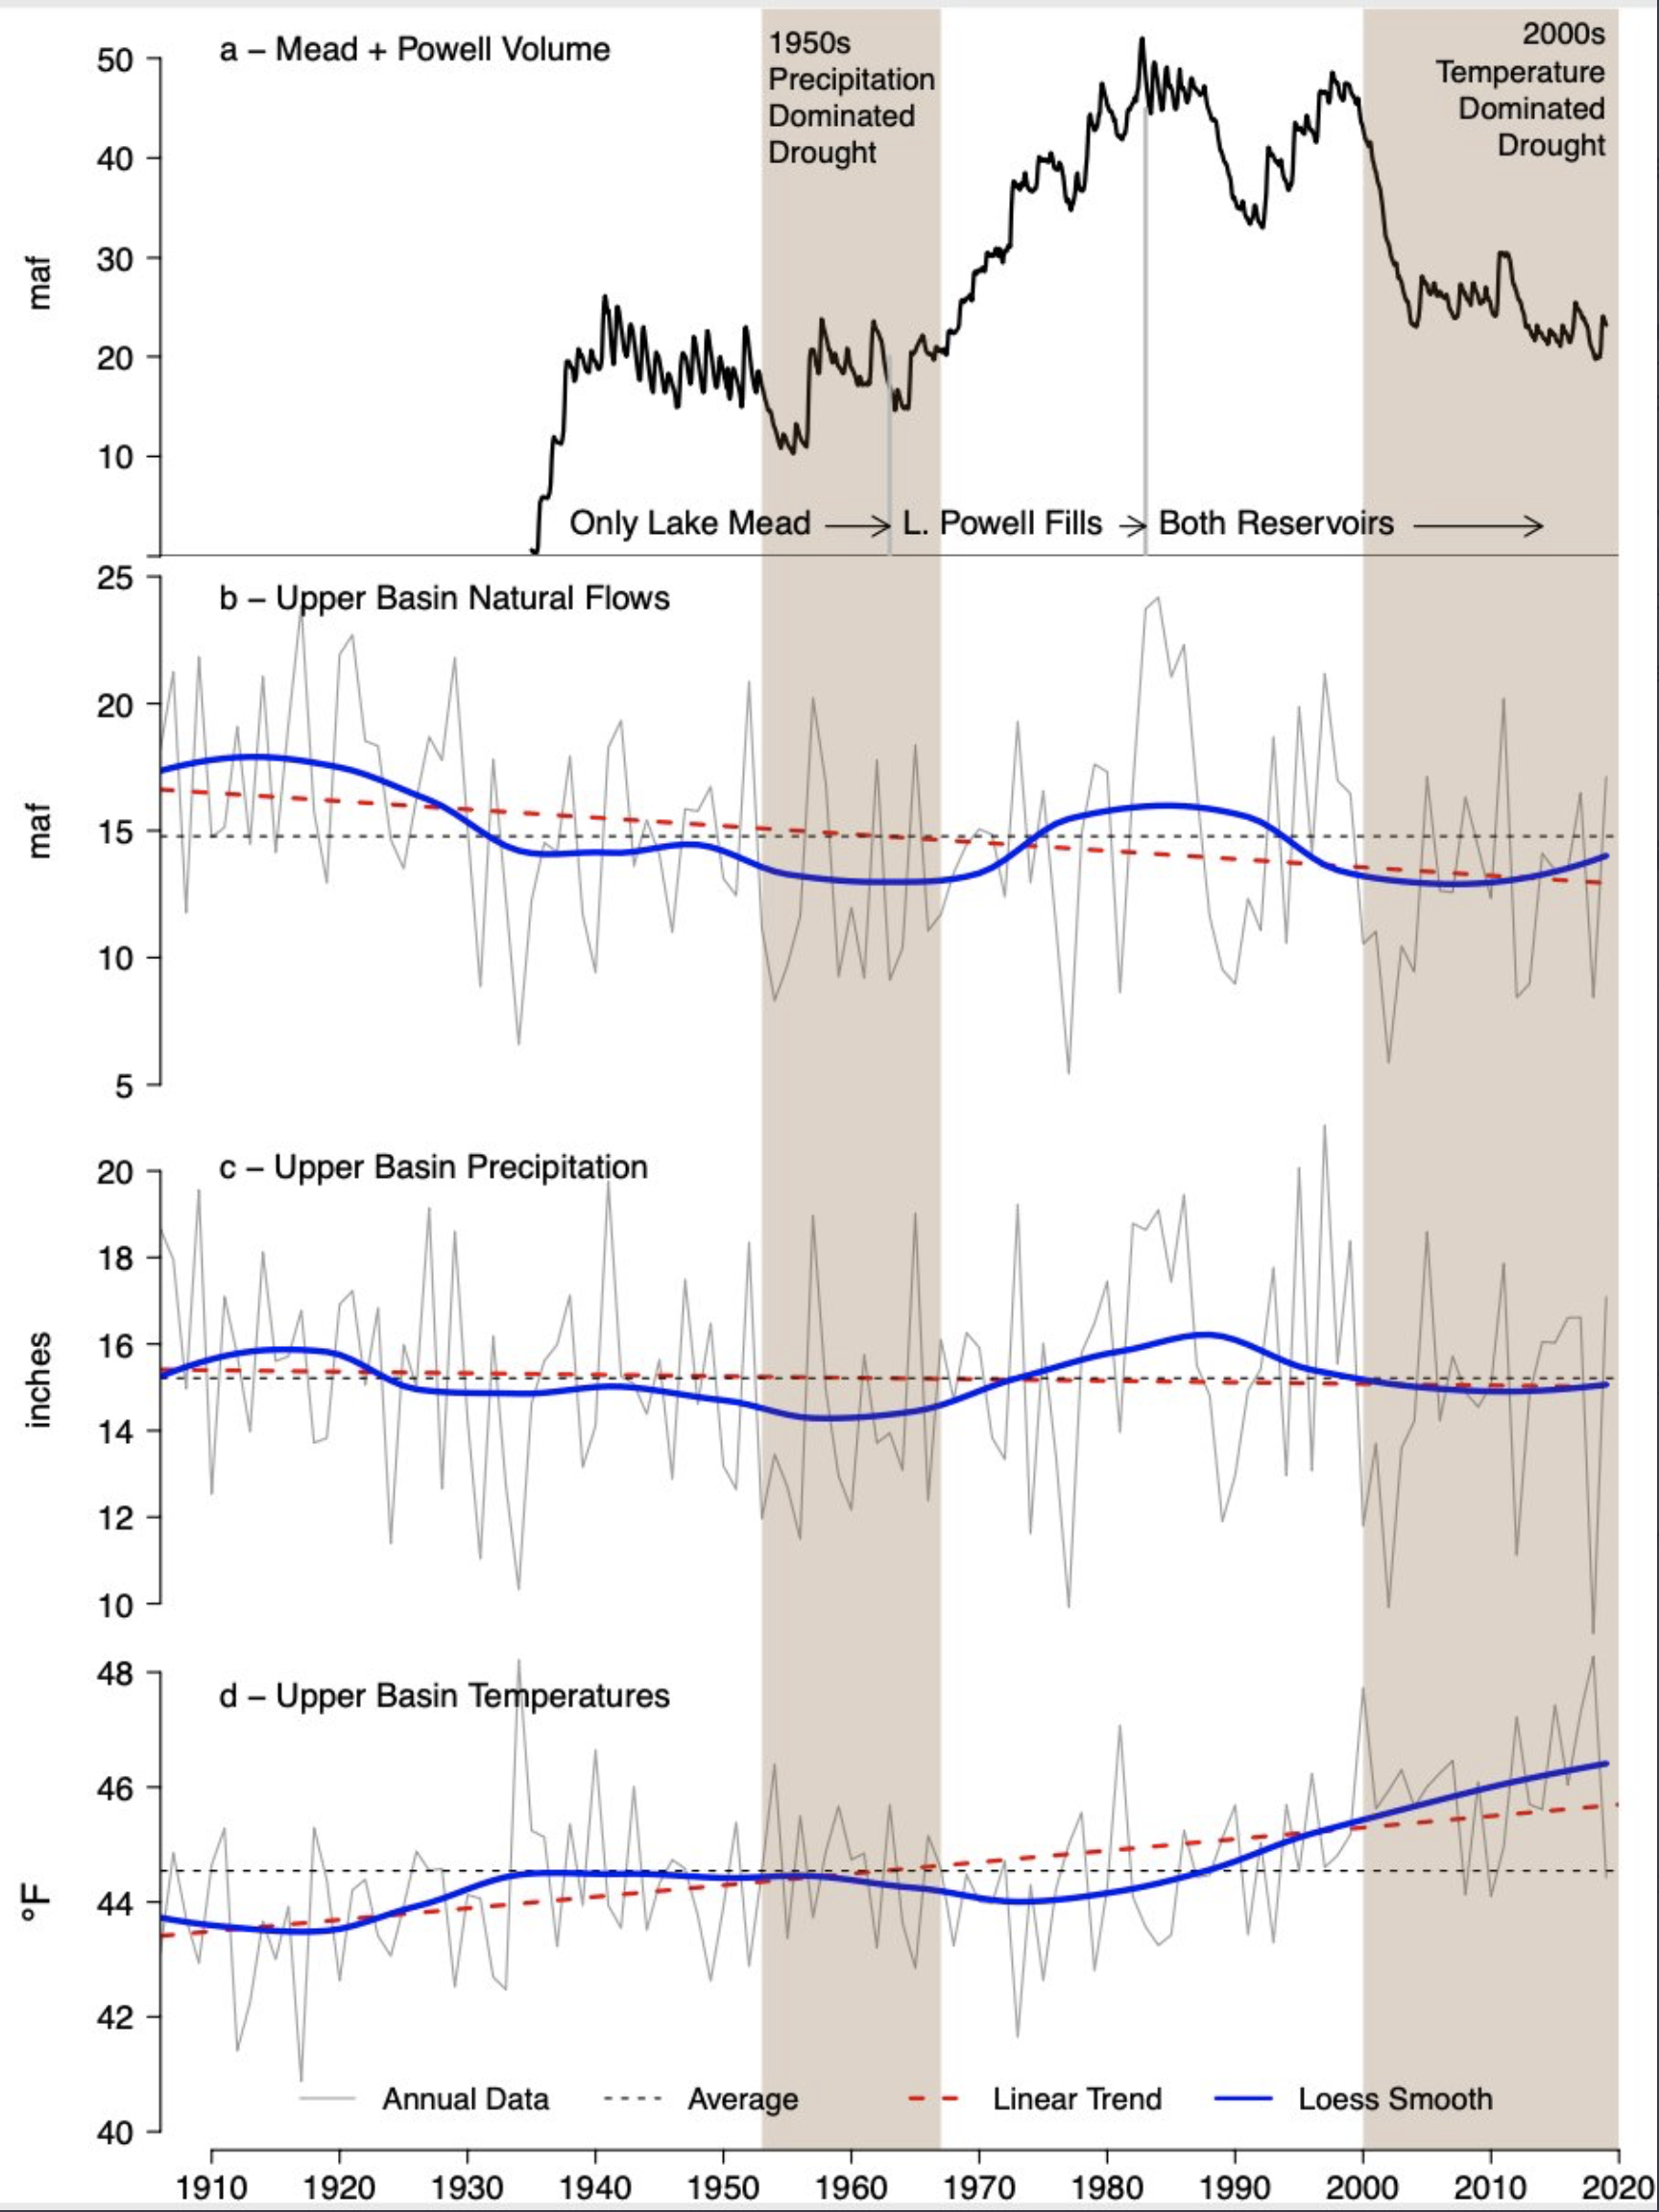
Brad Udall: Here’s the latest version of my 4-Panel plot thru Water Year (Oct-Sep) of 2019 of the #coriver big reservoirs, natural flows, precipitation, and temperature. Data goes back or 1906 (or 1935 for reservoirs.) This updates previous work with @GreatLakesPeck
For example, last winter’s snowfall was fairly strong across the state and, on April 1, the snowpack for the upper Colorado River Basin had reached 100% of average. But the basin saw only 52% of normal runoff when experts would have expected to see much, much more water, said Brad Udall, senior water and climate research scientist at the Colorado Water Institute at Colorado State University.
Colorado Springs relies heavily on water from the Colorado River basin.
Water in the Colorado basin was likely lost to thirsty soils because the fall of 2019 was so dry and some water likely evaporated in the warm spring temperatures, he said.
“It’s not typical, but it could very well be our future,” Udall said…
For water users along the lower Arkansas River, in counties like Pueblo and Otero, the runoff from the 2020 snowpack came fast along with higher temperatures that drove evaporation, said Jay Winner, general manager of the Lower Arkansas Valley Water Conservancy District…
But, he agrees with Udall, that higher temperatures and lower flows could be the new normal. Lakes east of Pueblo are seeing 50% of their capacity lost to evaporation and that could go up, he said. So projects to preserve water in the system need to get underway to help deal with it, he said.
“We are still managing water like we did 50 years ago,” Winner said.
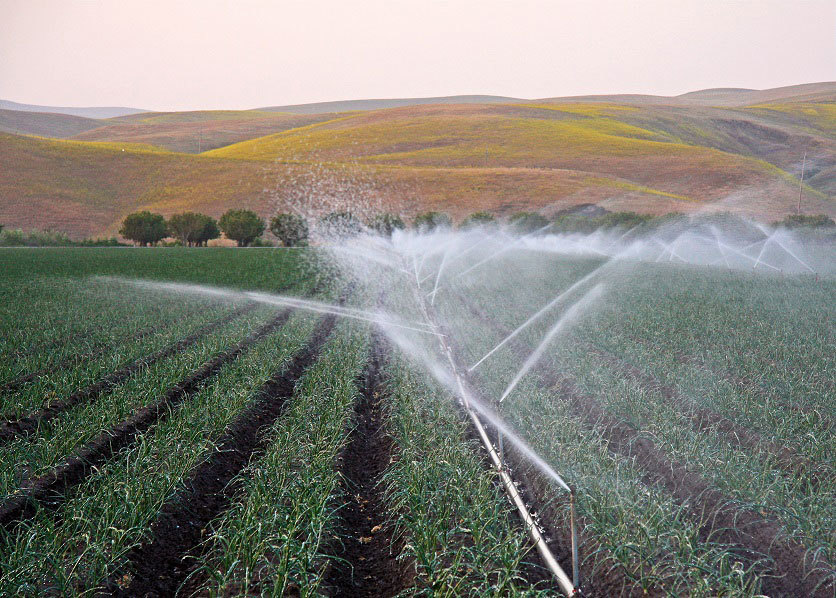
Lining ditches and ponds can help more water reach the fields and once it gets there, center-pivot sprinkler systems and drip irrigation can also help farms water more efficiently, he said.
FromThe Grand Junction Daily Sentinel (Dennis Webb):
Winter may be the offseason when it comes to a lot of construction work, but for ongoing efforts to line local irrigation canals, it’s the only practical time for further pursuing multi-year efforts to line them.
Doing so locally helps address salinity problems throughout the Colorado River Basin, meaning that irrigation entities can tap federal funds to pay for much of the work. But it also provides the side benefit of making canals able to deliver water more efficiently, in higher volumes, multiplying the payback for the millions of dollars that get invested in such work.
In September, the federal Bureau of Reclamation announced that it will distribute $33.7 million for salinity control projects in western Colorado over the next three to five years. This includes nearly $4.7 million for the Grand Valley Water Users Association for continued lining of the Government Highline Canal, and about $1.23 million to the Grand Valley Irrigation Company for a fifth phase of lining it has been doing over the past decade or so thanks to Bureau of Reclamation salinity control funding.
Lining canals limits seepage of water into the ground, where that water can pick up salt before eventually reaching the Colorado River, which is relied upon by downstream states and Mexico. High salinity in the river reduces crop yields downstream for farmers reliant on the river water, and can increase water treatment costs and corrode things such as household appliances, reducing their useful life.
In Colorado, salinity control efforts by the Bureau of Reclamation also include the operation of a deep injection well for salty groundwater in Montrose County’s Paradox Valley. While that project has been highly effective in salt removal, it is increasingly causing earthquakes and the future of the Bureau of Reclamation’s Paradox desalination program is uncertain as the well nears the end of its serviceable life.
23,426 TONS OF SALT A YEAR
In the Grand Junction area, groundwater reaching the river percolates through Mancos shale associated with an inland sea that left salt deposits behind tens of millions of years ago. The Bureau of Reclamation estimates that a total of $37.2 million it will distribute to 11 projects in western Colorado and Wyoming over the next few years will keep about 23,426 tons a year from entering the Colorado River.
The last lining work the Grand Valley Water Users Association did on the Government Highline Canal was finished last year and ended at 36-3/10 Road in the Palisade area. The work being undertaken now will pick up from there and run to 35 3/10 Road, covering some 6,100 feet of canal length, said Mark Harris, the association’s general manager.
The canal is operated by the association and owned by the Bureau of Reclamation. The project the new funding will cover most of will take place over three winters, and Grand Valley Water Users Association is covering about 10% of the cost through cash and in-kind contributions.
The funding the Grand Valley Irrigation Company is getting will be used for work on close to a mile of the Grand Valley Canal over multiple years, on stretches running by Bookcliff Gardens and the Crown Point Cemetery area. Phil Bertrand with the Grand Valley Irrigation Company said the hope is to get about 300 or 400 feet lined in the first phase of that work this year.
Grand Valley Irrigation’s project involves a little more than $149,000 in matching funding, according to the Bureau of Reclamation.
Harris said the work on the Government Highline Canal will include restoring its shape where needed. A fuzzy geotextile layer will be laid down to help protect the water-sealing PVC liner that’s put on top of it from the underlying earth and rocks. The PVC liner is covered with another fabric liner, and then three inches of concrete are added on top to help protect the canal from abrasion from sand and silt flowing through the canal.
A drainage system also is being installed below the canal to help control the accumulation of underlying groundwater that can damage the canal lining when it is drained due to pressure exerted on it. The water in the canal when full otherwise counters that pressure…
Canal lining also reduces seepage that can impact adjacent private property. In addition, it can reduce the amount of selenium that also leaches along with salt into the river. High selenium levels in soil are particularly a concern in the Gunnison River Valley, and high levels in the Gunnison and Colorado rivers can threaten wildlife including endangered fish…
Harris said some sections along the Government Highline Canal cause more salt loading in the river than others. Localized levels of salt underground, the underground geological structure in an area and how much water that seeps from the canal actually makes it to the river all can play roles in salt loading, and areas of the canal with a lot of seeping aren’t necessarily where lining results in the most reduction of salt…
GUNNISON PROJECTS
The Uncompahgre Valley Water Users Association got more than $5 million in funding, and Grandview Canal & Irrigation Co. in the Crawford area received more than $6.3 million. Needle/Rock Ditch Company, also in the Crawford area, is receiving about $4.24 million, and Pilot Rock Ditch Company in eastern Delta County is getting more than $940,000. The Turner Ditch Company near Paonia will receive about $6.15 million.
All of those projects entail installing pressurized pipe. Some involve matching funds and others are being completely paid for by the Bureau of Reclamation.
A local initiative called the Lower Gunnison Project tries to take advantage of salinity-control funds and leverage them with other funding sources to make projects go further, Kanzer said. That project’s goals are wide-ranging, from reducing salt and selenium loading in the Gunnison River, to pursuing more efficient delivery and on-farm application of irrigation water, to improving soil health and boosting agricultural productivity…
WETLANDS MITIGATION
Canal-lining projects also can have wetlands projects associated with them. Where wetland habitat is destroyed as a result of the work, it has to be replaced elsewhere, Harris said. In the case of the Grand Valley Water Users Association project, crews will be creating new wetlands at the Colorado River Island State Wildlife Area south of D Road. Harris said the project will involve some 1,500 plantings and will result in creation of habitat far superior to what is being replaced…
The Grand Valley Water Users Association’s canal project is occurring as the association also is in the middle of work to replace electrical and operating equipment at the Grand Valley Diversion Dam, the roller dam in De Beque Canyon. Harris said such projects “all kind of fit together” in improving water delivery in the Grand Valley, but are expensive. It’s hard for the association to pay for something like the current lining project internally through assessments, he said.
Bicycling the Colorado National Monument, Grand Valley in the distance via Colorado.com
The Government Highline Canal, in Palisade. The Government Highline Canal near Grand Junction. The Grand Valley Water Users Association, which operates the canal, has been experimenting with a program that pays water users to fallow fields and reduce their consumptive use of water. Photo: Brent Gardner-Smith/Aspen Journalism
The Grand River Diversion Dam, also known as the “Roller Dam”, was built in 1913 to divert water from the Colorado River to the Government Highline Canal, which farmers use to irrigate their lands in the Grand Valley. Photo credit: Bethany Blitz/Aspen Journalism
These are hills of exposed Mancos shale in Delta County. Selenium is a natural element found in the soil type that is common in the Uncompahgre and Grand valleys. Photo credit: Natalie Keltner-McNeil/Aspen Journalism
Delta County farmer Paul Kehmeier stands atop a diversion structure that was built as part of a project to improve irrigation infrastructure completed between 2014 and 2019. Kehmeier served as manager for the ditch-improvement project, which was 90% funded by the Bureau of Reclamation and serves 10 Delta County farms with water diverted from Surface Creek, a tributary of the Gunnison River. Lining and piping ditches, the primary methods used to prevent salt and selenium from leaching into the water supply, are critical to the protection of endangered fish in the Gunnison and Colorado river basins. Photo credit: Natalie Keltner-McNeil/Aspen Journalism
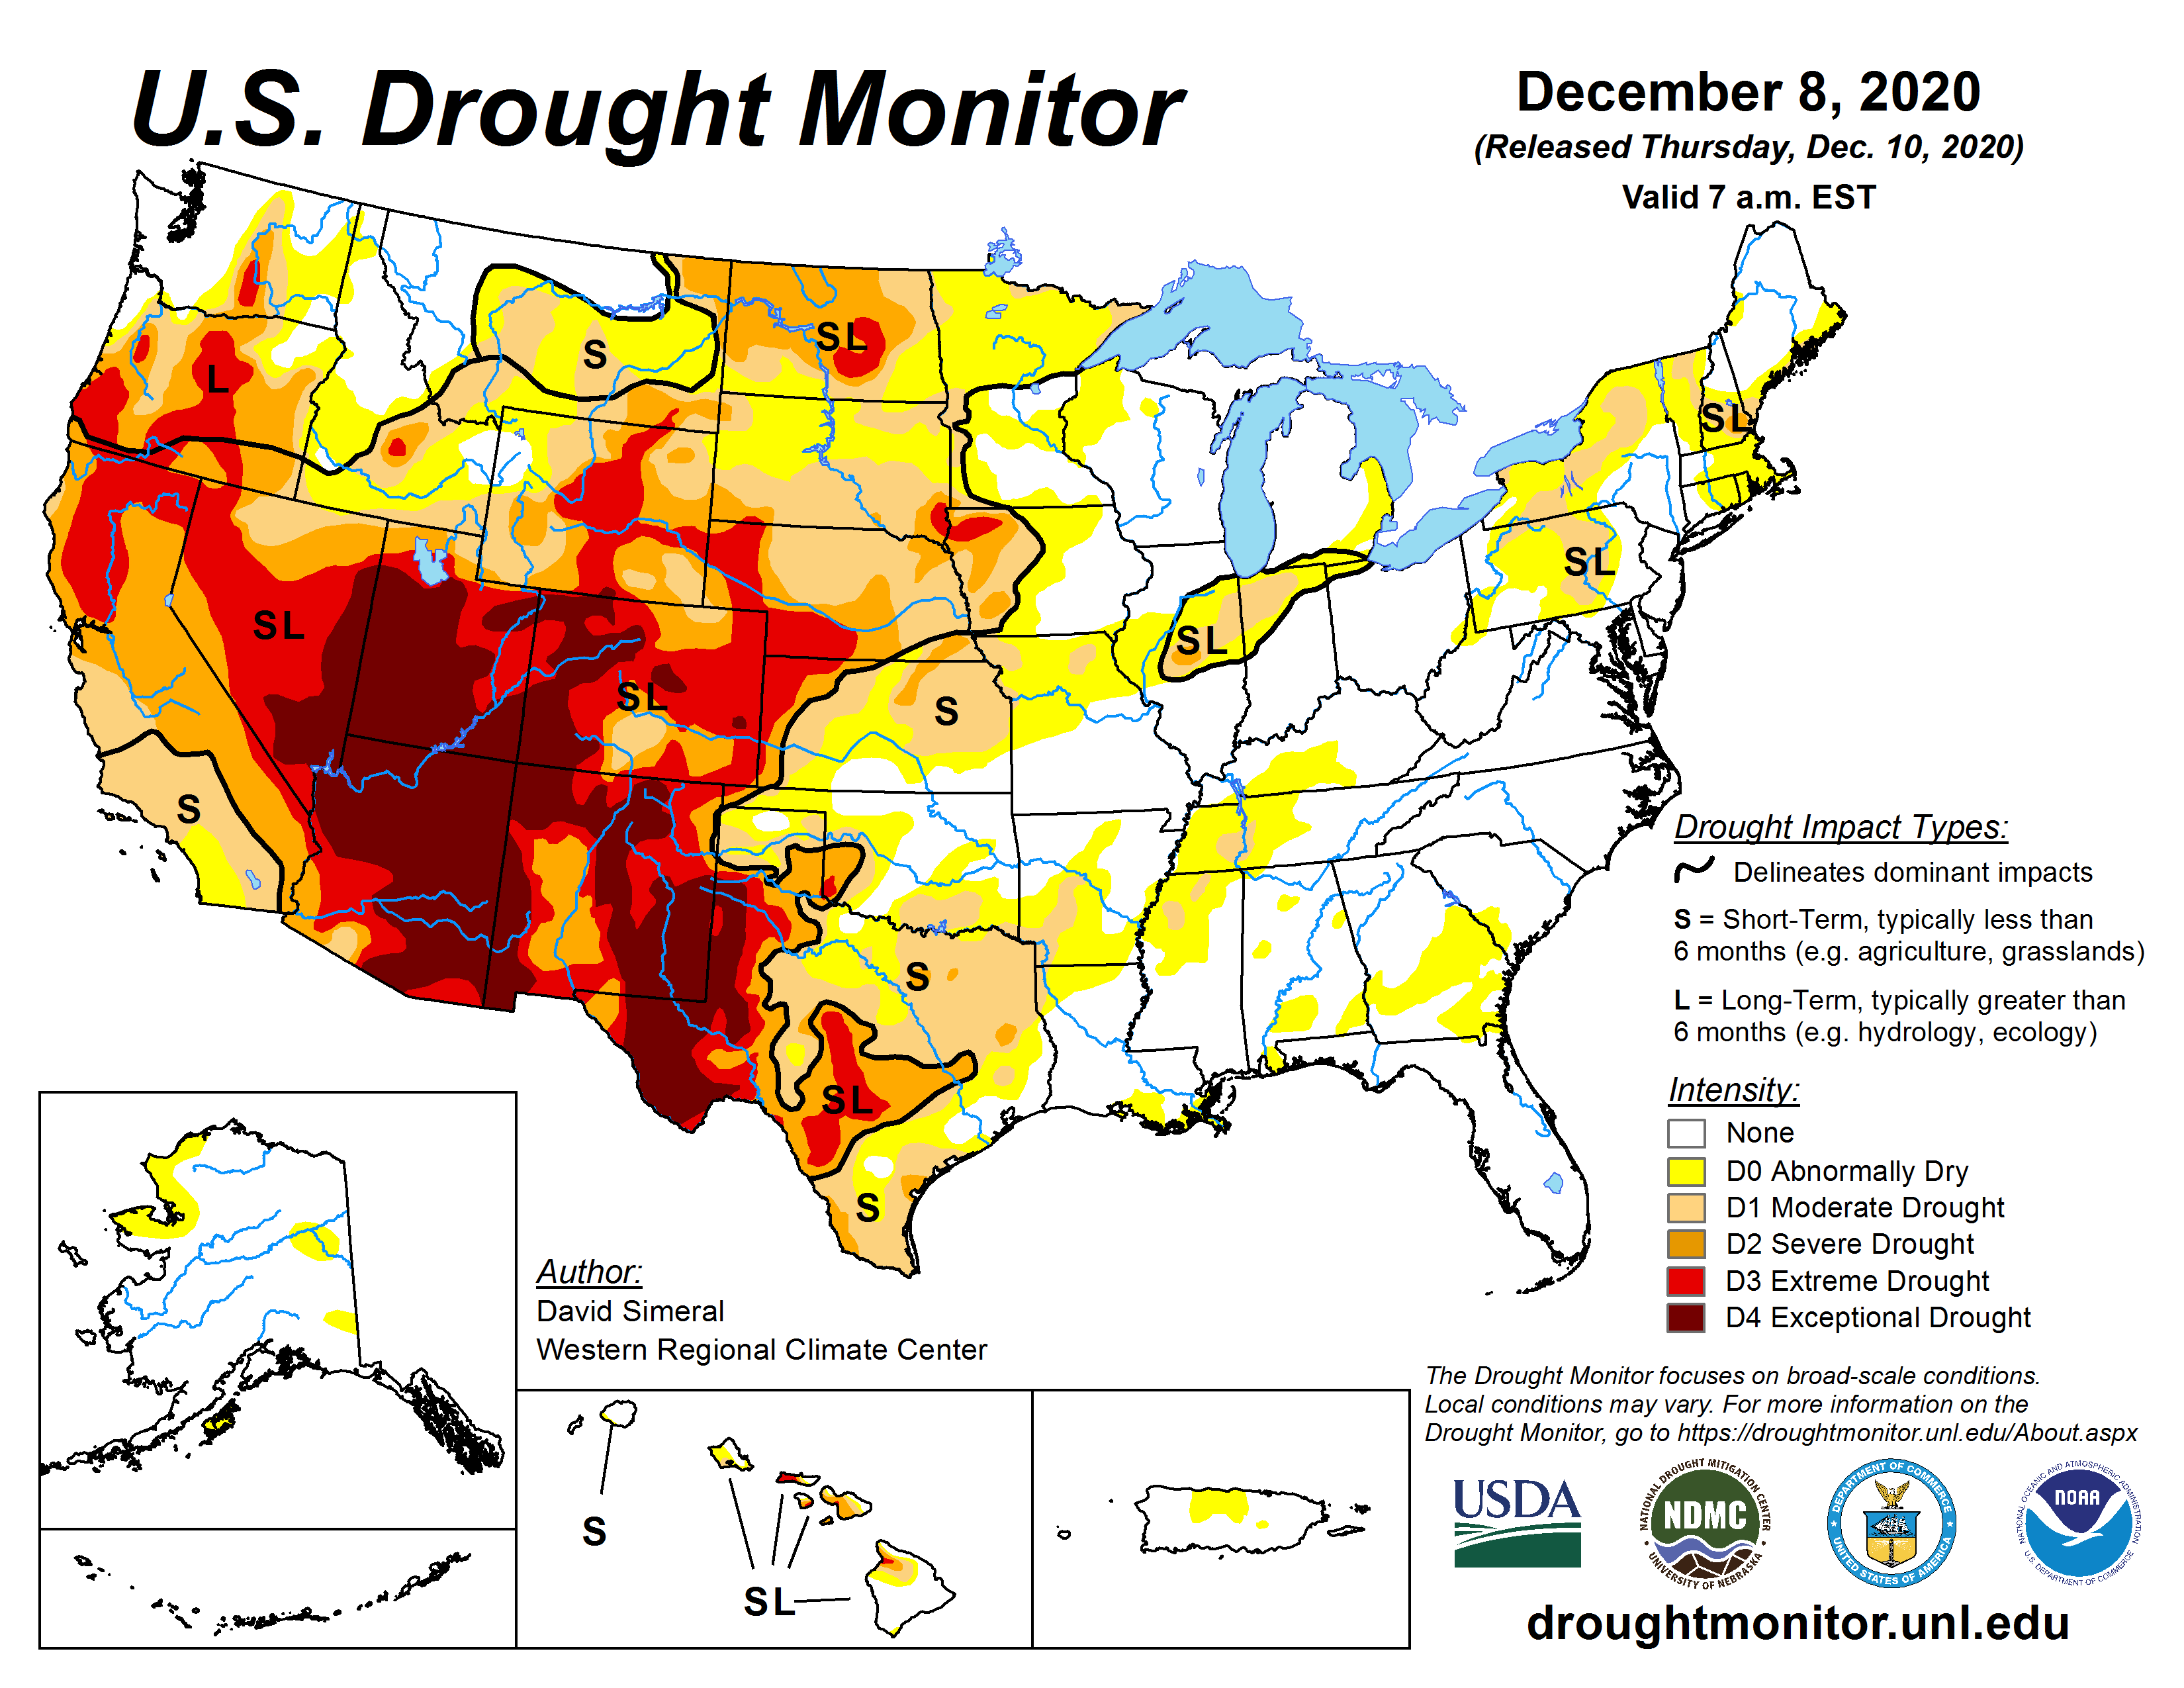
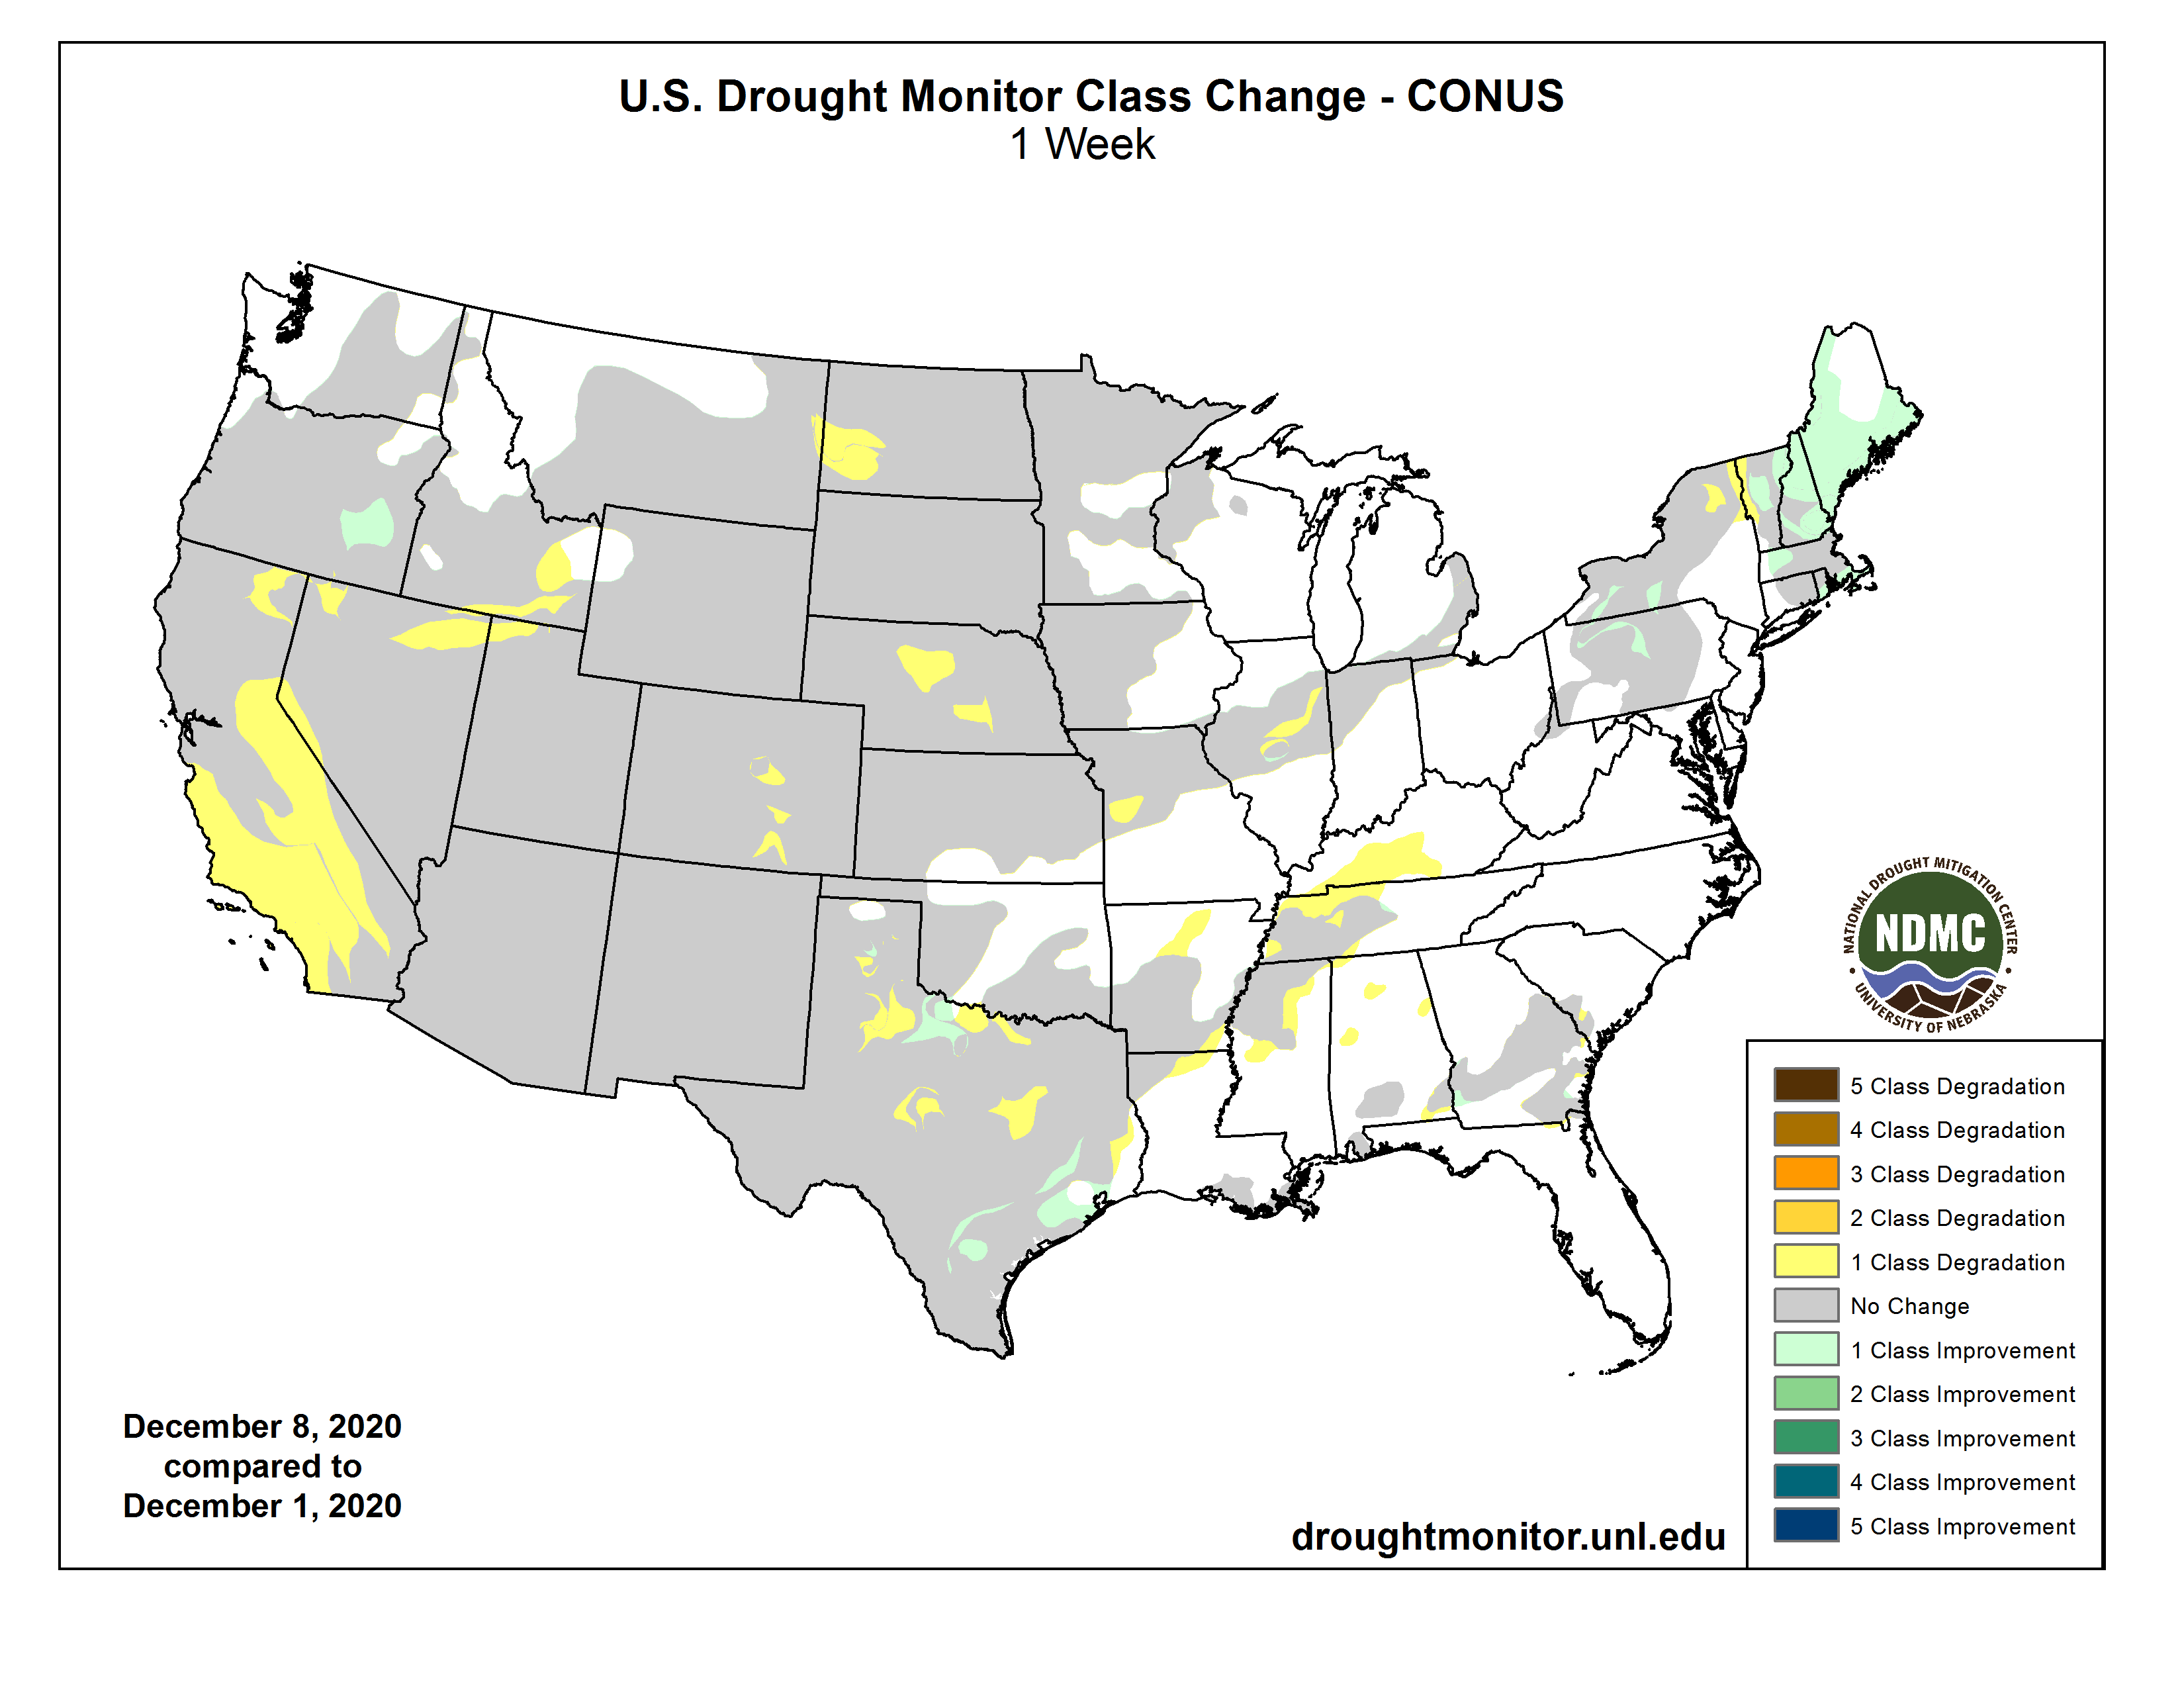
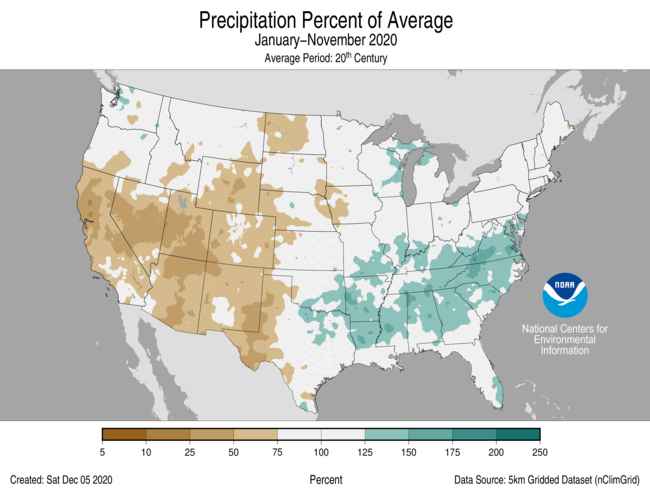
A drought that flared up in the western United States in spring 2020 has expanded and intensified across the summer and fall. In August, a third of the United States was experiencing at least a moderate level of drought. By December, roughly half of that area was, with about 33 percent facing what the U.S. National Drought Monitor classifies as “extreme” or “exceptional drought.” Initially, Colorado, Utah, Nevada, and northern California faced the most severe conditions. Over the summer and fall, the drought intensified in Arizona and New Mexico and spread onto the Great Plains and Texas.
The map above, built with data from the Drought Monitor, depicts areas of drought in progressive shades of orange to red on December 8, 2020. It is based on measurements of climate, soil, and water conditions from more than 350 federal, state, and local observers around the country. NASA provides experimental measurements and models to this drought monitoring effort.
“Compared to late 2019 and early 2020, when there was very little drought in the continental United States, this is quite an extreme single-year event that developed rapidly over the course of 2020,” said Benjamin Cook, a climate scientist at NASA’s Goddard Institute for Space Studies. “But if you look over longer time scales, I would argue this is really a continuation of a multi-decadal event that began around 2000. There have been some breaks, but the Southwest has been in more-or-less continuous drought conditions since then.”
The consequences of the unusually dry and warm temperatures in 2020 have shown up in a variety of ways. Several states, particularly California, have endured unusually active and destructive fire seasons. Some farmers have already seen—or anticipate—poor yields as they struggle with a lack of water for crops and livestock. Reservoirs, lakes, and streams in several areas are reaching unusually low levels.
This map depicts shallow groundwater storage in the continental U.S. as of December 7, 2020, as measured by the Gravity Recovery and Climate Experiment Follow On (GRACE-FO) satellites. The colors depict the wetness percentile; that is, how the levels of groundwater compare to long-term records for the month. Blue areas have more abundant water than usual, and orange and red areas have less. The darkest reds represent dry conditions that should occur only 2 percent of the time (about once every 50 years).
“The Southwest monsoon was underwhelming this year, and many places in that region rely on that precipitation as part of their water budgets,”” said Christopher Hain, a research meteorologist at NASA’s Marshall Space Flight Center. “Given the La Niña happening now, there is a higher-than-normal chance that winter rains will not help much and below-average precipitation will further exacerbate the drought. That could set the stage for even worse conditions next spring, summer, and fall.”
La Niña—cooler than normal sea-surface temperatures in the central and eastern tropical Pacific Ocean—tends to cause dry weather in the Southwest U.S. The associated weather patterns push the jet stream north and cause it to curve, driving storms to the Pacific Northwest and the Great Plains instead.
“The long-term, multi-decadal drought is largely driven by precipitation deficits connected to persistently cold sea surface temperatures in the eastern tropical Pacific—in essence a string of years with long-lasting and intense La Niñas,” said Cook. “However, there is strong evidence from climate models and centuries of tree ring data that suggest about one-third to one-half of the severity of the current drought can be attributed to climate change.”
NASA Earth Observatory images by Lauren Dauphin, using GRACE data from the National Drought Mitigation Center and data from the United States Drought Monitor at the University of Nebraska-Lincoln. Story by Adam Voiland.
Temperatures records show winter warming across Colorado in the last 50 years. So why not in Denver, too?
Last week it got to 19 below in Fraser, the Colorado town located northwest of Denver in the valley of the same name. The temperature provoked quite a lot of local talk. How things have changed.
The town, adjacent to Winter Park but the elder in incorporation by 25 years, has a storied tradition of deep cold. In the 1960s, it was often reported by morning radio stations—this was before TV really got into the game of morning broadcasts—as having the deepest overnight cold in the nation. (Other places that stood out in my memory: Truckee, Calif., and International Falls, Minn., and less often, Alamosa, Colo.).
Denver KOA’s Weatherman Bowman—there were no women at the microphones in those days—called it the icebox of the nation.
Those temperatures were the result of the steadfast devotion of a couple, Ron and Edna Tucker. They took turns getting up every two hours in order to get an accurate record of the deep freeze. After he died, she kept it up for awhile, then tried to delegate to somebody else. She was also the town’s postmaster. But sometime in the 70s this tedious, detailed record of deep cold lapsed. Since then, it’s been an anecdotal record.
Kirk Klanke arrived in Fraser in 1971, after playing football for the state college in Pueblo.
The difference between now and then?
“Considerable,” he answered. It was 19 below the other night, he reported, which was enough to spark comment. In the 1970s, it would have been typical. “On a clear night it was 25 to 40 below and it sometimes got to 50 below. Even 40 below was memorable. Your car had flat tires from the cold, and they didn’t thaw until you had driven for a little bit.”
“That,” he added, “hasn’t happened in a long time.”
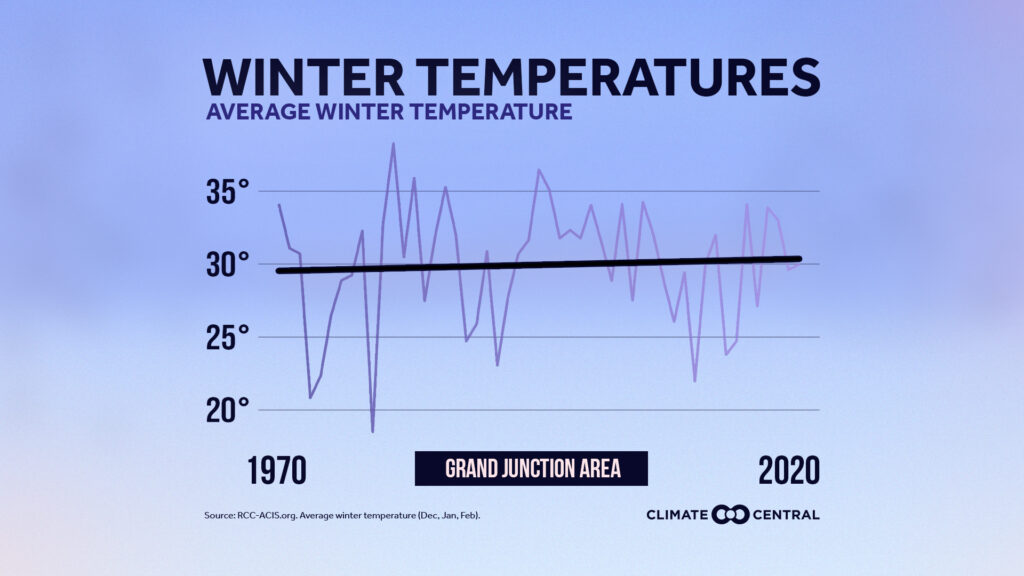
If Fraser were large enough to have had a continuous record, it might have been teased out by Climate Central in that organization’s recent report about the change in winter temperatures across the nation. All but 6 of the 242 sites for which it pulled weather records showed warming in the last 50 years.
Colorado Springs has increased 2 degrees on average, and Grand Junction 1.5 degrees.
Albuquerque rose 3.2 degrees, Casper warmed 1.5 degrees, and Salt Lake City 1.9 degrees.
Denver? No, not much.
Becky Bolinger, the assistant state climatologist in Colorado, studied the Climate Central work and found that the same recording station at Stapleton (an airport until 1995, then gradually a residential neighborhood now called Central Park Denver) was used for the study. She ran the numbers herself and came to the same conclusion: a very, very small trend downward. Why?
“I would say that major land surface changes have been happening over the past 50 years that could be impacting measurements,” she said when posed with this conundrum by Big Pivots.
Becky Bolinger. Photo credit: Colorado State University
What caught her eye was the apparent decrease in variability.
“The peaks and minimums are not as extreme in the latter part of the chart as it was earlier,” she said.
“My speculation is that the land surface changes (airport until mid-1990s, then suburban in the 21st century) has acted to regulate the winter temperatures a little bit more and reduced the extreme warm and cold winters.”
Climate Central meteorologist Sean Sublette says the precise warming levels vary, but the broader picture is clear across the United States. Most prominent was the heating in the Great Lakes states and the Northeast.
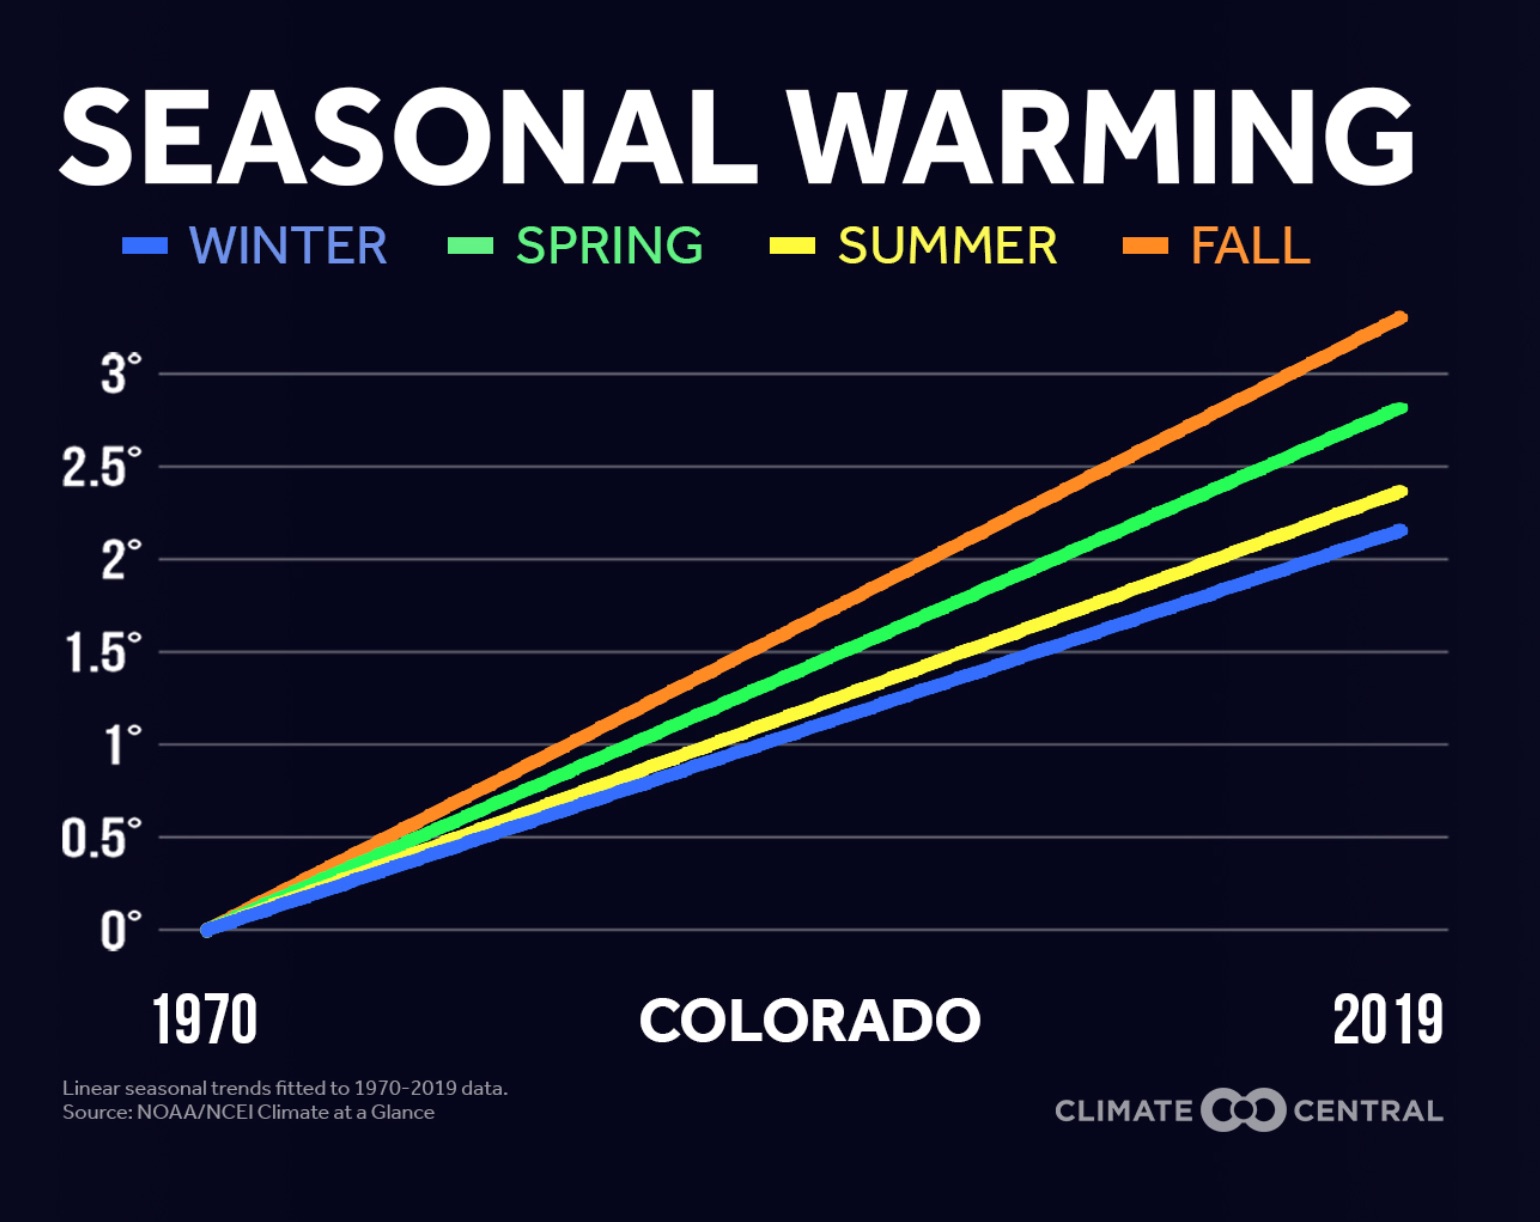
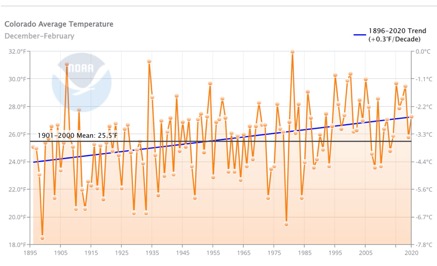
But Colorado has clearly warmed altogether, even if the evidence from the state’s largest city is wobbly. Running a chart for Colorado altogether using data from the National Oceanic and Atmosphere Administration’s Climate at a Glance tool, he produced a chart (previous page) from 1895 forward that shows (see blue line) a clear warming trend across Colorado.
Like Bolinger, he points out the lesser variability of recent decades. “The big variations start to go away in the last 30 to 50 years,” he observed.
Climate Central illustrates how a small change in average can produce a big change with this bell curve animation.
There’s been a national trend for more rain in lieu of snow. This has been true even of Denver, according to a 2016 running of the numbers.
At the State Climatologist’s office in Fort Collins, Bolinger says she is not surprised to see some areas of Colorado with little-to-no warming trend during winter.
“Other areas of the country have seen much more pronounced warming in the winter months. For Colorado (and specifically Denver County), more pronounced warming trends are occurring in the summer and fall months.”
What can be said about Colorado’s higher country? Not all that much, because the long-term temperature records are so scant. But in a general way, climatologists know that those places that are coldest tend to warm at a more rapid rate than those are already warm, says Sublette.
“Alaska is warming twice as fast as the rest of the world because it’s so much colder than the rest of the world.”
It stands to reason, he went on to say, that Colorado’s ski resorts are warming more rapidly than, say, the Front Range urban corridor.
“As a general rule, the colder places and higher elevations are going to be warming a little faster than the lower elevations,” he said, but added: “There are always going to be variations.”
In Fraser, you can still see block heaters used to warm engines on cold nights. That wasn’t enough for Kirk Klanke when he was in the construction business. Getting started in the morning was an ordeal. It wasn’t enough to put a block heater on a pickup or car. The oil would freeze. That means steel-on-steel for the first few minutes of operating a vehicle. “You can wear out a motor pretty quickly that way,” he points out.
Instead, he used a 10-inch culvert under the pickup through which he used a weed burner to blow heat and warm the drive train.
Last winter it got to 25 below, he says, but that was the coldest it has been in several years.
If formal records have not been continuous, the evidence of warming became profound in the early part of this century with the bark beetle epidemic. Before, points out Klanke, forests lost about 10% of trees during a bark-beetle epidemic. The deep, cold winters kept the beetles in check. But in the early 21st century, with the warm winters, the beetle populations exploded.
Just to the west of Fraser, in the Williams Fork Valley, where the northern Colorado’s bark beetle epidemic first flared in 1996, a fire this year burned 15,000 acres.
(This writer can personally testify to some of that cold. In January 1979, he arose one morning when living in Kremmling to a temperature of 62 below zero on the thermometer of Bob Shay’s Phillips 66. A Colorado record was set that morning, but elsewhere in Colorado).
Council approved the recommended increase of 2.5% in water and 2% in sewer utility charges. For a single family residence, the average monthly water service charge is projected to increase by $1.35, and the average monthly sewer charge is projected to increase by 42 cents.
Service charge increases are necessary to continue funding operations, a council ordinance said.
“Compared to other cities, Broomfield still ranks in the bottom third in terms of rates charged for water services and in the middle for sewer services,” Chief Financial Officer Brenda Richey told Council Thursday. “The proposed rates have been recommended to incrementally increase over the years, based on a 2012 utility rate study that takes into account Broomfield’s future needs as well.”
Because the existing brine injection well is nearing the end of its useful life, the Bureau of Reclamation investigated alternatives for disposing of the brine. Reclamation has prepared and released a Final Environmental Impact Statement. The FEIS review period is from December 11, 2020 to January 11, 2021. Alternatives analyzed in the FEIS include a new injection well, evaporation ponds, zero liquid discharge technology, and no action.
After weighing the benefits and impacts of the alternatives analyzed in the FEIS, the Bureau of Reclamation has identified the no action alternative as the preferred alternative.
The no action alternative achieves the best balance among the various goals and objectives outlined in the FEIS, including: optimizing costs; minimizing adverse effects on the affected environment; minimizing the use of nonrenewable resources; consistency with Bureau of Land Management Resource Management Plans; and being in the best interest of the public, including considerations of health and safety.
The Paradox Valley Unit injection well will continue to operate until it becomes infeasible. New technically, environmentally and economically viable alternatives may be investigated in the future to continue salinity control at Paradox Valley.
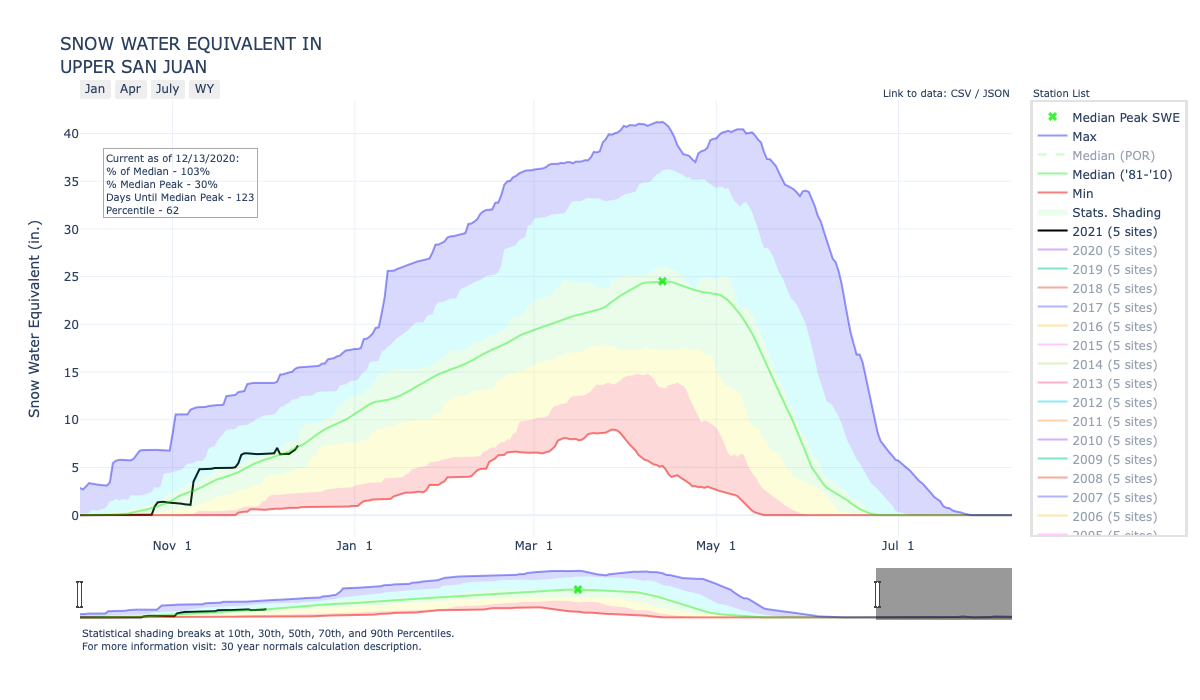
According to the U.S. Department of Agriculture National Water and Climate Center’s snow pack report, the Wolf Creek summit, at 11,000 feet of elevation, had 11 inches of snow water equivalent as of 8:30 a.m. on Dec. 9.
That amount is 115 percent of the Dec. 9 median for the site.
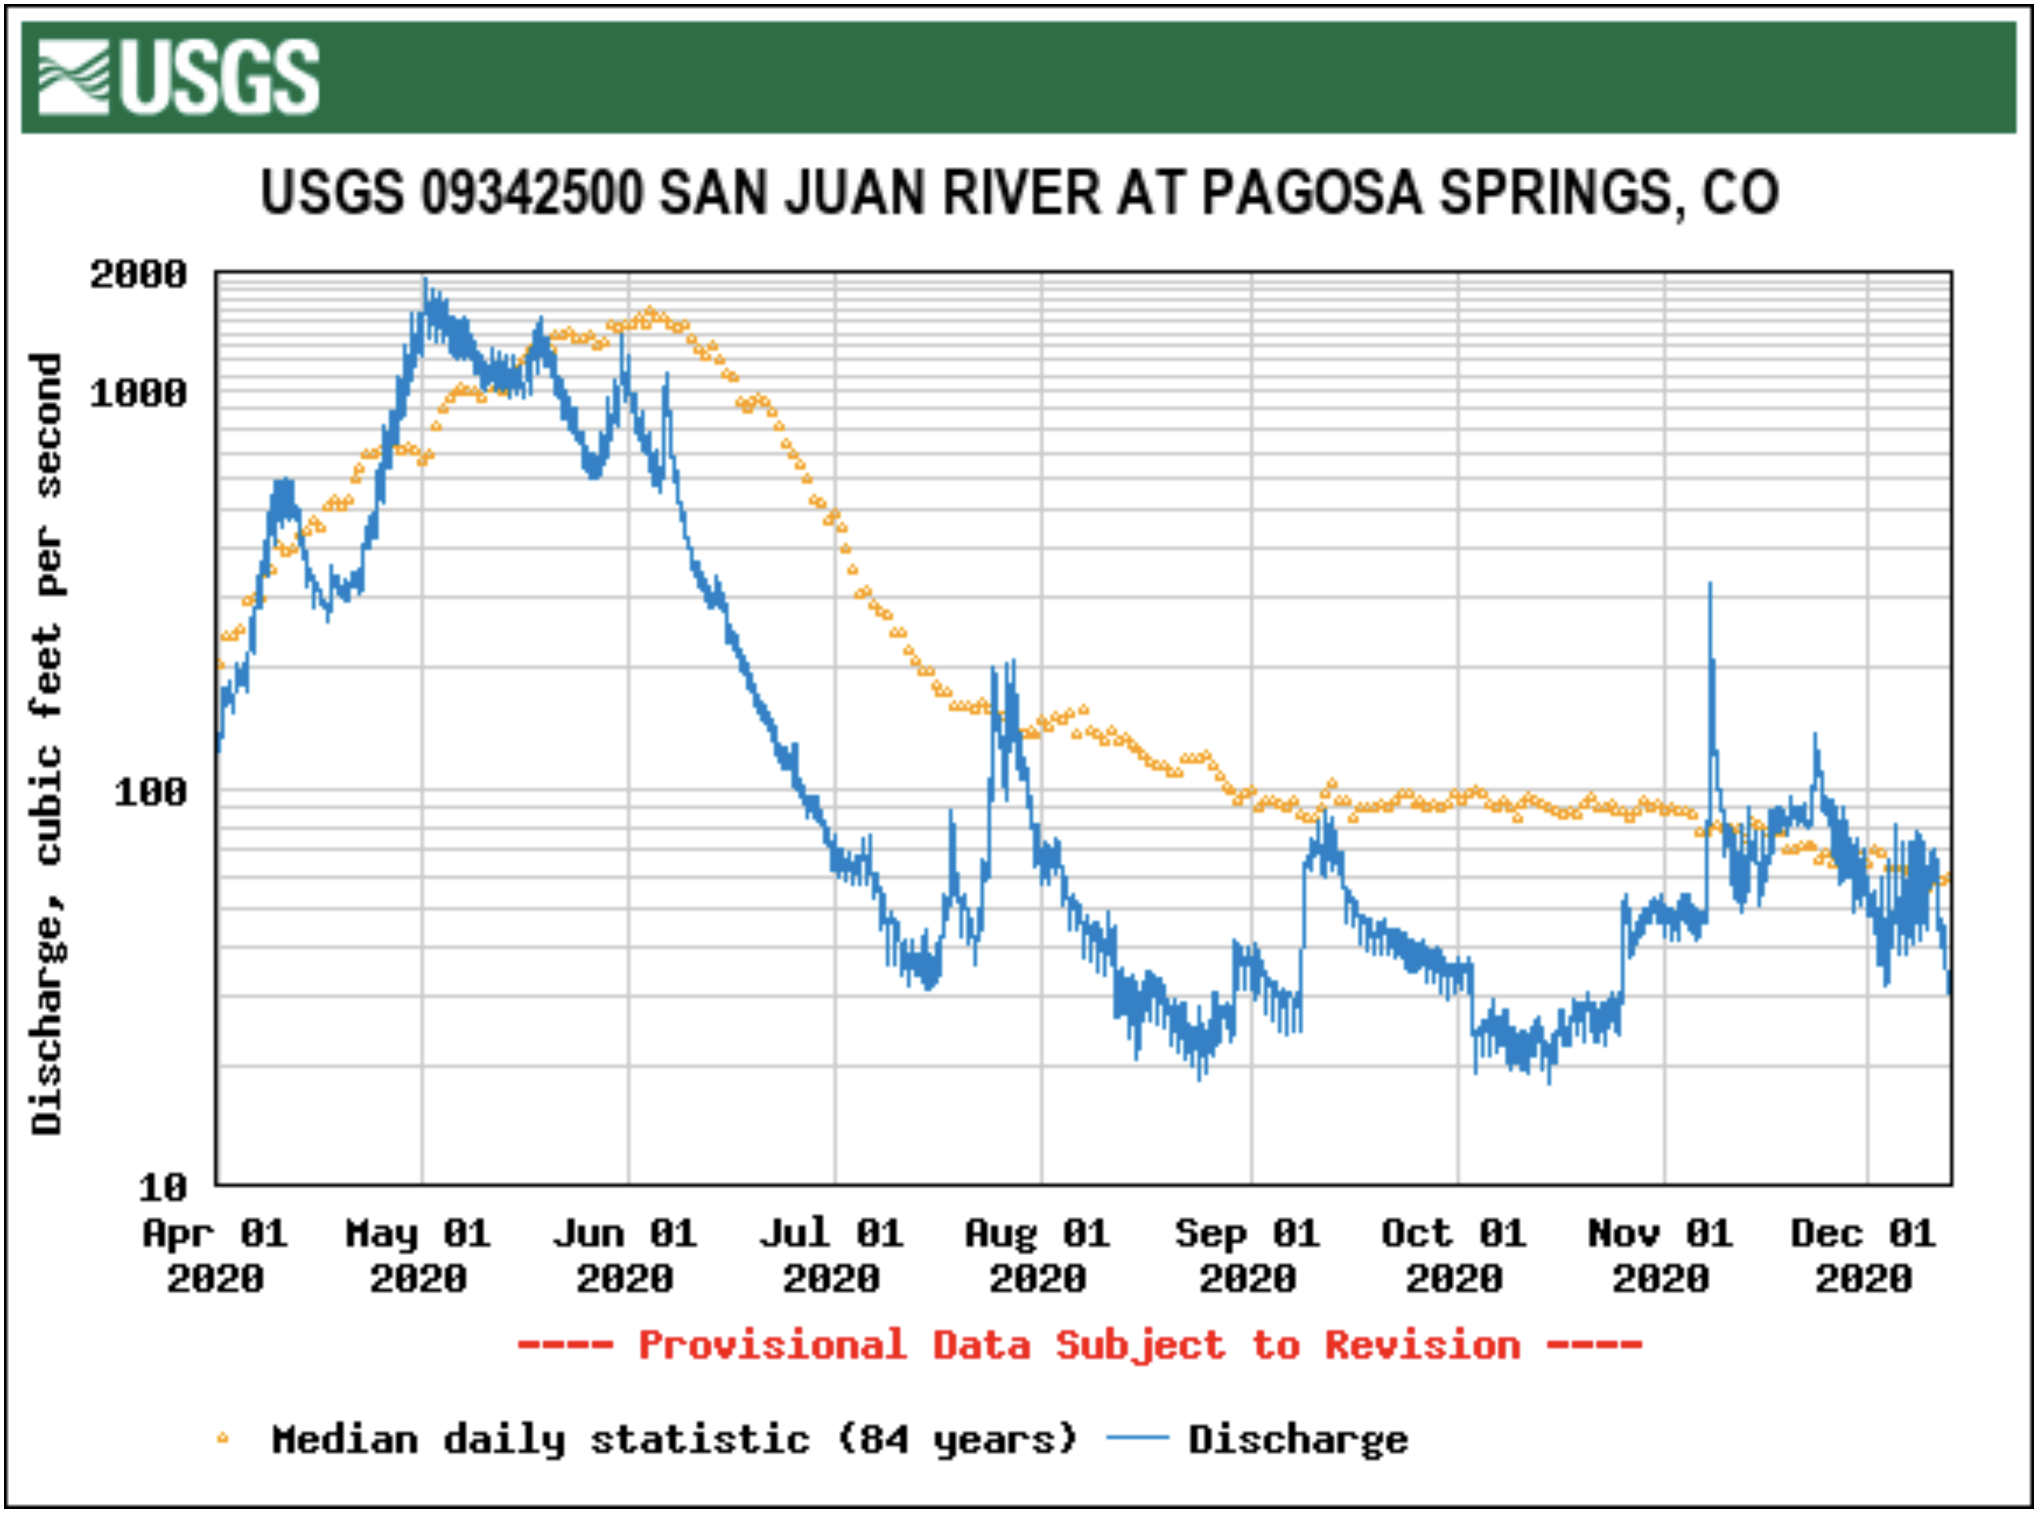
River report
According to the U.S. Geological Survey, the San Juan River was flowing at a rate of 43.5 cfs in Pagosa Springs as of 8:30 a.m. on Wednes- day, Dec. 9.
The maximum flow rate for Pagosa Springs for that date, based on 85 years of records was recorded in 2008 at 240 cfs, and the mini- mum for that date was recorded in 1957 at 14 cfs.
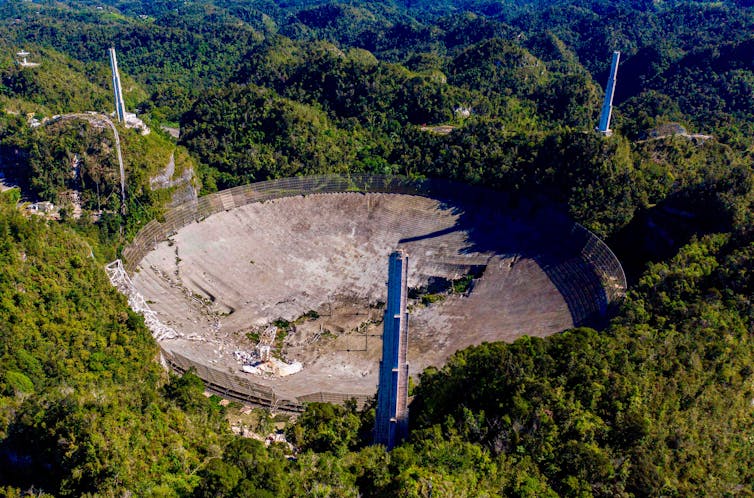
While drone footage captured the moment in excruciating detail, in truth, the disintegration of the telescope in Arecibo, Puerto Rico began far before this cinematic end.
It is tempting to blame the demise of Arecibo on the physical damage it sustained earlier in 2020, when an auxiliary metal cable snapped – perhaps a delayed consequence of Tropical Storm Isaias or the earthquakes that shook Puerto Rico. But Arecibo’s downfall was, in reality, caused by years of financial struggles.
But for all its achievements, U.S. commitment to Arecibo began to falter in 2006. The National Science Foundation, which supported Arecibo, implemented a 15% budget cut that year across its Division of Astronomical Sciences. Arecibo was among the first facilities on the chopping block, despite its continued productivity.
The previous year, the NSF had announced it was preparing to reallocate funds between existing facilities in order to initiate “new activities.” These initiatives included the funding and development of the Atacama Large Millimeter Array in Chile, starting in 2003.
But in 2007 Arecibo’s budget was slashed from US$10.5 to $8 million. With a second major cut scheduled for four years later, the closure of the facility seemed imminent. Instead, the NSF tasked a new consortium to take over the management of Arecibo in 2011, changing it from a federally funded institution to one that could seek funds from other sources.
#WhatAreciboMeansToMe, a hashtag on Twitter, has collected hundreds of stories from locals and tourists, astronomers and enthusiasts alike. Puerto Rican voices are loud here, many recounting childhood memories of hiking up the trail to the Ángel Ramos Visitors’ Center.
The Arecibo Observatory occupied a space of pride for Puerto Rican scientists and the local community. In many ways, it was a symbol of the island. Through this lens, to watch the Arecibo Observatory be allowed to collapse and become rubble is painful for many, especially when contrasted with defunct observatories in the continental United States, where a number are preserved as historical sites.
In Latin America, infrastructure projects are often tied to ideas about economic development – a potential answer to solve a country’s ills. In this context, to watch a prized facility literally crumble, as the United States retracted its financial involvement, seems like nothing less than abandonment.
It is interesting to note that controversy has often followed the construction of large astronomy facilities. From the Maunakea Observatories being built on land sacred to native Hawaiians to labor disputes in the building of the Atacama Large Millimeter Array in Chile, to the seizing of lands and racial tensions surrounding the Square Kilometer Array in the Karoo region of South Africa, a pattern emerges of Northern scientific institutions investing in regions with long colonial histories – and stirring up local concern and discontent.
In the case of Arecibo, these disputes flared at the end rather than at the beginning. But a similar lack of interest in how scientific research facilities fit the place they inhabit is clear. In my view, it is time to begin discussions beyond the scientific importance of research facilities. Planners must address their full life cycles and their impact on local communities.
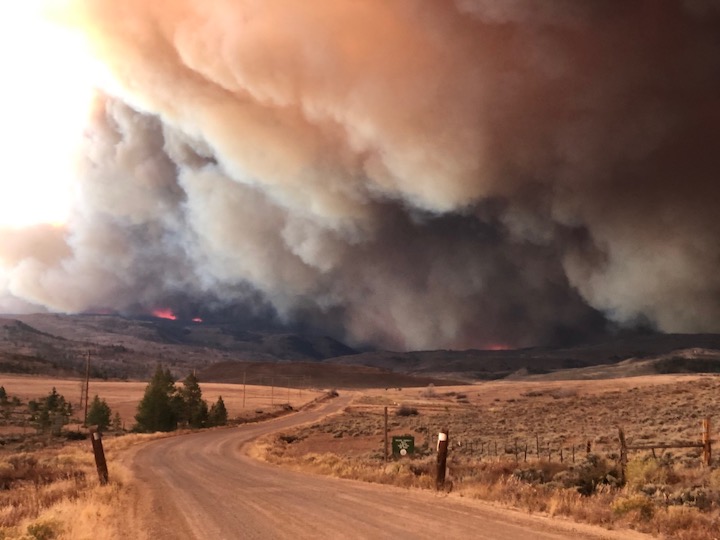
Firefighters on the march: The Pine Gulch Fire, smoke of which shown here, was started by alighting strike on July 31, 2020, approximately 18 miles north of Grand Junction, Colorado. According to InciWeb, as of August 27 2020, the Pine Gulch Fire became the largest wildfire in Colorado State history, surpassing Hayman Fire that burned near Colorado Springs in the summer of 2002. Photo credit: Bureau of Land Mangement-Colorado, via InciWeb and National Interagency Fire Center.
We talk about it a lot: Across the Southwest, human-caused warming is changing the way that water falls as snow or rain, creating uncertainty around the regional water supplies we rely on.
Yet precipitation tells only one part of the story. Climate scientists expect another less-discussed variable to increase the risks of wildfires and droughts in Nevada and California over the coming decades. That variable is known as “evaporative demand,” and it’s effectively a measure of how thirsty the atmosphere is — the extent to which the atmosphere is trying to evaporate water.
“We saw this steady increase in evaporative demand through the end of the century,” said Dan McEvoy, a researcher with the Desert Research Institute and Western Regional Climate Center.
What McEvoy and the paper’s co-authors found was that greater seasonal evaporative demand — a roughly 13 to 18 percent increase by the end of the century — could dry out the landscape, creating conditions that are likely to increase the danger of intense fire and multiyear droughts.
Recent fires have already been linked to extreme days of evaporative demand. Those extreme days are expected to increase, the paper found, and that could result in more wildfire danger.
McEvoy said the results showed “steadily increasing extreme days.” By the late century, from 2070 to 2099, the paper forecasted a four to ten-fold increase in the number of extreme days.
The paper, published in Earth’s Future last month, helps to fill in a gap around predicting the effects of climate change across the state. Drought involves both precipitation trends and evaporative demand. But as the state’s newly released climate strategy explains, there remains a degree of uncertainty around how climate change will affect precipitation. That’s not the case when it comes to evaporative demand, which has risen in Nevada over the past four decades.
Julie Kalansky, a co-author of the paper and a researcher based out of the Scripps Institution of Oceanography at the University of California, San Diego, said both variables must be weighed.
“When you think about drought just as the lack of precipitation — and without the evaporative demand — you are missing a relatively large piece of the puzzle,” Kalansky said in an interview.
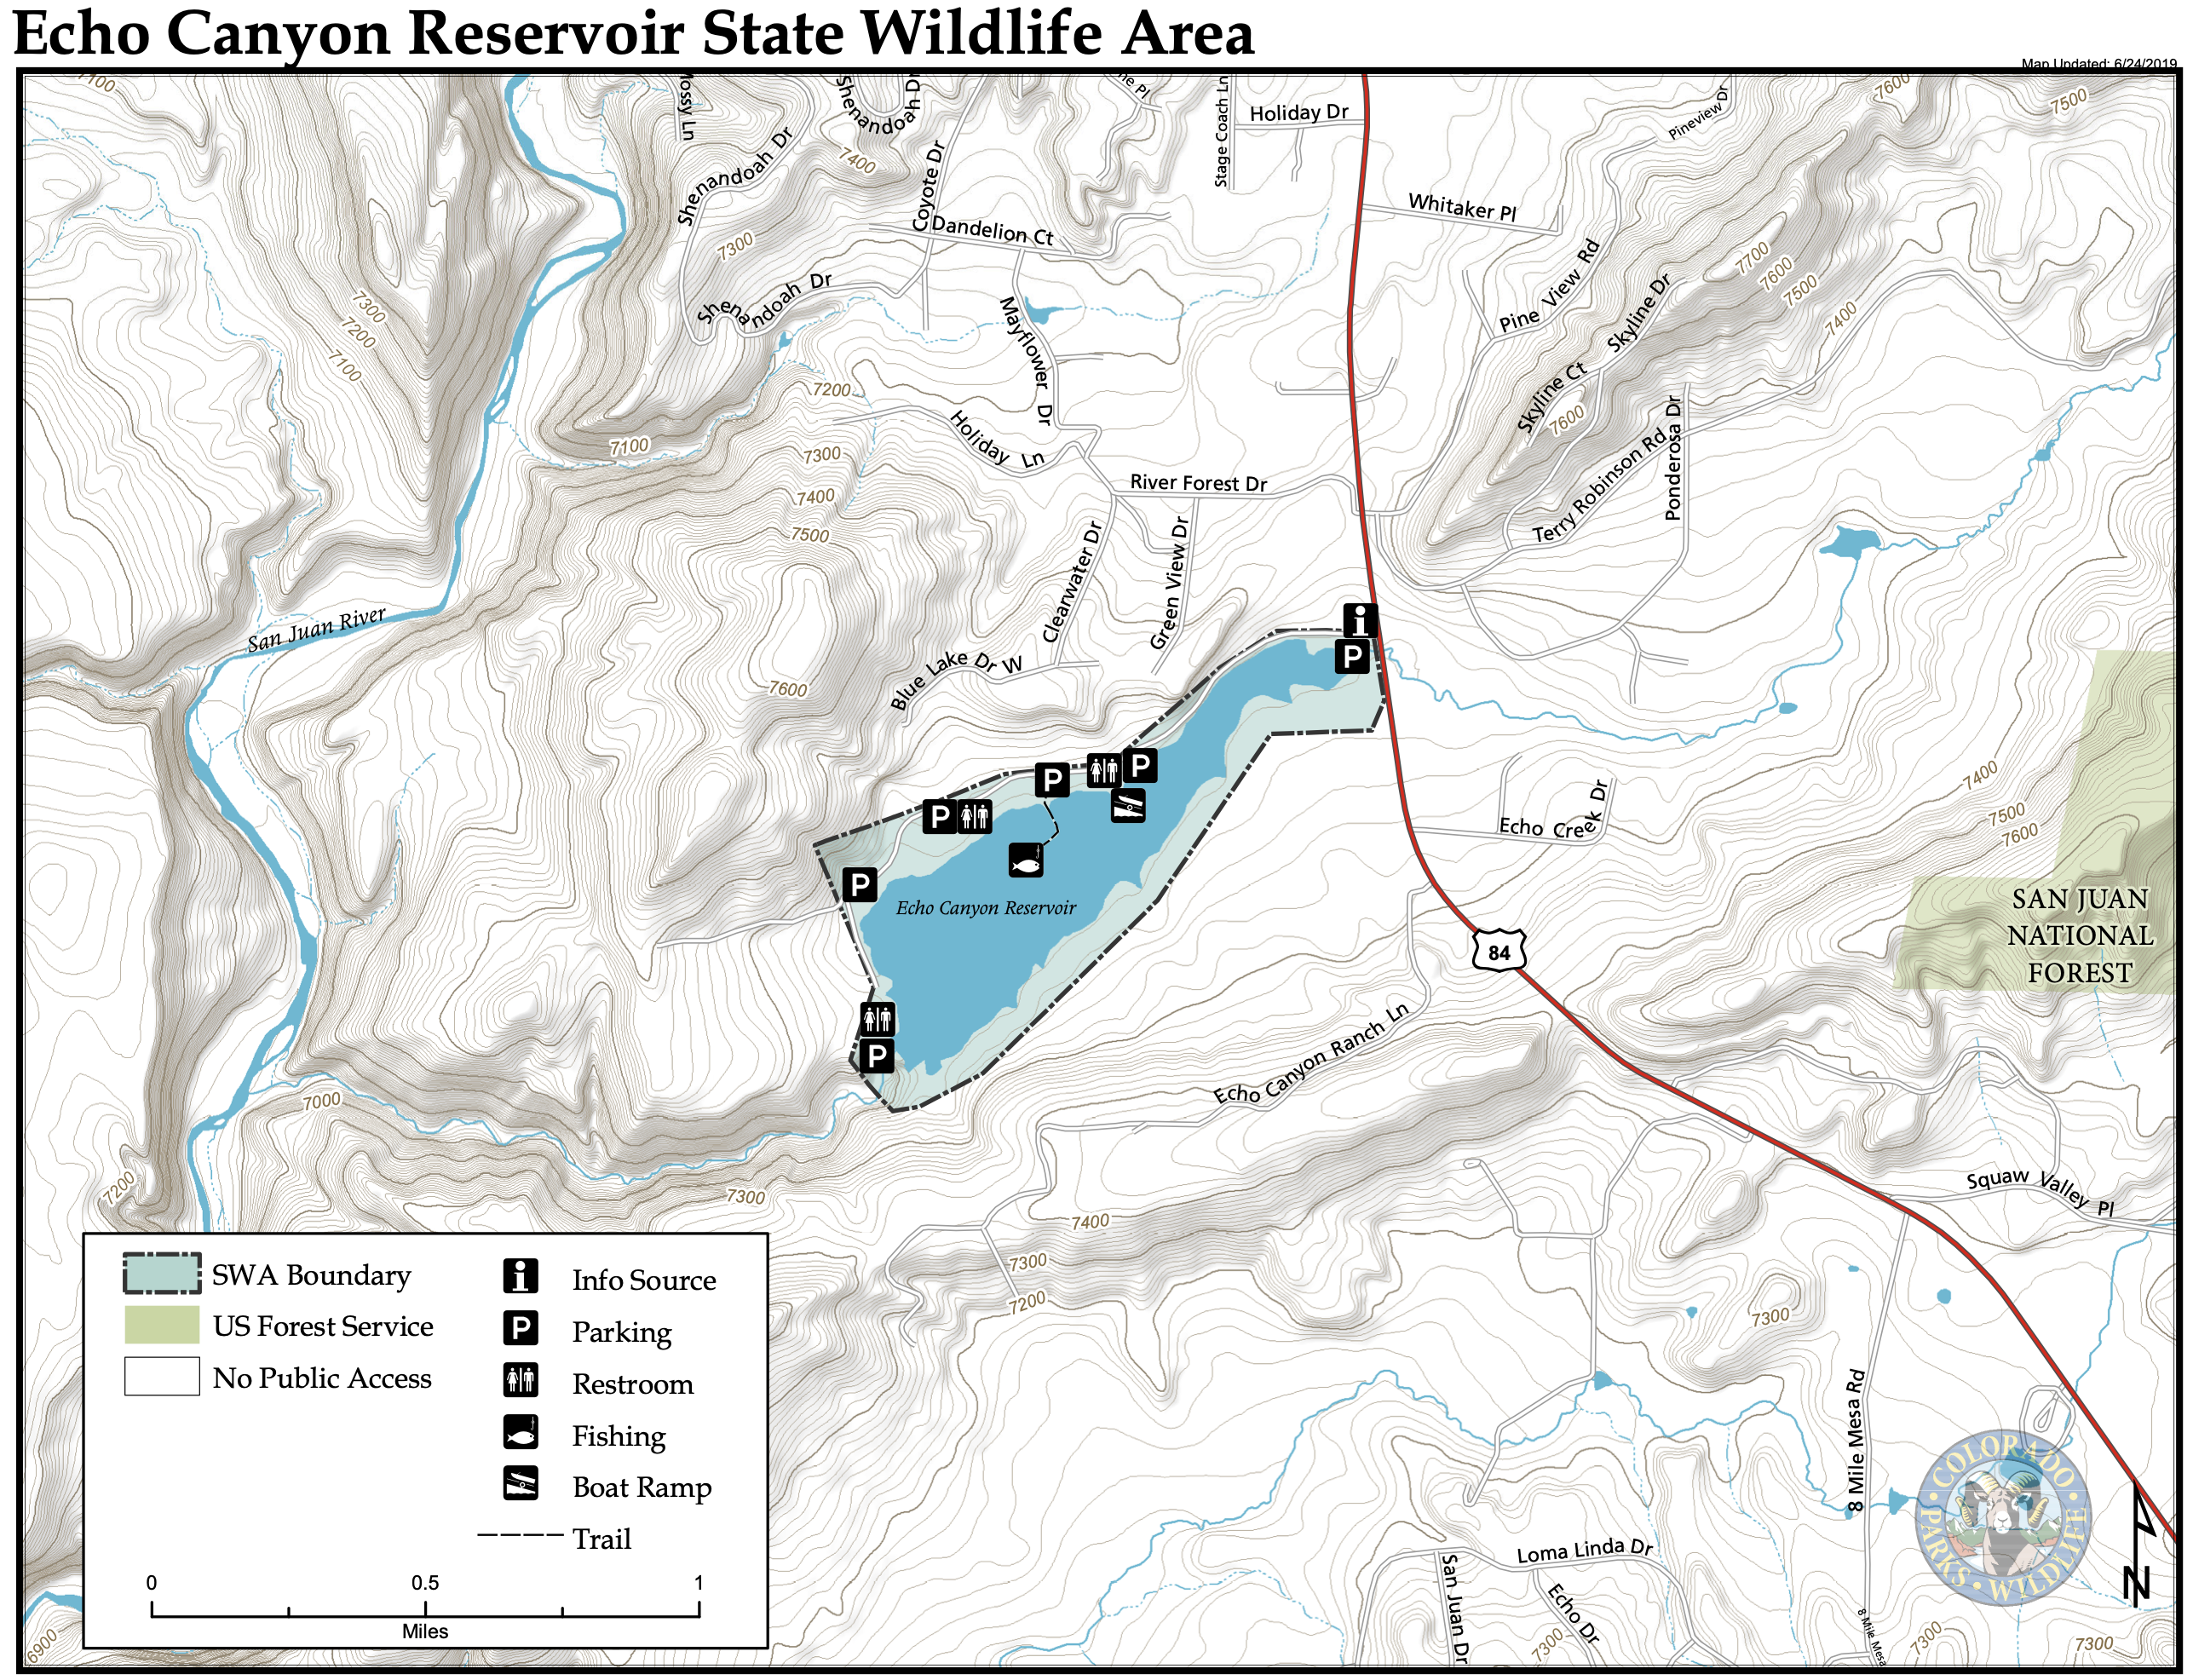
CPW Southwest Region Public Information Officer Joe Lewandowski informed The SUN that during a routine inspection of the dam in late October, “A crack in the earthen dam at Echo Reservoir was discovered.”
He explained that CPW’s dam safety engineers worked with Division of Water Resources (DWR) dam safety engineers to control the water level drawdown, and have filled and covered the crack.
According to Lewandowski, dam safety engineers will continue to monitor the embankment over winter. Though the crack has been reported to be stable, CPW is working with DWR to determine future measures that would ensure the integrity of the dam embankment.
“That process will take several months and there is no timeline,” Lewandowski stated.
The dam at Windy Gap Reservoir. The dam that forms Windy Gap Reservoir on the Colorado River, just below its confluence with the Fraser River in Grand County. A project to build a connectivity channel for the Colorado River is included in the River District’s fiscal implementation plan and could be on the short list for funding through the organization’s new Partnership Project Funding Program. Photo: Brent Gardner-Smith/Aspen Journalism
Colorado River Water Conservation District officials have laid out a framework for how they will spend their new tax revenue with an emphasis on equity across water sectors and gaining the support of local government.
At a Dec. 3 board meeting, River District General Manager Andy Mueller presented a framework for the organization’s new Partnership Project Funding Program, which creates a system for how entities can apply for funding and how River District staff and board members will evaluate those applications.
In November, an overwhelming 72% of voters approved ballot measure 7A, which raises property taxes across the district and will add about $5 million annually to the River District’s coffers. Eighty-six percent, or $4.2 million, of that will go toward funding water projects.
The new program is designed to be more nimble and responsive than other federal or state grant programs, with the River District board considering projects on a rolling basis throughout the year. It also gives Mueller the power to approve smaller amounts of project funds without the board’s involvement.
The River District plans to doll out funding for projects in five categories: productive agriculture; infrastructure; healthy rivers; watershed health and water quality; and conservation and efficiency.
Each of these categories will receive roughly equal funding on a five-year running average. The project money also will be distributed as evenly as possible across the district’s 15-county region. River District staff will evaluate project applications and decide which ones to bring to the board for approval.
Mueller said he wants “to memorialize within this program our commitments that we made to the voters with respect to how we are going to spend the money. … I think it’s really critical going forward that future board members, future staff members, members of the public can turn to a document and find what it is we have committed to and what are the guiding principles of our program.”
Water travels through a roller dam, generating power, then continues downstream. Roller Dam near Palisade. The Grand Valley Diversion Dam in DeBeque Canyon sends water from the Colorado River into the Grand Valley Project Canal. Rehabilitation of the structure could be one of the projects funded by the River District’s new Partnership Project Funding Program. Photo credit: Hutchinson Water Center
Local support requirement
The River District also is making good on a commitment laid out in the ballot measure’s fiscal implementation plan: that it funds projects that have the backing of local elected officials.
According to the framework, project proponents should get buy-in from local governments in the form of a letter of support from the board of county commissioners in the county in which the project is located. If proponents can’t get a letter of support, they must explain why not.
Mueller said the requirement does not amount to veto power for local governments, but whether a project has the backing of local officials could be a deciding factor in the River District’s choice to fund that project.
“We want to make sure our projects are aligning with the priorities of our local communities,” he said in a separate interview.
Mueller’s initial framework proposed that he, as general manager, be allowed to greenlight projects of as much as $25,000 with an annual cap of $250,000 without board approval. But directors at last week’s meeting said they wanted to up those numbers.
“I think it should be increased to $50,000,” said board president and Garfield County representative Dave Merritt. “We have the criteria laid out here, and if the board is going to get down into the weeds, we will never get through what we need to get through as a board. We’ve got a lot of money that needs to get expended with these partnership programs.”
The board is scheduled to adopt the framework at its January meeting, at which time Mueller said it also will consider the first projects for funding.
According to Jim Pokrandt, the River District’s director of community affairs, no entities have officially applied for grants yet and the grant application is still being developed. Examples of projects that could get funding as laid out in the fiscal implementation plan include forest restoration on the Yampa River, rehabilitation for the Grand Valley Roller Dam, and the Windy Gap Reservoir Connectivity Channel project, which would reconnect the Colorado River through the reservoir.
Mueller said he is excited that the infusion of tax money will allow the River District to remain fully staffed and thrive as an organization. But he acknowledged the new grant program still won’t solve the biggest problem on the Colorado River.
“All the money in the world is not going to solve the diminishing flows in the river caused by our warming temperatures and by climate change,” he said. “We can mitigate, we can adapt, we can make our communities more resilient, but it’s a daunting challenge we are all going to face in the next 20 years.”
Aspen Journalism is a local, nonprofit, investigative news organization covering water and rivers in collaboration with The Aspen Times and other Swift Communications newspapers. This story ran in the Dec. 10 edition of The Aspen Times.
Here’s the release from Northern Water (Jeff Stahla):
A United States District Court judge has ruled in favor of the Windy Gap Firming Project, clearing the way for construction of Chimney Hollow Reservoir near Berthoud. This ruling should also make it possible to move forward with environmental mitigation and enhancements related to the project, including construction of the Colorado River Connectivity Channel near Granby.
Judge Timothy M. Tymkovich dismissed a 2017 lawsuit filed by environmental groups led by Save the Colorado against the U.S. Bureau of Reclamation and the Army Corps of Engineers. The ruling holds that those federal agencies complied with federal law in issuing a Record of Decision that authorizes the Windy Gap Firming Project.
The Windy Gap Firming Project includes the construction of Chimney Hollow Reservoir, which will be located in a dry valley just west of Carter Lake in southwest Larimer County. The reservoir will store 90,000 acre-feet of water from the Windy Gap Project for use by 12 participants, including Broomfield, Platte River Power Authority, Longmont, Loveland, Greeley, Erie, Little Thompson Water District, Superior, Louisville, Fort Lupton, Lafayette and the Central Weld County Water District. Chimney Hollow Reservoir will make the Windy Gap water supply serving those participants more reliable and help them meet a portion of their long-term water supply needs. Each participant has also enacted a water conservation plan to comply with the Record of Decision.
Environmental measures related to the Project also include the Colorado River Connectivity Channel, a newly proposed channel around Windy Gap Reservoir to reconnect the Colorado River above and below the reservoir. The channel will restore the ability for fish, macroinvertebrates, nutrients and sediment in the river to bypass the reservoir.
The Record of Decision also mandates many other environmental protections, including improving streamflow and aquatic habitat, addressing water quality issues, providing West Slope water supplies and more. Northern Water and its Municipal Subdistrict negotiated with Colorado River stakeholders to develop this package of environmental protections and received a permit from Grand County and approvals from others, including Trout Unlimited and the State of Colorado, to move forward with the Project.
Water storage such as Chimney Hollow Reservoir was specifically identified in the Colorado Water Plan as a necessary component for Colorado’s long-term water future. It joins conservation, land use planning and other solutions to meet future water needs in the state.
“This ruling marks an important milestone for the participants in the Windy Gap Firming Project,” said Northern Water General Manager Brad Wind. “Chimney Hollow Reservoir and the Colorado River Connectivity Channel will serve as examples of how statewide cooperation can produce water supply solutions and environmental improvements that benefit everyone.”
Barnard Construction Co. Inc. has been chosen as the contractor to build Chimney Hollow Reservoir, and work will commence on the project in 2021. Design work is well under way for the Colorado River Connectivity Channel, and construction is anticipated to begin there in 2022.
A view of the location of the proposed Chimney Hollow dam and reservoir site in the foothills between Loveland and Longmont. The 90,000 acre-foot reservoir would store water for nine Front Range cities, two water districts and a utility, and is being held up a lawsuit challenging federal environmental reviews. Graphic credit: Brent Gardner-Smith
Looking east toward the Chimney Hollow Reservoir site, which is just this side of the red ridge. On the other side is Carter Lake Reservoir and beyond that, the Loveland area.
This graphic, provided by Northern Water, depicts Chimney Hollow Reservoir, located southwest of Loveland, after it is built.
Site of Chimney Hollow Reservoir via Northern Water.
Map from Northern Water via the Fort Collins Coloradan.
Site of proposed Chimney Hollow Reservoir — Windy Gap Firming Project via the Longmont Times-Call
Six home battery among strategies to contour demand around intermittent resources
On the cusp of deep penetration of renewable energy that most would have thought impossible just a decade ago, Holy Cross Energy has now started working to contour demands around those intermittent renewables.
Consider the six Tesla Powerwall battery packs installed in recent months in the homes of Holy Cross Energy members. They look vaguely like sleek, slender, and small refrigerators. They serve a similar purpose, storing a perishable, renewable energy, to be tapped when demand peaks.
Peak demand in the Holy Cross service area between Vail, Aspen, and Parachute typically occurs during winter evenings. If tests in coming months bear out expectations, Holy Cross hopes to have 100 more batteries installed among its 55,000 metered members by the end of 2021.
Power+, as the pilot project is called, is among several programs launched by Holy Cross Energy to juggle demand to better match supplies of renewables.
This transition to clean energy has been accelerating. In 2019, renewables were responsible for 44% of electrical generation consumed by Holy Cross members. By the end of 2022, renewables may have delivered more than 70% of electricity for the year.
The biggest single stride will come from a wind farm near Arriba, located about 120 miles east of Denver along Interstate 70. This wind farm will deliver 100 megawatts for Holy Cross, enough to supply a third of total demand. It’s slated for completion by New Year’s Eve 2021. Hunter Solar, a solar installation near Bennett, 35 miles southeast of Denver, will deliver another 30 megawatts by July 2022.
Construction of a 5-megawatt solar farm near the Aspen/Pitkin County Airport is expected to begin when the snow melts next spring, with service beginning next summer.
The three projects together will get Holy Cross to 70% renewables of annual energy production in 2022.
Next comes the work to reach 80%. Holy Cross expects to hit that level by the end of 2024—and perhaps even 85%.
And this just in: a press conference on Monday, Dec. 14, for “a special announcement regarding the next chapter in HCE’s commitment to a clean energy future.”
In early 2020, Holy Cross invited proposals for new electrical generation. This time, it said, it favored local sources. Too, the projects needed to lower costs, with the savings to be transferred to Holy Cross customers.
That invitation yielded 51 proposals. Among the first chosen was a 4.5-megawatt solar array to be constructed near the Colorado Mountain College Spring Valley Campus, between Glenwood Springs and Carbondale. Several other projects chosen have not been announced pending final scrutiny of contract details.
In deciding which projects to pursue, Steve Beuning, the vice president for power supply and programs at Holy Cross, describes several considerations:
Steve Beuning. Photo via The Mountain News.
First, does the new generating source create a situation of over-supply? “Over-supply is when the sun is shining and the wind is blowing and our members aren’t using much energy,” explains Beuning.
An office building sitting empty is costing somebody lots of money. Ditto for a rarely used wind farm or solar array. Construction is not cheap, even if the wind and sunshine are free. Best is when demand can take full advantage of all renewable resource production.
Second, does the proposed solar farm or other resource clash with the utility’s existing contract with Public Service Co. of Colorado, a subsidiary of Xcel Energy? Xcel is a major provider of electricity for Holy Cross. The contract, which was initiated in the early 1990s, specifies the circumstances under which Holy Cross can substitute supplies against those contractually committed to Holy Cross by Xcel.
“What we don’t want to do is buy energy twice,” says Beuning.
Third, what Impacts will occur to the delivery system of Holy Cross? Will the electrical wires already strung accommodate the new energy? A related but more abstract consideration has to do with reliability. How does this new generation affect grid stability? For example, will the loss of generation cause the lights to flicker or, worse yet, cause your computer to crash—causing you to lose that document you had slaved on for an hour but forgot to save!
One solution to this need to maintain steady deliveries may be through development of autonomous, local, so-called micro-grids. The Power+ program from Holy Cross is an example of a micro-grid that helps a single retail customer. In the future the concepts behind this program could be expanded to cover multiple customers with backup supply.
Power+ is one among several programs that seeks to buffer these rough edges between demand by consumers and new renewable energy supplies. Take Power+, the program that will put Tesla batteries into homes. During times of oversupply, they provide storage for consumption later, when renewable production is less but demand may be more.
Holy Cross offers incentives for those participating, but other members benefit, too, as the storage allows members, not just those houses with batteries, to take full advantage of lower-cost renewable energy.
Peak Time Payback, another voluntary program, also works at the fulcrum of supply and demand. Those members participating agree to get messages that request deferring electrical demand. Participants could then choose to delay using their washers and dryers during the evening, Presidents’ Weekend or some other time when Vail and Aspen are bustling and everybody is getting ready to watch the latest Netflix offering. The same thing can be achieved during a time of hot weather by moving the thermostat of an air conditioner up a few degrees, to reduce electricity use.
The intent of this program is to shave peak demand, typically during two or three hours blocks. This averts the need for Holy Cross to buy electric capacity on the open market at its most expensive moments. Participating Holy Cross members can, to the extent they alter their demands, benefit from preferred rates.
GreenUp, another pilot program, provides the flip-side to Peak Time Paybacks. It is premised on the fact that there are blocks of time when wind and solar forecasters predict an abundance of renewable energy. Again, there are financial incentives, but this time inverse to those intended to shave peak demand. In this case, consumers are encouraged through lower costs to actually use electricity when its plentiful.
“We will make the decisions to trigger the program based on our forecast for wind and solar, and the member would make the decisions about any behavior changes to access the reduced rates,” says Beuning. “We will communicate the program timing through a text or e-mail.”
Other utilities offer similar demand-side management programs in an effort to contour supplies with demands more efficiently. It made sense even when most electricity was generated by burning fossil fuels. Deepening penetration of intermittent renewables will require even greater juggling of demand.
The arrival of electric cars and other vehicles will pose both additional challenges but also offer opportunities for optimizing the balance between supplies and demands.
Holy Cross in recent years has gained a national reputation for innovation and boldness. Platte River Power Authority, which serves four member cities along the northern Front Range, has also started to turn heads.
In 2018, both Colorado utilities adopted ambitious goals for 2030. Holy Cross was first, with its target of 70% renewables and 70% reduction in greenhouse gas emissions in its generating portfolio by 2030. Just a few months later, Platte River Power Authority adopted a resolution calling for 100% carbon-free electricity by 2030.
Now, the two utilities face many of the same challenges, as do other utilities. Platte River’s directors noted that 10 conditions would have to be addressed to achieve its 2030 target. Among those conditions is the need for matured battery storage technology along with steep cost declines.
Another is for a regional transmission organization, or RTO. An RTO enables more efficient access to the electric grid and pairs demands with renewables across a broader geographic area. The idea of improved dispatch and transmission is to allow Colorado and California to work more in tandem, along with Utah and Arizona and other states. An alternate idea would have Colorado sharing energy and demands with states in the Great Plains and their bounteous supplies of wind.
Integration of geographically diverse markets will give Holy Cross greater flexibility, says Beuning, allowing it to deepen the penetration of renewable energy. Think of using California sun to heat water in the late afternoon, or Colorado wind helping address the evening reduction in solar generation in the desert Southwest.
Twenty-five years ago, changes were few from year to year. Now, they’re happening at an almost blinding pace.
The race is on toward 100% carbon-free electricity, but there’s a lot of hard work ahead.
Allen Best is a Colorado-based journalist who publishes an e-magazine called Big Pivots. Reach him at allen.best@comcast.net or 303.463.8630.
Click here to read the discussion and to check out their graphical figures:
EL NIÑO/SOUTHERN OSCILLATION (ENSO) DIAGNOSTIC DISCUSSION issued-by CLIMATE PREDICTION CENTER/NCEP/NWS and the International Research Institute for Climate and Society 10 December 2020 ENSO Alert System Status: La Niña Advisory
Synopsis: La Niña is likely to continue through the Northern Hemisphere winter 2020-21 (~95% chance during January-March), with a potential transition during the spring 2021 (~50% chance of Neutral during April-June).
La Niña persisted during November, as indicated by well below-average sea surface temperatures (SSTs) extending from the Date Line to the eastern Pacific Ocean. Most of the weekly indices fluctuated through the month, with the westernmost Niño regions Niño-4 and Niño-3.4 ending up around -1.0oC. The negative equatorial subsurface temperature anomalies (averaged from 180°-100°W) weakened slightly last month, but continued to reflect below-average temperatures from the surface to 200m depth in the eastern Pacific Ocean. The atmospheric circulation over the tropical Pacific Ocean remained consistent with La Niña. Over the western and central tropical Pacific Ocean, low-level wind anomalies were easterly and upper-level wind anomalies were westerly. Tropical convection continued to be suppressed from the western Pacific to the Date Line. Also,both the Southern Oscillation and Equatorial Southern Oscillation indices were positive. Overall, the coupled ocean-atmosphere system indicates the continuation of La Niña.
A majority of the models in the IRI/CPC plume predict La Niña (Niño-3.4 index less than -0.5°C) to persist through the Northern Hemisphere winter 2020-21 and to weaken through the spring. Supported by the latest forecasts from several models, the forecaster consensus is for a moderate strength La Niña (Niño-3.4 index values between -1.0oC and -1.5oC) during the peak November-January season. In summary, La Niña is likely to continue through the Northern Hemisphere winter 2020-21 (~95% chance for January-March), with a potential transition during the spring 2021 (~50% chance of Neutral during Apr-Jun; click CPC/IRI consensus forecast for the chances in each 3-month period).
La Niña is anticipated to affect climate across the United States during the upcoming months. The 3-month seasonal temperature and precipitation outlooks will be updated on Thursday December 17th.
Click on a thumbnail graphic below to view a gallery of drought data from the US Drought Monitor.
US Drought Monitor December 8, 2020.
West Drought Monitor December 8, 2020.
Colorado Drought Monitor December 8, 2020.
Click here to go to the US Drought Monitor website. Here’s an excerpt:
This Week’s Drought Summary
This U.S. Drought Monitor week saw intensification of drought across parts of the western U.S. including California, Nevada, and Colorado where precipitation has been below normal since the beginning of the Water Year (Oct 1). In California, statewide snow water content (SWE) is currently at 36% of the historical average for the date (Dec 7) and Water-Year-to-Date (WYTD) precipitation (statewide) is ranging from the bottom 10% to the bottom 33% with some areas in the Mojave Desert experiencing the driest on record for the period. According to NOAA’s National Centers for Environmental Information (NCEI), the 6-month period from June to November 2020 was the hottest and driest on record for both Arizona and California. Current snowpack conditions across the West are generally reflective of a La Niña-like precipitation pattern with the mountain ranges in the Pacific Northwest and some areas of the northern Rockies observing near-normal to above-normal snowpack conditions. Further south in the Four Corners states, basin-wide (6-digit HUC) SWE is below normal in nearly all drainage basins in the region. Elsewhere on this week’s map, areas of Texas including the Panhandle and central Texas saw some minor deterioration in conditions where both long and short-term precipitation deficits exist. In the Northern Plains, unseasonably warm temperatures and dry conditions continued this week leading to intensification of drought conditions in North Dakota where statewide precipitation for the September-November 2020 period ranked 3rd driest on record, according to NOAA NCEI. In New England, drought-related conditions significantly improved in response to heavy rains and snow associated with a Nor’easter that impacted the region during the weekend. The storm delivered heavy rains and strong winds to coastal areas as well as heavy snowfall in the mountains of New Hampshire and northern Maine…
On this week’s map, areas of the region—including southwestern North Dakota and central Nebraska—saw modest expansion in areas of Severe Drought (D2) as well as expansion in areas of Moderate Drought (D1) in southwestern North Dakota in response to a combination of factors—short-term precipitation deficits, lack of seasonal snow cover, depleted soil moisture, and unseasonably warm temperatures (12 to 20 degrees F above normal)—during the past week. In the eastern Plains of Colorado, areas of Extreme Drought (D3) and Exceptional Drought (D4) expanded where long-term precipitation deficits continued to mount…
During the past week, high pressure continued to dominate across much of the region with essentially no precipitation observed except for some light precipitation (generally <1 inch) along coastal Oregon and Washington. On the map, below-normal WYTD precipitation across California led to deterioration across the Sierra Nevada, Central Coast, southern San Joaquin Valley, and areas of Southern California and the Mojave Desert. In the mountains of California, the current statewide SWE for the date (Dec 7) is 36% of normal. Considering the regional breakdown across the state, the current percentage of normal SWE is as follows: Northern Sierra/Trinity–40%, Central Sierra–44%, and Southern Sierra–17%. According to the California Department of Water Resources, the three largest reservoirs in the state were below historical averages for the date with Shasta at 74%, Oroville at 60%, and Trinity at 79%. In the northern Great Basin, areas of Extreme Drought (D2) expanded in northeastern Nevada where snowpack conditions are below normal across the Ruby Mountains, Independence Mountains, and Jarbidge Mountains. Across the Nevada and Utah borders in southern Idaho, areas of Moderate Drought (D1) expanded where below-normal snowpack conditions are being observed in the Bear River Range and the Portneuf Range east of Pocatello, Idaho. In the Pacific Northwest, snowpack conditions at the Sub-region level (4-Digit HUC) ranged from slightly below normal (Lower Snake–78%, Upper Snake–83%, Yakima–84%, Kootenai-Pend Oreille-Spokane–87%, Oregon-Washington Coastal–90%, Upper Columbia–94%, Middle Snake–99%) to above normal (Puget Sound–101%, Willamette–115%, Middle Columbia–117%, Oregon Closed Basins–143%). Across the mountain ranges of the Four Corners states, snowpack conditions are well below normal across with the Little Colorado, Salt, Upper Gila, Rio Grande-Mimbres, Rio-Grande Elephant Butte, Upper Canadian, and Upper Pecos basins—all below ~50% of normal. According to the NRCS (Dec 1), statewide reservoir storage was below normal in Colorado, Nevada, New Mexico, and Oregon while above-average levels were observed in Arizona, Idaho, Utah, Washington, and Wyoming (data not available for California and Montana). Looking at the last 6-month period, the Southwest (Arizona, Colorado, New Mexico, Utah) and West (California, Nevada) climate regions both experienced their hottest and driest June-November period on record, according to NOAA NCEI...
South
On this week’s map, areas of drought intensified and expanded in the Panhandle and central Texas where both long and short-term precipitation shortfalls exist. In these areas, 6-month precipitation deficits ranged from 4 to 8+ inches. Conversely, above-normal precipitation during the last 30-day period led to improvements on the map in areas of Moderate Drought (D1) and Abnormally Dry (D0) along the Coastal Plain region of Texas. According to the USDA for the week of November 29, 61% of topsoil moisture in Texas was rated short to very short and 34% of the winter wheat crop was reported to be in poor to very poor condition. Elsewhere in the region, short-term dryness during the past 30-day period led to expansion of areas of Abnormally Dry (D0) across portions of Louisiana, Arkansas, Mississippi, and Tennessee. Average temperatures for the week were well below normal (4 to 10+ degrees F) across the entire region…
Looking Ahead
The NWS WPC 7-Day Quantitative Precipitation Forecast (QPF) calls for light-to-moderate liquid accumulations ranging from 1 to 2+ inches across a swath extending from east Texas and the Lower Mississippi Valley northward to eastern portions of the Midwest. Out West, moderate-to-heavy liquid accumulations are forecast for areas extending from Northern California to western Oregon and Washington including the Olympic Mountains of Washington, Cascades of Oregon and Washington, and the central/northern Sierra. Lighter precipitation (generally <1-inch liquid) is expected across the ranges of the northern Great Basin, the Rockies, and along the Mogollon Rim and “Sky Island” mountain ranges of southeastern Arizona. In northern portions of New England and the Southeast, light precipitation accumulations (generally <1 inch of liquid) are expected. The CPC 6–10 day Outlook calls for a moderate-to-high probability of above-normal precipitation across most of the northern tier of the western U.S., Northern Plains, Upper Midwest, and the Northeast while normal temperatures are expected across much of Southwest Texas, the Midwest, the Northeast, and the Mid-Atlantic states. Conversely, there is a moderate-to-high probability of drier-than-normal conditions forecast for much of California, the central and southern Rockies, and the Southwest. Likewise, dry conditions are expected in Texas, the central and southern Plains, much of the Midwest, and Florida. In terms of temperature, there is a moderate-to-high probability of above-normal temperatures across most of the West, the Plains states, and the Northeast while below-normal temperatures are expected across the South and Southeast.
US Drought Monitor one week change map ending December 8, 2020.
The State of Colorado has activated the municipal portion of its emergency drought plan for only the second time in history as several cities say they need to prepare for what is almost certainly going to be a dangerously dry 2021.
Last summer, the state formally activated the agricultural portion of the plan, calling on government agencies that serve farmers and livestock producers to begin coordinating aid efforts among themselves and with growers.
Now a similar process will begin for cities, according to Megan Holcomb, who oversees the drought work for the Colorado Water Conservation Board, the state’s lead water policy agency.
Holcomb said the state’s decision to sound the alarm on municipal water supply came in response to requests from several cities, who believe the drought has become so severe that they need to prepare quickly for whatever 2021 may bring. Normally cities don’t make decisions about whether to impose watering restrictions until the spring, when it becomes clear how much water will melt from mountain snows and fill reservoirs.
But not this year.
“Even with an average snowpack we will still be in drought in the spring,” Holcomb said.
Colorado Springs, just last summer, enacted permanent three-days-per-week outdoor watering restrictions.
Kalsoum Abbasi oversees the city’s water delivery system and its reservoirs. She said the state’s decision to activate phase III drought planning makes sense.
“Personally I think it’s a good move for the state to move forward because it will help keep these drought conditions at the forefront of the conversation,” she said.
According to the U.S. Drought Monitor, the state is now blanketed in drought, with more than two-thirds of its terrain classified as being in extreme or exceptional drought, the worst condition.
Colorado has experienced four severe droughts since 2000, but the trend has intensified with the drought of 2018 barely lifting before 2020 began seeing searing temperatures and dry weather again.
Going into 2021 soils across the state are desperately dry. As mountain snows melt and runoff makes its way to streams, a large share of the moisture will be absorbed by the thirsty landscape, leaving less for reservoirs and cities to collect.
“Soil moisture is a huge part of this story,” Holcomb said. “I also think 2020 is likely the hottest year on record globally. Long-term forecasts for temperatures show January through October of next year being extremely warm again.”
Colorado is divided into eight major river basins, with the four to the west of the Continental Divide feeding the bigger Colorado River Basin, which extends from the Never Summer Mountains in Rocky Mountain National Park to the Gulf of Mexico.
Federal forecasts for this system over the next several months have been dropping sharply. Paul Miller, a hydrologist for the Colorado River Basin Forecasting Center in Salt Lake City, said the amount of water predicted to be generated by this winter’s mountain snows dropped to 5.6 million acre-feet in December, down from 6.45 million acre-feet just one month earlier.
“Even before this recent change there was cause for concern because this past year was very dry and reservoir levels fell,” Miller said.
Local city water officials such as Jerrod Biggs, deputy director of utilities in Durango, said there is little time to waste.
Durango lies in the southwest corner of the state. The region has been hardest hit by the current drought and was similarly hard hit in 2018.
“All the groundwork we can lay today is worth it. Everybody hopes it’s not needed. But sticking our heads in the sand isn’t going to do anybody any good. It’s ugly and it’s getting uglier,” Biggs said.
Jerd Smith is editor of Fresh Water News. She can be reached at 720-398-6474, via email at jerd@wateredco.org or @jerd_smith.
Here’s the release from the Colorado River District:
Our snow is our water. The snow that we ski and ride becomes the water that quenches crops and communities. As winter begins, we’re all wondering what our water future holds and how will it impact us.
Join the Colorado River District at noon, Wednesday, Dec. 16, for Water With Your Lunch: Our Snow and Our Water, where we’ll hear forecasts for snowpack and water supply and discuss the economic impact of snow and water on the West Slope. Presenters will also address long-term changes that are becoming visible in Colorado’s mountain snowpack. Understanding how snowfall, water and our livelihoods are connected is vital to understanding actions we can take to protect our West Slope water and sustain our West Slope economies.
Joel Gratz, founding meteorologist at Open Snow, will present how he makes forecasts and the possible impacts of a La Nina weather pattern, which can give us an idea of what the pattern of snowfall in Colorado will likely be this winter. Paul Miller, a service coordination hydrologist at the National Weather Service’s Colorado Basin River Forecast Center, will talk about how his agency translates snowpack measurements into water supply forecasts and how factors like soil moisture influence the water we get from snow.
Then we’ll learn more about the impact that snow – or lack of it – has on the Western Slope economy. From powder days at ski areas to flowing water for agricultural irrigation, snow and water power jobs on the West Slope. We’ll learn more about the economic value of snow in West Slope agriculture and recreation from two speakers: Todd Hagenbuch, a Colorado State Extension Agent in Routt County, and Alan Henceroth, chief operating officer at Arapahoe Basin Ski Area.
Fourth-warmest November and year-to-date for the contiguous U.S.; most active Atlantic hurricane season on record
For November, the contiguous U.S. average temperature was 46.4°F, 4.7°F above the 20th-century average, ranking fourth warmest in the November record. During meteorological autumn (September-November), the average temperature for the Lower 48 was 55.5°F, 2.0°F above average, ranking 11th warmest in the historical record. For the year to date, and with one month remaining in the calendar year, the contiguous U.S. temperature was 56.1°F, 2.3°F above the 20th-century average. This ranked fourth warmest in the January-November record. The four warmest January-November periods on record have all occurred since 2012.
The November precipitation total for the contiguous U.S. was 1.90 inches, 0.33 inch below average, ranking in the driest third of the 126-year period of record. The autumn precipitation total across the Lower 48 was 6.52 inches, 0.36 inch below average, ranking in the middle third of the historical record. The year-to-date precipitation total across the contiguous U.S. was 28.26 inches, 0.67 inch above the long-term average, also ranking in the middle third of the January-November record. This was the driest year-to-date period since 2012.
Above-average tropical activity across the Atlantic Basin continued into November as one tropical storm and two major hurricanes formed. By the end of November, and the official ending of the Atlantic hurricane season, 30 named storms formed during 2020, which breaks the 2005 record of 28 for the most storms in a single season. Category 5 Hurricane Iota formed during November and was the most intense Atlantic hurricane of the season.
This monthly summary from NOAA National Centers for Environmental Information is part of the suite of climate services NOAA provides to government, business, academia, and the public to support informed decision-making.
November Temperature
Above-average November temperatures were observed across most of the Lower 48. New Mexico, South Carolina, Maryland and Delaware each had their second-warmest November on record with nine additional states from the South to the Northeast ranking among their warmest five Novembers.
Near-average temperatures occurred across portions of the West and Northwest. No notable regions of below-average temperatures were present across the Lower 48 during November.
The Alaska average November temperature was 14.3°F, 2.6°F above the long-term mean, ranking in the middle third of the 96-year period of record for the state. Above-average temperatures were present across portions of the North Slope and West Coast. Below-average temperatures were observed across the Southeast Interior, Northeast Gulf and the Panhandle. Utqiaġvik (Barrow) had its third-warmest November on record.
November Precipitation
A trough of low pressure in the middle of November contributed to above-average precipitation across portions of the Northwest, central Plains, western Great Lakes, Southeast and mid-Atlantic states.
Precipitation received from Tropical Storm Eta helped North Carolina rank 10th wettest for November.
Below-average precipitation occurred across parts of the West, northern Rockies, much of the northern Plains and from portions of the South to the Northeast. North Dakota ranked 11th driest for the month.
In Alaska, statewide precipitation ranked in the wettest third of the historical record. Above-average precipitation occurred across portions of the North Slope, West Coast, Bristol Bay, Northeast Interior and South Panhandle regions. Precipitation across the rest of the state was near average for the month.
According to the December 1 U.S. Drought Monitor report, approximately 48 percent of the contiguous U.S. was in drought, up nearly 3 percent from the beginning of November. Drought conditions expanded or intensified across portions of the northern and central Plains, Deep South and much of the West. Drought severity and/or extent lessened across much of New England and Hawaii and parts of the Pacific Northwest.
November Extremes
Through November 30, and the official end of the Atlantic hurricane season, several records were tied or broken.
Thirty named storms formed in the Atlantic, which breaks the previous record of 27 set in 2005. The 13 hurricanes and 6 major hurricanes in 2020 are both the second most on record behind 2005 (15 and 7, respectively).
Twelve named U.S. storm continental landfalls occurred during 2020. This tops the 11 landfalls set through October 31 and breaks the previous annual record of nine landfalls set in 1916.
Six hurricanes made U.S. landfall, tying 1886 and 1985 for the most U.S. hurricane landfalls in a single season.
Category 4 Hurricane Eta made landfall near Puerto Cabezas, Nicaragua, on November 3 with winds of 140 mph. Eta weakened over land and eventually re-emerged into the Caribbean, making landfall in Cuba and eventually on the Lower Matecumbe Key in Florida as a tropical storm.
Only two weeks after Eta’s landfall, category 5 Hurricane Iota reached peak intensity of 160 mph before weakening and making landfall along the northeast coast of Nicaragua as a Category 4 hurricane on November 16 and only 15 miles south of the location of Eta’s landfall. This was the first November on record to have two major Atlantic hurricanes.
Iota was the only Category 5 storm during 2020, the strongest hurricane of the season and only the second Category 5 storm on record to form during November. The Cuba Hurricane of 1932 made landfall on November 8 and had 175 mph peak winds.
Hurricane Iota was the second-strongest November hurricane on record for the Atlantic and was the strongest Atlantic hurricane on record to occur so late in the calendar year.
This was a record fifth consecutive year with at least one Category 5 storm in the Atlantic.
Five Category 4 and 5 storms formed in the Atlantic during 2020, tying with 1933, 1961, 1999 and 2005 for the record.
Autumn (September-November) Temperature
Above-average autumn temperatures spanned much of the West and from the Deep South to New England. California and Florida ranked warmest on record.
Near-average temperatures for autumn were observed across much of the northern and central Plains as well as the western Great Lakes.
The Alaska statewide average temperature for autumn was 28.4°F, 2.5°F above average, ranking in the warmest third of the historical record. Northern and western portions of the state had above-average temperatures while portions of the Panhandle had temperatures that were below average for the season. In large part due to the loss and thinning of sea ice along Alaska’s northern coast, Utqiaġvik had its fourth-warmest autumn on record.
Autumn (September-November) Precipitation
Above-average precipitation was observed across the Southeast and mid-Atlantic as well as portions of the Northwest, South, Ohio Valley and Great Lakes. Virginia ranked fourth wettest on record.
Below-average precipitation was observed across much of the West, the northern and central Plains and across parts of the Northeast. Utah and Arizona ranked driest on record for autumn with three additional states in the West and northern Plains ranking among their driest five autumns on record.
Precipitation across Alaska during autumn ranked in the driest third of the historical record. Above-average precipitation occurred across portions of the North Slope, Northeast Interior and Bristol Bay regions while the Northeast Gulf and Panhandle regions had below-average precipitation for the season.
Year-to-date (January-November) Temperature
Above-average year-to-date temperatures were observed across much of the Lower 48 with Florida, Virginia, Maryland, Delaware and Rhode Island ranking warmest on record.
Near-average temperatures were observed in pockets across the northern Rockies, northern Plains as well as the southern Plains.
It was the coolest January-November across Alaska since 2012. Year-to-date statewide temperatures ranked near average in Alaska with above-average temperatures observed across the northern and western portions of the state. Below-average temperatures were present across portions of the interior regions.
Year-to-date (January-November) Precipitation
Above-average January-November precipitation occurred in parts of the Northwest, Great Lakes and from the southern Plains to the mid-Atlantic. North Carolina ranked wettest on record while Virginia ranked third wettest for this 11-month period.
Below-average precipitation occurred across much of the West, northern Plains and the Northeast. Utah ranked driest on record while six additional western states ranked among their driest five January-November periods.
January-November precipitation in Alaska was above average across the interior regions, Bristol Bay and portions of the Panhandle. Drier-than-average conditions were present across the Aleutians as well as the central Gulf and northwest Panhandle.
Wall Street has begun trading water as a commodity, like gold or oil. The country’s first water market launched on the Chicago Mercantile Exchange this week with $1.1 billion in contracts tied to water prices in California, Bloomberg News reported.
The market allows farmers, hedge funds, and municipalities to hedge bets on the future price of water and water availability in the American West. The new trading scheme was announced in September, prompted by the region’s worsening heat, drought, and wildfires fueled by climate change. There were two trades when the market went live Monday.
“Climate change, droughts, population growth, and pollution are likely to make water scarcity issues and pricing a hot topic for years to come,” RBC Capital Markets managing director and analyst Deane Dray told Bloomberg. “We are definitely going to watch how this new water futures contract develops.”
Proponents argue the new market will clear up some of the uncertainty around water prices for farmers and municipalities, helping them budget for the resource. But some experts say treating water as a tradable commodity puts a basic human right into the hands of financial institutions and investors, a dangerous arrangement as climate change alters precipitation patterns and increases water scarcity.
“What this represents is a cynical attempt at setting up what’s almost like a betting casino so some people can make money from others suffering,” Basav Sen, climate justice project director at the Institute for Policy Studies, told Earther. “My first reaction when I saw this was horror, but we’ve also seen this coming for quite some time.”
Nathan Fey, seen here paddling the Lower Dolores River. The lower Dolores River depends on a deep snowpack for boating releases from McPhee Reservoir. (Photo courtesy Nathan Fey)
FromThe Cortez Journal (Jim Mimiaga) via The Durango Herald:
Sorry skiers, ranchers and kayakers: Weather observers see no relief in sight for a persistent drought that has gripped the Four Corners.
A strong La Niña weather pattern has helped shift the jet stream farther north, which keeps storms from reaching the Four Corners, officials said.
“It’s the strongest La Niña in 10 years,” said Jim Andrus, a weather observer for the National Weather Service. “Even when we do get storms that dip down our way, they are weak at most.”
[…]
The long-term forecast for the Four Corners is below-normal precipitation and above-normal temperatures, said Norv Larson, a meteorologist with the National Weather Service.
High pressure and a dry air mass are generally blocking storms from reaching and forming in the area, he said…
Colorado snowpack basin-filled map December 9, 2020 via the NRCS.
Snowpack is well below average in Southwest Colorado.
Snotel stations in the mountains that measure snowfall, show the Dolores and San Miguel river basins are 48% of normal as of Dec. 7.
The Animas River Basin is at 38% of normal, and the Gunnison River Basin is at 53% of normal.
The Telluride Ski Resort reports a 21-inch base, and Purgatory Resort has a 16-inch base.
As of Dec. 3, Southwest Colorado and most of the Western Slope were in “exceptional” drought, the worst level out of five, according to the U.S. Drought Monitor. Most of Utah and Arizona also were in exceptional drought.
Contrary to the common phrase, fire and water actually do mix – and there’s often a direct connection between the two.
This year in particular, wildfires have gripped Colorado with historic magnitude. And while we often think of property damage and air quality as the most immediate consequences of severe wildfire, rivers and drinking water supplies are often wildfire casualties as well.
2020 was Colorado’s third-driest water year on record and one of our warmest, with the hottest August since record-keeping began in 1895. Models show that climate change and historic drought will continue to affect the Colorado River Basin and increase the severity and frequency of wildfires.
Abby Burk brings a lifetime love of rivers, particularly of the Colorado River and its tributaries. As the western rivers regional program manager for Audubon Rockies. Photo credit: Audubon Rockies
To combat this, we must strive to bolster the resiliency of both land and water, including our rivers and streams, to support our communities that rely upon them.
The good news is that Coloradans across the state recognize the need to invest in our rivers.
Voters this year approved two ballot measures that will generate additional funding to support the St. Vrain and Left Hand Water Conservancy District as well as the Colorado River Water Conservation District. The measures will generate a combined $8 million per year to support healthy rivers, local agriculture, watershed health and water quality across both districts.
That local funding will support the types of solutions and water-management projects outlined in Colorado’s Water Plan. The plan, finalized in 2015, provides a blueprint to address the gap between water supply and demand across the state.
And now we have a critical opportunity to build on that work – and voters’ recent mandates – by making updates to the Water Plan. These updates will provide a chance to identify and recommend a path towards a healthy, secure water future.
“From extreme drought to extreme fires, 2020 highlights the need for us to build our climate resilience and protect the watersheds that sustain our streams, farms and cities. Finding these opportunities and identifying the state of the science is at the heart of the Colorado Water Plan Update,” says Colorado Water Conservation Board Director Rebecca Mitchell.
Wildfire-related impacts on river health are significant, including post-fire floods, debris flows, erosion, and the threat of toxic debris flowing into our rivers and water supply. Laurie Rink of the Middle Colorado Watershed Council says that key stakeholders have expressed the need for coordinated planning and response to Colorado’s wildfires.
“Immediate focus will be on post-fire recovery and rehabilitation to reduce post-fire hazards, such as flooding and erosion. Longer-term efforts can turn towards planning for and implementing future fire risk mitigation throughout the watershed,” Rink says.
Healthy rivers flow from healthy watersheds. We must broaden the river health conversation beyond the river channel itself, to include the entire “riverscape,” comprised of the streams, floodplain, and vegetation surrounding them.
Riverscapes support bird and wildlife habitat, as well as ecological services that directly influence water quality and quantity. Nearly 80% of Colorado’s clean, reliable drinking water comes from these forested watersheds. But significant data gaps exist around watershed health, and without current science, the effort to create projects and management plans to protect Colorado’s rivers is daunting.
Ensuring that Colorado’s riverscapes and forests can recover from future wildfires at a landscape scale is crucial. Implementing proven wildfire mitigation strategies such as forest treatments and prescribed fires, as well as investing in the health of our rivers and streams, will promote increased resilience to climate change and mitigate the effects of wildfires on water supplies and communities.
Colorado Water Plan website screen shot November 1, 2013
Colorado’s Water Plan strives to develop stream management plans for at least 80% of rivers and streams across the state, as well as 80% of critical watersheds with watershed protection plans, all by 2030.
Current, accurate, scientific data is crucial for the development of these stream management and watershed plans. Fortunately, river health assessments can inform locally driven projects to protect or improve conditions and empower communities to develop tailored resilience strategies and track river health over time.
It’s essential that an updated Water Plan provide funding and guidance for addressing river health information gaps.
While rivers connect all Coloradans, so does drought and wildfire in 2020. When we invest in the health of our rivers, we are also investing in future resilience to climate change and associated disruptions to our rural heritage and Colorado lifestyle.
Abby Burk is the Western Rivers Regional Program Manager for Audubon Rockies.
Colorado River “Beginnings”. Photo: Brent Gardner-Smith/Aspen Journalism
Meadows, forests and mountain ridges create the high alpine landscapes of Niwot Ridge in the Rocky Mountains, 25 miles northwest of Boulder. Forty percent of the City of Boulder’s water is sourced from the Green Lakes Valley within Niwot Ridge, which the researchers analyzed in this study. (Credit: William Bowman)
From the University of Colorado (Kelsey Simpkins):
A long-term trend of ecological improvement is appearing in the mountains west of Boulder. Researchers from CU Boulder have found that Niwot Ridge—a high alpine area of the Rocky Mountains, east of the Continental Divide—is slowly recovering from increased acidity caused by vehicle emissions in Colorado’s Front Range.
Their results show that nitric and sulfuric acid levels in the Green Lakes Valley region of Niwot Ridge have generally decreased over the past 30 years, especially since the mid-2000s. The findings, which suggest that alpine regions across the Mountain West may be recovering, are published in the Journal of Geophysical Research: Biogeosciences.
This is good news for the wildlife and wildflowers of Rocky Mountain National Park to the north of Niwot Ridge, which depend on limited levels of acidity in the water and soil to thrive. Colorado’s Rocky Mountains are also the source of a lot of water for people living in the Mountain West, and the integrity of these ecosystems influences both the quantity and the quality of this water.
“It looks like we’re doing the right thing. By controlling vehicle emissions, some of these really special places that make Colorado unique are going back to what they used to be,” said Jason Neff, co-author on the paper and director of the Sustainability Innovation Lab at Colorado (SILC).
Meadows, forests and mountain ridges create the high alpine landscapes of Niwot Ridge in the Rocky Mountains, 25 miles northwest of Boulder. Forty percent of the City of Boulder’s water is sourced from the Green Lakes Valley within Niwot Ridge, which the researchers analyzed in this study. (Credit: William Bowman)
Almost every area in the world, including Colorado’s Rocky Mountains, has been affected in the past 200 years by increased acidic nutrients, like nitrogen, contained in rain and snow. Nitrogen oxides, like nitrate, are produced primarily from vehicles and energy production. Ammonium is a main ingredient in common agricultural fertilizers.
Nitrogen is a fundamental nutrient required in ecosystems. But when nitrogen levels increase too much, this changed soil and water chemistry can make it difficult for native plants to thrive or even survive—leading to a cascade of negative consequences.
In the summer, the sun heats up the Eastern flanks of the Front Range, causing the warmer air to rise—bringing nitrogen from cars, industry and agriculture with it. As this air cools, it forms clouds over the Rocky Mountains and falls back down as afternoon thunderstorms—depositing contaminants, explained Neff.
In the 1970s, so-called “acid rain” hit East Coast ecosystems much harder than the Mountain West, famously wiping out fish populations and killing trees across large swaths of upstate New York. But scientists are still working to understand how increased levels of acidic nutrients affect the alpine region and how long these ecosystems take to recover.
To fill this gap of knowledge, the researchers analyzed data from 1984 to 2017 on atmospheric deposition and stream water chemistry from the Mountain Research Station, a research facility of the Institute of Arctic and Alpine Research (INSTAAR) and CU Boulder located on Niwot Ridge. They found that around the early 2000s, levels of nitric and sulfuric acid stopped increasing in the Green Lakes Valley. In the mid-2000s they started decreasing.
Their findings were not all good news, however. Levels of ammonium from fertilizer have more than doubled in rainfall in this area between 1984 and 2017, indicating a need to continue monitoring this agricultural chemical and its effects on the mountain ecosystem.
From field work to statistics
This work builds on decades of field work by Colorado researchers at CU Boulder and beyond.
Niwot Ridge is one of 28 Long Term Ecological Research (LTER) Network sites in the U.S., funded by the National Science Foundation. Its 4 square miles stretch from the Continental Divide down to the subalpine forest, 25 miles northwest of Boulder. Researchers at CU Boulder, as well as Colorado State University and the United States Geological Survey, have been collecting data here since the mid-1970s, hiking through snow, sleet and rain to get it.
In the 80s, 90s and 2000s they worked to bring attention to increasing acidification in Colorado mountain ecosystems as a need for pollution regulation in the Front Range.
This new research was made possible by these dedicated scientists, stresses Neff.
“We used water quality modeling and statistical approaches to analyze the long-term datasets that Niwot researchers have been collecting for decades,” said Eve-Lyn Hinckley, a co-author on the paper and fellow of INSTAAR. “The data are available for anyone to download. Our modeling approaches allowed us to evaluate the patterns they hold in a rigorous way.”
Since 1990, Bill Bowman, director of the Mountain Research Station and a professor of ecology and evolutionary biology, has been looking into how nutrients like nitrogen affect plants in mountain ecosystems. He’s found that alpine environments are unique in how they respond to these nutrients.
“It’s a system that is adapted to low nutrients, as well as a harsh climate and a very short growing season—and frost in the middle of the season. These are very slow growing plants. And they just simply can’t respond to the addition of more nitrogen into the system,” said Bowman, also a fellow in INSTAAR.
He has also found that these ecosystems recover quite slowly, even after acidic elements like nitrogen are no longer being added. But like Neff, who completed his undergraduate honors thesis with Bowman in 1993 using Niwot Ridge data, he sees this research as encouraging.
Even if it’s slow going, they said, these results show that the ecosystem has a chance to recover.
“We still have air quality issues in the Front Range. But even with those air quality issues, this research shows that regulating vehicle and power plant emissions is having a big impact,” said Neff.
Additional authors on this paper include lead author John Crawford of the Institute of Arctic and Alpine Research (INSTAAR) and CU Boulder.
A busy highway can be a barrier for wildlife movement. This artist’s rendering shows an elk using the overpass to be built over U.S. 160 near Chimney Rock National Monument. The project will also include an underpass, since studies indicate that various species of wildlife prefer either above ground or underground routes to cross highways. Graphic credit: Colorado Parks & Wildlife
Here’s the release from Colorado Parks and Wildlife (Joe Lewandowski and Lisa Schwantes):
Construction to begin next spring in southwest Colorado
Colorado Parks and Wildlife and the Colorado Department of Transportation have partnered with the Southern Ute Indian tribe and several other organizations to construct a new wildlife mitigation project in southwest Colorado. The project, slated to begin this coming spring, will construct several features on U.S. Highway 160 between Durango and Pagosa Springs that will promote safer travel for motorists, enhance safer movement of wildlife, and reduce animal-vehicle collisions along this section of highway.
The location of the project will bring a great improvement for that section of highway, explained Scott Wait, senior aquatic biologist for Colorado Parks and Wildlife.
“This is a heavily used corridor by vehicles and an important area in the San Juan Basin for big game,” Wait said. “Deer and elk spend the warm months in the high country to the north; but most big game move to the important winter range areas south of the highway during the winter. So there is a huge number of deer and elk that cross the highway at that location.”
This is an extraordinary collaborative project, CDOT officials said.
“We are extremely grateful for the phenomenal partnerships that have made this project feasible,” said Tony Cady, CDOT Planning and Environmental Manager for southwest Colorado. “These partnerships greatly leverage the individual contributions made by these different entities and will increase the return on our investments.”
The Southern Ute Indian Tribe is a critical partner and provided important biological information to help design the project.
“Hunting is an extremely important component to the Southern Ute Indian Tribe and culture and it is considered vital to keep these traditions alive,” said Steve Whiteman, acting director of Natural Resources. “The Tribe has long maintained a positive working relationship with the state of Colorado, and looks forward to the collaboration with CPW and CDOT to bring this important project into reality.”
Organizations and agencies as well as their contributions toward the project include:
$8.6 million from CDOT
$1.3 million from the Southern Ute Indian Tribe
$750,000 from CPW
$317,000 from the National Fish and Wildlife Foundation
$100,000 from Mule Deer Foundation (via a private donor)
$75,000 from the Rocky Mountain Elk Foundation
Cady added, “Not only have several agencies and organizations come forward with valuable funding commitments, some agencies have also contributed with studies, research and development plans to make the project possible.”
The Colorado Wildlife and Transportation Alliance, a consortium of federal and state agencies, academics, nonprofits, biologists, and engineers, played a significant role in developing the unique financial partnerships to advance the southwest Colorado project. Additionally, along with their financial backing, the Southern Ute Tribe provided support with critical Global Positioning System data which identified seasonal migration patterns and habitat in the area.
The project site is located on U.S. 160 in Archuleta County, centered at the CO Highway 151 intersection, near Lake Capote and Chimney Rock National Monument. The project will span for approximately two miles on U.S. 160, about 13 miles west of Pagosa Springs and 37 miles east of Durango, between mile points 126-128.
Work will include:
construction of a wildlife underpass structure just west of the U.S. 160 and CO 151 intersection at MP 126.8
construction of a wildlife overpass structure just east of the U.S. 160 and CO 151 intersection at MP 127.3
installation of an 8-foot-tall exclusion fence along both sides of U.S. 160 throughout the project limits, approximately a two-mile stretch from MP 126 – 128
construction of earthen escape ramps and deer guards along the length of fencing
installation of a large deer guard on CO 151 at the approach to U.S. 160, similar to a cattle guard but much wider to prevent deer from jumping across and into the highway corridor
extension of the existing westbound passing lane on U.S. 160 at the CO 151 intersection
extension of the westbound left-turn acceleration lane on U.S. 160 at the CO 151 intersection
More than 60% of all crashes in the project area are attributed to wildlife-vehicle collisions. Without treatment, these numbers are expected to grow as wildlife-vehicle crashes continue to show an increasing trend since 2012. The project’s wildlife mitigation features will greatly enhance the safety of this highway corridor for both motorists and wild animals and are expected to reduce those wildlife-vehicle collisions by at least 85%. Graphic credit: Colorado Parks & Wildlife
The construction project, awarded to Ralph L. Wadsworth Construction Co. of Utah for $7.95 million, will be completed within one construction season, breaking ground next spring and wrapping up by the fall of 2021. The total cost of the project is approximately $11.3 million, including design and planning.
CDOT has built more than 60 wildlife mitigation structures crossing above or under highways throughout the state. Additionally, almost 400 miles of high big game fencing has been installed along state and U.S. highways or next to the interstates.
FromColorado Public Radio (Michael Elizabeth Sakas):
Carbon farmers
A conventional rancher turns cattle out onto pasture for several weeks or months. But that can lead to overgrazing and major damage to the land, especially during a drought. So the Gordons use portable electric fences to keep their cattle moving, mimicking how predators chase herd animals around.
“Whether it be elk or bison that used to be on an area for a short period of time, consuming that one bite or two of the vegetation, and they would move,” Matthew said. “And that’s when the magic happens of the recovery period.”
Since there’s still something left of that grass, it can use photosynthesis to regrow. Through that process, the plant captures carbon dioxide from the atmosphere and carries it down into the soil through a healthy root system.
“Carbon capture is kind of a buzzword these days, and they’re trying to develop technologies to do it when this is a technology that we’ve had for forever,” Matthew said.
It’s likely that Colorado’s drought will continue into 2021 and Gov. Jared Polis is urging farmers and ranchers to prepare for it. To adapt to climate change, some producers are learning techniques that can also help trap and store carbon.
Industrial farming like intensive tillage, animal feedlots and the use of chemical fertilizers and pesticides, have done a lot of damage to soil ecosystems worldwide. The United Nation’s Food and Agriculture Organization estimates that the world could run out of topsoil in about 60 years at the current rate of degradation.
Nicole Civita, the sustainable food systems specialization lead at the University of Colorado Boulder, said before farmers and ranchers started to plow up the prairies, there was a “really complex, rich ecosystem.”
“We took what had developed over millennia and had been really well managed by indigenous communities, and destroyed it all very, very quickly to our own peril,” Civita said.
Regenerative agriculture is considered an important climate solution since it has the potential to draw down a lot of carbon. One technique that the U.S. Department of Agriculture tracks is the use of cover crops, which help promote healthy soil instead of leaving the ground bare between harvests.
Support and funding
From 2012 to 2017, there was a 2.8 percent increase in cover crop acreage in Colorado, USDA data shows. But only about 1 percent of the total crop acreage planted in Colorado was used for cover crops.
While more farmers and ranchers are adopting regenerative agriculture techniques, they make up a small number overall. Civita said that it’s not what most producers know.
“There’s a knowledge gap that we need to bridge because we have been farming in agrochemical-ly intensive ways for a long time,” she said…
Farmers and ranchers often need financial support to make the shift. Colorado has created a soil health program to help, but there’s no state funding for it yet. For now, the program is funded by a $5 million partnership with the USDA.
The Gordons got a microloan from a local nonprofit to help them start.
This map shows the snowpack depth of the Maroon Bells in spring 2019. The map was created with information from NASA’s Airborne Snow Observatory, which will help water managers make more accurate streamflow predictions. Jeffrey Deems/ASO, National Snow and Ice Data Center
Front Range water providers are hoping to expand a program that uses a new technology they say will revolutionize water management in Colorado. But for now, the expensive program isn’t worth it for smaller Western Slope water providers.
The Northern Colorado Water Conservation District is seeking state grant money to expand the Colorado Airborne Snow Observatory program. The ASO program uses remote-sensing lasers on airplanes known as LiDAR, which stands for light detection and ranging, to precisely measure snow depth…
The technology creates a much clearer picture of how much water is contained in the snowpack and has been used in pilot studies in the Gunnison River basin and for Denver Water.
But these flights have been scattered and lack consistent funding. A geographically expanded program with consistent funding would revolutionize water management in Colorado, according to the grant application.
“This technology is kind of a no-brainer when it comes to helping us understand what water we have to work with each year,” said Laurna Kaatz, the climate science, policy and adaptation program manager for Denver Water. “We know ASO adds value and is kind of the game-changer in water management.”
Denver Water, which provides water to 1.4 million people along the Front Range, is the ASO expansion project manager, while Northern Water is the fiscal agent. The Colorado, South Platte, Metro, Gunnison and Arkansas basin roundtables have each committed $5,000 toward the project.
The project would not fund the flights themselves but would be used to develop an expanded, collaborative, well-funded plan to identify which basins to fly each year.
A flight from NASA’s Airborne Snow Observatory gathers data about the snowpack above Dillon Reservoir on a flight. Information gathered from the flight helped Denver Water manage reservoir operations. Photo courtesy of Quantum Spatial
SNOTEL limitations
Important data points that water managers and streamflow forecasters use for measuring snowpack — and the water contained in that snowpack, known as snow-water equivalent (SWE) — are snow-telemetry (SNOTEL) sites, a network of remote sensing stations throughout Colorado’s mountainous watersheds that collect weather and snowpack information. But they provide just a snapshot of conditions at one location.
“A large amount of SWE is in that high-elevation snow band, which doesn’t get captured by the SNOTEL program,” said Steve Hunter, utilities resource managers for the city of Aspen.
In the spring of 2019, Denver Water learned just how valuable ASO technology is in predicting runoff. Data from a June ASO flight showed there was about 114,000 acre-feet of water in the snow above Dillon Reservoir, Denver Water’s largest storage pool, even though SNOTEL sites, at about 11,000 feet, registered as melted out already. The water provider increased outflows from Dillon so they could make room for the coming snowmelt and avoid downstream flooding.
“I think this is going to revolutionize water management in the West,” Kaatz said. “If you have the ability to have more information and we know that it’s accurate information, it is gold in the water industry.”
This map shows the snowpack depth of Castle and Maroon valleys in spring 2019. The map was created with information from NASA’s Airborne Snow Observatory, which will help water managers make more accurate streamflow predictions. Jeffrey Deems/ASO, National Snow and Ice Data Center
Expensive technology
ASO technology was developed by NASA and researchers at the National Snow and Ice Data Center at the University of Colorado Boulder. But the technology is expensive — between $100,000 and $200,000 per flight, according to Kaatz — and still not worth it for smaller Western Slope municipal water providers who don’t have to carefully coordinate the operation of large reservoirs.
The city of Aspen and the Eagle River Water & Sanitation District are part of the collaborative workgroup helping to create the ASO program expansion plan. Other entities include Colorado Springs Utilities, city of Fort Collins, city of Boulder, city of Greeley, Thornton Water, Pueblo Water, Aurora Water, city of Westminster, Ruedi Water Power and Authority, and the Colorado River Water Conservation District.
Hunter said more data is better when it comes to managing Aspen’s water supply, which comes from Castle and Maroon creeks. The city is trying to install a SNOTEL site and another stream gauge in its watershed. Hunter said the collaborative workgroup has also been exploring ways to sustainably fund an expanded ASO program.
“Airborne measurements of both snow depth and density to come up with your SWE is a great alternative, but it’s cost prohibitive,” Hunter said. “If they have this great technology but nobody can use because nobody can afford it, that doesn’t help anybody.”
Water managers for Eagle River Water & Sanitation District, which supplies water to the Vail Valley, said that although they are participating in the workgroup meetings and find the science interesting and useful, the expense is not something they can bite off right now. Their reservoirs are small and mostly used for augmentation, not to supply municipal water.
“I think there’s value in the whole system and understanding the water that’s available,” said Len Wright, the senior water resources engineer for Eagle River Water & Sanitation District. “But we don’t have anything that would justify the expense right now.”
Northern Water and Airborne Snow Observatories, Inc. will each contribute $5,000 worth of in-kind services to the project. Also, Denver Water will contribute $10,000 in-kind and the collaborative workgroup will give $24,000 of in-kind services. The Colorado Water Conservation Board is being asked for $20,000 from the statewide Water Supply Reserve Fund account and is scheduled to consider the grant application at its March meeting.
Aspen Journalism is a local, nonprofit, investigative news organization covering water and rivers in collaboration with The Aspen Times and other Swift Communications newspapers. This story ran in the Dec. 5 edition of The Aspen Times.
One of the two Twin Otter aircraft used by the Airborne Snow Observatory mission to study snowpack in the Western U.S. Credit: NASA
Ephemeral streams are streams that do not always flow. They are above the groundwater reservoir and appear after precipitation in the area. Via Socratic.org
From the EHS Daily Advisor (Lisa Whitley Coleman):
In November, the EPA asked the 10th Circuit Court of Appeals in Colorado to restore its definition of waters that are protected by the Clean Water Act (CWA)…
“The territorial seas and traditional navigable waters,”
“Perennial and intermittent tributaries to those waters,”
“Certain lakes, ponds, and impoundments,” and
“Wetlands adjacent to jurisdictional waters.”
The final definition “provides clear exclusions for many water features that traditionally have not been regulated, and defines terms in the regulatory text that have never been defined before,” according to the EPA. “Congress, in the Clean Water Act, explicitly directed the Agencies to protect ‘navigable waters.’ The Navigable Waters Protection Rule regulates the nation’s navigable waters and the core tributary systems that provide perennial or intermittent flow into them.”
In July, final changes to the rule were published by the EPA to implement section 401 of the CWA that many characterized as gutting a 50-year history of state and tribal water quality regulation.
“This section allows states and tribal nations to protect health and human safety within their geographic boundaries by making permitting decisions related to the discharge of waste into state waterways,” according to a press release published by the Washington State Office of the Attorney General. The press release went on to say that the rule would “handicap states’ abilities to regulate water quality.”
In July, Washington Attorney General Bob Ferguson filed suit against the EPA and the Army Corps of Engineers in the U.S. District Court for the Northern District of California. The case is co-led by New York and California and was joined by Colorado, Connecticut, Illinois, Maine, Maryland, Massachusetts, Michigan, Minnesota, Nevada, New Jersey, New Mexico, North Carolina, Oregon, Rhode Island, Vermont, Virginia, Wisconsin, and the District of Columbia.
The lawsuit alleges that the new rule “unlawfully violates the plain language, intent and established case law interpreting the Clean Water Act.”
“The final rule forces states to issue permits based on an incomplete review of what effects industries will have on waterways,” according to the Washington attorney general’s press release. “States will only be able to consider a narrow range of impacts these projects have on water quality, even when the consequences cause far-reaching and even irreversible environmental damage. The rule also limits the amount of information industry must provide, unreasonably reduces the amount of time states have to make decisions or deny permits and attempts to grant the federal government oversight of projects rather than states.”
Environmental and conservations groups estimate the final rule leaves 50% of U.S. wetlands and millions of miles of streams unprotected, according to the Milwaukee Journal Sentinel…
Colorado
Colorado met with success in the U.S. District Court for the District of Colorado, where an injunction was granted to stop the rule within the state. “The court found that Colorado met the bar for preliminary injunction and agreed to freeze the rule until the litigation plays out,” according to E&E News.
Colorado’s case says the new rule is “significantly narrower” than prior WOTUS definitions and is “inconsistent with case law on the scope of the CWA and abandons the ‘significant nexus’ test laid out in U.S. Supreme Court Justice Anthony Kennedy’s concurring opinion in the 2006 case Rapanos v. United States,” according to Law Week Colorado. “According to this test, wetlands or non-navigable bodies of water fall under the CWA if they ‘significantly affect the chemical, physical and biological integrity of other covered waters more readily understood as ‘navigable.’”
The 10th Circuit convened a remote three-judge panel to hear the EPA’s motion to overturn the injunction, during which Deputy Assistant Attorney General for the U.S. Department of Justice Jonathan Brightbill “argued the rules were narrowed to provide clarity in the wake of three Supreme Court cases.”
“Against this thoughtful interpretation of navigable waters and in light of the Supreme court precedent, including the SWANCC decision which definitively holds there is a stopping point to the term navigable waters short of the Interstate Commerce Clause, Colorado points only to generalized objective provisions of the Clean Water Act,” Brightbill said in a Courthouse News Service article, referring to the 2001 case Solid Waste Agency of Northern Cook County v. U.S. Army Corps of Engineers.
Representing the state of Colorado, State Solicitor General Eric Olson emphasized that important protections are missing from the new WOTUS definition.
Bobby Ray Baldock, senior U.S. Circuit judge, pointed out that Colorado could correct the issue with legislative measures.
“Olson explained that Colorado is one of 48 states that previously relied on the federal permitting system and that the new rule was implemented during a state legislative session shortened by Covid-19,” according to Courthouse News. “We absolutely agree we could put in a regulatory regime that could fill that gap, but we can’t do that in 60 days, which is all that they gave us under the rule,” Olson said.
U.S. Circuit Judge Carolyn McHugh disagreed. “That’s self-inflicted because the Colorado approach has been there will be no dredge-and-fill permits,” McHugh countered, according to Courthouse News. “The [federal] response was you’ve known since the executive order was signed, isn’t that fair notice?”
A massive drought developed over much of the western United States during 2020. The dry conditions fueled historic wildfires, many of which set new all-time records for size in states including Colorado and California. As of early December, several large cities in the west have recorded less than 10 inches of water for the year, and some are under 5 inches, such as Phoenix and Las Vegas.
West Drought Monitor December 1, 2020.
High Plains Drought Monitor December 1, 2020.
Colorado Drought Monitor December 1, 2020.
When the U.S. Drought Monitor released their weekly report in early December nearly 3/4 of the state of Colorado was classified as being in either extreme or exceptional drought. The rest of the state is in either moderate or severe drought.
At the official weather station for Denver, which is located at Denver International Airport, 8.17 inches of rain and melted snow was measured between January 1 and December 6. That lands 2020 in 5th place on the list of top 5 driest years since records began in 1872…
t’s pretty safe to assume that Denver will end in the top 10 driest years in recorded history based off the current weather trend. There is also a decent chance it will hold the current position on the top 5 list.
The Cameron Peak fire soon after it started on Aug. 13, 2020. By Sept. 11, the fire had grown to more than 102,000 acres (now >200,000 acres) and was not expected to be considered out until Oct. 31. Photo credit: InciWeb via The Colorado Sun
One year ago, exactly zero parts of Colorado were officially designated as being abnormally dry or in drought. What a difference a year makes.
Now, even as the ski season starts up, every corner of our state is facing drought conditions. As the effects of unchecked climate change continue to worsen, these conditions, which previously would have been considered extreme, are sadly becoming the new normal, and the impacts are wide ranging.
As Coloradans know all too well, these hot, dry conditions played a significant role in fueling wildfires that tragically steal away lives, communities and our beloved natural landscapes. Images from recent months of families fleeing burning homes and beleaguered firefighters waging battle while air tankers swoop overheard are pictures that we won’t soon forget.
Some of these record-breaking wildfires — like Cameron Peak — are still burning, even as it snows. Last year, the Fern Creek Fire burned all winter, in a place where fire has not occurred in 500 years.
The impacts of these disasters stretch well beyond the fire lines, and have downstream effects on our precious rivers and waterways.
Colorado’s mountains supply water to seven downstream states and the wildfires can directly impact the quantity and quality of that water. This problem is likely to only worsen in the years and decades ahead, which is why we need to take action now to safeguard our water supplies and ensure that our state’s vital natural resources are protected.
This may seem like a daunting problem, but there is so much that our society can do. Fortunately, voters know that protecting our water is critical. Colorado voters are notoriously anti-tax, but on Nov. 3, voters in 23 Colorado counties approved two ballot measures to protect our water and rivers. That follows 2019, where statewide voters approved a measure to provide as much as $29 million annually to implement Colorado’s Water Plan. Similar local county measures were enacted in 2016 and 2018.
The results are clear: Coloradans are aware of the threats facing our water supplies and are willing to dedicate state resources toward preserving and protecting them.
The dollars from these measures are critical and will go a long way toward protecting our water for future Coloradans, but only if we leverage them in the right ways and build on a coalition. This is an all-hands-on-deck moment, and if we’re serious about tackling these issues we need to marshal all of the support we can find and elicit the help of as many stakeholders as possible.
The federal government can help by funding water conservation efforts by both cities and the agricultural sector, who have both been largely leading the charge. It also can help support natural water storage and build on “natural infrastructure,” i.e. natural or naturalized areas that are strategically managed to conserve the ecosystem’s protective functions while also providing economic and societal benefits.
What does that mean in layman’s terms? It means providing jobs to restore healthy forests. It means safeguarding the wetlands and streams that naturally clean our water, provide firebreaks, and support the wildlife and scenery for which our state is famous. We know these techniques can work, we just need the resources to properly implement them.
And the only way to protect enough forests, wetlands and streams at a big enough scale to make a difference is to layer public funds with other sources of funding in creative ways. The innovative Environmental Impact Fund under development in southwest Colorado is a perfect example of such creativity.
This fund is the result of years of partnerships and collaboration that have brought all stakeholders together with local leadership — homeowners, water providers, agriculture, hikers and agencies. They are working together to combine and leverage funding so that they can protect forests and water resources in a coordinated and cost-efficient way that provides jobs, reaches economies of scale, and protects the community and its water for people, agriculture and nature.
Finally, let’s not forget that all of this helps implement Colorado’s Water Plan, which is currently marking its fifth anniversary. The plan was developed with input from community leaders and residents throughout the state. The resulting plan outlines solutions to address the gap between our finite water supplies and demand, while setting a goal of achieving 400,000 acre-feet of municipal and industrial water conservation savings by 2050. It also outlines steps for maintaining our vital agricultural economy, which bolsters our communities while supplying food and fiber around the world.
Studies show that the entire American Southwest is on the precipice of a historic megadrought, which means that our climate and ecosystems are entering into uncharted territory. The future is already here: We must act now to help our communities and environment navigate future wildfires and intensifying drought.
Protecting Colorado’s rivers and streams today means acting to protect future generations of Coloradans. But we’re Coloradans. We have proven that water is an issue that unites us, and we are poised to lead the nation on creative and effective solutions to address this issue head-on.
Jill Ozarski is a program officer in the Environment Program focusing on the Colorado River initiative for the Walton Family Foundation.
There’s new evidence about the extent of pollution from PFAS compounds—the so-called “forever chemicals”—that were used in non-stick cookware and many other products like firefighting foam and food packaging. PFAS has been linked to suppressed immune function, cancers, and other human health issues. Now, the compounds have been found in a mosquito pesticide, Anvil 10+10, which has been widely applied across the country and could be contaminating water supplies with the toxins.
Mosquito abatement | Credit: Don McCullough/Creative Commons via H2O Radio
Anvil is sprayed from helicopters, airplanes, and trucks and is used in at least 25 states from Massachusetts to California. A group known as Public Employees for Environmental Responsibility (PEER) found PFAS in Anvil samples, and as the Boston Globe reports, the state of Massachusetts confirmed the pesticide contains the compounds. Given the widespread use of the pesticide over the years, specialists say it’s likely that the chemicals have leached into groundwater and other water sources.
The Clarke company, which makes the product, said no PFAS ingredients are used in the formulation of Anvil, but acknowledged the chemicals could have been introduced though manufacturing or packaging. Officials at EPA, who’ve been criticized for delaying new standards to reduce PFAS exposure, said they were looking into the findings and plan to conduct their own analysis.
A representative of PEER said it’s frightening that we do not know how many other pesticides, insecticides, or even disinfectants contain PFAS.
Food & Water Watch executive director Wenonah Hauter declared that these findings shock the conscience and that states likely have unknowingly contaminated communities’ water with PFAS hidden in pesticides, and she charged that, once again, the EPA has failed to protect the American people from harmful pollution.
Marine stratocumulus clouds from the Pacific Ocean stream atop Chile’s Atacama Desert. Marine stratocumulus cover vast swaths of the tropical and subtropical oceans, where they reflect large amounts of sunlight and provide an overall cooling effect on climate. New global climate models are showing the potential for more global warming than long thought, perhaps due to a reduction in low-level clouds such as marine stratocumulus. Image credit: NCAR/UCAR Image and Multimedia Gallery.
The Intergovernmental Panel on Climate Change (IPCC) has opened a meeting in hybrid format to consider essential business as work on the Sixth Assessment Report advances amid the challenges of the COVID-19 pandemic.
Representatives of the IPCC’s 195 Member countries, meeting in the 53rd Session of the Panel, will convene for the first time in a format combining exchanges in writing and online discussions, as a face-to-face meeting remains impossible.
The main business of the 53rd Session will be to agree the IPCC budget for the coming year. This Session of the Panel will reconvene in early 2021 to consider other urgent business matters.
The Panel is meeting as members of the IPCC Bureau and authors continue their work on AR6. The pandemic has led to delays of 3-4 months in some of the milestones for the preparation of AR6 this year, and the release dates of the report remain under review.
In a letter to delegates opening the Session, IPCC Chair Hoesung Lee thanked the Secretariat for finding a way to hold a meeting that was consistent with the IPCC Principles and Procedures and did not disadvantage any delegates on the basis of connectivity or time zones.
“Their determination to keep the business of the IPCC flowing smoothly parallels the huge efforts and creativity of the Working Groups and their authors and Technical Support Units to advance work on the Sixth Assessment Report despite the pandemic,” he said.
The Intergovernmental Panel on Climate Change (IPCC) is the UN body for assessing the science related to climate change. It was established by the United Nations Environment Programme (UNEP) and the World Meteorological Organization (WMO) in 1988 to provide political leaders with periodic scientific assessments concerning climate change, its implications and risks, as well as to put forward adaptation and mitigation strategies. In the same year the UN General Assembly endorsed the action by the WMO and UNEP in jointly establishing the IPCC. It has 195 member states.
Thousands of people from all over the world contribute to the work of the IPCC. For the assessment reports, IPCC scientists volunteer their time to assess the thousands of scientific papers published each year to provide a comprehensive summary of what is known about the drivers of climate change, its impacts and future risks, and how adaptation and mitigation can reduce those risks.
The IPCC has three working groups: Working Group I, dealing with the physical science basis of climate change; Working Group I, dealing with impacts, adaptation and vulnerability; and Working Group III, dealing with the mitigation of climate change. It also has a Task Force on National Greenhouse Gas Inventories that develops methodologies for measuring emissions and removals.
IPCC assessments provide governments, at all levels, with scientific information that they can use to develop climate policies. IPCC assessments are a key input into the international negotiations to tackle climate change. IPCC reports are drafted and reviewed in several stages, thus guaranteeing objectivity and transparency.
About the Sixth Assessment Cycle
Comprehensive scientific assessment reports are published every 6 to 7 years; the latest, the Fifth Assessment Report, was completed in 2014 and provided the main scientific input to the Paris Agreement.
At its 41st Session in February 2015, the IPCC decided to produce a Sixth Assessment Report (AR6). At its 42nd Session in October 2015 it elected a new Bureau that would oversee the work on this report and Special Reports to be produced in the assessment cycle. At its 43rd Session in April 2016, it decided to produce three Special Reports, a Methodology Report and AR6.
The IPCC also publishes special reports on more specific issues between assessment reports.
Global Warming of 1.5°C, an IPCC special report on the impacts of global warming of 1.5 degrees Celsius above pre-industrial levels and related global greenhouse gas emission pathways, in the context of strengthening the global response to the threat of climate change, sustainable development, and efforts to eradicate poverty was launched in October 2018.
Climate Change and Land, an IPCC special report on climate change, desertification, land degradation, sustainable land management, food security, and greenhouse gas fluxes in terrestrial ecosystems was launched in August 2019, and the Special Report on the Ocean and Cryosphere in a Changing Climate was released in September 2019.
In May 2019 the IPCC released the 2019 Refinement to the 2006 IPCC Guidelines on National Greenhouse Gas Inventories, an update to the methodology used by governments to estimate their greenhouse gas emissions and removals.
The contributions of the three IPCC Working Groups to the Sixth Assessment Report are currently under preparation. The concluding Synthesis Report is due in 2022.
The website includes outreach materials including videos about the IPCC and video recordings from outreach events conducted as webinars or live-streamed events.
Most videos published by the IPCC can be found on our YouTube channel.
The IPCC is currently in its Sixth Assessment cycle, during which the IPCC will produce the Assessment reports of its three working groups, three special reports, a refinement to the methodology report and the Synthesis report. The Synthesis Report will be the last of the AR6 products, due for release in 2022.
According to IPCC procedures the Synthesis Reports (SYRs) should “synthesise and integrate materials contained within the Assessment Reports and Special Reports” and “should be written in a non-technical style suitable for policymakers and address a broad range of policy-relevant but policy-neutral questions approved by the Panel”. They are composed of two sections, a Summary for Policymakers (SPM) of 5 to 10 pages and a longer report of 30 to 50 pages.
The writing of AR6 SYR will be based on the content of the three Working Groups Assessment Reports: WG1 – The Physical Science Basis, WG2 – Impacts, Adaptation and Vulnerability, WG3 – Mitigation of Climate change, and the three Special Reports: Global Warming of 1.5°C, Climate Change and Land, The Ocean and Cryosphere in a Changing Climate.
It might also take into account issues considered in other global assessment (such as Intergovernmental Platform for Biodiversity and Ecosystem Services and UN Environment’s Sixth Global Environment Outlook), if those issues are also addressed in the above-mentioned reports.
AR6 SYR will be finalized in the first half of 2022 in time for the first global stocktake under the Paris Agreement.
East Troublesome Fire. Photo credit: Brad White via The Mountain Town News
FromThe Sky-Hi News (Amy Golden) via The Summit Daily:
Formal damage assessments for structures in the county have been completed after the East Troublesome Fire scorched through nearly 200,000 acres in northern Grand County. According to those reports, 555 structures were destroyed, nine buildings suffered major damage and 34 sustained minor damage.
Among the buildings destroyed, 366 were residential and 189 were outbuildings. More than 200 were people’s primary residences.
Two surveys went out — one to evacuees and one to homeowners — to begin connecting those in need of a place to stay with those willing to lease out their home. Darland said more than 190 homeowners signed up to offer their houses to the roughly 50 families who responded needing some sort of housing.
However, many of these homes are only available through the spring. Darland and the county are working with community partners like Snow Mountain Ranch and Sun Communities to find a longer-term solution while seeking funding from state and federal sources…
Ten buildings belonging to businesses were also destroyed in the fire.
That includes buildings at C Lazy U Ranch, Winding River Ranch and Highland Marina. Two longtime outfitters in the area — Dave Parri’s Outfitting & Guide Service and Samuelson Outfitters — have also suffered heavy losses.
Three generations of the Samuelson family have operated in the Troublesome Basin for more than half a century. Cathy Samuelson and her husband Richard “Sambo” Samuelson lost most of the 2020 hunting season because of the fire and two of their camps were destroyed. Two employees lost their homes in the fire as well…
East Troublesome Fire and Cameron Peak Fire map via Inciweb December 7, 2020.
Acreage-wise, the fire burned almost 15% of the land in Grand County. With tourism and recreation being Grand’s primary economic driver, the burn scar over public lands — spanning Bureau of Land Management, US Forest Service and Rocky Mountain National Park — could hamper tourism for years to come.
The county said many ranches have reported a significant or total loss of hay intended for winter feeding of livestock. Damages and impacts associated with agricultural land and operations are ongoing.
The burned lands incorporated significant grazing leases held by local producers, and impacts to agriculture irrigation supply and delivery are being assessed…
In a letter to the Colorado Department of Public Safety, the estimated costs of the county’s response has been roughly $352,000 as of Nov. 12. Those expenses include $80,000 for staff, logistics and emergency protective actions in the Office of Emergency Management; $150,000 for evacuations and emergency protective actions for the Grand County Sheriff; and $76,000 in overtime for county government employees…
Before the East Troublesome Fire, the county had been battling the nearly 15,000-acre Williams Fork Fire for over a month. Other fires the county responded to during this dry year included the Dice Hill Fire just on the other side of the Summit County line and the Deep Creek Fire outside Kremmling.
Debris removal from the East Troublesome Fire will likely be too much for the county to handle alone. Grand has estimated that debris could exceed over 30,000 cubic yards and cost more than $27 million to haul off…
Water’s depths
Various watersheds hit by the fire — including the Poudre River, North Fork of the Big Thompson River, North Fork Colorado River, Three Lakes, Willow Creek and the East Troublesome Creek — are expected to feel the effects for a long time.
These impacts will reach far beyond Grand County, which supplies water to major cities on the northern Front Range. Northern Water provides water to more than a million people, which is equal to 615,000 irrigated acres in northern Colorado.
“Sedimentation, debris flows and water contamination will threaten drinking water supplies for years to come,” the commissioners said.
Other environmental impacts like erosion and forest health are only just beginning to be evaluated.
Hazard tree removal is another concern, as fire damage has made many trees in the burn area a falling hazard. The Colorado State Forester estimates over 1,000 trees will need to be removed in county right of ways…
Estimates peg the overall damage from the fire at nearly $200 million. That amount could go up as the aftermath grows clearer.
A burnt sign on Larimer County Road 103 near Chambers Lake. The fire started in the area near Cameron Peak, which it is named after. The fire burned over 200,000 acres during its three-month run. Photo courtesy of Kate Stahla via the University of Northern Colorado
From the University of Northern Colorado (Kate Stahla):
Ash darkens the sky. The sun is completely blacked out. Everything has an eerie orange glow. Cinders rain down and cover every surface with soot. This isn’t some apocalyptic movie or dystopian future. This is real life on the Colorado Front Range.
2020 has been an active fire year. Four of Colorado’s top five wildfires burned this year. Air quality on the front range has been dire, especially considering the ongoing respiratory pandemic. Now that the two largest fires of the summer are now both sitting at 100% containment, Colorado must face its increasingly flammable future.
The Cameron Peak fire started Aug. 13 in the mountains near Chambers Lake. It smoldered for months until a mid-October wind storm propelled it into becoming the largest wildfire in Colorado history. By the time fire crews completely contained it, on Dec. 3, it had burned up over 200,000 acres.
The East Troublesome fire has an even more explosive story. The fire was reported near Parshall Oct. 14 and contained Nov. 30, but in that short span grew to be the state’s second-largest fire. The fire grew by over 87,000 acres between Oct. 21 and 22, destroyed parts of Grand Lake and threatened Granby and Estes Park.
These fires were a consequence of the long-term drought and pine beetle epidemic that Colorado is facing. According to the official incident report for the East Troublesome fire, between 60-80% of trees burned had already been killed by pine beetles. That, combined with dry and windy conditions, created a perfect storm for fire conditions.
The outlook isn’t good for fires in the future. Many of the areas that were not burned are littered with downed and dead trees. According to the University of Nebraska-Lincoln, the entire state of Colorado is experiencing some form of drought. Some of the hardest hit areas are the headwaters of the Colorado and Cache la Poudre rivers — right where the fires started.
These watersheds are vital to the survival of the Front Range. Water from the Colorado river is pumped into the Big Thompson and supplies farms and cities throughout Northern Colorado. The Poudre river provides water and recreation to Fort Collins and Greeley. Because of the fires at their headwaters, flash floods and ash contamination are now more likely.
Ash and smoke blotted out the sky and directly impacted air quality on the Front Range. People were advised to stay inside and avoid exercising. Temperatures under the ash plumes could be 10 degrees lower than under the sun. UNC students, already coping with a deadly respiratory virus, also had to contend with dangerous levels of smoke. Callista Gallegos, a UNC student, had a difficult time facing both at once.
“Half the time I couldn’t go outside because I would not be able to breathe, so I was literally stuck inside and it was awful,” she said.
This year’s fire season is now over, but it contains lessons for the future. Colorado has been grappling with the effects of climate change for a while. Four of Colorado’s top five wildfires burned this year, and all of Colorado’s top ten wildfires have burned since 2000. Whether or not worse things are to come depends entirely on what actions are taken now.
Here’s the release from the Environmental Protection AgencyK:
Aggressively addressing per- and polyfluoroalkyl substances (PFAS) in the environment continues to be an active and ongoing priority for the U.S. Environmental Protection Agency (EPA). Today, the agency is announcing two important steps to address PFAS. First, EPA issued a memorandum detailing an interim National Pollutant Discharge Elimination System (NPDES) permitting strategy for addressing PFAS in EPA-issued wastewater permits. Second, EPA released information on progress in developing new analytical methods to test for PFAS compounds in wastewater and other environmental media. Together, these actions help ensure that federally enforceable wastewater monitoring for PFAS can begin as soon as validated analytical methods are finalized.
“Better understanding and addressing PFAS is a top priority for EPA, and the agency is continuing to develop needed research and policies,” said EPA Administrator Andrew Wheeler. “For the first time in EPA’s history, we are utilizing all of our program offices to address a singular, cross-cutting contaminant and the agency’s efforts are critical to supporting our state and local partners.”
“Managing and mitigating PFAS in water is a priority for the Office of Water as we continue our focus on meeting 21st century challenges,” said EPA Assistant Administrator for Water David Ross. “These actions mark important steps in developing the underlying science and permitting techniques to address PFAS in wastewater where the discharge of these chemicals may be of concern.”
EPA’s interim NPDES permitting strategy for PFAS provides recommendations from a cross-agency workgroup on an interim approach to include PFAS-related conditions in EPA-issued NPDES permits. EPA is the permitting authority for three states (Massachusetts, New Hampshire, New Mexico), the District of Columbia, most U.S. territories including Puerto Rico, Indian Country, and certain federal facilities. The strategy advises EPA permit writers to consider including PFAS monitoring at facilities where these chemicals are expected to be present in wastewater discharges, including from municipal separate storm sewer systems and industrial stormwater permits. The PFAS that could be considered for monitoring are those that will have validated EPA analytical methods for wastewater testing, which the agency anticipates being available on a phased-in schedule as multi-lab validated wastewater analytical methods are finalized. The agency’s interim strategy also encourages the use of best management practices where appropriate to control or abate the discharge of PFAS and includes recommendations to facilitate information sharing to foster adoption of best practices across states and localities.
In coordination with the interim NPDES permitting strategy, EPA is also providing information on the status of analytical methods needed to test for PFAS in wastewater. EPA is developing analytical methods in collaboration with the U.S. Department of Defense to test for PFAS in wastewater and other environmental media, such as soils. The agency is releasing a list of 40 PFAS chemicals that are the subject of analytical method development. This method would be in addition to Method 533 and Method 537.1 that are already approved and can measure 29 PFAS chemicals in drinking water. EPA anticipates that multi-lab validated testing for PFAS will be finalized in 2021. For more information on testing method validation, see https://www.epa.gov/cwa-methods.
Background
EPA continues to make progress under its PFAS Action Plan to protect the environment and human health, including:
Highlighted Action: Drinking Water
In December 2019, EPA accomplished a key milestone in the PFAS Action Plan by publishing a new validated method to accurately test for 11 additional PFAS in drinking water. Method 533 complements EPA Method 537.1, and the agency can now measure 29 chemicals.
In February 2020, EPA took an important step in implementing the agency’s PFAS Action Plan by proposing to regulate PFOA and PFOS drinking water.
EPA also asked for information and data on other PFAS substances, as well as sought comment on potential monitoring requirements and regulatory approaches.
In November 2020, EPA issued a memo detailing an interim National Pollutant Discharge Elimination (NPDES) permitting strategy for PFAS. The agency also released information on progress in developing new analytical methods to test for PFAS compounds in wastewater and other environmental media.
The recommendations provide a starting point for making site-specific cleanup decisions and will help protect drinking water resources in communities across the country.
In July 2020, EPA submitted the Interim Guidance on the Destruction and Disposal of PFAS and Materials Containing PFAS to OMB for interagency review. The guidance would:
Provide information on technologies that may be feasible and appropriate for the destruction or disposal of PFAS and PFAS-containing materials.
Identify ongoing research and development activities related to destruction and disposal technologies, which may inform future guidance.
EPA is working on the proposed rule to designate PFOA and PFOS as hazardous substances under CERCLA. In the absence of the rule, EPA has used its existing authorities to compel cleanups.
Highlighted Action: Monitoring
In July 2020, EPA transmitted the Unregulated Contaminant Monitoring Rule 5 (UCMR 5) proposal to the Office of Management and Budget (OMB) for interagency review. EPA anticipates proposing nationwide drinking water monitoring for PFAS that uses new methods that can detect PFAS at lower concentrations than previously possible.
Highlighted Action: Toxics
In September 2019, EPA issued an advanced notice of proposed rulemaking that would allow the public to provide input on adding PFAS to the Toxics Release Inventory toxic chemical list.
In June 2020, EPA issued a final regulation that added a list of 172 PFAS chemicals to Toxics Release Inventory reporting as required by the National Defense Authorization Act for Fiscal Year 2020.
In July 2020, EPA issued a final regulation that can stop products containing PFAS from entering or reentering the marketplace without EPA’s explicit permission.
Highlighted Action: Scientific Leadership
EPA continues to compile and assess human and ecological toxicity information on PFAS to support risk management decisions.
EPA continues to develop new methods to test for additional PFAS in drinking water.
The agency is also validating analytical methods for surface water, groundwater, wastewater, soils, sediments and biosolids; developing new methods to test for PFAS in air and emissions; and improving laboratory methods to discover unknown PFAS.
EPA is developing exposure models to understand how PFAS moves through the environment to impact people and ecosystems.
EPA is working to develop tools to assist officials with the cleanup of contaminated sites.
In July 2020, EPA added new treatment information for removing PFAS from drinking water.
Highlighted Action: Technical Assistance
Just as important as the progress on PFAS at the federal level are EPA efforts to form partnerships with states, tribes, and local communities across the country.
EPA has provided assistance to more than 30 states to help address PFAS, and the agency is continuing to build on this support.
These joint projects allow EPA to take the knowledge of its world-class scientists and apply it in a collaborative fashion where it counts most.
Highlighted Action: Enforcement
EPA continues to use enforcement tools, when appropriate, to address PFAS exposure in the environment and assist states in enforcement activities.
EPA has already taken actions to address PFAS, including issuing Safe Drinking Water Act orders and providing support to states. See examples in the PFAS Action Plan.
To date, across the nation, EPA has addressed PFAS in 15 cases using a variety of enforcement tools under SDWA, TSCA, RCRA, and CERCLA (where appropriate), and will continue to do so to protect public health and the environment.
Highlighted Action: Grants and Funding
Under this Administration, EPA’s Office of Research and Development has awarded over $15 million through dozens of grants for PFAS research.
In May 2019, EPA awarded approximately $3.9 million through two grants for research that will improve the agency’s understanding of human and ecological exposure to PFAS in the environment. This research will also promote a greater awareness of how to restore water quality in PFAS-impacted communities.
In September 2019, EPA awarded nearly $6 million to fund research by eight organizations to expand the agency’s understanding of the environmental risks posed by PFAS in waste streams and to identify practical approaches to manage potential impacts as PFAS enters the environment.
In August 2020, EPA awarded $4.8 million in funding for federal research to help identify potential impacts of PFAS to farms, ranches, and rural communities.
Highlighted Action: Risk Communications
EPA is working collaboratively to develop a risk communication toolbox that includes multimedia materials and messaging for federal, state, tribal, and local partners to use with the public.
Susan Greene talks mental health during drought in today’s The Colorado Sun. Click through and read the whole article. Here’s an excerpt:
Week after rainless week throughout the growing season has wounded not just local farmland, but also on the emotional landscape
Here in Kiowa County, farmers have always relied on whatever moisture happens to fall from the sky rather than on irrigation. In August, this 1,300-person community bordering on Kansas was the first part of Colorado where drought conditions surpassed “extreme” to a level meteorologists call “exceptional.”
That designation – which since has hit wide swaths of the West Slope – stands out on the drought map as a big brown pock.
Colorado Drought Monitor December 1, 2020.
Week after rainless week throughout this year’s growing season, it festered like a wound not just on local farmland, but also on the emotional landscape.
“It’s horrible, just horrible, the ways drought can affect the human mind,” says Jimmy Brown, a third-generation farmer in Eads whose wheat and grain sorghum crops withered this year, just like those of his neighbors. “I doubt there’s a person here whose mental health hasn’t been affected by it.”
The Eastern Plains have had dry spells. Some old-timers remember Dust Bowl conditions in the 1930s. Their children weathered extreme drought in the mid-1950s, and their children’s children endured acute dryness in 2002 and 2012. Each generation has taught the next to take the long view because they have learned that wishing – or praying – for rain doesn’t make it happen.
Yet nobody here can remember a year so parched that little grew higher than their work boots. No one recalls ground so dry that even the bindweed stopped growing. Nobody had seen so many rain clouds roll in late afternoons during monsoon season, only to watch them keep rolling eastward without bursting…
Brown, in addition to farming, serves as Kiowa County’s elected coroner and lone funeral director. He’s not a mental health expert, but is more tuned in than most to how locals are feeling. With drought, he says, comes uncertainty, even among majority of growers who carry insurance compensating them for the losses. With uncertainty come powerlessness, irritability and dread.