Trends in Atmospheric Carbon Dioxide — NOAA #ActOnClimate

CO2 at Mauna Loa. Credit: NOAA

Click the link to go to the Global Monitoring Laboratory website:

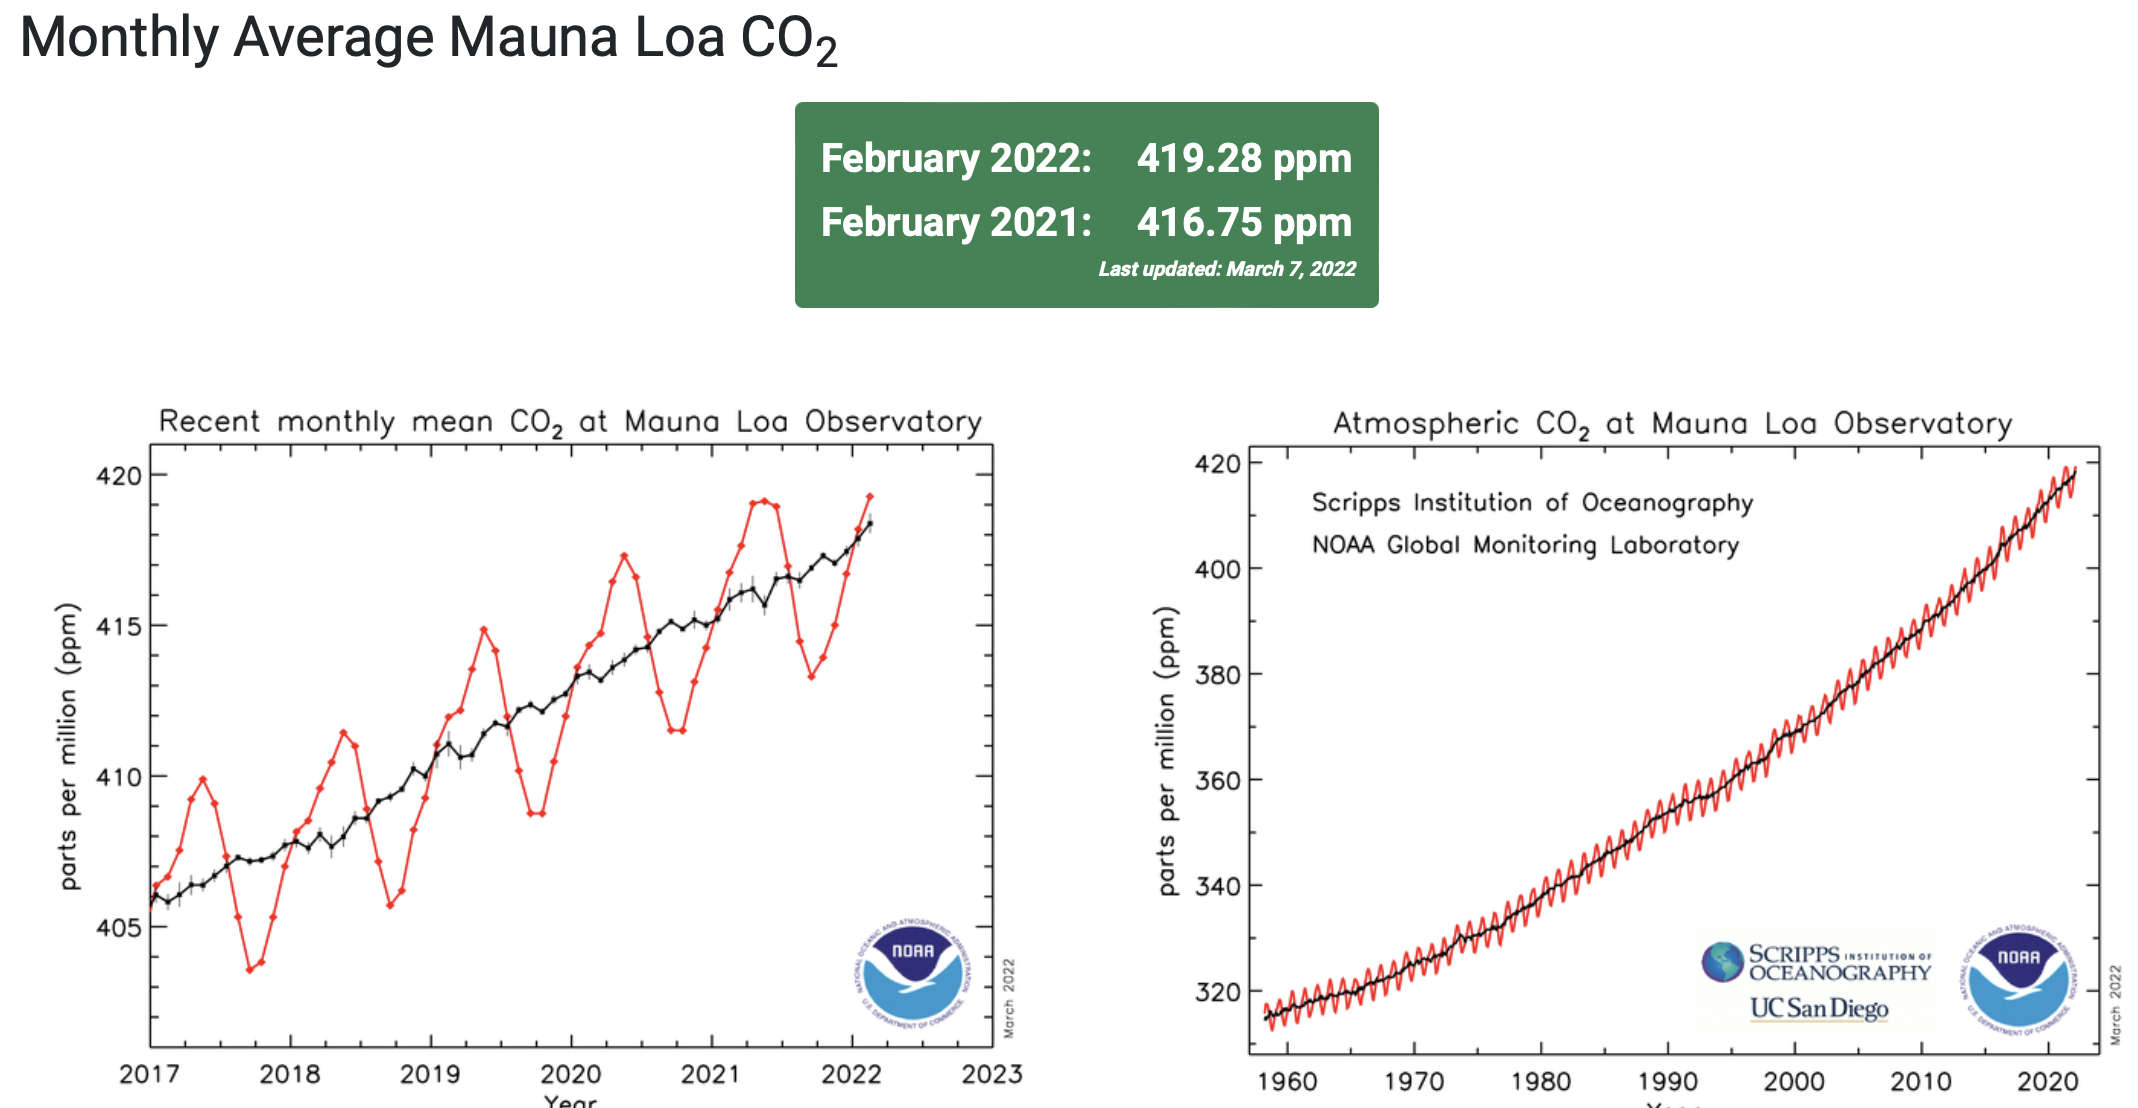
The graphs show monthly mean carbon dioxide measured at Mauna Loa Observatory, Hawaii. The carbon dioxide data on Mauna Loa constitute the longest record of direct measurements of CO2 in the atmosphere. They were started by C. David Keeling of the Scripps Institution of Oceanography in March of 1958 at a facility of the National Oceanic and Atmospheric Administration [Keeling, 1976]. NOAA started its own CO2 measurements in May of 1974, and they have run in parallel with those made by Scripps since then [Thoning, 1989].

The last five complete years of the Mauna Loa CO2 record plus the current year are shown in the first graph. The full record of combined Scripps data and NOAA data is shown in the second graph. Every monthly mean is the average of daily means, which are in turn based on hourly averages, but only for those hours during which “background” conditions prevail (see http://gml.noaa.gov/ccgg/about/co2_measurements.html for more information).

The red lines and symbols represent the monthly mean values, centered on the middle of each month. The black lines and symbols represent the same, after correction for the average seasonal cycle. The latter is determined as a moving average of SEVEN adjacent seasonal cycles centered on the month to be corrected, except for the first and last THREE and one-half years of the record, where the seasonal cycle has been averaged over the first and last SEVEN years, respectively.

The vertical bars on the black lines of the first graph show the uncertainty of each monthly mean based on the observed variability of CO2 in different weather systems as they go past the top of Mauna Loa. This is manifest in the deviations of daily means from a smooth curve that follows the seasonal cycle [Thoning, 1989]. We take into account that successive daily means are not fully independent, the CO2 deviation on most days has some similarity to that of the previous day. If there is a missing month, its interpolated value is shown in blue.

The last year of data are still preliminary, pending recalibrations of reference gases and other quality control checks. Data are reported as a dry air mole fraction defined as the number of molecules of carbon dioxide divided by the number of all molecules in air, including CO2 itself, after water vapor has been removed. The mole fraction is expressed as parts per million (ppm). Example: 0.000400 is expressed as 400 ppm.

The Mauna Loa data are being obtained at an altitude of 3400 m in the northern subtropics, and may not be the same as the globally averaged CO2 concentration at the surface.

Rapid Growth of #Wind and #Solar Could Help Limit Warming to 1.5 degrees C — Yale Environment 360 #ActOnClimate

NREL researcher Jordan Macknick and Michael Lehan discuss solar panel orientation and spacing. The project is seeking to improve the environmental compatibility and mutual benefits of solar development with agriculture and native landscapes. Photo by Dennis Schroeder, NREL

Click the link to read the article on the Yale Environment 360 website:

If wind and solar power continue the rapid growth they achieved over the last decade, rising by 20 percent annually until 2030, the global electricity sector will do its part to limit warming to 1.5 degrees C, according to a new report from climate think tank Ember.

In 2021, solar power grew by 23 percent worldwide, while wind power grew by 14 percent, close to the 20 percent average yearly growth seen in recent years. The Netherlands, Australia, and Vietnam saw the biggest renewable energy gains last year, with solar growing by 337 percent in Vietnam.

“If these trends can be replicated globally, and sustained, the power sector would be on track for 1.5 C,” the report said. “But those shifts aren’t happening fast enough across all countries, and we’re far off-track in reducing power sector emissions. The result in 2021 was coal’s rise, at a time when it needs to be falling rapidly.”

The pace of renewable energy growth needed to stay on track for 1.5 degrees C of warming. EMBER

Coal power grew 9 percent last year, its biggest gain since 1985, as a swift economic recovery drove up demand for power, and a spike in natural gas prices made coal more cost-competitive.

To keep warming under 1.5 degrees C, wind and solar will need provide 40 percent of the world’s power by 2030 and close to 70 percent by 2050, according to the International Energy Agency (IEA). Today, they supply just 10 percent of the world’s electricity.

Dave Jones, global lead at Ember, said that “with sustained high gas prices amid Russia’s war with Ukraine, there is a real risk of relapse into coal, threatening the global 1.5 degrees climate goal. Clean electricity now needs to be built on a heroic scale.”

A new study finds that the world can make the changes needed to keep warming under 1.5 degrees C while also maintaining economic growth. In one scenario modeled by researchers, renewables provide seven times as much power by the end of this century as they did in 2010, with the global economy growing by a little less than 2 percent a year from now until 2100. The paper was published in the journal Oxford Open Energy.

“Continuing global economic growth is clearly compatible with achieving the temperature target in the Paris Agreement,” said Paul Ekins, an economist at University College London and lead author of the study. “Governments now need to step up to put in place the policies to stimulate the investments that are required to turn these projections into reality.”

A turbine whirls on a farm east of Burlington, Colo. Colorado’s eastern plains already have many wind farms—but it may look like a pin cushion during the next several years. Photo/Allen Best

Success Story: Safe Water for a Disproportionately Impacted Community — Aqua Talk

Brighton Village mobile home park next to a river. Multiple trailers are intersperses with bare deciduous trees on a riverbank. Photo credit: Aqua Talk

Click the link to read the article on the Aqua Talk website (Amy Schultz and Jorge Delgado):

The Brighton Village mobile home community (Park) is a 28-home community in Adams County that serves around 80 people and is a disproportionately impacted community, defined in HB21-1266 Environmental Justice Disproportionate Impacted Community. The department initially issued an Enforcement Order in 2003 due to high nitrate values and the Park’s failure to comply with the nitrate maximum contaminant levels. Infants below the age of six months who drink water containing nitrate above the MCL could become seriously ill and, if untreated, may die. Symptoms include shortness of breath and blue baby syndrome.

The 2003 enforcement order was closed in 2010. However, the department again issued an Enforcement Order in 2012 for nitrate violations and did so again in 2018. The Park had installed treatment but did not have the capabilities or the resources to operate the treatment appropriately to reliably achieve compliance. The long-term exposure to an acute contaminant created environmental injustices for this community.

From the EPA, environmental justice is “the fair treatment and meaningful involvement of all people regardless of race, color, national origin, or income, with respect to the development, implementation, and enforcement of environmental laws, regulations, and policies.” The Colorado Environmental Justice Act recognizes that all people have a right to drink clean water and live free of dangerous levels of toxic pollution, experience equal protection of environmental policies, and share the benefits of a prosperous and vibrant pollution-free economy.

The department facilitated meetings with the Park and the City of Brighton. The City of Brighton and the Park decided that the best way to serve safe drinking water to the public was to connect the park to the City’s municipal water supply. However, the Park was required to upgrade its water distribution system before the connections could be made. The department provided the Park with $16,000 in grants that allowed the Park to connect to the municipal water supply.

The Safe Drinking Water Program worked in partnership with both the Park and City of Brighton to ensure this disproportionately impacted community is being provided with access to a consistent and reliable source of safe drinking water. This is an Environmental Justice win for the residents of this community, the department, and Colorado.

“Oh, The Gila River” Song … Protect the Gila River for Us! www.wildgilariver.org

Written and sung by young people who live and play along the Gila River, in Southwest New Mexico, this video is a plea to protect the Gila River for future generations. Give a listen, then go to http://www.wildgilariver.org to learn more.

Footage courtesy of the movie Hearts on the Gila-HeartsontheGila.com

Gila River. Photo credit: Dennis O’Keefe via American Rivers

Reclamation awards $3 million to 17 Tribes for water projects

Photo credit: The Ponca Tribe of Nebraska

Click the link to read the release on the Reclamation website (Peter Soeth):

The Bureau of Reclamation announced today that 17 Tribes in eight states will receive $3 million to support water management projects. The Native American Affairs Technical Assistance to Tribes Program supports Tribes through projects including water need studies, water quality data collection and assessments, and water measurement studies.

“Reclamation is committed to working with Tribes and Tribal organizations as they develop, manage and protect their water resources,” said Acting Commissioner David Palumbo. “This funding will help Tribes and Tribal Nations as they address the long-term drought and meet their critical water needs.”

This program provides Tribes financial assistance to implement projects to support their water management projects. This investment will complement the funding provided by Bipartisan Infrastructure Law’s investments to support Tribal communities and ensure they have the resources they need to bolster climate resilience and develop their water resources.

The Native American Affairs Technical Assistance Program is one part of how Reclamation is responding to drought and climate change across the West as part of the White House Interagency Drought Relief Working Group, part of the National Climate Task Force created by President Biden’s Executive Order on Tackling the Climate Crisis at Home and Abroad. The working group, chaired by the Departments of the Interior and Agriculture, is working to build upon existing resources and coordinate across the federal government, working in partnership with state, local, and Tribal governments to address the needs of communities suffering from drought-related impacts.

Projects

The funding will be provided to the Tribes as grants or cooperative agreements. The projects selected are:

  • Fort McDowell Pumping System Replacement, $200,000 (Arizona)
  • Fort Mojave Tribe Irrigation Pump Replacement, $200,000 (Arizona)
  • San Carlos Apache Water Metering Project, $200,000 (Arizona)
  • Big Valley Band Planning for Water Recycling/Reuse, $199,563 (California)
  • Chemehuevi Tribe Capacity Building, $10,000 (California)
  • Paskenta Band Water Resource Management Plan, $192,921 (California)
  • Robinson Rancheria Water Resource Planning, $191,695 (California)
  • Fort Belknap Indian Community Stock Watering Well Assessment, $200,000 (Montana)
  • Ponca Tribe Water Quality Baseline Assessment, $197,779 (Nebraska)
  • Walker River Paiute Tribe Climate Resilience Planning, $200,000 (Nevada)
  • Chickasaw Nation Irrigation System Efficiencies, $190,000 (Oklahoma)
  • Choctaw Nation Livestock Watering Improvements, $108,504 (Oklahoma)
  • Kiowa Tribe Groundwater Investigation, $200,000 (Oklahoma)
  • Muscogee (Creek) Nation Farm Pond Restoration, $200,000 (Oklahoma)
  • Klamath Tribes Phosphorus Removal Study, $199,383 (Oregon)
  • Umatilla Tribes Planning for Irrigation System Efficiencies, $194,239 (Oregon)
  • Snoqualmie Tribe Wetland Treatment Installation, $83,866 (Washington)
  • The March 2022 Northern Water E-Waternews is hot off the presses

    Screenshot of the Colorado-Big Thompson Project boundaries via Northern Water’s interactive mapping tool , June 5, 2019.

    Click the link to read the newsletter on the Northern Water website. Here’s an excerpt:

    Registration Full for Spring Water Users Meeting on April 13

    The Northern Water Spring Water Users Meeting is now at capacity and accepting names for a waitlist. The annual meeting is from 8 a.m.-2 p.m. on April 13 at the Embassy Suites in Loveland.

    The meeting includes time for water users throughout Northern Water boundaries to provide input regarding the 2022 quota level for the Colorado-Big Thompson Project. Information gathered at the meeting will be included in the data used by the Northern Water Board of Directors to set the quota at its monthly board meeting on April 14. If you would like to provide feedback regarding the quota via email, please email generaldelivery@northernwater.org by 5 p.m. on April 13.

    In addition, the meeting will provide an opportunity to learn about the latest activities being carried out by Northern Water, such as the construction of Chimney Hollow Reservoir, the restoration of lands damaged by the 2020 Colorado wildfires and the future of our forested source watersheds.

    To add your name to the wait list or if you have registered and are now unable to attend, please email events@northernwater.org.

    With a recent update of @NWSSPC ‘s database to include data from 2020, we’ve updated our #Colorado severe weather climatology page — @ColoradoClimate Center

    Click the link to go to the Colorado Climate Center website.