Forests to Faucets (and Headgates!) — John Fleck (InkStain) #SanJuanRiver #RioGrande

Informal collaborative governance in action. Photo credit: John Fleck/InkStain

Click the link to read the article on the InkStain website (John Fleck):

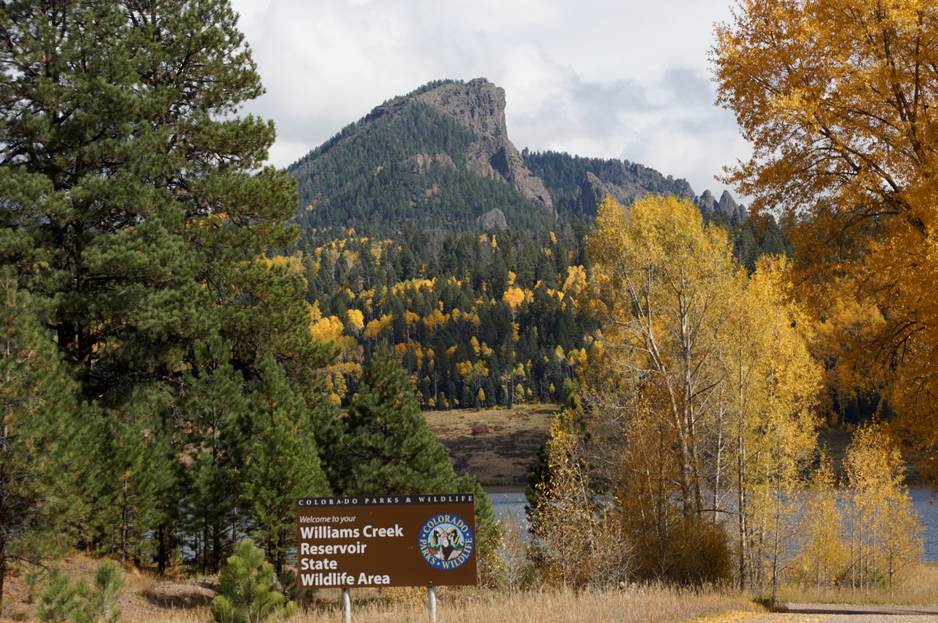
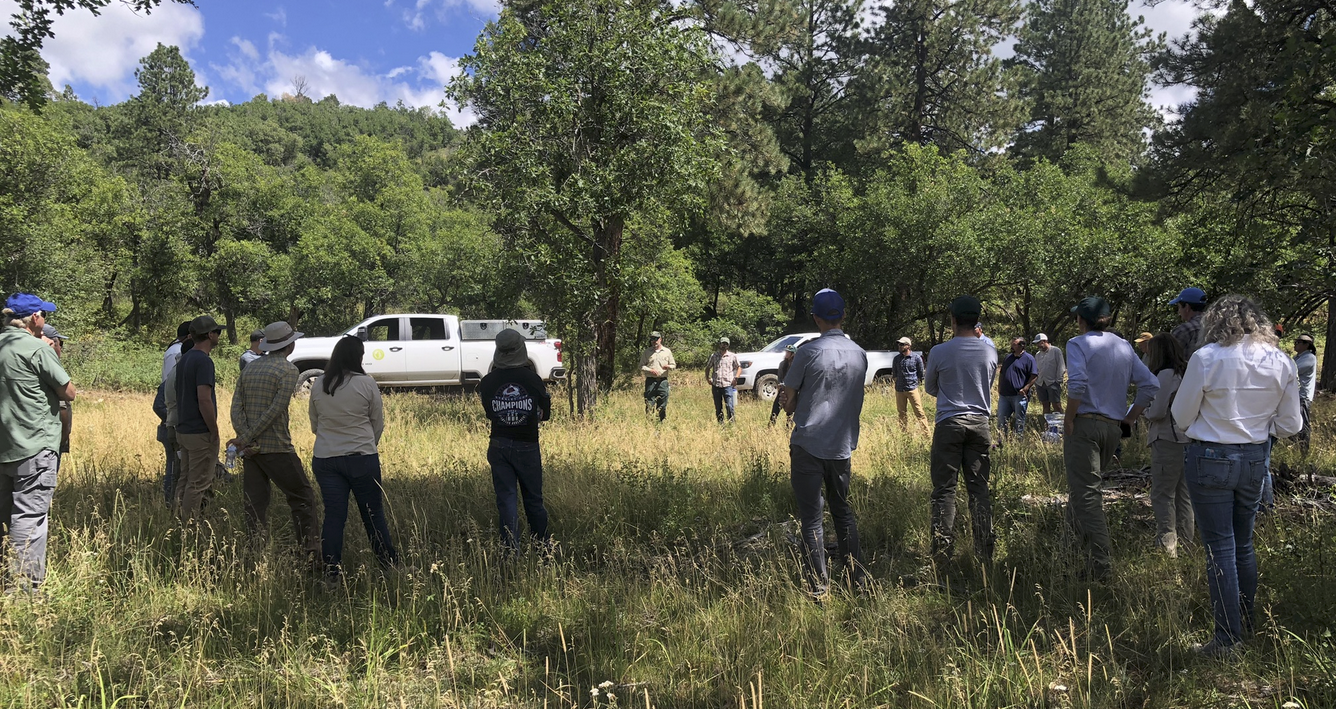
I spent a couple of days last week out of Pagosa Springs in southern Colorado, touring forest restoration work in the headwaters of the San Juan-Chama Project, which produces critical water supplies for central New Mexico. In others words, water for my neighhbors and me.

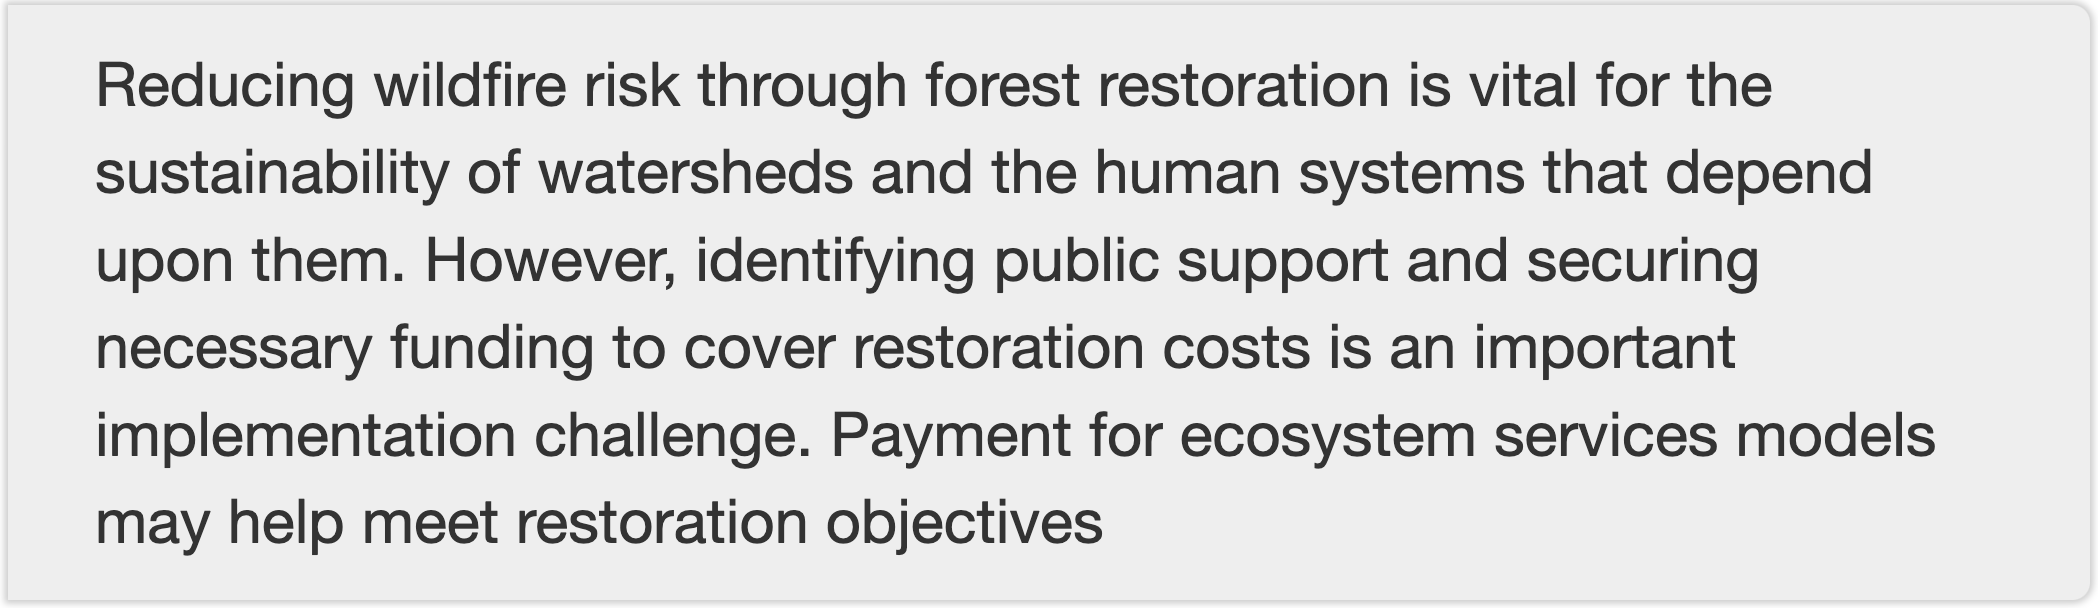
We’ve learned over and over in the last couple of decades the risk to city water from wildfire in our headwaters, and the benefits of forest restoration. But the institutional path to restoration is challenging – because of cost, because of the complicated mix of land ownership, and because of the distance (both physically and also conceptually) between the mountain watersheds and the people who depend on the water they supply.

I came away optimistic about the creative problem solving I saw. This stuff’s hard, especially to do at the scale needed, but the efforts are impressive.

FOREST TO FAUCETS (AND HEADGATES)

A few years back, my University of New Mexico collaborator Bob Berrens helped guide a research project intended to flesh out the relationship between Albuquerque and the distant headwaters (a ~200 mile drive away) that provide a critical piece of our water supply.

That’s from the resulting paper, Adhikari, Dadhi, et al. “Linking forest to faucets in a distant municipal area: Public support for forest restoration and water security in Albuquerque, New Mexico.” Water Economics and Policy 3.01 (2017): 1650019. Using a contingent valuation survey (a technique Bob’s used for many years to help us get our heads around non-market values of stuff related to water resources, see for example here on the endangered Rio Grande Silvery minnow), the research group found:

  • a mean willingness to pay of $64 per household, which equates to $7 million a year flowing out of Albuquerque to help support forest restoration in the watershed on which we depend, and
  • even households far away from watersheds support shelling out cash to pay for the work – not just communities like Santa Fe that can look up from their back porch to see their watershed (more on this later – in addition to its back porch watershed, Santa Fe also gets water from the San Juan-Chama headwaters)

COLLABORATIONS AT THE WATERSHED SCALE

While in Pagosa Springs and the surrounding watersheds, we got to see and learn about an amazing set of collaborations involving the Forest Stewards Guild, the Chama Peak Land Alliance, and The Nature Conservancy’s Rio Grande Water Fund, which provides a crucial conduit for the “payment for ecosystems” model Bob’s work talks about.

Bobcat® Compact Track Loader with Masticating Attachment. Photo credit: Wilderness Forestry, Inc.

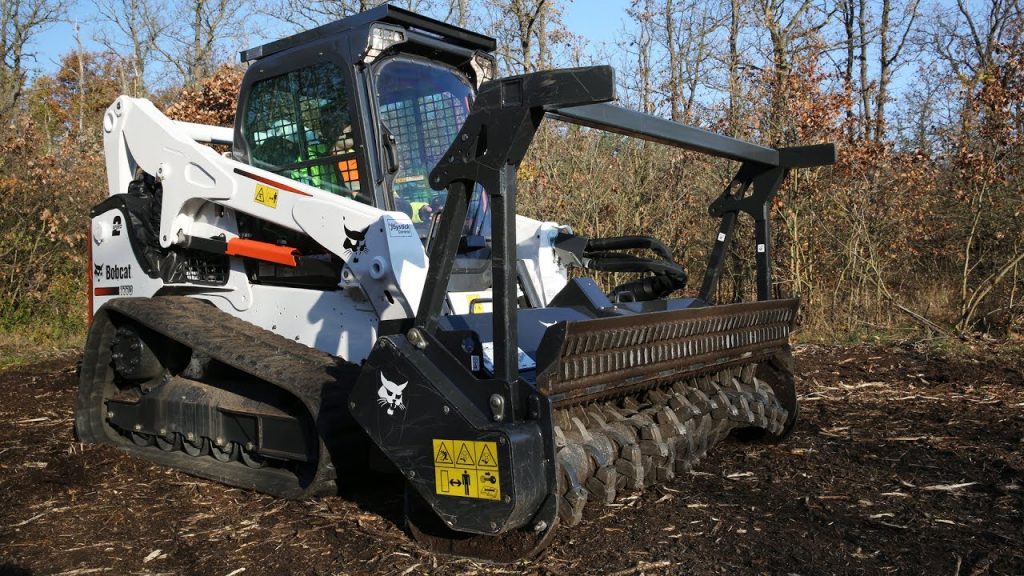
One of the keys to making this work is a business model – the money supports folks in communities like Pagosa Springs who actually drive the masticators (big machines that grind up overgrown forest stuff). It’s part of the rural-urban social contract Bob and I talk about in the UNM Water Resources Program class we’re teaching this fall.

COLLABORATIONS AT THE REGIONAL WATER MANAGEMENT SCALE

Bob’s called this stuff “forests to faucets”, but what we’re seeing this year on the Rio Grande through central New Mexico is a reminder that the Middle Rio Grande Conservancy District, and the river channel itself, also depend on the importation of San Juan-Chama Project water across the continental divide. Absent the SJC water over the last couple of months, the MRGCD’s ditches would have gone dry sooner, as would the river channel. (Both ditches and river channel are starting to go dry as we speak, after MRGCD’s San Juan-Chama water ran out, but that’s a topic for another blog post.)

The organizer of last week’s tours was the San Juan-Chama Contractor’s Association, a group formed several years ago to try to create a framework for collective action among the New Mexico water agencies that use this imported water. Other states have umbrella agencies to organize big parts of their Colorado River water management – the Central Arizona Water Conservation District (“CAP”) in Arizona, the Metropolitan Water District of Southern California, and the Southern Nevada Water Agency (Las Vegas NV). In New Mexico, we have a bunch of separate San Juan-Chama Project water users, each with their own contract with the Bureau of Reclamation. The SJC Contractors Association has created a framework for thinking about collective action on things like physical infrastructure costs and maintenance – and forest restoration!

Key Rio Grande Valley players in attendance were leadership from Albuquerque, Santa Fe (which in addition to San Juan-Chama water, gets supplies from its own local Sangre de Cristo watersheds, which have forest health challenges too) and the Middle Rio Grande Conservancy District.

SOCIAL CAPITAL

In addition to spending time in drop-dead gorgeous mountain watersheds, last week’s tours and meetings also created a great framework for sitting out on the back patio at Motel SOCO in Pagosa Springs eating delicious bar food and drinking our choice of beverages and building social capital. Bonus points for the tours organizers for getting the forest nerds and the water nerds talking.

Great fun was had by me.

Near Pagosa Springs. Photo credit: Greg Hobbs

2023 #COleg: New #drought task force supports river’s revival: The 17-member task force will provide recommendations to #Colorado’s state legislature in mid-December 2023 — The #Telluride Daily Planet #ColoradoRiver #COriver #aridification

State Capitol May 12, 2018 via Aspen Journalism

Click the link to read the article on The Telluride Daily Planet website (Sophie Stuber): Here’s an excerpt:

Colorado’s legislature recently approved a new Colorado River Drought Task Force that will help provide guidelines and recommendations to manage the state’s water supply from the river as dry conditions continue. The aim of the task force is to give recommendations for state legislation and to develop additional tools to help address drought in the Colorado River basin.

“Since the early 2000s the Colorado River basin has been experiencing an unprecedented drought,” Colorado Representative Julie McCluskie, one of the bill’s sponsors, told the Daily Planet…

The 17-member task force is composed of representatives from local governments, agricultural water users, environmental groups, water management boards and the Southern Ute and Ute Mountain Ute tribes. There will also be a sub-task force to focus on tribal water rights and to provide additional recommendations for state legislation…Members met for the first time at the start of August. The task force will issue recommendations in mid-December…

Seven states are part of the Colorado River compact. Colorado, New Mexico, Utah and Wyoming represent the Upper Basin, and Arizona, Nevada and California comprised the Lower Basin. The majority of the Colorado River’s water originates in the Upper Basin, but the Lower Basin is currently using more than the river can supply. Along the river, agriculture takes up 80% of the Colorado River’s water. The Colorado River Drought Task Force will focus on the Upper Basin, as it only will be providing recommendations for the state of Colorado…

All of the task force’s meetings are open to the public. People can attend either in person or online. McCluskie encouraged people to be involved.

“There are ample opportunities for public participation. All of us should have interest in the Colorado River,” [Kathy] Chandler-Henry said.

Map credit: AGU

52% of the US is experiencing very short to short topsoil moisture conditions, a 5% rise since last week — @DroughtGov (August 27, 2023)

Click the link to read the Tweet from @Drought.gov:

Credit: USDA

At 52%, this August is higher than all end-of-August percent short to very short values since the USDA began tracking this data in 2015. Map, graph and stat from @usda_oce.

Credit: USDA

Historically, how has #ElNiño influenced summer temperature and precipitation around the world? — NOAA #ENSO

Click the link to read the article on the NOAA website (Rebecca Lindsey and Brian Brettschneider):

Ever since NOAA declared El Niño to be officially underway in June 2023, people have been asking us what it would mean for summer heat. For most of the United States, the short answer has been “probably very little.” Or as the experts put it, El Niño doesn’t have a strong summer climate signal for most of the country. That’s true whether we look at departures from average temperature (anomalies) in summers leading up to El Niño, or whether we look at the frequency of warmer-than-average summers, which is what we are showing here. 

For parts of the tropics, it’s a different story. Northern Hemisphere summers that lead up to El Niño winters do tend to be hotter than average across parts of northern Africa, India, and Central and South America. They also tend to be drier than average. 

Exactly how often do these patterns occur? These maps show the scorecard for all 29 El Niño summers on record, 1950–present. For this analysis, which was done by Brian Brettschneider, a climate expert with the National Weather Service-Alaska, what we are calling an “El Niño summer” is any summer (June-August) leading into a winter (December-February) with El Niño conditions, regardless of whether El Niño was officially in place in the summer. (See “additional details” for an explanation of why Brettschneider chose to look at things this way.) 

On the top map, red areas mean that out of the 29 El Niño summers on record, more were hot than cold. Blues mean cold El Niño summers outnumbered hot ones. (“Hot” and “cold” are shorthand for hotter and colder than average; “wet” and “dry” are shorthand for wetter and drier than average.) On the bottom map, brown areas mean El Niño summers were more often dry than they were wet; green areas mean wet El Niño summers outnumbered dry ones. In both maps, the darker the color, the more lopsided the count. In other words, the darker colors indicate how reliable or frequent the specific climate anomaly was at a given place, not how intense it was. The point of looking at the patterns this way is to emphasize that El Niño and La Niña may increase the chances for above- or below-average temperature or precipitation in different parts of the world, but they don’t guarantee it. Credit: NOAA

Not surprisingly, the only place where an El Niño summer was nearly always hotter than average (26 or more out of 29 years) was in the heart of the tropical Pacific, where above-average temperatures are literally part of the definition of El Niño. (If the coming winter wound up having El Niño conditions, the warmth would have been building there in summer, even if the temperature hadn’t reached official El Niño status at that time.) Across the tropics in places as scattered as the African Sahel and Hawaii, 20 or more out of 29 El Niño summers on record (close to 70 percent) were warmer than average. For many of those same areas, dry El Niño summers far outnumbered wet ones. Together those conditions significantly would have raised the risk of drought and fires in