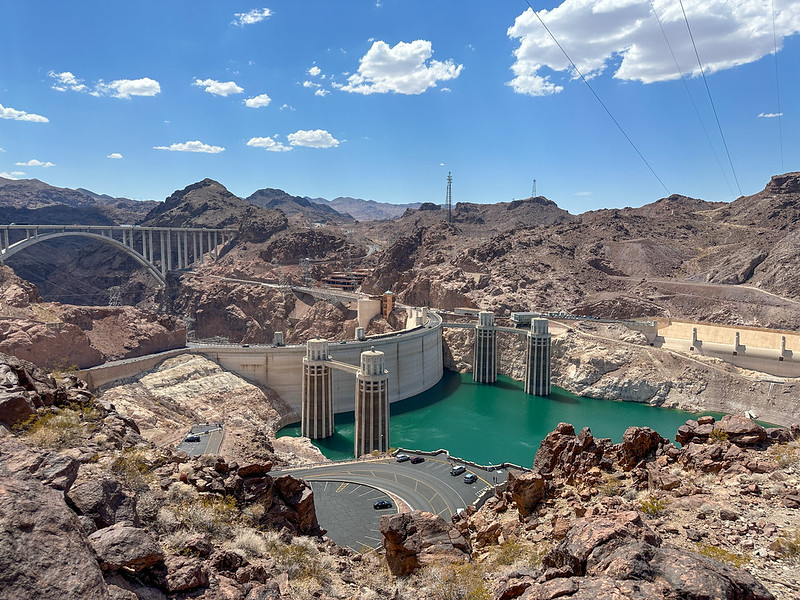
The San Juan River near Navajo Dam, New Mexico, Aug. 23, 2015. Photo credit: Phil Slattery Wikimedia Commons
From email from Reclamation (Susan Novak Behery):
August 17, 2023
In response to the precipitation forecast and increased observed flows in the San Juan River Basin and its tributaries, the Bureau of Reclamation has scheduled a decrease in the release from Navajo Dam from 700 cubic feet per second (cfs) to 600 cfs for tomorrow, August 18th, at 4:00 AM.
Releases are made for the authorized purposes of the Navajo Unit, and to attempt to maintain a target base flow through the endangered fish critical habitat reach of the San Juan River (Farmington to Lake Powell). The San Juan River Basin Recovery Implementation Program recommends a target base flow of between 500 cfs and 1,000 cfs through the critical habitat area. The target base flow is calculated as the weekly average of gaged flows throughout the critical habitat area from Farmington to Lake Powell.
Federal officials on Tuesday temporarily eased Colorado River water use restrictions due to a “lucky” year of increased precipitation, but drought and overuse remain a crisis as officials begin negotiations for the future of the river on which 40 million people in the West rely for drinking, agriculture and water. Colorado’s top water officials on Tuesday submitted the state’s first formal comments on negotiations that will govern the use of the river after current guidelines expire in 2026. They urged change in how Lake Mead and Lake Powell — the two major water storage reservoirs on the river — are operated as the West becomes hotter and drier…
Negotiations for a new plan to replace a 2007 agreement began in June between federal officials, tribal leaders and the seven basin states — Colorado, Wyoming, Utah, Nevada, Arizona, New Mexico and California. The groups must come to an agreement by 2027, when the current guidelines established in 2007 end. New operating guidelines must account for climate change as well as “recognize that Lower Basin overuse is unsustainable and puts the entire system at risk,” according to the letter to the U.S. Bureau of Reclamation from Mitchell and Lauren Ris, acting director of the Colorado Water Conservation Board…
Water levels at Lake Mead and Lake Powell rose this spring due to increased snow and rain in the region. The wet winter and spring mean for the next year Lake Mead will operate in a Level 1 Storage Condition, a “significant improvement” from the Level 2 Shortage Condition implemented in 2022, the Bureau of Reclamation announced Tuesday…That means two Lower Basin states that rely on releases from the reservoirs for water — Nevada and Arizona — will have a little more water to work with this year. Cuts don’t affect allocations to the Upper Basin states — Colorado, Utah, New Mexico or Wyoming — because they are upstream of the reservoirs…
Heavy snowfall and increased rains helped boost flows in the Colorado River Basin this winter and spring, raising the water levels of reservoirs across the system. Lake Mead rose more than 10 feet and Lake Powell rose more than 50 feet.
“We were on the verge of a crash,” said Matt Rice, director of the Colorado Basin Program at American Rivers. “There’s no doubt we got lucky.”
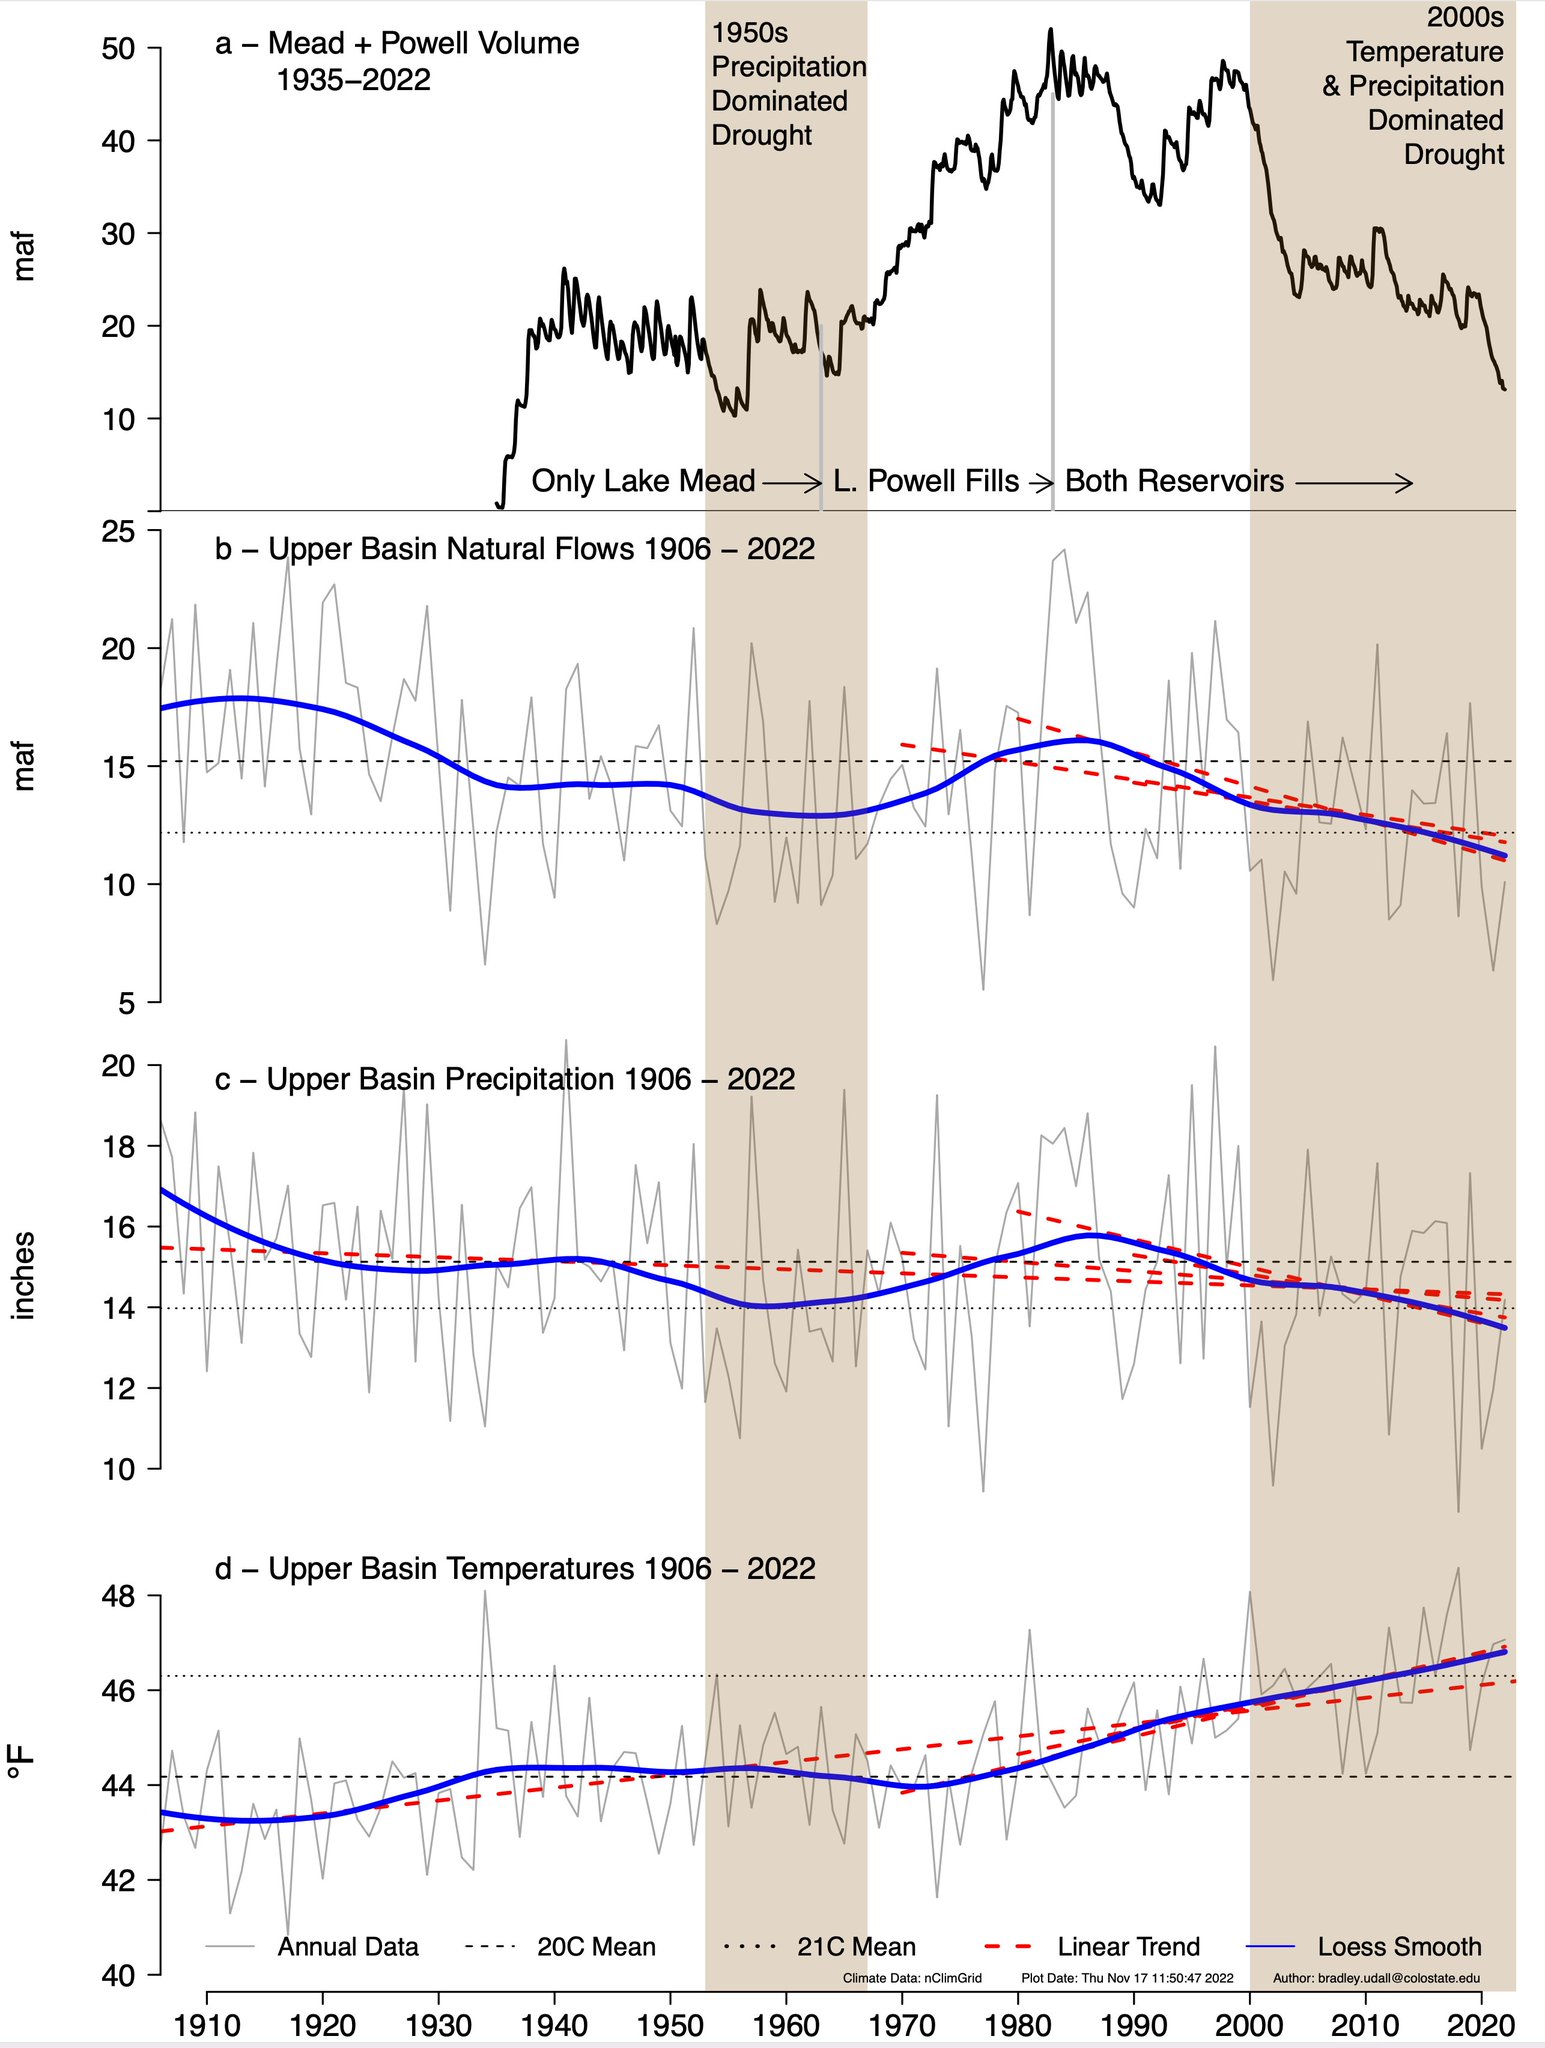
Updated Colorado River 4-Panel plot thru Water Year 2022 showing reservoirs, flows, temperatures and precipitation. All trends are in the wrong direction. Since original 2017 plot, conditions have deteriorated significantly. Brad Udall via Twitter: https://twitter.com/bradudall/status/1593316262041436160
About 10 years ago, a very thick book written by a French economist became a surprising bestseller. It was called “Capital in the 21st Century.” In it, Thomas Piketty traces the history of income and wealth inequality over the past couple of hundred years.
The book’s insights struck a chord with people who felt a growing sense of economic inequality but didn’t have the data to back it up. I was one of them. It made me wonder, how much carbon pollution is being generated to create wealth for a small group of extremely rich households? Two kids, 10 years and a Ph.D. later, I finally have some answers.
In a new study, colleagues and I investigated U.S. households’ personal responsibility for greenhouse gas emissions from 1990 to 2019. We previously studied emissions tied to consumption – the stuff people buy. This time, we looked at emissions used in generating people’s incomes, including investment income.
If you’ve ever thought about how oil company CEOs and shareholders get rich at the expense of the climate, then you’ve been thinking in an “income-responsibility” way.
While it may seem intuitive that those getting rich from fossil fuels bear responsibility for the emissions, very little research has been done to quantify this. Recent efforts have started to look at emissions related to household wages in France, global consumption and investments of different income groups and billionaires’ investments. But no one has analyzed households across a whole country based on the emissions used to generate their full range of income, including wages, investments and retirement income, until now.
We linked a global data set of financial transactions and emissions to microdata from the U.S. Census Bureau and Bureau of Labor Statistics’ monthly labor force survey, which includes respondents’ job, demographics and income from 35 categories, including wages and investments. People’s wages we connected to the emission intensity of the industries that employ them, and we based the emissions intensity of investment income on a portfolio that mirrors the overall economy.
The results of our analysis were eye-opening, and they could have profound implications for producing more effective and fair climate policies in the future.
A view from the top 1%
Both our consumption- and income-based approaches reveal that the highest-earning households are responsible for much more than an equitable share of carbon emissions. What’s more surprising is how different the level of responsibility is depending on whether you look at consumption or income.
In the income-based approach, the share of national emissions coming from the top 1% of households is 15% to 17% of national emissions. That’s about 2.5 times higher than their consumer-related emissions, which is about 6%.
In the bottom 50% of households, however, the trend is the exact opposite: Their share of consumption-based national emissions is 31%, about two times larger than their income-based emissions of 14%.
Why is that?
A couple things are going on here. First, the lowest earning 50% of U.S. households spend all that they earn, and often more via social assistance or debt. The top income groups, on the other hand, are able to save and reinvest more of their income.
Second, while high-income households have very high overall spending and emissions, the carbon intensity – tons of carbon dioxide emitted per dollar – of their purchases is actually lower than that of low-income households. This is because low-income households spend a large share of their income on carbon-intensive basic necessities, like home heating and transportation. High-income households spend more of their income on less-carbon-intensive services, like financial services or higher education.
Implications for a carbon tax
Our detailed comparison could help change how governments think about carbon taxes.
Typically, a carbon tax is applied to fossil fuels when they enter the economy. Coal, oil and gas producers then pass this tax on to consumers. More than two dozen countries have a carbon tax, and U.S. policymakers have proposed adding one in recent years. The idea is that raising the price of these products by taxing them will get consumers to shift to cheaper and presumably less carbon-intensive alternatives.
But our studies show that this kind of tax would disproportionately fall on poorer Americans. Even if a universal dividend check was adopted, consumer-facing carbon taxes have no impact on saved income. Generating that income likely contributed to greenhouse gas emissions, but as long as the money is used to buy stocks rather than consumables, it is excluded from carbon taxes. So, this kind of carbon tax disproportionately affects people whose income goes primarily toward consumption.
A profit-focused carbon tax
What if, instead of focusing on consumption, carbon taxes addressed greenhouse gases as an outcome of profit generation?
The vast majority of American corporations operate under the principle of “shareholder primacy,” where they see a fiduciary duty to maximize profit for their investors. Products – and the greenhouse gases used to make them – are not created for the benefit of the consumer, but because the sale of those products will benefit the shareholders.
If carbon taxes were focused on shareholder income linked to greenhouse gas emissions rather than consumption, they could target those receiving the most economic benefits resulting from these emissions.
The impact
A couple of interesting things might result, particularly if the tax was set based on the carbon intensity of the company.
Corporate executives and boards would have incentive to reduce emissions to lower taxes for shareholders. Shareholders would have incentive, out of self-interest, to pressure companies to do so.
Investors would also have incentive to shift their portfolios to less-polluting companies to avoid the tax. Pension and private wealth fund managers would have incentive to divest from carbon-polluting investments out of a fiduciary duty to their clients. To keep the tax focused on large shareholders, I could see retirement accounts being excluded from the tax, or a minimum asset threshold before the tax applies. https://www.youtube.com/embed/CgA0UgSEDjI?wmode=transparent&start=0 Jared Starr explains the new study’s findings and the implications.
Revenue generated from the carbon tax could help fund adaptation and the transition to clean energy.
Instead of putting the responsibility for cutting emissions on consumers, maybe policies should more directly tie that responsibility to corporate executives, board members and investors who have the most knowledge and power over their industries. Based on our analysis of the consumption and income benefits produced by greenhouse gas emissions, I believe a shareholder-based carbon tax is worth exploring.