Click the link to read the Tweet from @Drought.gov:
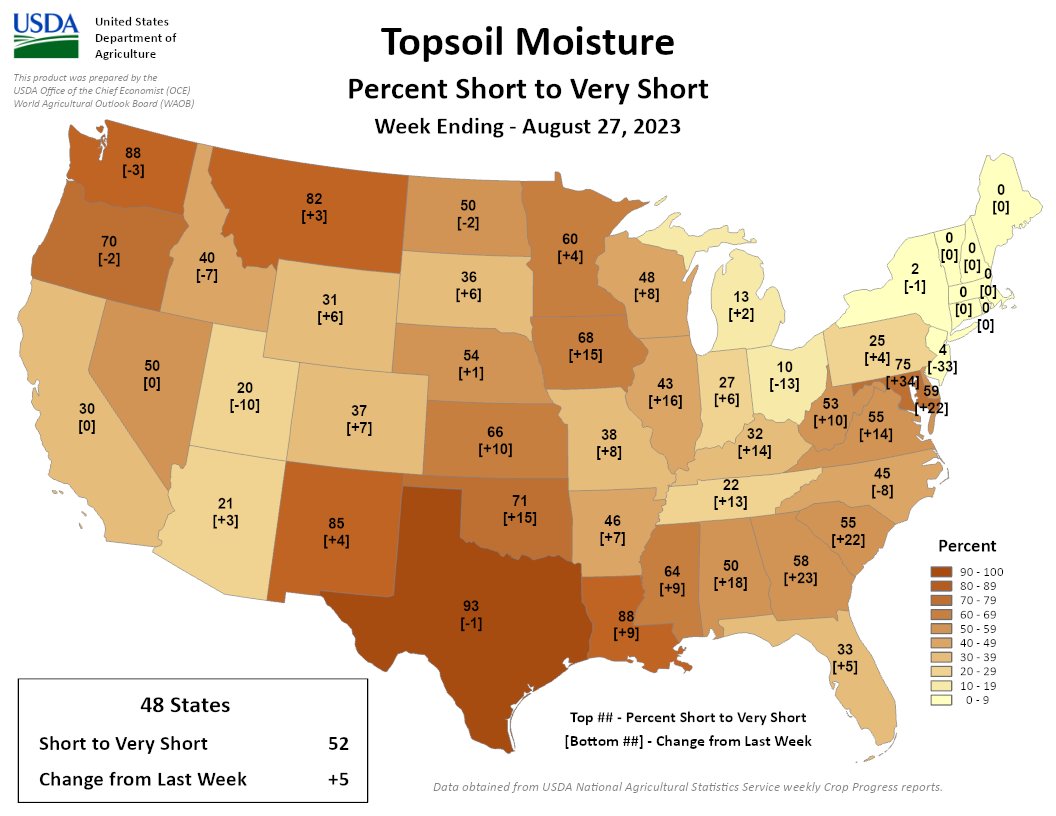
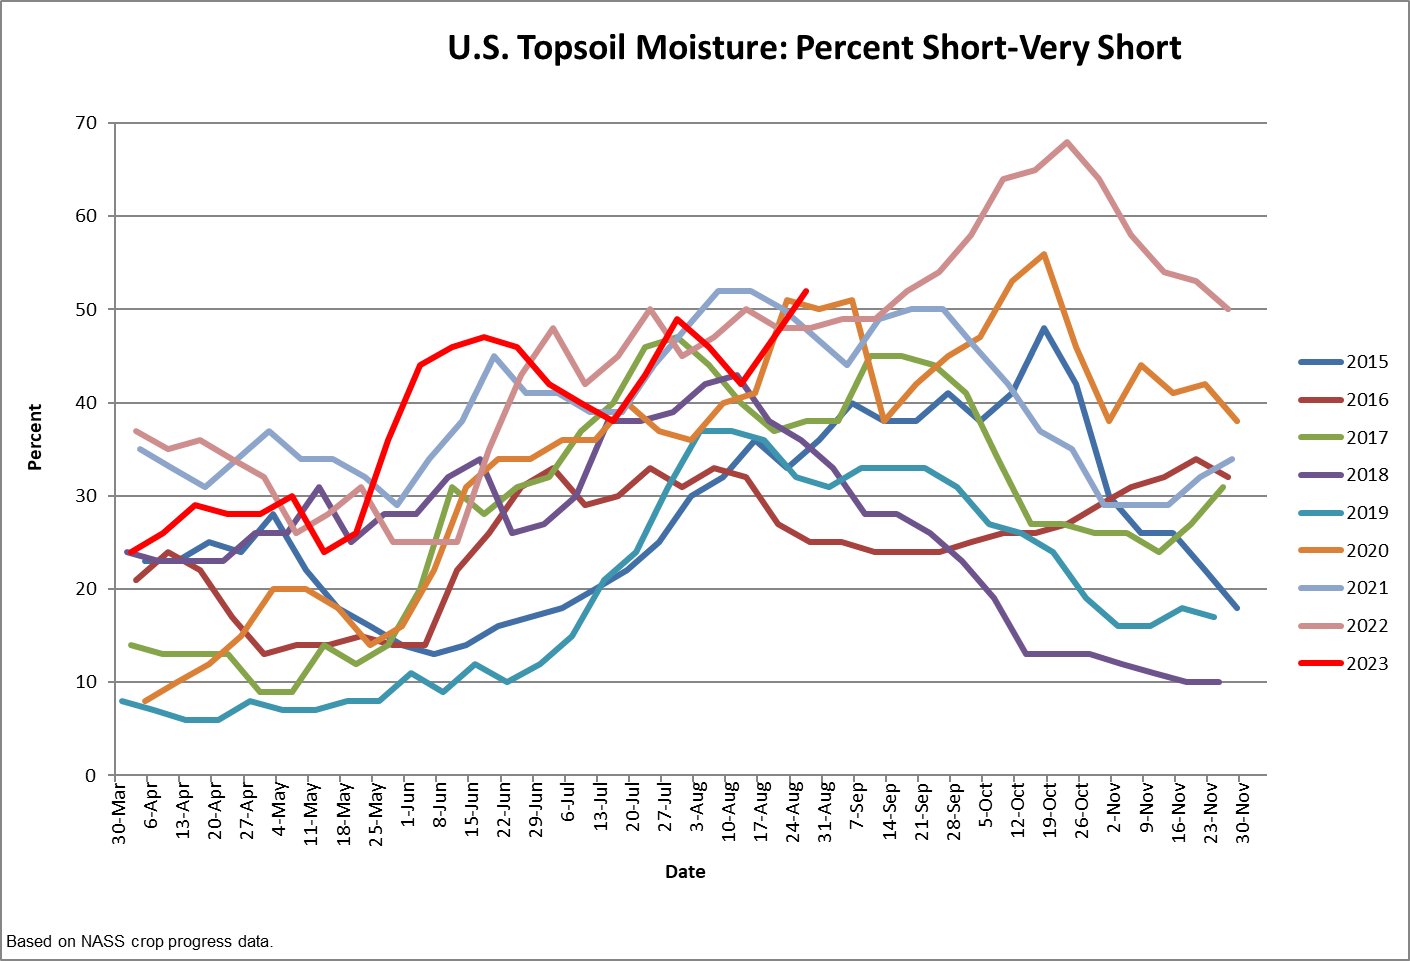
At 52%, this August is higher than all end-of-August percent short to very short values since the USDA began tracking this data in 2015. Map, graph and stat from @usda_oce.

Click the link to read the Tweet from @Drought.gov:
At 52%, this August is higher than all end-of-August percent short to very short values since the USDA began tracking this data in 2015. Map, graph and stat from @usda_oce.