Dim view of #ColoradoRiver too optimistic?: How low will #LakePowell get while the states try to reach agreement about natural flow formula? — Allen Best (BigPivots.com) #COriver #aridification

Glen Canyon Dam May 2022. Photo credit: Allen Best/Big Pivots

Click the link to read the article on the Big Pivots website (Allen Best):

August 18, 2025

The words “urgency” and “immediate action” were used by Trump administration officials on Aug. 15 in releasing the U.S. Bureau of Reclamation 24-month study for the Colorado River Basin.

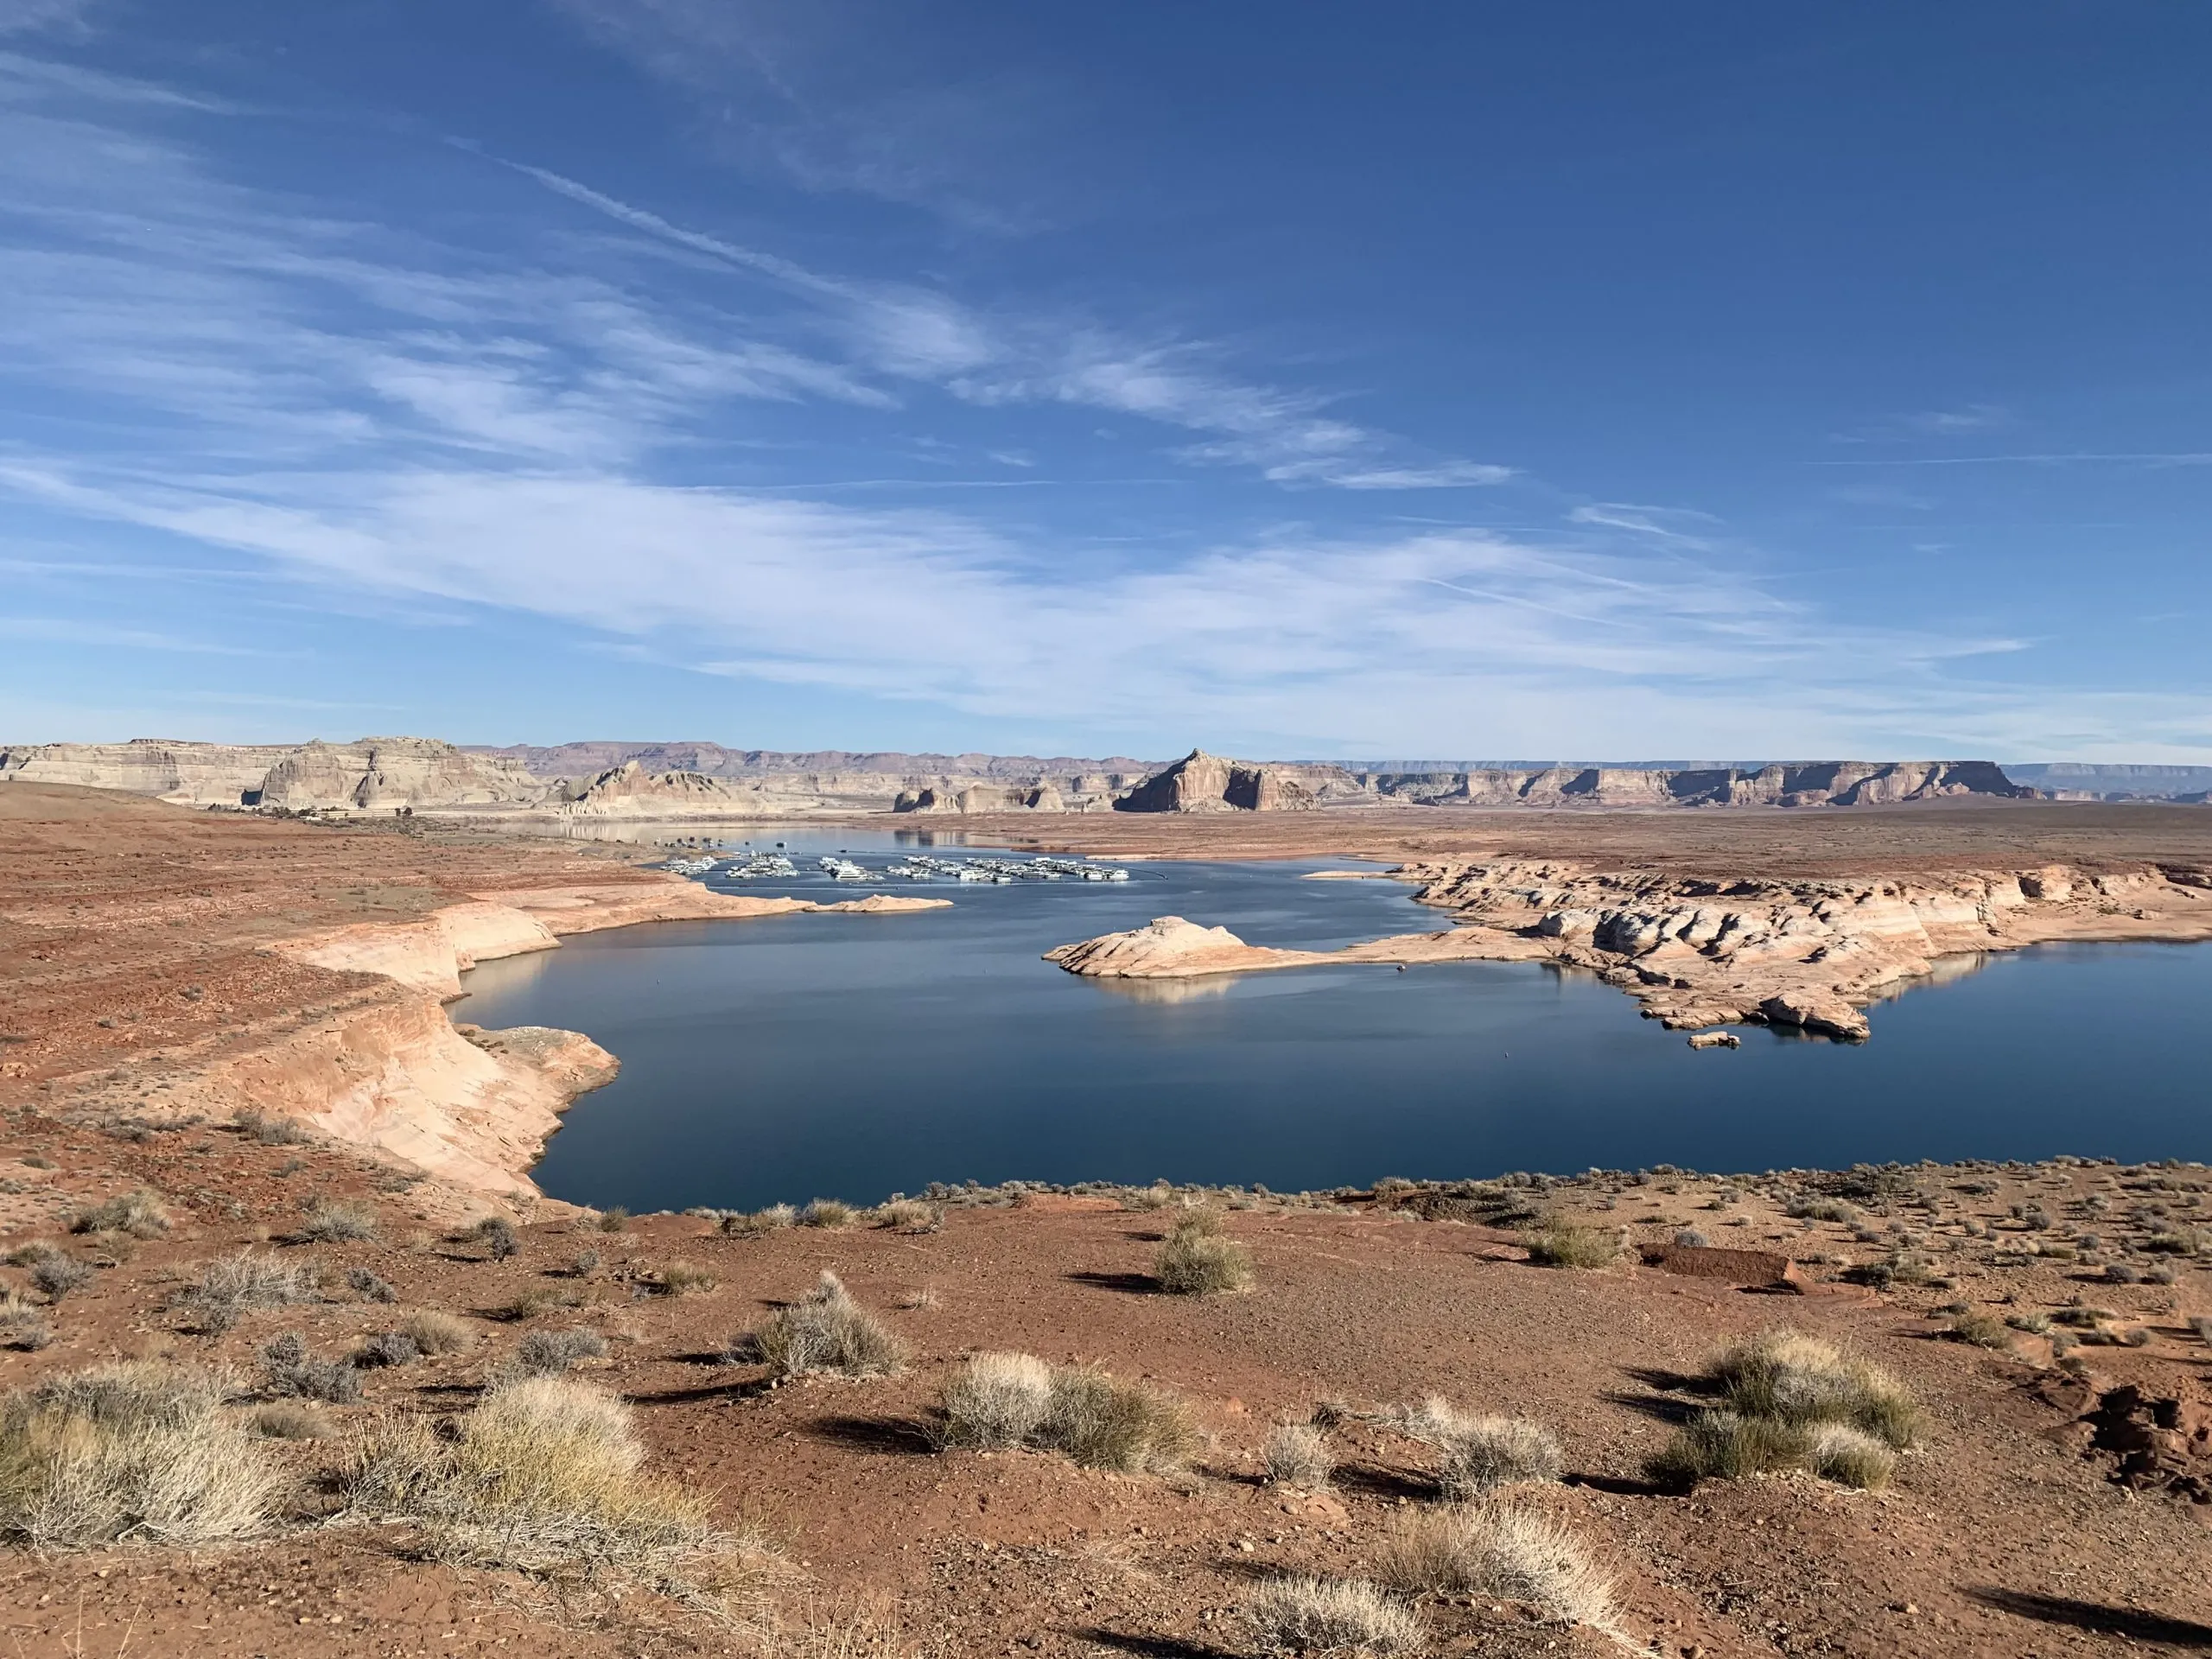
The study sees a high probability of water levels of Lake Powell falling to within 48 feet of the minimum power pool by January. That elevation, 3,490 feet above sea level, is the reservoir’s lowest level at which hydroelectricity can be produced. That has not happened since soon after Powell began filling after completion of Glen Canyon Dam in 1966.

“This underscores the importance of immediate action to secure the future of the Colorado River,” said David Palumbo, acting commissioner for the agency.

Scott Cameron, the acting assistant secretary for water and science in the Department of Interior, had similar words of warning to the seven states that share use of the river.

“As the basin prepares for the transition to post-2026 operating guidelines, the urgency for the seven Colorado River Basin states to reach a consensus agreement has never been clearer,” said Cameron. “We cannot afford to delay.”

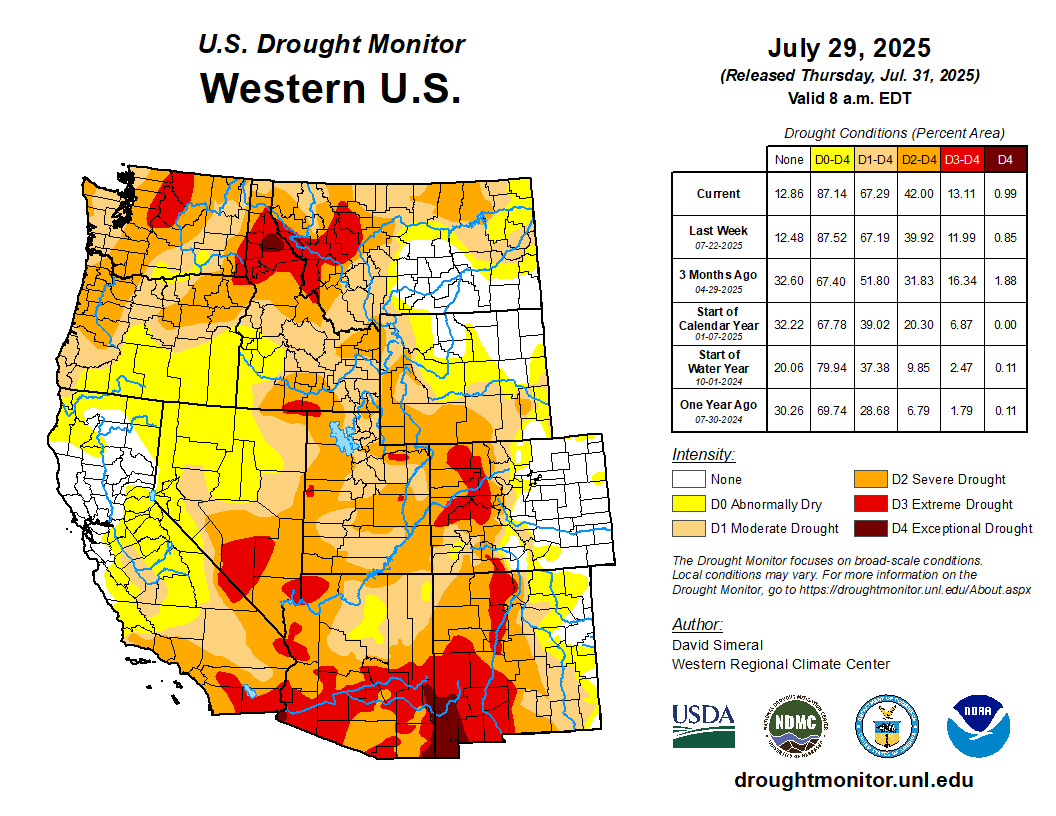
The announcement cited “unprecedented drought” but made no mention of climate change. This seems to be a theme. [ed. emphasis mine]

Cameron, at the Getches-Wilkinson Center’s annual water seminar in Boulder during June, talked for 24 minutes without once mentioning climate change. He even answered a question about climate change without using the phrase. He did seem to acknowledge it, saying that in the “real world” there is less water than before, “and that is probably not going to change a whole bunch.”

Might the situation be even worse than what Bureau of Reclamation has projected will be most likely?

A bias of optimism

On Aug. 14, a day before the bureau’s release of the 24-month study, John Fleck and others posted an analysis on Fleck’s Inkstain that warned the study would likely be overly optimistic.

The problem, explained Fleck and his co-authors, is that the “assumptions underlying the study do not fully capture the climate-change driven aridification of the Colorado River Basin.”

The precipitation received from October through July in the Colorado River Basin fits in with a theme that is best understood when coupled with rising temperatures, which produces greater evaporation and transpiration. Image/Western Water Assessment

The bureau uses a 30-year average in predicting what lies ahead. However, using the hydrology of the Colorado River Basin since the 1990s no longer provides the same usefulness in predicting what lies ahead during the next 24 months. The climate is changing too fast.

Paul Milley, then of the U.S. Geologic Survey, and others from that and other institutions, noted this problem in a 2008 paper, “Stationarity is Dead: Whither Water Management.”

In that paper, Milley and his co-authors argued that human-induced climate changes were altering the means and extremes of precipitation, evapotranspiration, and the rates of runoff in rivers. As such, they contended, using the old models to guide water management no longer worked as well.

In their posting at Inkstain, Fleck and his coauthors — Anne Castle, Erick Kuhn, Jack Schmidt, Kathryn Sorensen and Katherine Tara — noted that the Bureau of Reclamation’s 24-month study a year ago found that the “most probable” level for Powell would be 3,593  at the end of July 2025.

It was 38 feet lower than the projection. It had been another so-so or worse winter and then an early, warm spring.

This, they said, illustrated the bias toward optimism in the models used by the agency. That bias had been detailed in a 2022 study of past projections by a team led by Jian Wang of the Utah State Center for Colorado River Studies.

“Most probable” in the Bureau of Reclamation projections occupied a band of 80% likelihood. The bureau also issues maximum and minimum probable scenarios.

Fleck and his team contend that the bureau’s “minimum probable scenario has become the most valuable in providing a reliable indicator of the future” for Colorado River flows.

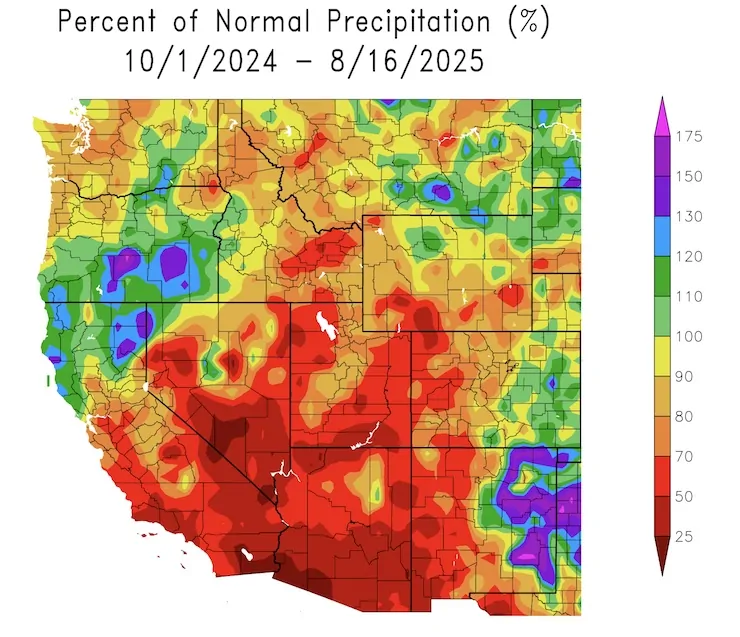
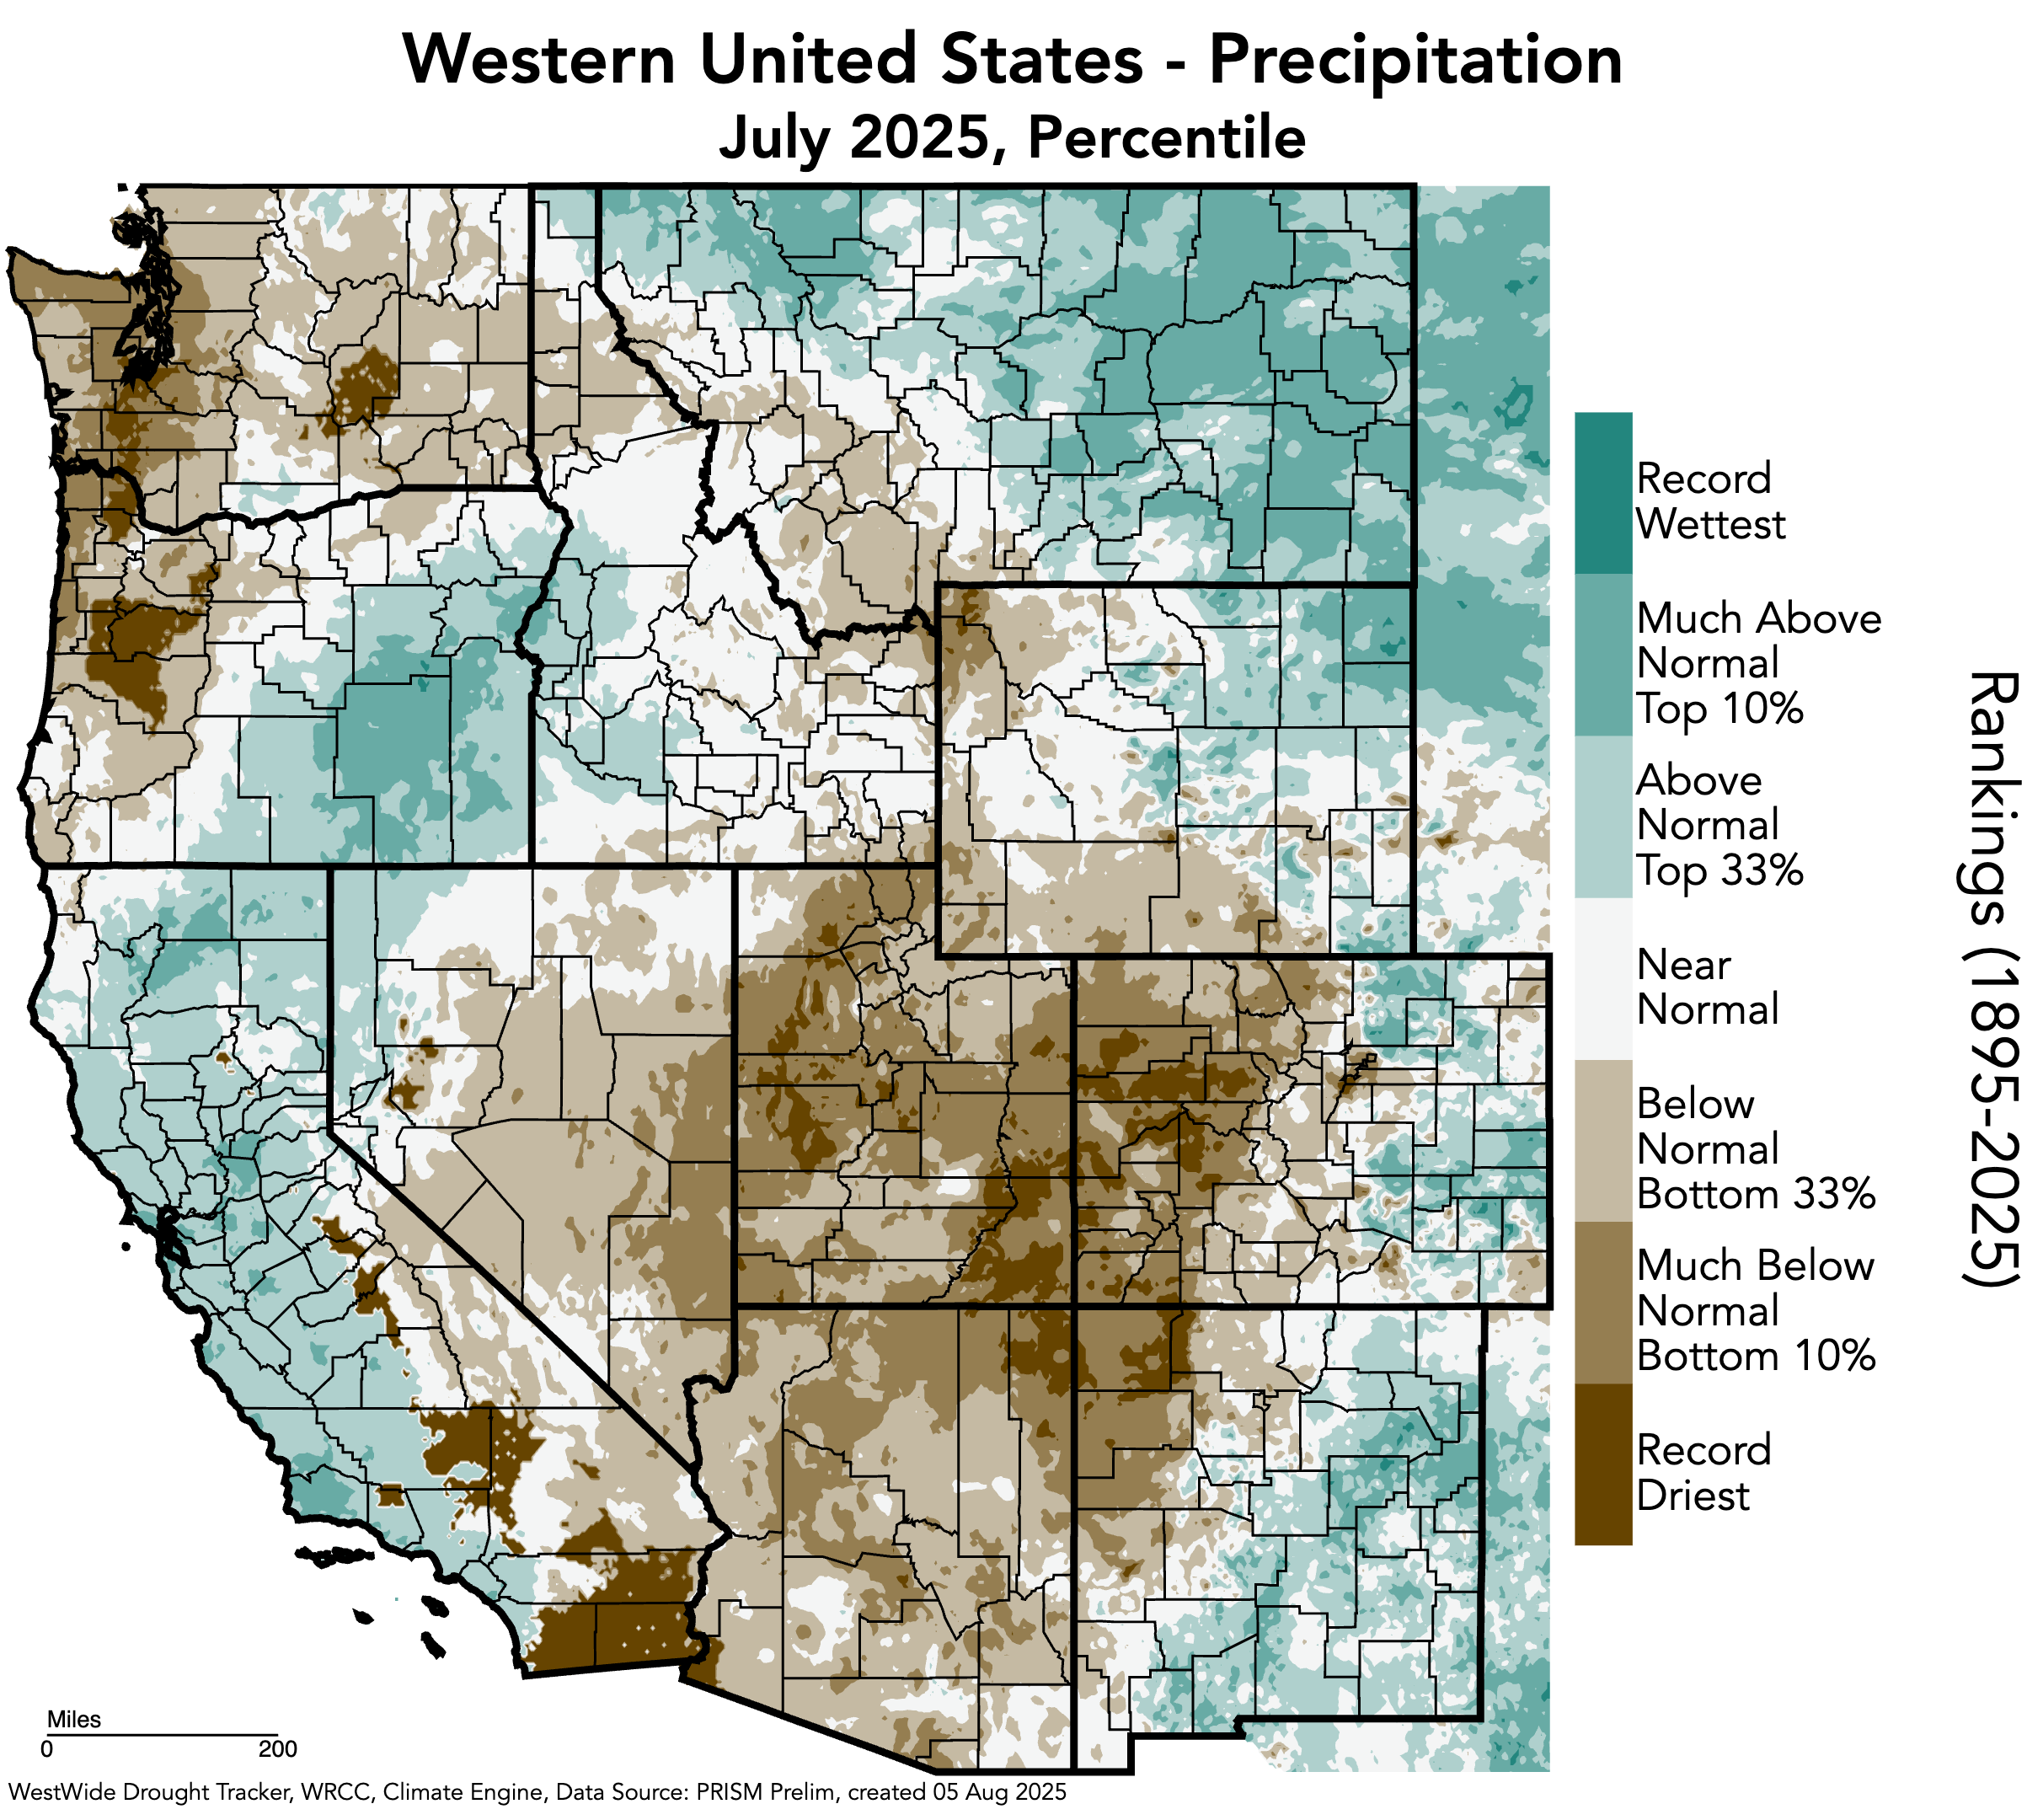
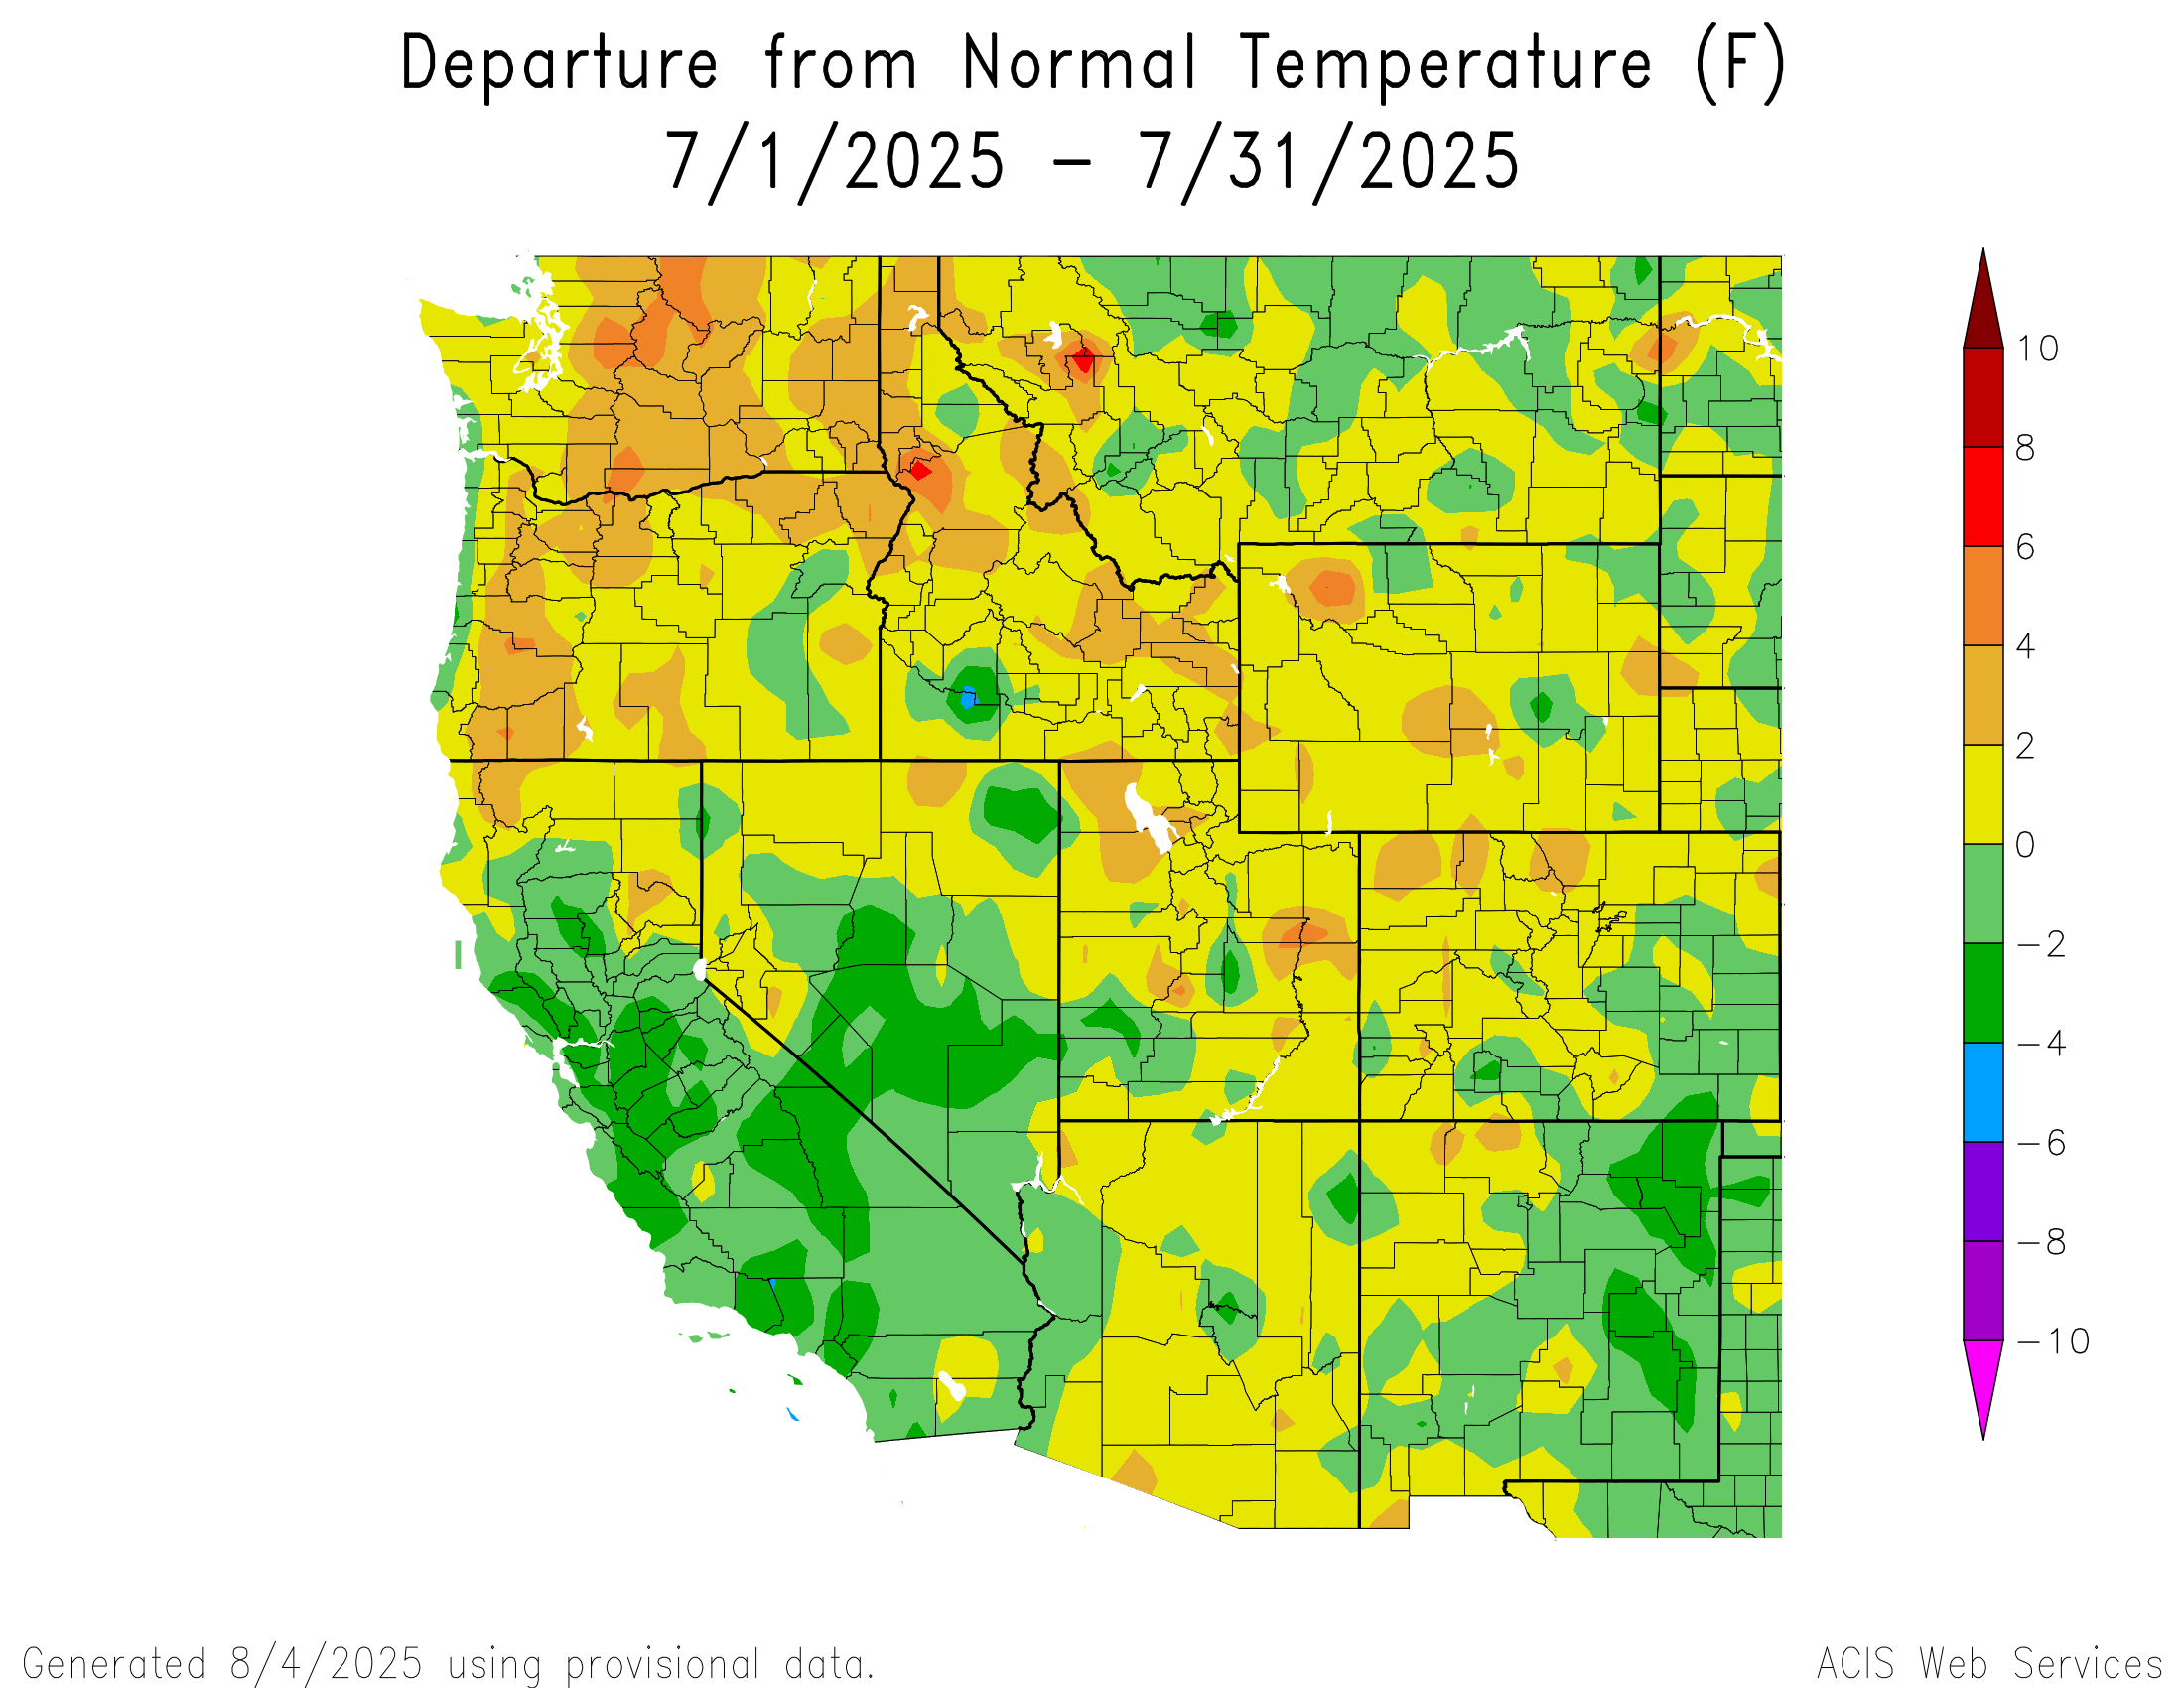
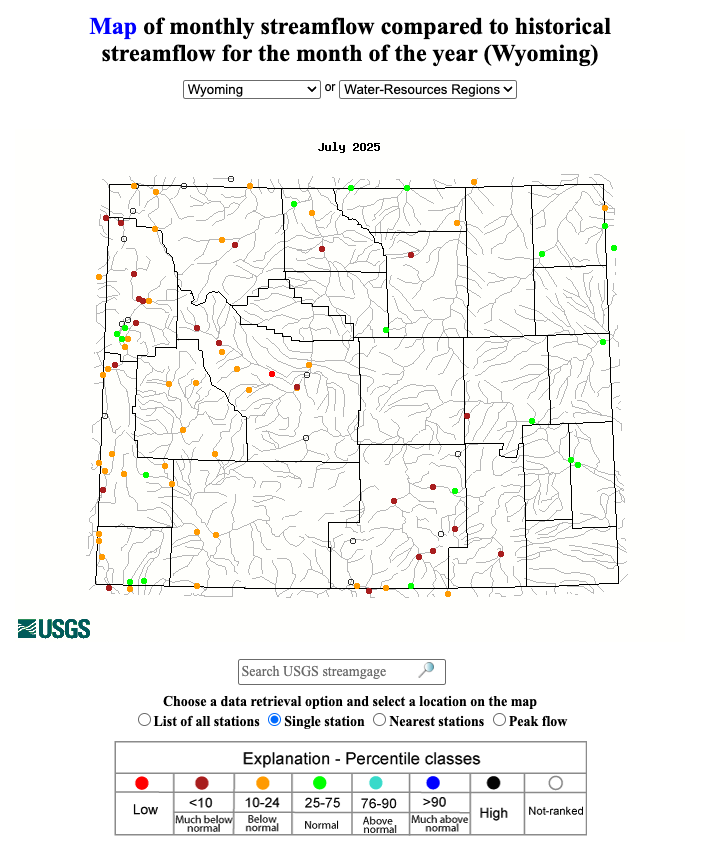
This past winter was mediocre, near average snowfall in some basins but among the worst in the San Juans. Spring was warm or more in many places, and rains in July were almost entirely absent.

The preliminary estimated inflow into Powell for April through July was 41% of the average from 1991 through 2020, according to the bureau’s most-probable study. During July, runoff slipped to 12% of that 30-year average.

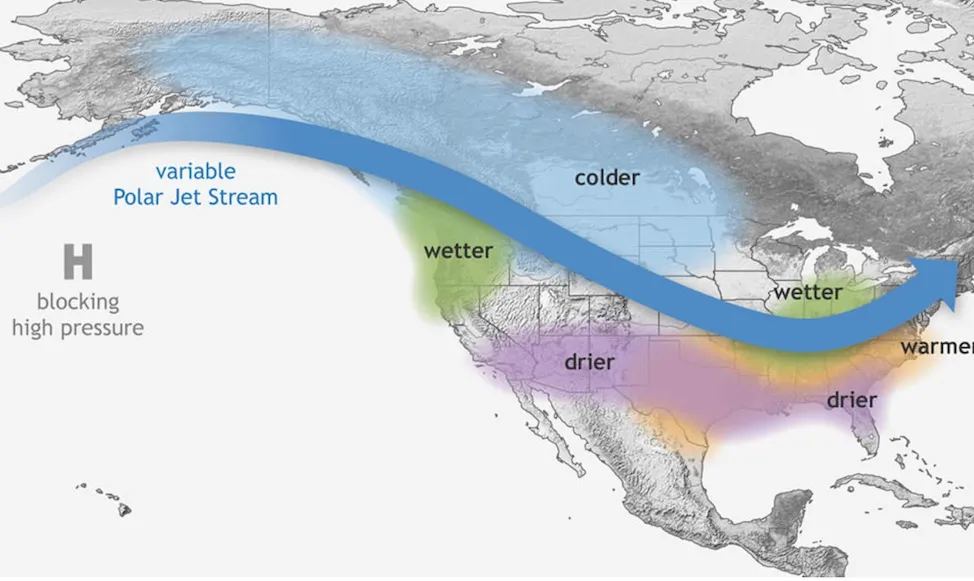
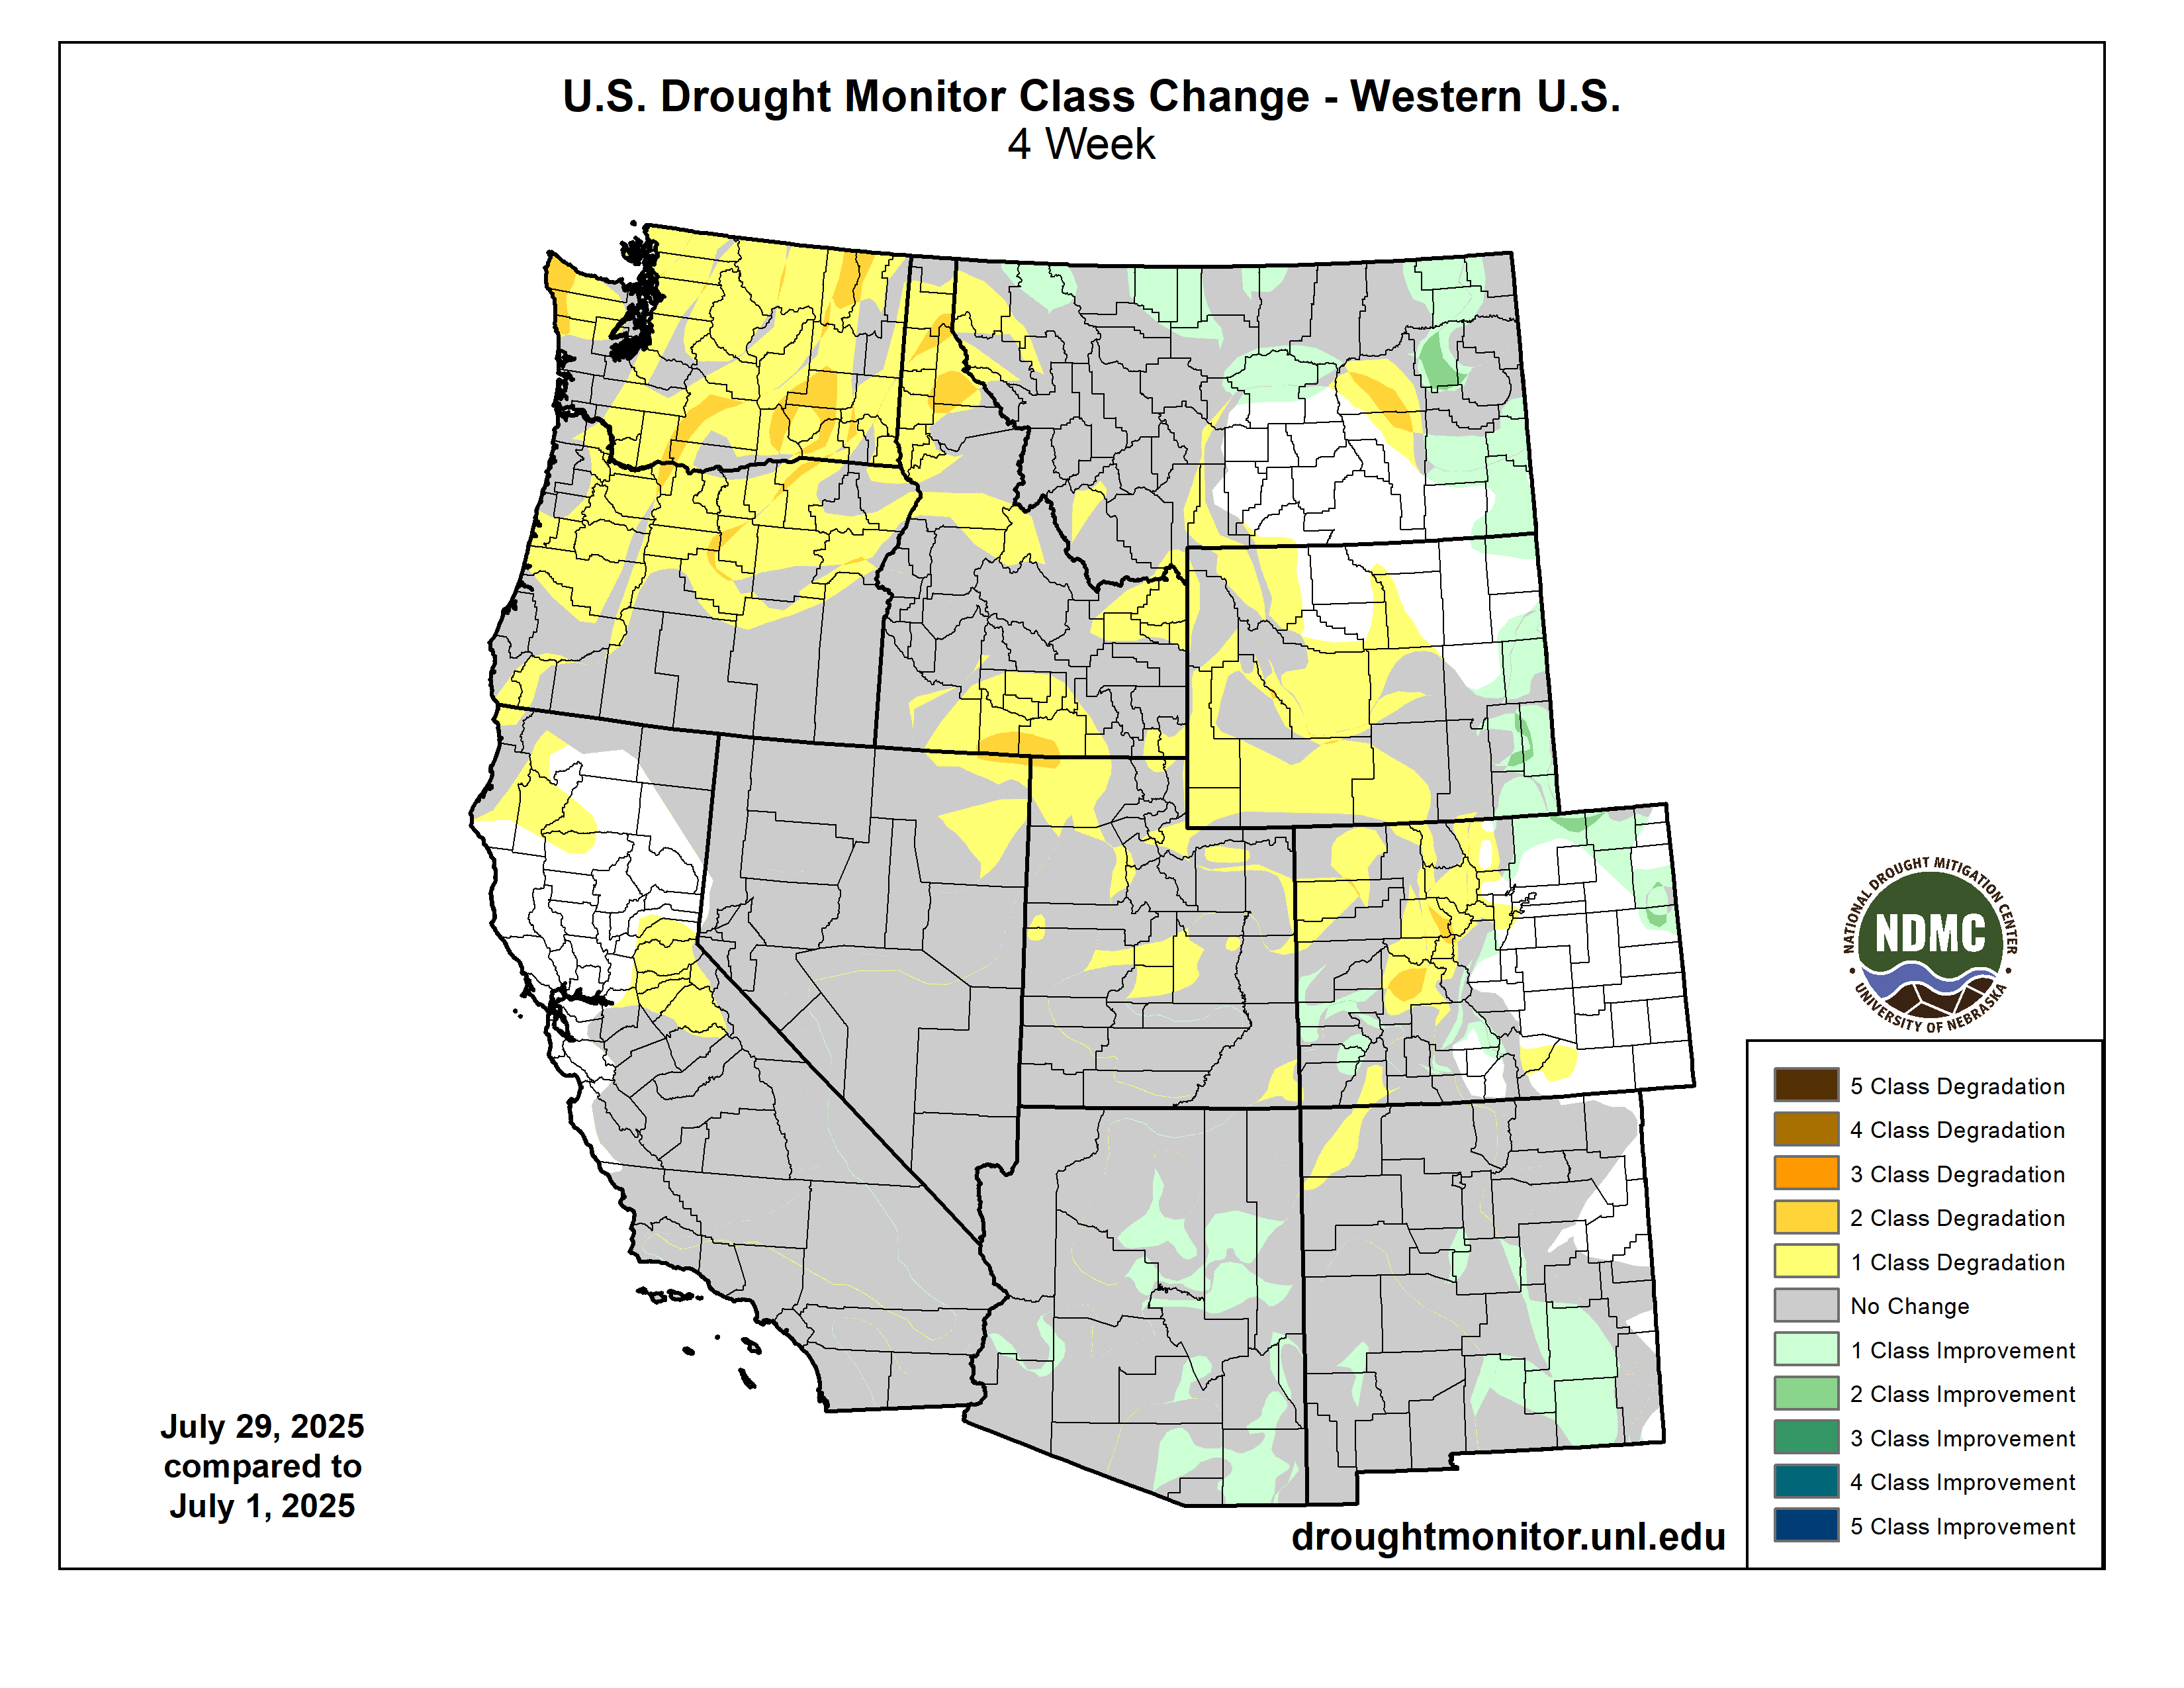
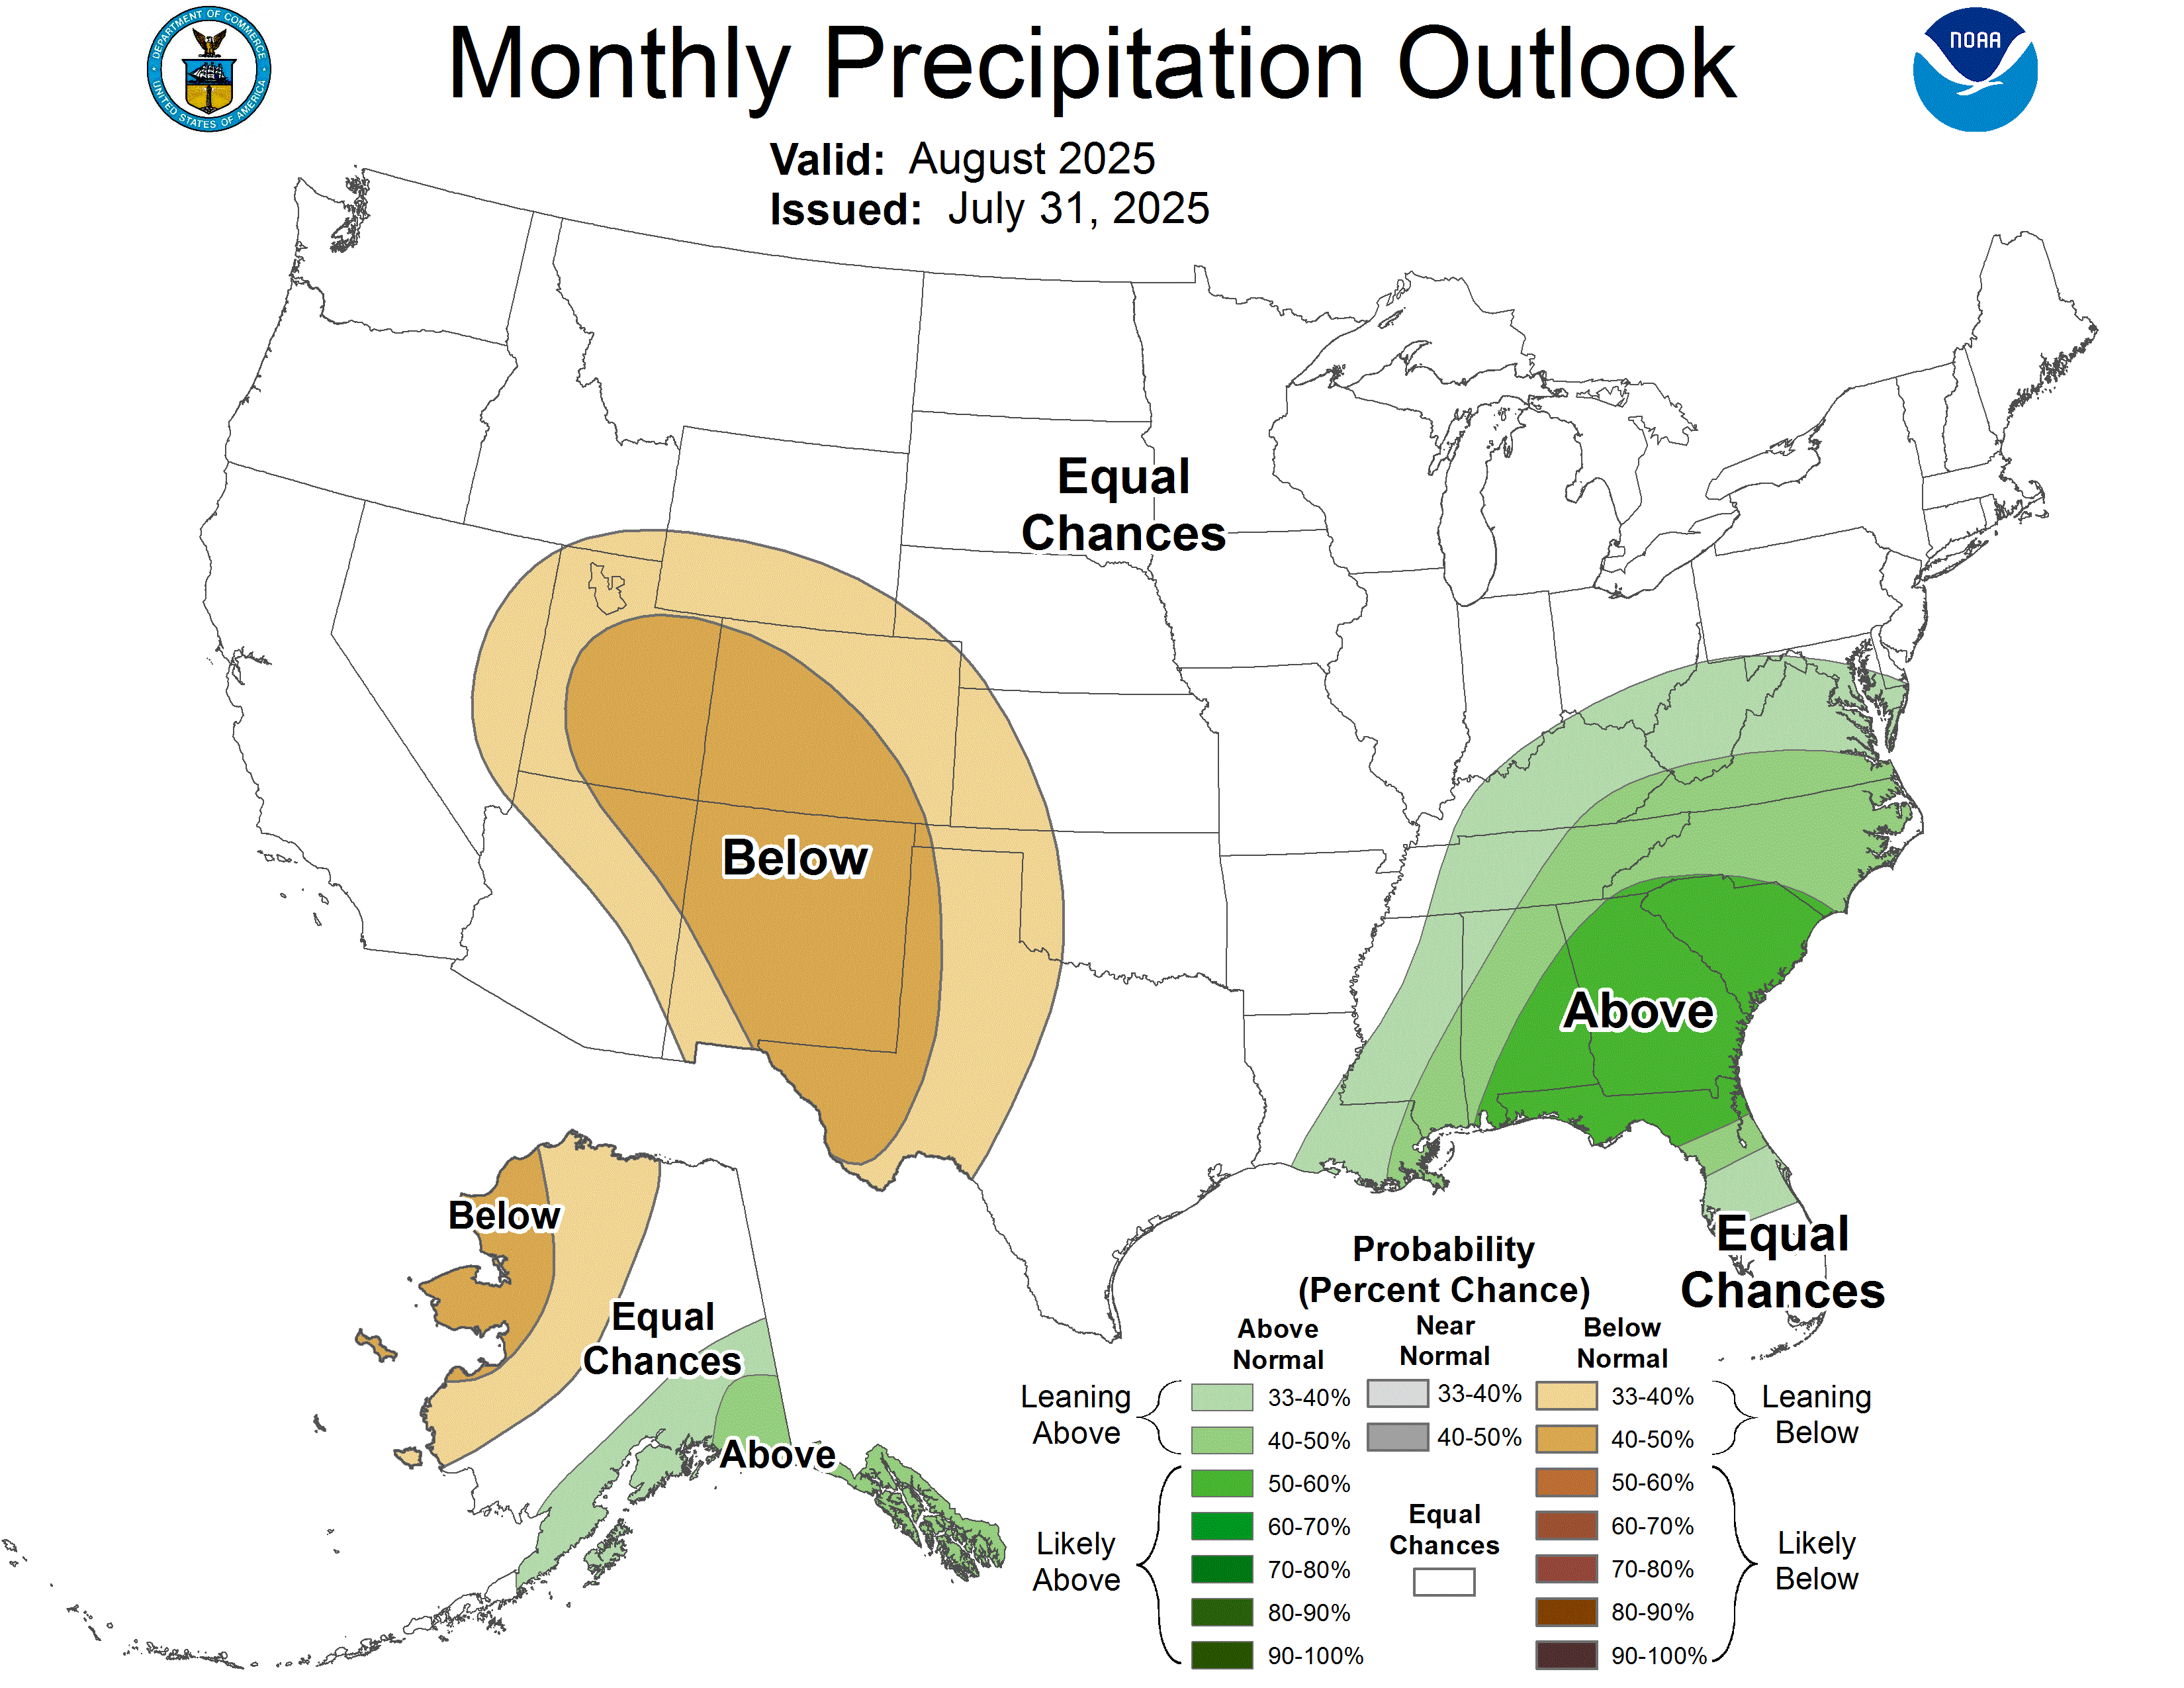
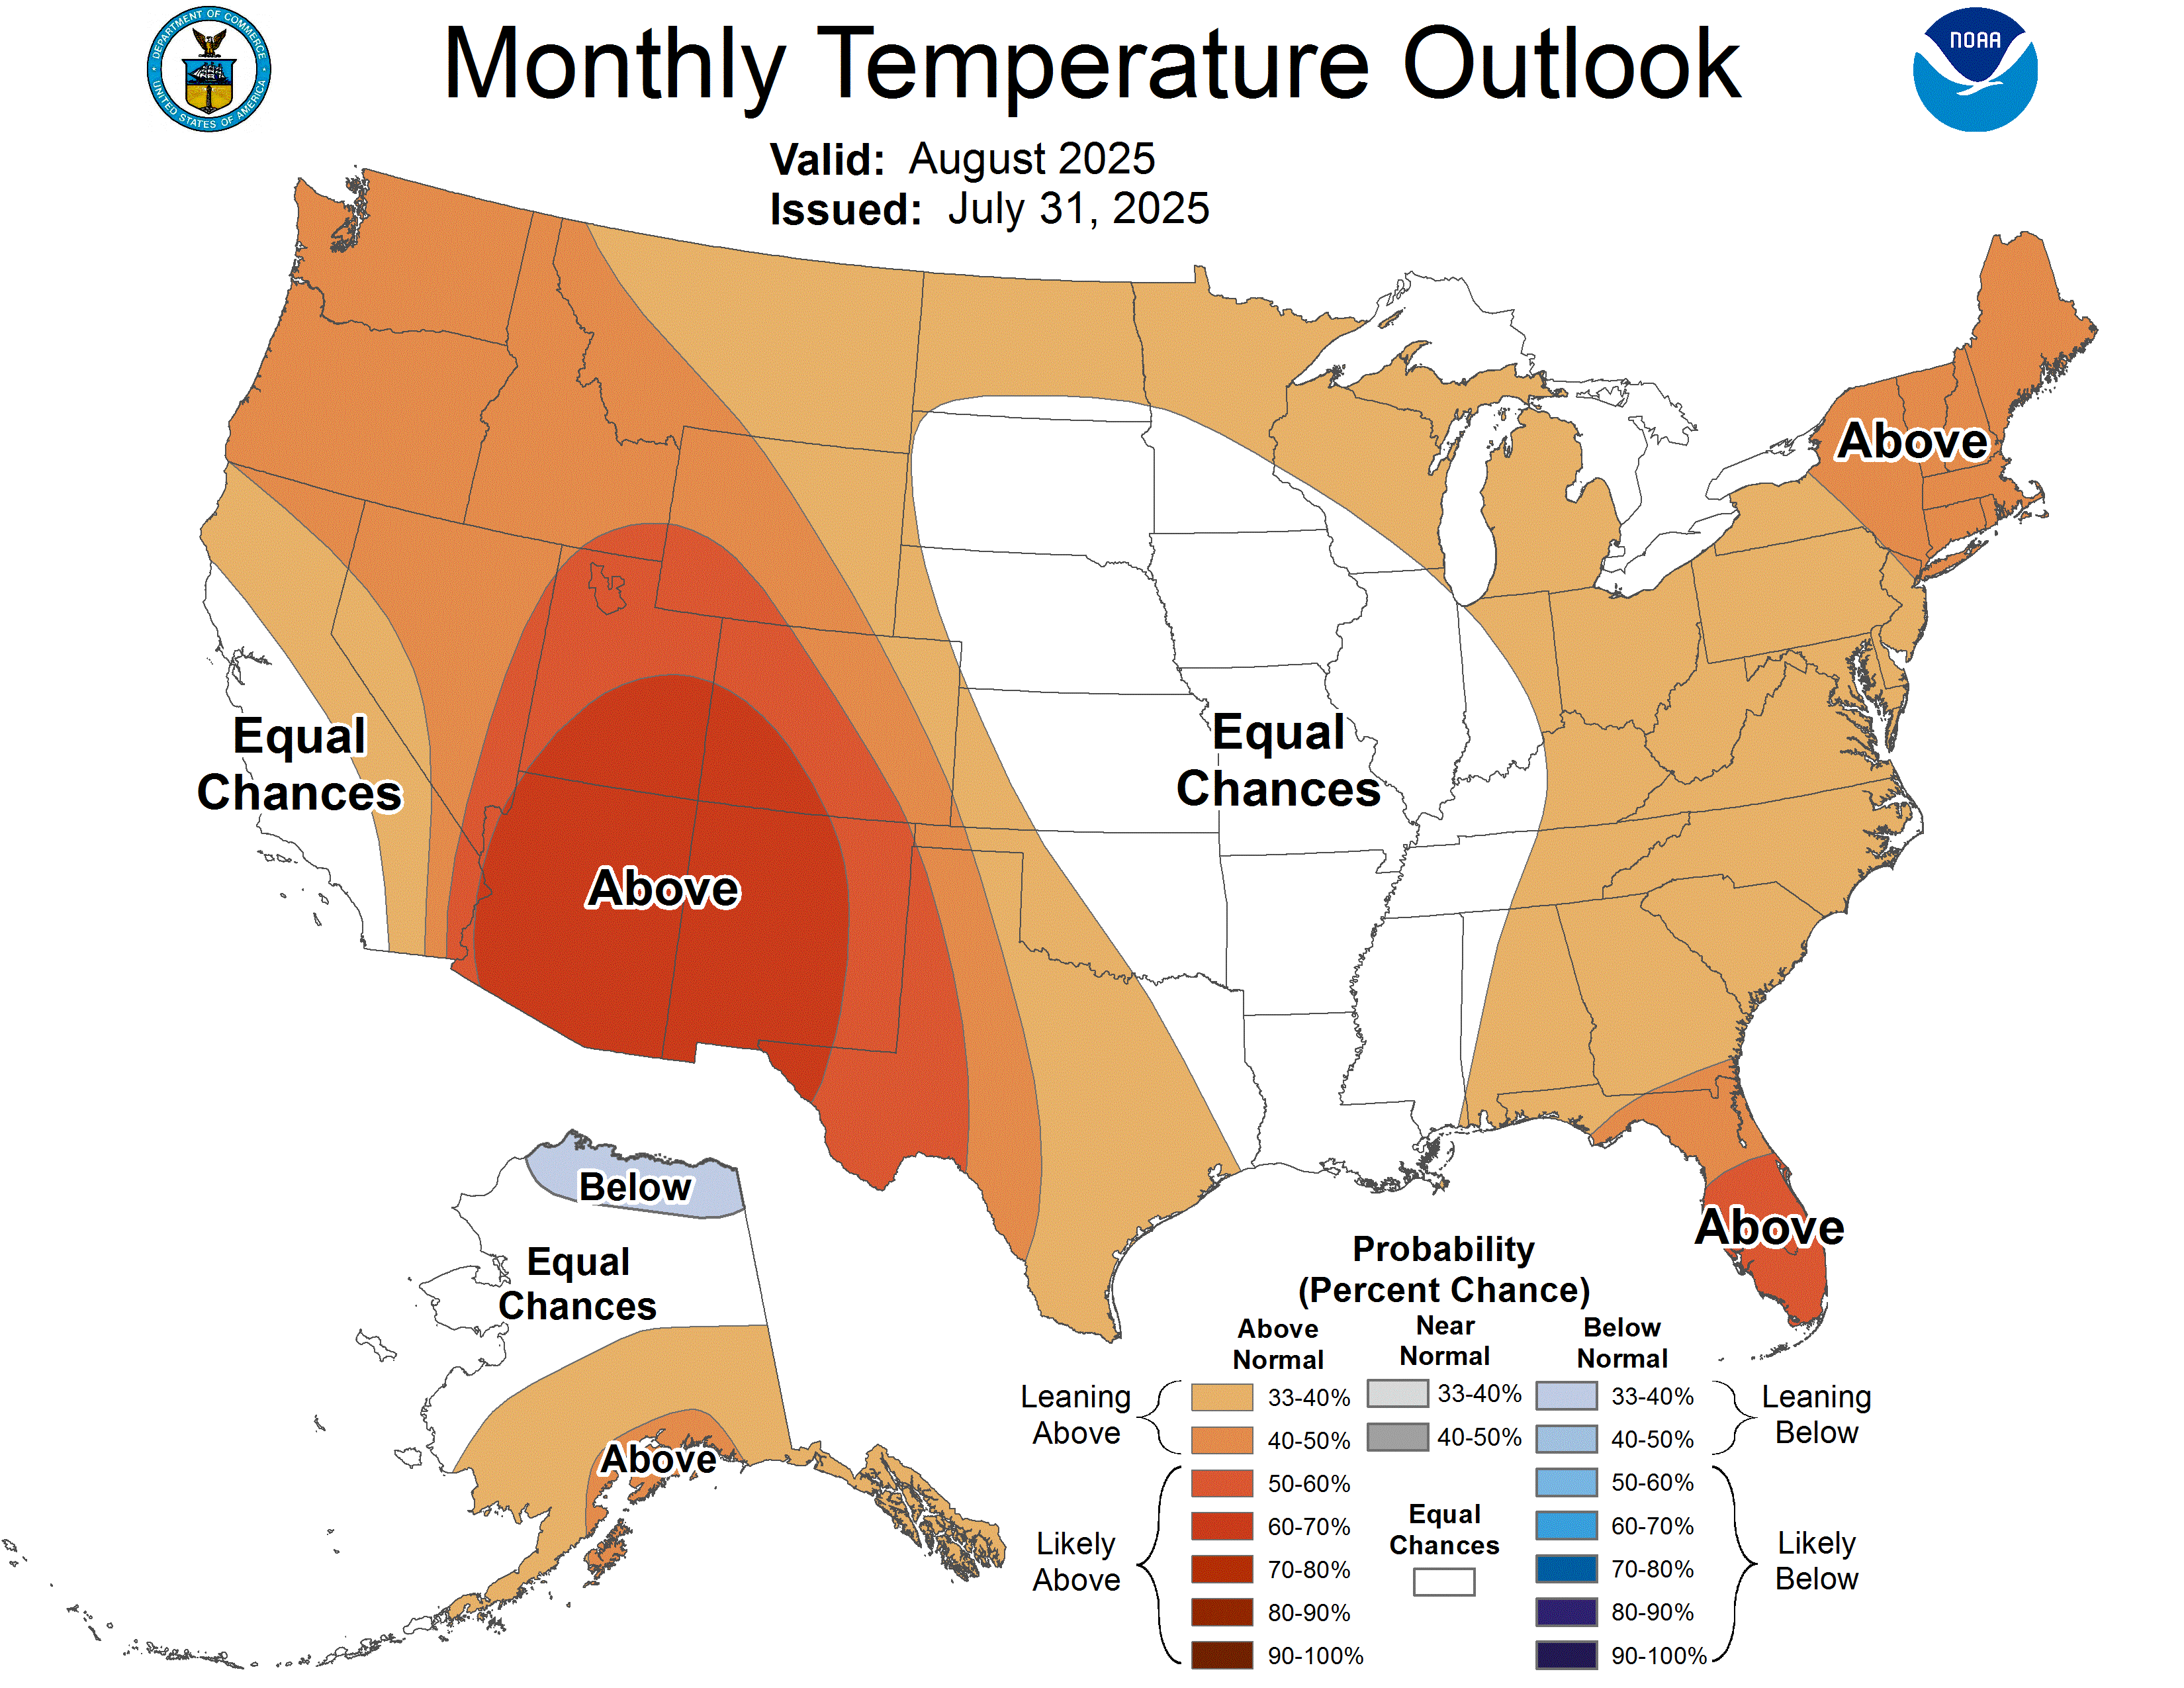
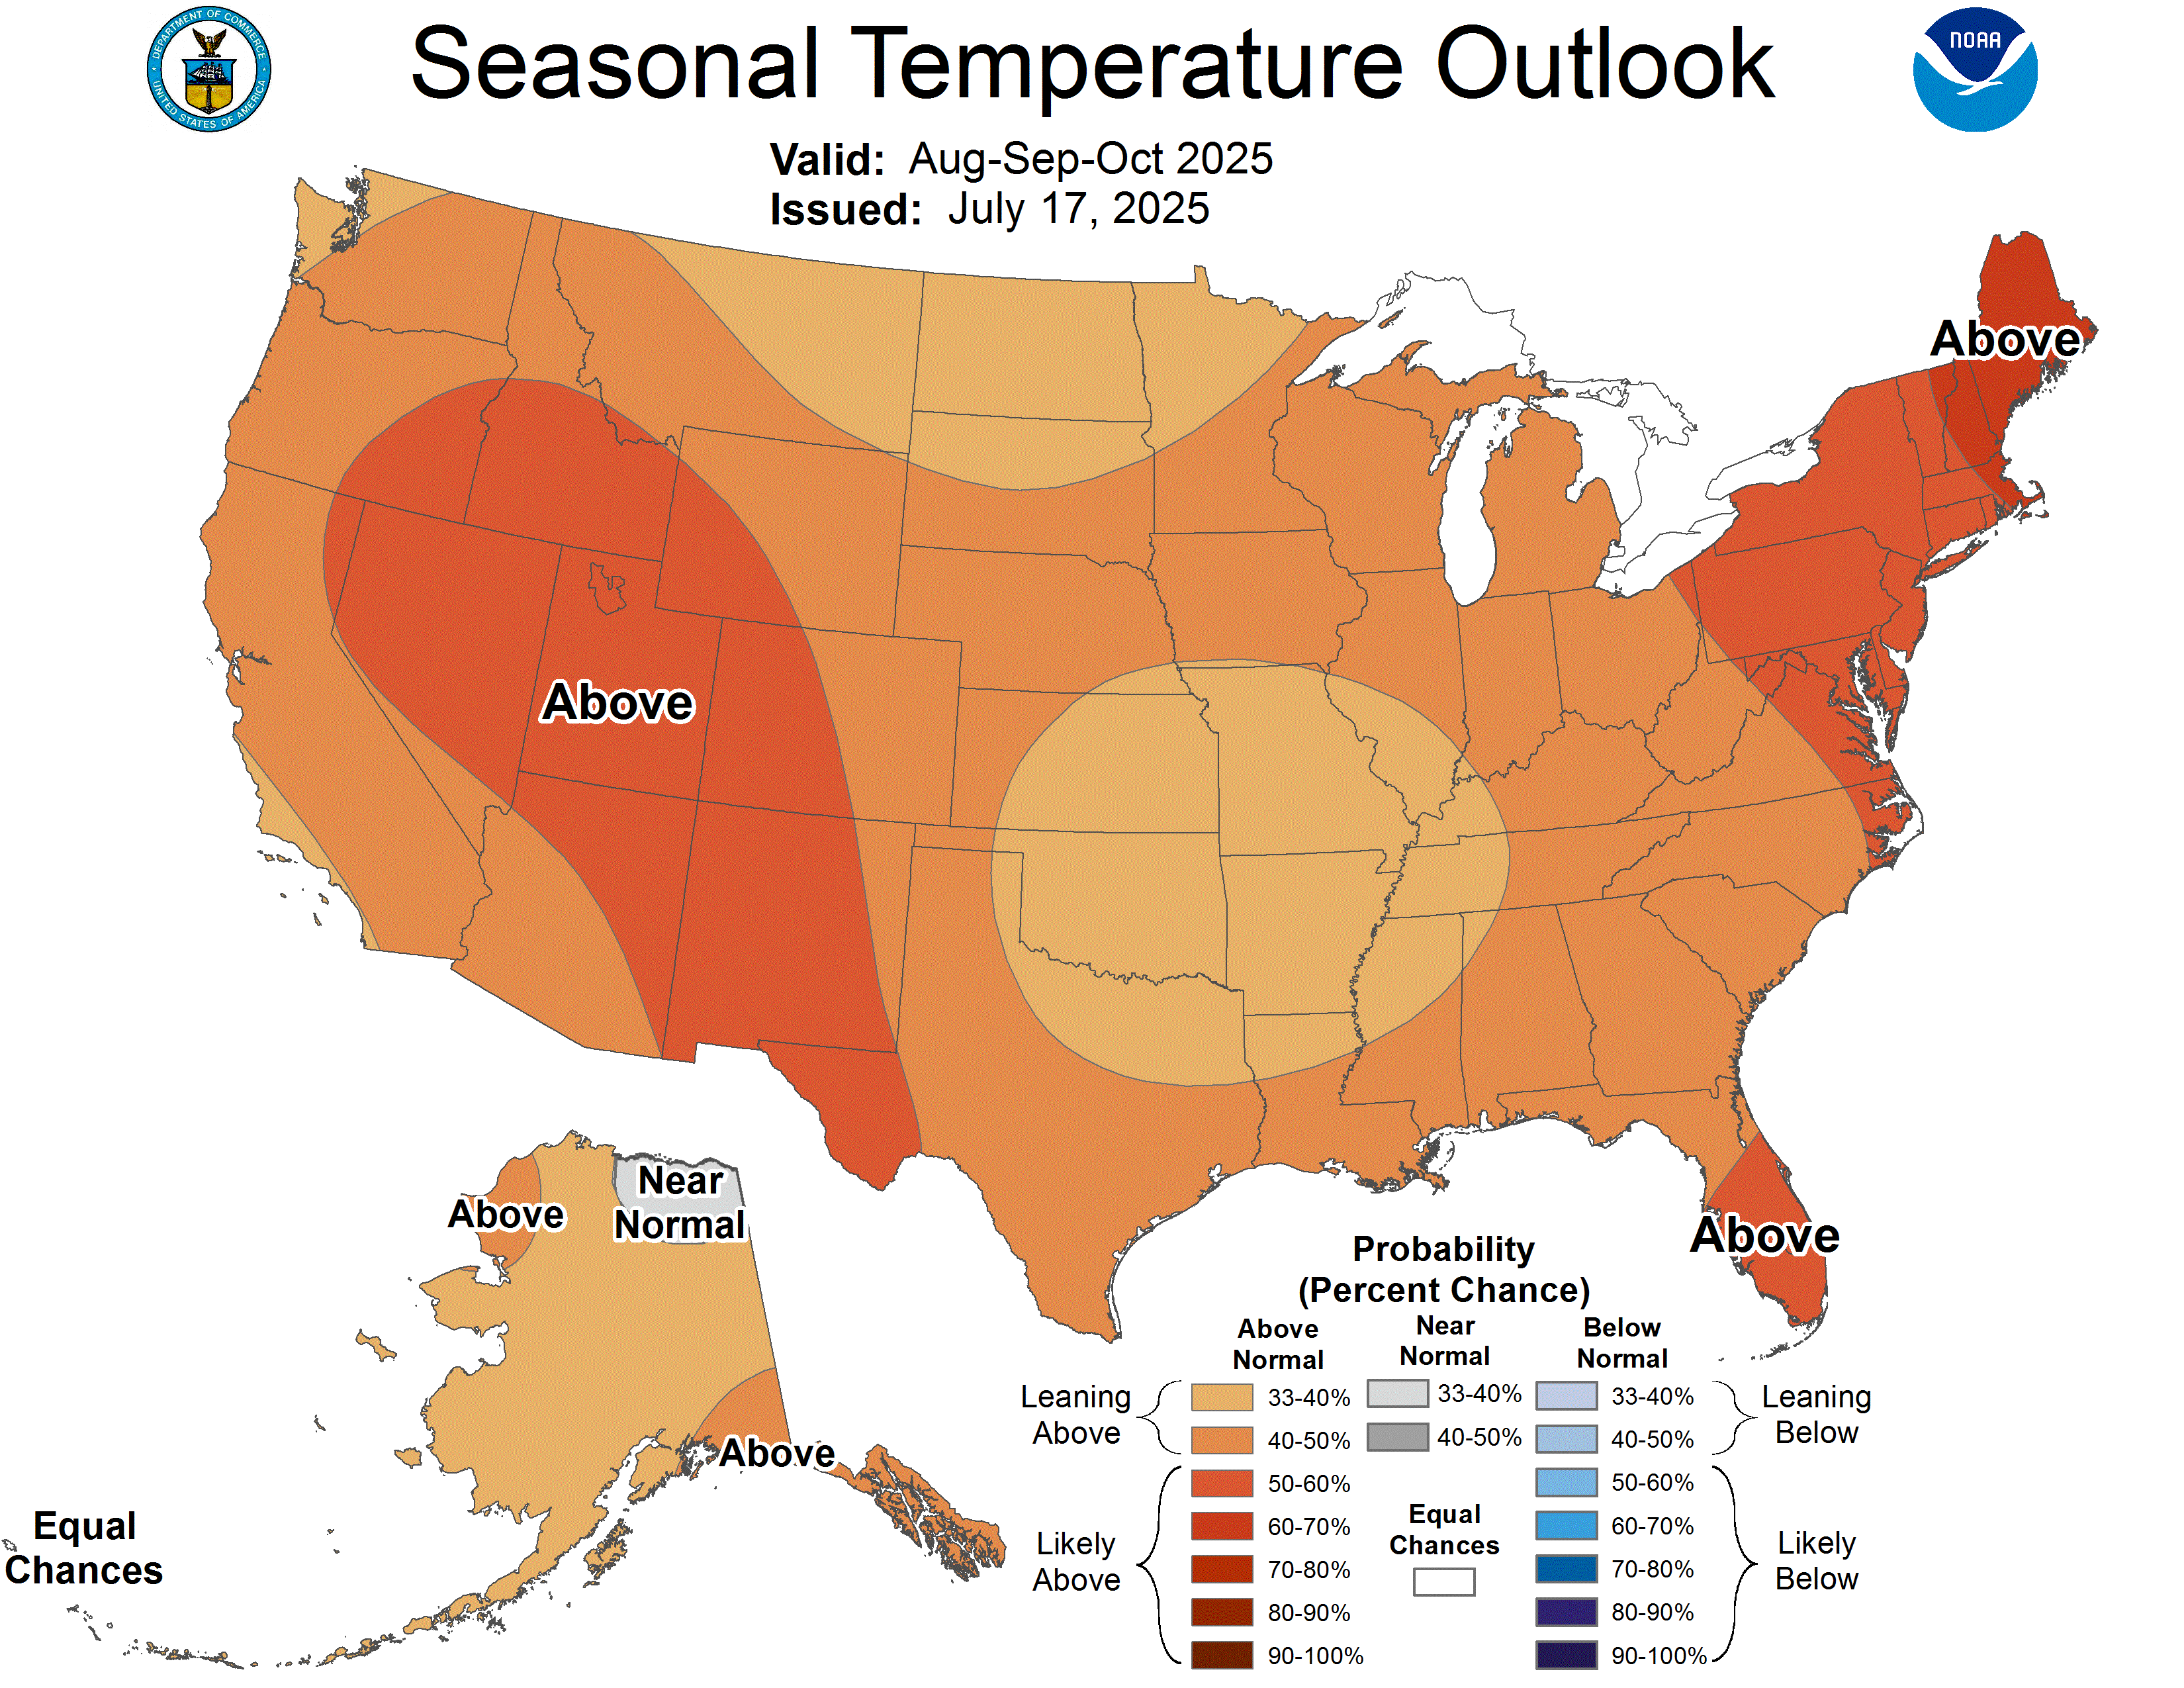
Might fortunes soon be reversed? Not likely in months ahead, said Fleck and his team. They noted this summer’s weak monsoon for most of the upper basin coupled with the seasonal outlook by the National Oceanic and Atmospheric Administration. Together, they point to a warmer and drier than average fall.

“It’s a good bet that this trend will continue at least through winter,” they wrote.

As it stands, levels in Lake Mead, downstream from Powell, will necessitate cuts in the lower-basin as required by several agreements reached between 2007 and 2019. Arizona is to see an 18% cut and Nevada a 7% cut in their annual apportionments. Mexico is to get 5% less than its annual allotment. In acre-feet, that’s 412,000 for Arizona, 21,000 for Nevada, and 80,000 for Mexico.

A new agreement

The big story continues to be what agreements the seven basin states can achieve in recognition of the inadequacy of past agreements given reduced flows.

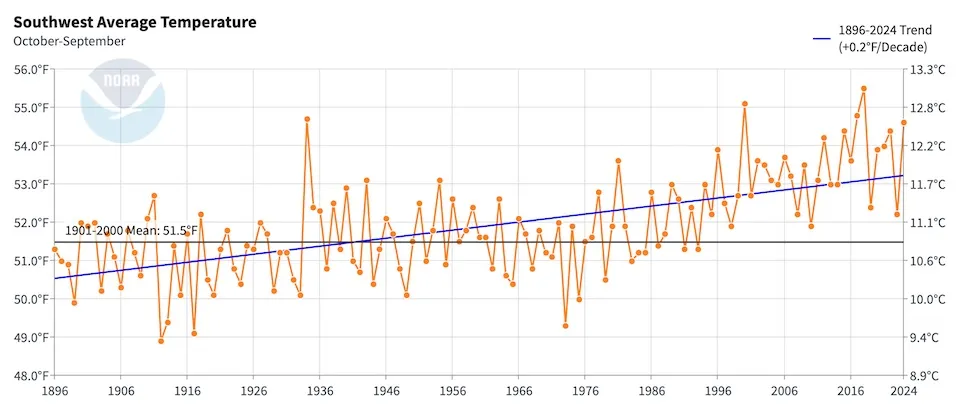
Drought as conventionally understood is part of the story, but only a part. A 2017 study by Jonathan Overpeck and Brad Udall, “The 21st Century Hot Drought and Implications for the Future,”concluded that between a third and a half of reduced flows in the Colorado from 2000 to 2014 could be attributed to the rising greenhouse gas emissions. They spoke about “megadrought,” a word now common in Colorado River discussions, as is “aridification.”

This year has brought more studies that strengthen the evidence. Included is a study published just last week in Nature, that identifies new ways that the warming climate has altered the hydrology of Colorado and other southwestern states.  See: “Why rain and snow skip the Southwest.”

In 2018, an agreement among the states was reached regarding how to deal with drought. It was universally recognized as an interim agreement, with a final agreement to be reached in advance of a 2026 deadline. That deadline is now close at hand.

That impending deadline was alluded to in the comments of the federal officials.

“Health of the Colorado River system and the livelihoods that depend on it are relying on our ability to collaborate effectively and craft forward-thinking solutions that prioritize conservation, efficiency, and resilience,” said Cameron, Interior’s undersecretary, in the Aug. 15 announcement.

In June, Cameron had called on the Colorado River Basin states to submit details of a preliminary operations agreement by mid-November and share a final seven-state proposal by mid-February 2026. The plan would be to reach a final decision in the summer of 2026 with implementation beginning in October 2026.

Non-government organizations issued statements also calling for the states to figure out a way forward.

“This is not just a crisis. It’s also a call to action to use remaining time wisely to replace our current, reactive, emergency-based management framework with new, long-term solutions,” said John Berggren, the regional policy manager for Western Resource Advocates. “We can’t litigate our way out — we must collaborate forward.”

For many months, all reports suggested that the four-upper basin states — who speak with one voice in these negotiations — and the three lower-basin states remained far apart. A story on June 27 in the Las Vegas Review Journal described the meetings as “tense” and “deadlocked.”

Wyoming, Utah and New Mexico along with Colorado constitute the upper basin. Arizona, Nevada and California make up the lower basin.

Becky Mitchell, Colorado’s representative in the negotiations, told a forum in Silverthorne covered by Big Pivots in May that hydrologic risk must be shared between the upper basin and the lower-basin states.

The Blue River flowing through Silverthorne just below Dillon Dam in May 2025. Photo/Allen Best

This sore spot has long festered. The Colorado River Compact of 1922 specified that the upper basin states “will not cause the flow of the river at Lee Ferry to be depleted” below an aggregate of 75 million acre-feet for any 10 consecutive years. The location is between Glen Canyon and the Grand Canyon.

But what if the river fails to deliver that much water? Upper basin states have delivered that volume so far, but that’s mostly because Wyoming, in particular, has not developed what was expected 100 yeas ago.

Those who had originally gathered in Santa Fe in 1922 to negotiate the compact had understood drought, but only as a temporary thing. They had no extensive long-term perspective — and chose to ignore what evidence was at hand, according to a 2019 book by Fleck and Kuhn, “Science be Dammed: How Ignoring Inconvenient Science Drained the Colorado River.”

Colorado’s beef and that of other upper-basin states has been that the two big dams on the river provided certainty for the lower-basin states to get water. However, the headwaters states have no certainty. They must live with what Mother Nature provides. They have balked at cutting water use to provide certainty for downstream states. They want the risk shared.

Natural flow proposal

In June came the first public word of what may have been a breakthrough. It is called the “natural flow proposal.” As explained by Tom Buschatzke, the director of Arizona Water Resources, to the Arizona Republic in a story on June 18, the idea is to focus less on who gets what and more on what the river can realistically provide.

“We do have to recognize what the hydrologic risks are to us,” he said after presenting the idea to a committee,” and we have to kind of find an equitable way to share those risks.”

That idea being discussed would employ a rolling three-year average of the natural flow of the river. Natural would be defined as the volume if there were no diversions and impoundments.

Buschatzke — a frequent visitor at the Colorado River forum sponsored by the University of Colorado’s Getches-Wilkinson Center each June — pointed out that the goal would be to spread the pain equitably, not equally. The lower basin would need more water than the upper basin, which has still to develop all the water allocated it in the 1922 compact.

“It is not 50-50,” he told represents at the June 17 meeting. “I won’t try to speculate on what the number might be.”

California uses the most water of any state in the Colorado River Basin, partly for its cities along the Pacific Coast but a substantial amount for agriculture in the Imperial Valley. Photo December 2015/Allen Best

A few weeks later, John Entsminger, Nevada’s representative in interstate talks, similarly was vague about details. “It’s not something where I can tell you what the score is in the third inning: the baseball game is still being played,” he told the Las Vegas Review-Journal. Details remain sparse, he added.

“Everybody’s pretty much accepted that we’ve got to come up with a new formula for dividing the river,” Mark Squillace, an environmental law professor at the University of Colorado, Boulder, told the Las Vegas newspaper. “The devil’s in the details about getting the numbers right.”

According to the best information that Big Pivots was able to obtain, there is still no agreement about what the percentage should be, although it is not 50-50.

Mitchell, Colorado’s representative on the Upper Colorado River Commission (and its acting chair), told the Review-Journal that the 2007 guidelines that provide the management map of the river’s operations “are not ustainable, because the water is just not there. It’s not in storage, and it’s not in the river.”

For a late-June story in Politico’s E&E, Mitchell  described the natural flows idea as a math problem. “The concept under discussion is that Powell would release a certain percentage of volume of the average of the last few years of natural flows, as measured at Lee Ferry,” she said.

E&E described a more complex challenge.

“The theory — the premise of sharing the river based on how much water would travel downstream without dams or diversions or other human interventions — is actually a complex mathematical problem, rife with potential pitfalls and technical issues.”

This idea of basing releases from Lake Powell likely would take several years to implement. As such, it would not immediately impact levels in the reservoir.

As for the minimum power pool at Powell, that’s the level at which hydroelectricity can no longer be generated. Some 16 municipal and cooperative electrical utilities in Colorado get power from the dam. Those amounts tend to be smaller, about 5% or less, although important if the utilities are stretching to achieve decarbonization goals.

The greatest value of Glen Canyon is that if the Western grid has a blackout, the grid can be restarted with hydropower from the dam.

And too, the role of Congress

As administrator of the two big dams in the basin and several smaller ones, the federal government must figure out how to manage them consistently with the agreements among the states. It is also the formal administrator among the lower-basin states.

At the conference in Boulder, Cameron clearly said the federal government wants the states to figure out the solution. However, he also said that if the states cannot come to agreement, the federal government, as the administrator of the infrastructure, has authority to set policy, too.

And finally, he mentioned that the whole package may need to go to Congress, as was the case with the Colorado River Compact. It was approved in 1929. (Arizona had refused to endorse the compact until much later).

Map of the Colorado River drainage basin, created using USGS data. By Shannon1 Creative Commons Attribution-Share Alike 4.0

Why winter rains keep skipping the Southwest U.S. — Bob Henson (YaleClimateConnections.org) #ActOnClimate

Lake Powell at Wahweap Marina as seen in December 2021. Dwindling streamflows and falling reservoir levels have made it more likely that what some experts call a Colorado River Compact “tripwire” will be hit in 2027. Credit: Heather Sackett/Aspen Journalism

Click the link to read the article on the Yale Climate Connections website (Bob Henson):

August 13, 2025

Climate change appears to have driven an ongoing 25-year shortfall in winter rains and mountain snows across the U.S. Southwest, worsening a regional water crisis that’s also related to hotter temperatures and growing demand. Multiple studies now suggest that human-caused climate change is boosting an atmospheric pattern in the North Pacific that favors unusually low winter precipitation across the Southwest. 

This weather pattern – known to scientists as a negative mode of the Pacific Decadal Oscillation, or PDO – is one phase of a slow-moving swing between warm and cool temperatures in the northeast and tropical Pacific Ocean. The PDO’s monthly value for July was the lowest in 171 years of data (see Fig. 1 below).

Climate change was already implicated in warming temperatures that pull more moisture from the landscape and shorten periods of mountain snow cover, thus exacerbating the impacts of dry spells. But scientists had previously assumed that the PDO’s variations over decades, which affect the rainfall and snowfall itself, were largely natural.

A study published in Nature on Wednesday, August 13, finds that emissions of climate-warming greenhouse gases and tiny sun-blocking particles called aerosols have driven long-term PDO changes over the last few decades, depriving the Southwest of much-needed winter rain and snow.

Using new techniques to extract signal from noise in model output, the researchers found that “observed PDO impacts – including the ongoing multidecadal drought in the western United States – can be largely attributed to human activity.” [ed. emphasis mine}

Figure 1. Monthly variations in the Pacific Decadal Oscillation from 1854 to present. Most months since 1998 have registered negative PDO values. Last month’s reading of -4.00 (July 2025) was the lowest value in the entire 171-year dataset, and the current stretch of 67 consecutive months of negative PDO values is the longest on record. (Image credit: NOAA/NCEI)

For the past quarter-century, precipitation across the Southwest has been on par with the driest periods in modern history. As the landscape dries, sunshine is able to warm it more effectively, helping boost temperatures even more and worsening the drying effects on the rivers, reservoirs, and landscapes crucial for the Southwest’s growing population.

Until now, those temperature effects were believed to be the main human-caused climate factor in the mix.

But scientists looked more closely at the PDO in part because of its relationship to a better-known pattern, the El Niño and La Niña oscillations in the tropical Pacific that influence weather across the world. Shorter-term La Niña events, lasting 1 to 3 years, are more common and can be stronger when the longer-term PDO phase is negative, and both of these patterns strongly favor drier-than-usual winters across the Southwest. 

During the last 25 years, La Niña has been in place for 12 winters versus just eight winters for El Niño, a tilt that has helped to reduce winter precipitation in the Southwest. The latest outlook from NOAA predicts a near-even chance of La Niña conditions yet again in 2025-26.

Figure 2. La Niña causes the jet stream to move northward and to weaken over the eastern Pacific. During La Niña winters, the Southwest tends to see warmer and drier conditions than usual. Since La Niña conditions are more common during the negative phase of the Pacific Decadal Oscillation, a negative PDO is likewise associated with warmer, drier conditions across the Southwest. (Image credit: NOAA)

The Southwest’s largest two reservoirs, Lake Powell and Lake Mead, were both running at less than a third of capacity as of August 3, and total inflow for the water year ending this summer was expected to be only about 50% of average.

In recent years, the Southwest’s normally scorching heat has intensified to levels that are smashing record after record. On August 7, Phoenix reached 118 degrees Fahrenheit, the highest reading ever observed there so late in any summer in data going back 130 years.

Experts in the Phoenix area have documented a major spike in heat mortality over the past decade, as population and vulnerabilities increase along with the heat itself. More than a thousand heat-related deaths were recorded in 2023 and 2024 alone. 

"Phoenix is experiencing record-breaking, prolonged extreme heat driven by climate change, pushing the city into uncharted territory with growing risks to health, infrastructure, and daily life." via weather.com/news/climate…

Zack Labe (@zacklabe.com) 2025-08-06T00:32:34.816Z

Even more disconcerting is what the new work suggests for the Southwest going forward. The Nature study warns that as long as human-produced greenhouse gases and aerosols continue to produce these effects, “the PDO will remain persistent in its negative state, driving continued precipitation deficits in the western U.S.”

Confounding expectations

The puzzling behavior of the Pacific over the last several decades has drawn increasing scrutiny, especially since it’s long been expected that 21st-century warming would lead to an El Niño-like pattern. Instead, the Pacific has behaved in the opposite fashion. It’s been unclear why model projections of the PDO have been off track for so long.

“I don’t think we’ve untangled all this yet, but I think this opens up new possibilities for what models are missing,” said Jeremy Klavans of the University of Colorado Boulder, lead author of the Nature paper.

Read: A mystery in the Pacific is complicating climate projections

Figure 3. A schematic showing where sea surface temperatures are generally above and below average during the positive (warm) phase of the Pacific Decadal Oscillation. The “warm” refers to the horseshoe-like arc of warmer-than-average readings from the Gulf of Alaska along the west coast of North America and into the eastern tropical Pacific, where it often coincides with an El Niño event. Since 2000, most years have featured the opposite pattern, with the horseshoe in blue instead of red and the eastern Pacific often in a La Niña mode. (Image credit: Adapted by NOAA Climate.gov from original by Matt Newman based on NOAA ERSSTv4 data.)

Figure 2. La Niña causes the jet stream to move northward and to weaken over the eastern Pacific. During La Niña winters, the Southwest tends to see warmer and drier conditions than usual. Since La Niña conditions are more common during the negative phase of the Pacific Decadal Oscillation, a negative PDO is likewise associated with warmer, drier conditions across the Southwest. (Image credit: NOAA)

Plucking the signal of climate change out of decades of noise

The large year-to-year and decade-to-decade variability in the PDO makes it hard to detect subtle but important longer-term trends. Moreover, climate models tend to exaggerate the peaks and valleys in the PDO’s natural variability. 

Scientists increasingly study questions like the PDO’s recent behavior using model ensembles – dozens of simulations from the same model for the same period, with tiny variations in the starting-point data that account for inherent uncertainty in models and observations. Klavans and colleagues found that at least 70 simulations were needed in order for a model ensemble to extract the longer-term climate-change influence from the natural variations. Their project ended up drawing on 572 ensemble members from 13 separate models. 

Like a sound mixer at a recording studio boosting an instrument that would otherwise be drowned out, the researchers amped up the strength of the PDO’s longer-term climate change signal while retaining its shorter-term variability. After this adjustment, the models ended up doing a much better job of replicating the recent multi-decade drop in winter precipitation across the Southwest. This finding suggests that the fainter, longer-term signal, obscured until now, is actually a crucial part of what’s happening.

Based on prior work in the Atlantic Ocean, it appears that the climate-change impact on the PDO stems from greenhouse gas increases as well as the global evolution of sun-blocking air pollution over the last few decades.

“We’ve now demonstrated the signal-to-noise problem in both the North Atlantic and North Pacific,” Klavans said. In both cases, the signals of longer-term climate change in atmospheric patterns were getting drowned out by the noise of natural variability. The techniques employed to get around this problem are helping to reveal strengths in model performance that can now be accessed, according to Klavans: “We think this example is just scratching the surface of what models can tell us more broadly about regional climate impacts.” 

The biggest El Niño events can sometimes push the PDO into a positive mode that can persist for years or decades, but the strong El Niño of 2023-24 didn’t accomplish that feat. Next time around, Klavans will be watching intently: “If the eastern equatorial Pacific starts warming, if we get an El Niño-like response, does it flip the PDO?”

More sleuthing bolsters the case

Another recent paper, published last month in Nature Geoscience, reinforces the idea that climate change itself has pushed the Southwest into a lower-precipitation mode since the 1980s. Using a variety of model simulations, the authors show that sun-blocking aerosol emissions appear to have teamed up with the influence of human-produced warming in the tropics to favor persistently high pressure in the North Pacific. In turn, this negative-PDO-like pattern has helped steer wintertime precipitation away from the Southwest. 

Climate scientists refer to these chains of events as “forcings”, meaning that something other than natural variability has driven, or forced, changes to weather and climate. Forcings can be anything from a one-time massive volcanic eruption to decades of sun-blocking pollution or centuries of greenhouse-gas emissions.

“The main takeaway is that there’s this forced signal in historical droughts for the Southwest since 1980, not only in temperature but also in the precipitation changes,” said lead author Yan-Ning Kuo of Cornell University.

There’s been some research suggesting that the long-expected climate-change trend toward El Niño-like patterns in the Pacific could finally emerge later this century as the world continues to warm. But even if that occurs, “it is unlikely to substantially alleviate the currently projected future drought risk,” Kuo and colleagues warn in their new paper.

“For the longest time, we chalked these precipitation changes up to natural variability,” said Cornell’s Flavio Lehner, a co-author on the paper. “I think we’re revisiting that, and it heightens the stakes. If indeed the forcings continue to act in this way, then precipitation decline in the Southwest may continue. It makes a much stronger case for human influenceRead: Wet winter won’t fix Colorado River woes

Clues from 6,000 years ago

Yet another just-published study – this one looking back thousands of years – suggests that a warming planet itself, even without human-added greenhouse gases, can help push the PDO into its drier-in-the-Southwest mode for many years. This paper, also published in Nature Geoscience last month, focuses on the mid-Holocene period, about 6,000 years ago. 

At that point, Earth’s 23,000-year precession cycle (basically a wobble around Earth’s rotation axis) had lined up Northern Hemisphere summer with perihelion, the planet’s closest approach to the Sun. As a result, winters were generally colder and summers warmer than today. Also, the current Sahara Desert had been layered with vegetation for millennia; it would be hundreds of years more before it would start morphing into the arid landscape that “Sahara” brings to mind.

Although the causes were different from today, the climate was relatively warm across the world, making this study period useful for shedding light on what’s happening now, said the study’s lead author, Victoria Todd of the University of Texas at Austin.

When a set of 23 paleoclimate simulations from 17 models replicated this period, they produced a long-lived negative-PDO-like pattern. This matches up with winter precipitation records for the Southwest, inferred from new leaf-wax isotope records from sites in New Mexico and Colorado that extend back 12,000 to 14,000 years. 

“We found that Northern Hemisphere warming in the past, and what we see in the future projections, really does keep the North Pacific in this persistent sea surface temperature pattern that resembles the negative phase of the PDO, and that this drives long-term drought in the Southwest U.S.” Todd said.

Todd and co-authors end their paper with a stark warning that captures the mood of all three recent studies:

“models may be underestimating the severity of future winter precipitation changes and the future risk of drought in the Southwest United States.”

Clara Deser, a senior scientist at the NSF National Center for Atmospheric Research and a longtime researcher on variability and change in the Earth system, is among the coauthors on the papers led by Klavans and Kuo. “I still think there is a role for both natural variability and anthropogenic [human-related] influences on PDO trends over the past 30 years or so,” Deser said. “But the new research (which comes from independent lines of evidence) is pointing to a relatively larger role for the latter compared to the former.”

Dive deeper: What exactly does “drought” mean?

The term “drought” is often used in multiple and overlapping ways that can get confusing. When precipitation is below average for an extended period, that’s meteorological drought. When such a dry period affects soils and crops, it’s agricultural drought, and when it hits water supplies, it’s hydrological drought. More recently, the term ecosystem drought has come into use, referring to more general landscape drying.

The U.S. Southwest has dealt with all of these unwelcome guests over most of the last quarter-century. A number of high-profile studies have classified the period since 2000 as a megadrought, which refers to an intense, multi-decade drought – in this case, an especially stark one in its impacts on the environment and society.

An analysis led by Park Williams (University of California, Los Angeles) deemed the period from 2000 to 2021 as the worst megadrought in at least 1,200 years for a broad region from southern Idaho and Oregon to northwest Mexico.

What about the drought subtypes? Precipitation has fallen persistently short of average in this megadrought period, with 17 out of 25 water years from 1999-2000 to 2024-25 running drier than the 20th-century average. Looking purely at meteorological drought, this has been a prolonged, high-impact event, yet it’s not completely unprecedented. Across the Southwest climate region (Arizona, Colorado, New Mexico, and Utah), total water-year precipitation from 1999-2000 through 2024-25 averaged 13.53 inches, according to NOAA. These values were actually a touch lower during several periods in the mid-20th century, including 13.42 inches from 1942-43 through 1966-67.

Figure 4. Average water-year precipitation (October through September), 1895-96 through 2024-25, for the Southwest region (the Four Corners states of Arizona, Colorado, New Mexico, and Utah). Annual amounts are in green; the running five-year average is in red. The lowest five-year averages occurred in the mid-1950s and the early 2000s. The linear precipitation trend (not shown) is about 0.04 inch per decade, or about 0.52 inch from 1895-96 through 2024-25. (Image credit: NOAA/NCEI)

It’s all too clear what has pushed this dry period into truly historic territory: a warming climate. Distinctly hotter temperatures across the Southwest – rising about 2.6 degrees Fahrenheit over the past 130 years, close to the rate of global-scale warming – have drawn more and more moisture out of the landscape.

Figure 5. Average annual temperatures (October through September), 1895-96 through 2024-25, for the Southwest region (the Four Corners states of Arizona, Colorado, New Mexico, and Utah). (Image credit: NOAA/NCEI)

In their 2022 study noted above, Williams and colleagues based their worst-megadrought designation on soil moisture, reconstructed over the past 1,200 years using proxy data from tree rings, whose width corresponds closely to annual moisture.

We can’t know for sure how much rain or snow fell across these 1,200 years. But Williams and colleagues estimated that without human-caused climate change, “the turn-of-the-twenty-first-century drought would not be on a megadrought trajectory in terms of severity or duration.” Based on model output, they attributed 42% of the 22-year drought (as defined by soil-moisture loss) to climate change. One could imagine that percentage going higher if the most recent PDO-related research above were taken into account.

Jeff Masters contributed to this post.

July 2025 Intermountain West #Climate Briefing — Western Resource Advocates

Click the link to go to the briefing on the Western Resource Advocates website:

August 6, 2025 – CO, UT, WY

In July, regional precipitation was generally below normal, with record-dry conditions throughout much of the region, including western and southeastern Utah and the West Slope of Colorado. Regional temperatures were generally above normal, with much above normal temperatures throughout much of Utah and western Colorado. Regional streamflow was normal to much below normal, with much below normal conditions observed in many river basins throughout each state. As of August 1, Colorado reservoirs are 63% full, Utah reservoirs are 75% full, and Wyoming reservoirs are 72% full. Regional drought coverage in late July was 62%, with extreme drought expanding in western Colorado and developing in Utah. ENSO-neutral conditions are expected to continue through early fall. The NOAA seasonal outlook for August-October suggests an increased probability of below average precipitation and above average temperatures in the region.

Regional July precipitation was below normal for the majority of Utah, western Colorado, and southern Wyoming. Large swaths of 5-25% of normal conditions occurred throughout Utah and western Colorado, and a large pocket of less than 2% of normal conditions occurred in Tooele, Juab, and Millard Counties in western Utah. Smaller pockets of less than 2% of normal precipitation occurred across Utah, including in Washington, Cache, San Juan, and Beaver Counties. Record-dry conditions occurred throughout much of western and southeastern Utah and the West Slope of Colorado, with small pockets scattered throughout Utah, Park and Teton Counties in Wyoming, Jefferson, Arapahoe, and Douglas Counties in the Denver metro, and more. Small pockets of above normal precipitation occurred in northern and southeastern Wyoming, eastern and southern Colorado, and Emery County in Utah. Pockets of 150-200% of normal conditions occurred in Washington County in Colorado and Laramie County in Wyoming, with large swaths across north-central and northeastern Wyoming. Large pockets of 200-400% of normal conditions occurred in several Wyoming counties, particularly in Sheridan, Big Horn, Washakie, and Natrona Counties. One pocket of 400-800% of normal precipitation occurred in Big Horn County in northern Wyoming.

Regional July temperatures were near to above average. In July, temperatures were two degrees above normal for much of the region, except for southern and eastern Colorado and southwestern Utah where temperartures were two degrees below average. In northern Colorado, northern Utah, and western Wyoming, July temperatures were two to four degrees above average. Pockets of four to six degrees above average temperatures were observed in Park County, Wyoming, and between Uintah and Carbon Counties in Utah. July temperatures were in the top 10% of historical observations  throughout much of Utah and Colorado, particularly in northern and eastern Utah and western Colorado, the Front Range and the southwestern half of Wyoming.

July streamflow was below normal throughout the region except for eastern Colorado and eastern Wyoming where average July streamflow conditions were observed. Below to much below normal streamflow conditions were observed throughout  the region, particularly in western Colorado, western Wyoming, and most of Utah. Several USGS stream gauges reported July streamflow conditions in the lowest 3% of all historical observations, including four in Colorado, two in Wyoming, and one in Utah.

As of August 1, Colorado reservoirs are 63% full and at 83% of median capacity, Utah reservoirs are 75% full and at 100% of median capacity, and Wyoming reservoirs are 72% full and at 87% of median capacity. There are many reservoirs with 80% or more of capacity, including Carter Lake, Horsetooth, Lake Granby, and Morrow Point in Colorado, East Canyon, Flaming Gorge, Jordanelle, Scofield, Strawberry, and Utah Lake in Utah, and Alcova, Belle Fourche, Buffalo Bill, Fontenelle, and Jackson Lake in Wyoming. Reservoirs with less than 60% capacity include McPhee, Navajo, and Pueblo in Colorado, Lake Powell and Willard Bay in Utah, and Angostura, Glendo, Keyhole, Pathfinder, and Seminoe in Wyoming.

On July 29, moderate (D1) drought conditions covered 62% of the region, nearly unchanged since July 1. Severe (D2) drought expanded by 8% in Colorado, 16% in Utah, and 19% in Wyoming. Extreme (D3) drought expanded by 4% on the West Slope of Colorado, developed in Utah to 2% coverage, and remains at 0% in Wyoming.

ENSO-neutral conditions continued in July, and ENSO-neutral conditions are favored through the rest of the summer with chances exceeding 50% through early fall. The NOAA monthly outlook for August suggests an increased probability of below average precipitation in Colorado, Utah, and southern Wyoming, and above average temperatures throughout the region, particularly in southern Utah and southwestern Colorado. The NOAA seasonal outlook for August-October suggests an increased probability of below average precipitation throughout the region, particularly in eastern Wyoming and northern Colorado, and above average temperatures throughout the region, particularly in Utah, western Colorado, and southwestern Wyoming.

Significant weather event: Large wildfire in Utah. The Monroe Canyon Fire began on July 13, 2025, near Richfield in Sevier County, Utah, and is currently the largest active wildfire in Utah. As of August 6, it has burned approximately 64,957 acres and is 15% contained. The cause remains undetermined. However, Utah Governor Spencer Cox said 72% of this year’s Utah wildfires were human-caused. During a press briefing on August 1, Governor Cox said, “I haven’t begged in a long time. I’m begging people right now to please exercise extreme caution.” Governor Cox declared a 30-day state of emergency to mobilize resources and protect lives, property, livestock, drinking water supplies, and critical infrastructure. On August 3, fire crews were able to gain some control amid lower temperatures and milder winds and have since made progress in containment efforts along Highway 24 and in areas like Elk Country, Bagley Ranch, and Manning Meadows. Some evacuation orders have been lifted, but officials continue to urge caution due to the ongoing fire danger. The fire is under red flag conditions that are predicted to remain at least until the end of the week, with high temperatures, low humidity, strong winds, and critically dry fuels contributing to these conditions. These challenges follow record-low snowpack in the mountains near the fire. Additionally, several thunderstorms are expected to pass through the area later in the week, but unfortunately, they will not bring moisture with them.