
Click the link to read the article on the Center for Colorado River Studies website (Jack Schmidt):
In Brief
Unusually wet conditions in the Basin in October and November 2025, combined with reduced releases from some reservoirs, led to a basin-wide increase in storage for the two-month period. The combined contents of Lake Powell and Lake Mead increased during the two months for only the second time since 2010, and storage in the San Juan River basin increased by 19%, especially in Vallecito and Navajo Reservoirs. These changes were a welcome respite from the relentless depletion of storage that has dominated the last few years. Nevertheless, the upcoming winter snow season is predicted to be below average, and total active storage in the Basin is less than a 2 year supply when compared with recent Basin-wide consumptive uses and losses.
The Details
The rains of October and November 2025 slowed depletion of the Colorado River’s reservoirs due to increases in stream flow and reduced reservoir releases in some places. Water levels rose in a few reservoirs, and autumn’s rains provided a small bit of flexibility for water managers at the beginning of what is likely to be a below-average winter snow season.
As of November 30, the Basin’s 46 reservoirs held 24.63 million af (acre feet) of active storage[1], of which 90% was in 12 federal reservoirs,[2] including 15.00 million af in Lake Powell and Lake Mead (hereafter, Powell+Mead) and 4.88 million af in 8 federal reservoirs upstream from Lake Powell (Fig.1). This amount of storage is similar to conditions in early 2022, a situation that was described at that time as a crisis. If we divide the total active storage in the Basin’s 46 reservoirs by the basin-wide total annual rate of consumptive use and loss that was 12.7 million af in 2024, the basin-wide reservoir water supply would sustain Basin-wide use for less than 2 years. We continue to live at the doorstep of crisis.

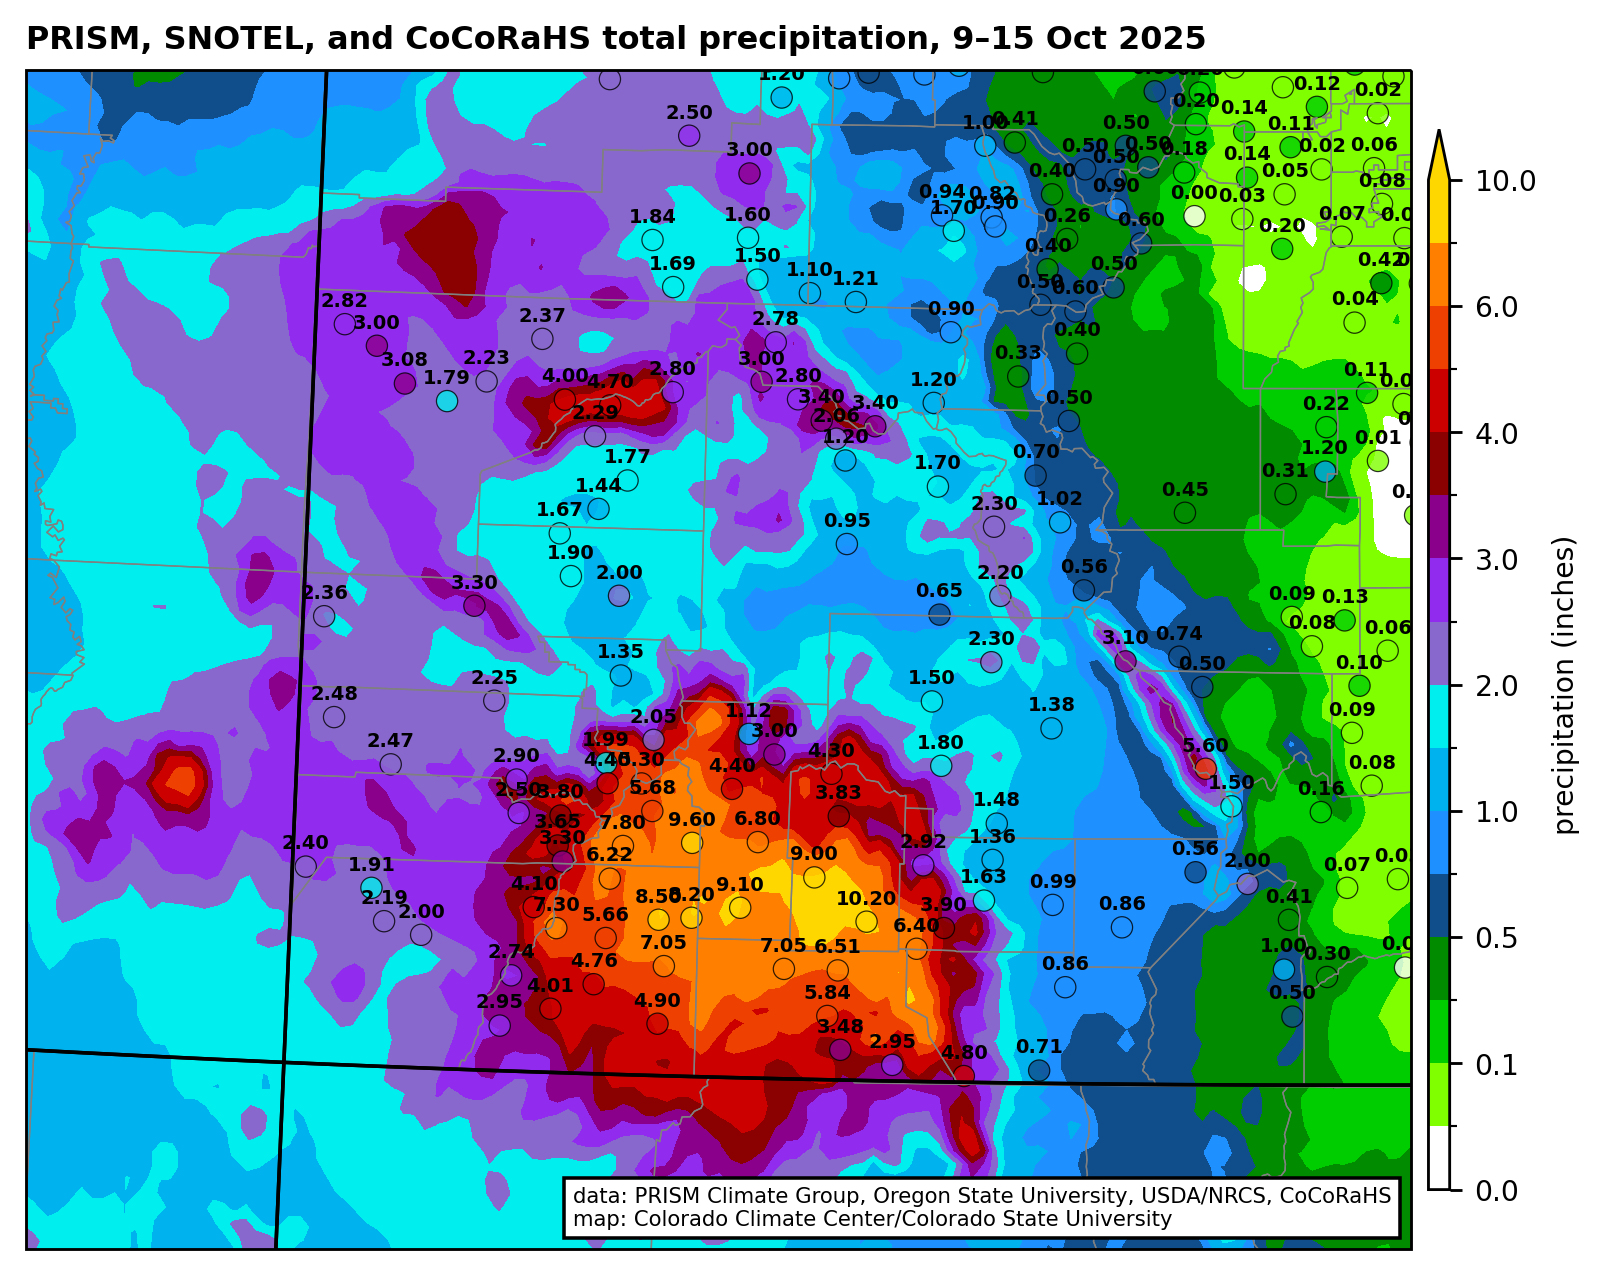
Basin-wide reservoir storage stabilized in October and November, because Powell+Mead storage stabilized and storage in the San Juan River basin increased. Total Inflow to Lake Powell exceeded releases for more than one week between October 11 and October 18, when Lake Powell increased by 105,000 af[3] which is a 1.6% gain (Fig. 2). Approximately 40% of the total inflow came from the San Juan River, and the monthly October inflows were the largest since 2015. The gain in storage in Lake Powell during this weeklong period exceeded depletions during the rest of the month, and Lake Powell gained approximately 52,000 af during the month. Lake Powell lost 147,000 af in November.
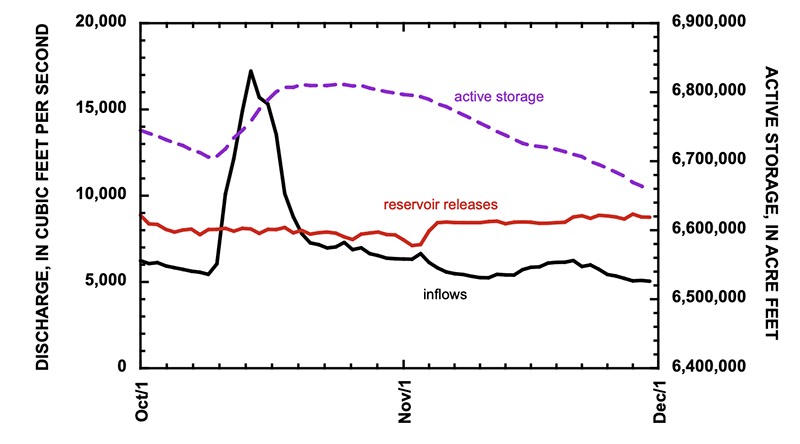
In contrast, the autumn rains did not significantly increase inflow to Lake Mead, because most of the inflows come from scheduled releases from Lake Powell. These reservoir releases were supplemented by 101,000 af of inflows downstream from Lees Ferry[4] and 8000 af from the Virgin River.[5] The most significant changes in Lake Mead occurred at the end of November when releases from Hoover Dam were significantly reduced (Fig. 3).

Together, total active storage in Powell+Mead increased by 63,000 af during October,[6] and decreased by only 38,000 af in November (Fig. 4).[7] More significant than the gains, however, was that the the pace of reservoir depletion was significantly slowed. Storage in Powell+Mead increased by approximately 25,000 af in October and November, only the second time since 2010 that total storage in these two reservoirs increased during these two months.[8]

Reservoir storage in the San Juan River basin increased more than in any other part of the Colorado River Basin. Five San Juan basin reservoirs increased by 197,000 af in October and November, mostly in Navajo and Vallecito Reservoirs.[9] Not much happened elsewhere, however. The 21 reservoirs of the upper Colorado River watershed lost 57,000 af during October and November, and 16 reservoirs in the Green River watershed lost 10,000 af during the same period.
- [1] Active storage in 46 reservoirs are reported by Reclamation at https://www.usbr.gov/uc/water/hydrodata/reservoir_data/site_map.html.
- [2] Taylor Park, Blue Mesa, Morrow Point, Crystal, Fontenelle, Flaming Gorge, Vallecito, Navajo, Lake Powell, Lake Mead, Lake Mohave, and Lake Havasu.
- [3] Inflow to Lake Powell was computed as the sum of mean daily discharge of the Colorado River at Gypsum Canyon near Hite (gage 09328960), Dirty Devil River above Poison Springs near Hanksville (09333500), Escalante River near Escalante (09337500), and San Juan River near Bluff (09379500), as reported by the U.S. Geological Survey. Outflow from Lake Powell was computed as the mean daily discharge of the Colorado River at Lees Ferry (09380000), because stream flow is measured 15 miles downstream from the dam and includes ground-water seepage around the dam. Lake Powell storage increased between October 10 and October 20, as reported by Reclamation.
- [4] Inflows within Grand Canyon were calculated as the difference between measurements of the Colorado River at Lees Ferry (09380000), Colorado River above Diamond Creek near Peach Springs (09420000), and Diamond Creek nr Peach Springs (09404208).
- [5] Virgin River below confluence Muddy River near Overton (09419530)
- [6] Between October 1 and November 1, 2025, active storage in Lake Powell increased 52,000 af and 11,000 af in Lake Mead.
- [7] Between November 1 and November 30, active storage in Lake Powell decreased by 147,000 af and increased by 109,000 af in Lake Mead.
- [8] During the previous 15 years between 2010 and 2024, total storage in Powell+Mead increased by 36,000 af in 2011. During the other 14 years of that period, the median depletion of Powell+Mead was 436,000 af.
- [9] Storage in Navajo Reservoir increased 126,000 af between October 9 and November 8 and increased by 114,000 af in October and November. Active storage in Vallecito Reservoir gained 68,000 af in October and November. At the end of November, Navajo Reservoir was 60% of its 1.65 million af capacity. Vallecito Reservoir was 77% of its 125,400 af capacity.
